EFFECTS OF MICROBIAL PHYTASE ON THE STANDARDIZED … · DIGESTIBILITY OF PHOSPHORUS IN SOYBEAN...
118
EFFECTS OF MICROBIAL PHYTASE ON THE STANDARDIZED TOTAL TRACT DIGESTIBILITY OF PHOSPHORUS IN SOYBEAN MEAL, CORN, AND CORN CO- PRODUCTS BY FERDINANDO NIELSEN DE ALMEIDA THESIS Submitted in partial fulfillment of the requirements for the degree of Master of Science in Animal Sciences in the Graduate College of the University of Illinois at Urbana-Champaign, 2010 Urbana, Illinois Advisor: Professor Hans Henrik Stein
Transcript of EFFECTS OF MICROBIAL PHYTASE ON THE STANDARDIZED … · DIGESTIBILITY OF PHOSPHORUS IN SOYBEAN...

EFFECTS OF MICROBIAL PHYTASE ON THE STANDARDIZED TOTAL TRACT
DIGESTIBILITY OF PHOSPHORUS IN SOYBEAN MEAL, CORN, AND CORN CO-
PRODUCTS
BY
FERDINANDO NIELSEN DE ALMEIDA
THESIS
Submitted in partial fulfillment of the requirements
for the degree of Master of Science in Animal Sciences
in the Graduate College of the
University of Illinois at Urbana-Champaign, 2010
Urbana, Illinois
Advisor:
Professor Hans Henrik Stein

ii
ABSTRACT
Six experiments were conducted to investigate the effects of microbial phytase on the
standardized total tract digestibility (STTD) of P in soybean meal (SBM), corn, and corn co-
products. The objective of Exp. 1 was to measure the STTD of P in SBM, corn, and distillers
dried grains with solubles (DDGS) without and with the addition of microbial phytase (Optiphos
2000, Enzyvia, Sheridan, IN). Two SBM based diets, 2 corn based diets, and 2 DDGS based
diets were formulated to contain microbial phytase at a level of 0 or 500 phytase units (FTU) per
kg. Soybean meal, corn, and DDGS were the only sources of P in the diets. A P-free diet was
also formulated to measure the basal endogenous P losses (EPL) from pigs. Addition of phytase
improved (P < 0.01) the STTD of P in SBM and corn, but did not improve the STTD of P in
DDGS. Values measured for the STTD of P in Exp. 1 were used to formulate diets that were
used in Exp. 2 and 3. The objectives of Exp. 2 and 3 were to test the hypothesis that pigs fed
diets that are equal in STTD of P will perform equally well regardless of the concentration of
total P in the diets, and that the addition of microbial phytase, DDGS, or a combination of
phytase and DDGS will result in a reduction in P excretion. Four corn-SBM based diets were
formulated and used in a 2 × 2 factorial design with 2 levels of phytase (0 or 500 FTU/kg) and 2
levels of DDGS (0 or 20%). All diets contained 0.32% STTD P according to the STTD values
that were measured in Exp. 1. Experiment 2 was a growth performance study. Results showed
that inclusion of phytase to the diet containing no DDGS tended (P < 0.10) to decrease G:F, but
inclusion of 20% DDGS to the diets tended (P < 0.10) to increase ADG, ADFI, and final BW.
Experiment 3 was a P balance study in which the 4 diets from Exp. 2 were used. Phytase and
DDGS increased (P < 0.01) the apparent total tract digestibility (ATTD) of P in the diets.
Absorption of P was greater (P < 0.05) for pigs fed corn-SBM-DDGS diets than for pigs fed

iii
corn-SBM diets, and phytase, DDGS, or the combination of phytase and DDGS, reduced (P <
0.01) P excretion. In Exp. 4 and 5, the objectives were to test the effect of a novel bacterial 6-
phytase expressed in a strain of Aspergillus oryzae (Ronozyme HiPhos, DSM Nutritional
Products, Parsippany, NJ) on the ATTD of P in corn-SBM diets fed to weanling and growing
pigs, and to estimate the minimum level of phytase needed to maximize the ATTD of P. For both
experiments, 6 diets were formulated (positive control, negative control, and negative control + 4
levels of microbial phytase). Addition of phytase to the diets increased (linear and quadratic, P <
0.01) the ATTD of P in corn-SBM diets fed to both weanling and growing pigs. For weanling
pigs the breakpoint for ATTD of P (68.4%) was reached at a phytase inclusion level of 1,016
FTU/kg, whereas for growing pigs the breakpoint for the ATTD of P (69.1%) was reached at a
phytase inclusion level of 801 FTU/kg. In Exp. 6, the objectives were to measure the effects of
graded levels of microbial phytase on the STTD of P in corn, DDGS, high protein distillers dried
grains (HP-DDG), and corn germ, and to develop regression equations to predict the response of
adding phytase to each of these ingredients. Four corn based diets, 4 DDGS based diets, 4 HP-
DDG based diets, and 4 corn germ based diets were formulated to contain 0, 500, 1,000, or 1,500
FTU/kg (Optiphos 2000, Enzyvia, Sheridan, IN) within each ingredient. A P-free diet was also
formulated to measure the basal endogenous P losses. Addition of phytase increased (linear, P <
0.01; quadratic, P < 0.05) the STTD of P in corn and HP-DDG, increased (linear and quadratic,
P < 0.01) the STTD of P in corn germ, and tended to increase (linear, P =0.07) the STTD of P in
DDGS. Regression equations for the effect of added microbial phytase on the STTD of P in corn,
HP-DDG, and corn germ were developed, and these equations may be used to predict the STTD
of P in each ingredient when phytase is supplemented to diets that contain these ingredients.
Keywords: digestibility, endogenous losses, phosphorus, phytase, pig

iv
ACKNOWLEDGEMENTS
First and foremost, I am grateful to God, the Creator and the Guardian, and to whom I
owe my very existence and all that I have achieved in my life. Without Him, none of these things
would have been possible. “Great is the LORD, and highly to be praised, and His greatness is
unsearchable. One generation shall praise Your works to another, and shall declare Your mighty
acts.” Psalm 145:3-4.
I am heartily thankful to my advisor, Dr. Hans H. Stein, whose guidance, support,
encouragement, and patience throughout this part of my life enabled me to grow as a scientist,
but most important, as a person. It is an honor for me to have the privilege to work with you.
I want to thank my committee members, Dr. Carl Parsons and Dr. James Pettigrew, for
the many ways you shared your knowledge with me, and for all of your suggestions.
I would like to show my gratitude to my colleagues, Kurtis P. Goebel, Kate L. Horsman,
Dr. Dong Yong Kil, Dr. Beob G. Kim, Sarah Cervantes-Pahm, Grant I. Petersen, Oscar J. Rojas,
Minho Song, and Pedro E. Urriola, who directly contributed to the accomplishment of this thesis.
I am also thankful to all of those who indirectly supported me during this time.
I also thank all of the professors, laboratory personnel, the farm crew, and Rick Keever
for being available and ready to help when I needed it.
I owe my deepest gratitude to my dad Alfeno, to my mom Linei, and to my dear sister
Isis for their love, care, unrestricted support and prayers throughout my life.
To my lovely wife, Juliana A. Soares, I dedicate my love and appreciation for the
wonderful woman that you are. I truly recognize how important you were, especially, during
these past 2 years by sharing your knowledge, your skills, and most important, by your love. This

v
Proverb describes the truth for us today: “He who finds a wife finds what is good and receives
favor from the Lord (18:22)”.
vi
TABLE OF CONTENTS
CHAPTER 1: INTRODUCTION .................................................................................... 1
LITERATURE CITED ....................................................................................................... 3
CHAPTER 2: DETERMINATION OF STANDARDIZED TOTAL TRACT
DIGESTIBILITY OF P IN SWINE FEED INGREDIENTS: LITERATURE REVIEW . 4
INTRODUCTION .............................................................................................................. 4
BIOLOGICAL ROLES OF P IN ANIMALS ..................................................................... 5
DIGESTION, ABSORPTION, AND REGULATION OF P ............................................. 6
PHOSPHORUS REQUIREMENTS ................................................................................... 8
PHOSPHORUS IN FEED INGREDIENTS ....................................................................... 9
AVAILABILITY AND DIGESTIBILITY ....................................................................... 11
PHYTASE......................................................................................................................... 13
CORN CO-PRODUCTS ................................................................................................... 15
CONCLUSIONS............................................................................................................... 16
SCOPE OF THESIS ....................................................................................................... 166
LITERATURE CITED ..................................................................................................... 18
CHAPTER 3: PERFORMANCE AND PHOSPHORUS BALANCE OF PIGS FED
DIETS FORMULATED ON THE BASIS OF VALUES FOR STANDARDIZED TOTAL
TRACT DIGESTIBILITY OF PHOSPHORUS .................................................................. 25
ABSTRACT ...................................................................................................................... 25
INTRODUCTION ............................................................................................................ 26
MATERIALS AND METHODS ...................................................................................... 27
RESULTS ....................................................................................................................... 322

vii
DISCUSSION ................................................................................................................... 34
LITERATURE CITED ..................................................................................................... 40
CHAPTER 4: EFFECTS OF A NOVEL PHYTASE IN CORN-SOYBEAN MEAL
FED TO WEANLING AND GROWING PIGS ................................................................... 58
ABSTRACT ...................................................................................................................... 58
INTRODUCTION ............................................................................................................ 59
MATERIALS AND METHODS ...................................................................................... 60
RESULTS ......................................................................................................................... 64
DISCUSSION ................................................................................................................... 67
LITERATURE CITED ..................................................................................................... 70
CHAPTER 5: EFFECTS OF GRADED LEVELS OF PHYTASE ON APPARENT
AND STANDARDIZED TOTAL TRACT DIGESTIBILITY OF PHOSPHORUS IN
CORN AND CORN CO-PRODUCTS .................................................................................. 89
ABSTRACT ...................................................................................................................... 89
INTRODUCTION ............................................................................................................ 90
MATERIALS AND METHODS ...................................................................................... 91
RESULTS ......................................................................................................................... 94
DISCUSSION ................................................................................................................... 96
LITERATURE CITED .................................................................................................. 100
CHAPTER 6: CONCLUSIONS .................................................................................. 111

1
CHAPTER 1
INTRODUCTION
Swine manure is rich in P because diets fed to pigs are commonly over supplied with P
(Cromwell, 2005) and also because a great portion of P in feed ingredients from plant origin is in
the form of phytic acid (PA), which is hardly digested by pigs (Cromwell, 2005). Land
application of swine manure, therefore, is an issue because of the potential environmental effects
of this practice. Because of these effects, many regulations have been created to limit the amount
of P that can be applied in the field, and this has led the swine industry to find solutions to reduce
P excretion (Cromwell, 2005).
An approach to achieve this objective is the supplementation of diets with exogenous
phytase, which has been effective in improving P digestibility and reducing the excretion of this
mineral in the manure (Guggenbuhl et al., 2007). Another approach is to formulate diets that
precisely meet the requirements of the pigs. Traditionally, diets have been formulated on the
basis of the relative bioavailability of P. Relative bioavailability of P can be calculated using the
slope-ratio technique (Cromwell, 1992), but these values depend on the standard used to
calculate them, and therefore, they are believed not to be additive in mixed diets. Apparent total
tract digestibility (ATTD) of P has been measured in feed ingredients (Bohlke et al., 2005;
Pedersen et al., 2007), but because ATTD values are not corrected for basal endogenous P losses
(EPL), they are also believed not to be additive in mixed diets. To mitigate this problem, basal
EPL can be calculated from pigs fed a P-free diet (Petersen and Stein, 2006) and used to correct
ATTD values resulting in standardized total tract digestibility (STTD) values that are believed to
be additive in mixed diets. The lack of additivity of apparent ileal digestibility values of AA
compared with standardized ileal digestibility values of AA have been demonstrated (Stein et al.,

2
2005). Based on this observation, we believe that values for the STTD of P are also more
additive in mixed diets than values for the ATTD of P. There are, however, no data on the values
for the STTD of P in feed ingredients.
Increasing ethanol production from corn has yielded many co-products that can be used
in diets fed to swine. Distillers dried grains with solubles (DDGS) have greater ATTD of P
compared with corn and, therefore, is a good source of organic P for pigs (Stein and Shurson,
2009). Other corn co-products such as high protein distillers dried grains (HP-DDG) and corn
germ are also available to be used in the swine industry. Formulation of diets based on values
that better meet the pigs requirements for P, use of exogenous phytase, and use of feed
ingredients from the ethanol industry may, therefore, result in reduced P excretion and also in
reduced diet costs. The objectives of this thesis are:
1) To calculate STTD of P in commonly used feed ingredients (corn and soybean meal)
and in corn co-products,
2) To verify the effectiveness of exogenous phytase in improving the STTD of P in these
ingredients,
3) To validate the hypothesis that diets may be formulated on the basis of values for
STTD of P without compromising pigs performance, and
4) To test the effects of a novel phytase on improving the ATTD of P in corn-soybean
meal diets.

3
LITERATURE CITED
Bohlke, R. A., R. C. Thaler, and H. H. Stein. 2005. Calcium, phosphorus, and amino acid
digestibility in low-phytate corn, normal corn, and soybean meal by growing pigs. J.
Anim. Sci. 83:2396-2403.
Cromwell, G. L. 1992. The biological availability of phosphorus in feedstuffs for pigs. Pig News
Inf. 13:75-78.
Cromwell, G. L. 2005. Phosphorus and swine nutrition. Pages 607-634 in Phosphorus:
Agriculture and the Environment. Agronomy monograph no. 46. American Society of
Agronomy, Crop Science Society of America, Soil Science Society of America, Madison,
WI.
Guggenbuhl, P., A. P. Quintana, and C. S. Nunes. 2007. Comparative effects of three phytases
on phosphorus and calcium digestibility in the growing pig. Livest. Sci. 109:258-260.
Pedersen, C., M. G. Boersma, and H. H. Stein. 2007. Digestibility of energy and phosphorus in
ten samples of distillers dried grains with solubles fed to growing pigs. J. Anim. Sci.
85:1168-1176.
Petersen, G. I., and H. H. Stein. 2006. Novel procedure for estimating endogenous losses and
measurement of apparent and true digestibility of phosphorus by growing pigs. J. Anim.
Sci. 84:2126-2132.
Stein, H. H., C. Pedersen, A. R. Wirt, and R. A. Bohlke. 2005. Additivity of values for apparent
and standardized ileal digestibility of amino acids in mixed diets fed to growing pigs. J.
Anim. Sci. 83:2387-2395.
Stein, H. H., and G. C. Shurson. 2009. Board-invited review: the use and application of distillers
dried grains with solubles in swine diets. J. Anim. Sci. 87:1292-1303.
4
CHAPTER 2
DETERMINATION OF STANDARDIZED TOTAL TRACT DIGESTIBILITY OF P IN
SWINE FEED INGREDIENTS: LITERATURE REVIEW
INTRODUCTION
Concerns about the amounts of P that are excreted into the environment and increasing
costs of inorganic P such as monocalcium phosphate (MCP) and dicalcium phosphate (DCP)
have increased the interest in developing strategies to improve the utilization of P by pigs. One
of these strategies is to formulate diets that exactly meet the animals` requirement for P. For
many years, swine diets have been formulated on the basis of values for the relative
bioavailability of P in feed ingredients, which can be measured by the slope-ratio technique
(Cromwell, 1992). These values, however, are not always additive in mixed diets and the cost to
conduct this kind of research is high. Because of that, apparent total tract digestibility (ATTD) of
P in some feed ingredients and diets has been reported (Bohlke et al., 2005; Brana et al., 2006),
but ATTD values do not account for basal endogenous P losses (EPL), and therefore, they are
also believed to not always be additive in mixed diets. To mitigate this issue, there is a need for
measuring standardized total tract digestibility (STTD) of P in various swine feed ingredients
because these values are corrected for basal EPL, and therefore, are believed to be additive in
mixed diets. If diets are formulated based on values that are additive, it is likely that diets that
better meet the animal’s requirement of P are produced.
Another strategy that has been extensively investigated is the use of exogenous phytase in
swine diets. The effects of exogenous phytase in improving the ATTD of P have been

5
demonstrated (Cromwell et al., 1995; Brady et al., 2002; Brana et al., 2006), but the effects of
phytase on the STTD of P have not been investigated. There is also a need to determine the
concentration of phytase that optimizes the response to phytase.
Ethanol production in U. S. has expanded in recent years and many co-products are
available to the swine feed industry. Thus, it is important to determine the STTD of P as well as
the effects of phytase on the STTD of P in these ingredients so they can be better utilized in the
diets. It is believed that a combination of the strategies mentioned above will contribute to
reduction of both P excretion and diet costs with simultaneous optimization of pig performance.
In this review, the metabolism of P, the concepts of P digestibility, the supplemental use of
exogenous phytase, and the use of corn co-products in swine diets will be discussed.
BIOLOGICAL ROLES OF P IN ANIMALS
Phosphorus is an important mineral in the body and it is needed for many biological
functions. Approximately 80% of P is located in skeletal tissues while the remaining 20% is
located in soft tissues (Breves and Schröder, 1991). In nature, most of the P is combined with
oxygen in the form of phosphate (Anderson et al., 2006). Primarily, P is involved in bone
mineralization and teeth formation, but P has many other functions within the body. Phosphorus
is also an important component of phospholipids in cell membranes (Crenshaw, 2001).
Phosphorus also acts as a buffer, a component of ATP (Cashman and Flynn, 1999), and is used
in the synthesis of DNA and RNA (Anderson et al., 2006). Another function of P is the
phosphorylation of glucose because glucose can undergo glycolysis only if it is phosphorylated
(Anderson et al., 2006).

6
DIGESTION, ABSORPTION, AND REGULATION OF P
Digestion of P is influenced by the form in which it is present in the diet. Pigs cannot
secrete enough endogenous phytase to hydrolyze phytate-P, and therefore, organic P of vegetable
origin is not well digested by pigs (Nahm, 2004).
Most P absorption takes place in the small intestine, mainly in the jejunum (Metzler and
Mosenthin, 2008), and the transport of P from the gut lumen to the enterocyte can be passive or
active (Breves and Schröder, 1991). Phosphorus can be absorbed in the small intestines only if it
has been hydrolyzed to its inorganic form (phosphate), and absorption occurs through 2 main
mechanisms: Na+- dependent and Na
+- independent absorption (Anderson, 1991).
In the Na+- dependent mechanism, phosphate maybe transported against a concentration
gradient by integral membrane proteins that facilitate the co-transport of Na+ and phosphate into
the cytosol of the enterocyte. After these first steps, phosphate is extruded across the baso lateral
membrane by a Na+ independent mechanism. This final step, however, is not yet fully
understood (Breves and Schröder, 1991). The Na+ - independent mechanism occurs by the flow
of phosphate through ion channels across the brush border membrane of the enterocytes. In this
case, phosphate moves down its electrochemical gradient until it reaches equilibrium (Breves
and Schröder, 1991).
Phosphorus homeostasis occurs by the controlled interactions of the intestine, bones, and
renal tubules (Taylor and Bushinsky, 2009). The kidney is the most important organ in the
regulation of P homeostasis (Anderson et al., 2006). The regulation of P is directly affected by
parathyroid hormone (PTH), vitamin D, and dietary phosphate level (Marks et al., 2006; Taylor
and Bushinsky, 2009). Parathyroid hormone, which is very important in regulation of P
homeostasis, is secreted from the cells of the parathyroid glands as a linear protein of 84 AA and

7
has the cells in bone and kidney as its major target (Bowen, 2003). When serum P levels are low
(hypophosphatemia), plasma Ca levels are elevated and that decreases secretion of PTH. As a
result, renal inorganic P excretion is reduced. Hypophosphatemia also causes an increase in the
concentration of renal 1,25-dihydroxyvitamin D [1,25(OH)2D3] and calcitriol, which results in
increased mobilization from bone and soft tissues, and may result in increased intestinal
inorganic P and Ca absorption as well. In contrast, when serum P levels are high
(hyperphosphatemia), there is a decrease in plasma Ca concentration resulting in increased PTH
and increased renal excretion of P in the urine. Concomitantly, calcitriol and renal 1,25(OH)2D3
levels decrease, which leads to decreased intestinal inorganic P and Ca absorption as well as
decreased mobilization from bone and soft tissues (Breves and Schröder, 1991). The mechanism
by which P is regulated in the intestines, however, was recently questioned by Stein et al. (2008)
who fed pigs diets containing P levels that were between 50% below and 50% above the
requirement. They observed that absorption of P remained constant across various P levels,
which suggests that the intestine may not be a major regulator of P homeostasis. The integrated
mechanism of P homeostasis involving PTH and vitamin D is well recognized (Breves and
Schröder, 1991; Marks et al., 2006). In a recent review, however, Taylor and Bushinsky (2009)
demonstrated the role of other possible regulatory mechanisms. Homeostasis of P may be
regulated by phosphatonins, such as fibroblast growth factor 23 (FGF-23), which is a
phosphaturic peptide that reduces production of 1,25(OH)2D3 and increases the expression of an
enzyme (24-hydroxylase) that converts 1,25(OH)2D3 into forms that are less biologically active.
This in turn causes increased P excretion from the kidneys and also a decreased absorption of P
in the intestines. As a consequence, serum P levels are reduced (Berndt and Kumar, 2007), and P
uptake by renal cells is decreased by other phosphatonins such as fibroblast growth factor 7,

8
frizzled-related protein 4, and matrix extracellular phospho-glycoprotein (Taylor and Bushinsky,
2009). Because regulation of P homeostasis by phosphatonins was recently discovered, further
investigations regarding the action and interaction of these phosphatonins are needed.
PHOSPHORUS REQUIREMENTS
There are 2 main techniques to determine P requirements for swine: factorial calculations
and empirical measurements. The factorial approach is believed to be more accurate because its
measurements account for availability, retention, and also for the obligatory losses of P in the
body (Weremko et al., 1997). However, empirical measurements are most common and response
criteria such as bone ash or bone breaking strength have been used for many decades to estimate
P requirements for pigs (Cromwell, 2009). Requirement values are, however, dependent on the
standards used to obtain these values (Crenshaw, 2001) and they vary according to age (NRC,
1998), sex (Fandrejewski and Rymarz, 1986), and other factors. For example, the requirement of
total P expressed as a percentage of the diet ranges from 0.7% in a 3 to 5 kg pig to 0.4% in an 80
to 120 kg pig (NRC, 1998), and these values can be also expressed as amount of P required per
day. Expressing P requirement on a daily basis or as g per Mcal ME may be an advantage if pigs
are fed a high energy diet, because this will likely cause a reduction in feed intake, and therefore,
P concentration in this diet need to be increased to compensate for lower feed intake (Knowlton
et al., 2004). Additionally, because of the variability among animals and feed ingredients, feed
companies have traditionally recommended P allowances for pigs at levels that are above the
NRC recommendations (Cromwell, 2005). This practice, however, has led to high amounts of P
excretion. In fact, P excretion may increase by 70% when diets are formulated with 0.2% more P

9
than what is needed by pigs (Cromwell, 2005). Requirements reported by NRC (1998) were
measured at least 15 years ago and some of the estimates may be questioned because at that time
there was only a limited amount of data available (Knowlton et al., 2004). To mitigate these
issues, diets should be formulated based on values that meet the P requirements more precisely.
An alternative would be to formulate diets that are based on the STTD of P, but before
nutritionists can move in that direction a data base with the STTD of P in all feed ingredients and
the P requirements based on STTD P needs to be established.
PHOSPHORUS IN FEED INGREDIENTS
Corn and soybean meal are the major ingredients used in swine diets. The majority of P
in these ingredients is in the form of phytic acid (PA), which cannot be digested by pigs
(Cromwell, 1992). In seeds, up to 80% of P may be stored as PA. Accumulation of PA in seeds
occurs from the beginning of seed development until seed maturity (Bohn et al., 2008). The
location of PA in the seed, however, varies among plant species. For example, in legume seeds,
most PA is located in the cotyledon and in the endosperm, while in corn it is primarily located in
the germ (Pallauf and Rimbach, 1997). In plants, PA functions as an antioxidant, as an energy
source, and as P storage for the germinating seeds. Phytic acid is a molecule of 6 carbons that
binds up to 6 molecules of phosphate, and PA is also known as myo-inositol-1,2,3,4,5,6-
hexakisphosphate (Raboy et al., 2001). Phytic acid is considered an anti-nutritional factor in
animal diets because the 6 phosphates in PA may bind cations (e.g., Ca, Mg, Fe, Zn, Cu, Mn)
due to their negative charges (Rimbach et al., 2008). Pigs and poultry cannot utilize phytate
bound P because they lack endogenous phytase. As a consequence, inorganic P has to be

10
supplemented in the diets to meet the animal’s requirement and, therefore, the cost of diets is
increased. The PA bound P that cannot be digested by pigs and poultry is excreted in the feces,
which may eventually cause eutrophication of lakes and fresh water streams (Bohn et al., 2008).
In corn, approximately 66% of total P is bound to PA while in soybean meal 61% of total P is
bound to PA (Cromwell, 1992). Phytic acid causes the relative bioavailability of P in corn (14%)
and SBM (23 to 31%) to be low (NRC, 1998). In corn co-products such as distillers dried grains
with solubles (DDGS), PA bound P corresponds to approximately 65% of total P (Noureddini et
al., 2009), but the relative bioavailability of P in DDGS (77%) is much greater than in corn
(NRC, 1998). There are, however, no reports on the amount of PA in high protein distillers dried
grains (HP-DDG), and corn germ. Kim et al. (2008) demonstrated that HP-DDG may have
similar amount of PA compared with DDGS because both of these co-products have to go
through fermentation, while corn germ is expected to have a greater amount of PA compared
with DDGS and HP-DDG because most of the PA (90%) in the corn kernel is in the germ
fraction (Noureddini et al., 2009). Phytate is also believed to negatively affect the digestibility of
AA. Selle and Ravindran (2008), proposed 3 possible mechanisms by which these negative
effects may occur. First, phytate may form a binary protein-phytate complex, which would cause
protein to be excreted along with the PA bound P. Second, PA may increase endogenous AA
flows, which will reduce the apparent ileal digestibility of AA. Third, intestinal absorption of AA
may be compromised by the presence of PA in the gut lumen because AA may bind to the PA
molecule, which cannot be absorbed. There are, however, controversies on whether or not PA
really reduces the digestibility of AA. For example, reduction of AA digestibility in pigs due to
PA was reported by Bolhke et al. (2005) and Liao et al. (2005). On the other hand, phytase,
regardless of the dietary PA did not improve AA digestibility in studies conducted by Johnston et
11
al. (2004) and Woyengo et al. (2008). Recently, Woyengo et al. (2009) also reported that dietary
PA has little effect on AA digestibility.
Feed ingredients of animal origin are good sources of P. For example, P in meat and bone
meal (MBM) is approximately 90% bioavailable relative to P in monosodium phosphate
(Traylor et al., 2005). Phosphorus is also highly available in other feed ingredients of animal
origin. For instance, P is 92% relative bioavailable in blood meal, 94% in fish meal, 91% in
skimmed milk and 97% in dried whey (NRC, 1998).
Because pigs are not efficient in digesting the PA present in vegetable feed ingredients,
inorganic P has to be supplemented in diets to meet the pigs requirement of P (Cromwell, 1992).
The relative bioavailability of P in MCP (102%), and in DCP (107%) has been calculated using
the slope-ratio technique (Cromwell, 1992). In this technique, monosodium phosphate (MSP) is
used as a standard source and considered to be 100% available. Petersen and Stein (2006),
however, measured the ATTD and STTD of P in MCP (84 and 91%), DCP (81 and 88%), and
MSP (92 and 98%). This indicates that the bioavailability of P in MCP and DCP is less than in
MSP, but P in both MCP and DCP is highly digestible by pigs.
AVAILABILITY AND DIGESTIBILITY
Phosphorus availability can be defined as the amount of P in a feed ingredient that is
biologically available to be absorbed and metabolically utilized by the pig (Weremko et al.,
1997) and is most often expressed as the relative bioavailability of P. The slope ratio technique is
usually used to determine relative bioavailability of P in feed ingredients (Cromwell, 1992). In
this technique, a basal diet is formulated and graded levels of 1 or more test ingredients are

12
added to this diet to create diets containing graded levels of P from each test ingredient. A
standard source of P is also added to the basal diet at graded levels to provide the same levels of
P as those contributed by the test ingredients. Diets that are used in this technique cannot exceed
the pigs requirement for P, and the P levels in the diets must be on the linear response curve.
These diets are fed to pigs that are euthanized after a period of 4 to 6 weeks. At this time, the
third and fourth metatarsal bones are removed and analyzed for ash content or breaking strength.
The regression method is used to determine the slopes of the response criteria for pigs fed the
test ingredient and the standard diets. The relative bioavailability is calculated by the ratio of the
slope of the test ingredient to the slope of the standard ingredient. Monosodium phosphate or
DCP or MCP are most often used as the standard source of P. There are 2 main limitations with
the use of this procedure. First, the cost to conduct this type of experiment is relatively high
because pigs need to be euthanized. Second, because different standards can be used to calculate
these values, they are believed not to be additive in mixed diets.
Digestibility of P has been measured as ATTD of P, which is the difference between P
intake and P excretion in the feces (Jongbloed et al., 1992; Bruce and Sundstol, 1995). These
values, however, present high variability within the same ingredient (Fan et al., 2001). Another
disadvantage of ATTD values is the fact that they do not account for EPL, which is believed to
result in these values not to be additive in mixed diets (Fan et al., 2001). Endogenous P loss is
defined as the amount of P voided in feces that does not originate from the diet. In other words,
EPL is P present in the feces that comes from salivary, gastric, and biliary juices, and also from
pancreatic secretions and sloughed mucosal cells (Fan et al., 2001). The EPL can be measured
indirectly by the regression technique (Fan et al., 2001) or directly by feeding a P-free diet and
measuring the amount of P excreted in feces (Petersen and Stein, 2006). Previous data of EPL

13
using the regression technique has demonstrated great variability with values ranging from 70 to
840 mg/kg DMI (Pettey et al., 2006; Shen et al., 2002). In contrast, estimation of EPL from pigs
that are fed a P-free diet seems to be less variable with values ranging from 139 to 211 mg/kg
DMI (Petersen and Stein, 2006; Widmer et al., 2007). When EPL is measured using a P-free diet,
basal EPL is obtained, which can be used to correct ATTD values to obtain STTD values. These
values are believed to be additive in mixed diets. Currently, there are no data on the STTD of P
in most commonly used feed ingredients.
PHYTASE
Before pigs can utilize PA bound P or other minerals that are bound in PA complexes, the
phytate molecule has to be hydrolyzed. This can be achieved by the enzyme phytase (myo-
inositol-1,2,3,4,5,6-hexakisphosphate phosphohydrolase). Phytases can originate from animals,
plants, or microbial sources (Pallauf and Rimbach, 1997). Production of mucosal phytase in pigs
is minimal, however, these endogenous phytases might complement the use of exogenous
phytase (Selle and Ravindran, 2008). In most plants, the presence of phytase is also low resulting
in low phytase concentrations in all vegetable feed ingredients, except in wheat and wheat co-
products where phytase activity was reported at 9945 (wheat bran) phytase units per kg (Steiner
et al., 2007). Many microbial phytases are currently available for commercial use and they are
classified into three main categories (3-phytases, 6-phytases, and 5-phytases) according to where
they initiate hydrolysis of PA on the inositol ring. For instance, 3-phytases originated from
Aspergillus niger initiate phytate hydrolysis at the third phosphate group, while 6-phytases (e.g.,
Escherichia coli) initiate phytate hydrolysis at the sixth phosphate, and 5-phytases (e.g., Pisium

14
sativum) initiate phytate hydrolysis at the fifth phosphate group (Rao et al., 2009). Phytases in
the same category can also be classified according to different mechanisms of action as well as
optimum pH of activity (Bohn et al., 2008). The 3-phytases are the main category of phytases
and are mainly present in fungi and bacteria in the form of histidine acid phosphatases. One of
the differences between fungal and bacterial phytases is how these organisms produce the
enzyme. While fungal phytases are produced extracellularly, bacterial (gram-negative) phytases
are produced intracellularly (Rao et al., 2009). Another difference is the substrate specificity of
these phytases. Fungal phytases have broad substrate specificity for PA, glucose, fructose, AMP,
ADP, and ATP. Bacterial phytases exhibit high substrate specificity for PA (Rao et al., 2009).
Despite their differences, similar effectiveness of fungal and bacterial phytase on improving P
and Ca digestibility has been demonstrated (Guggenbuhl et al., 2007).
Genetically modified plants and animals have also been developed to express phytase.
Transgenic wheat, with the expression of thermostable phytase, improved mineral bioavailability
in cereal based diets (Brinch-Pedersen et al., 2006). Transgenic pigs have also been developed to
express bacterial phytase in the salivary glands (Golovan et al., 2001; Forsberg et al., 2003).
Using these pigs, reductions of up to 75% in phosphorus excretion were achieved. At this point,
however, neither the wheat expressing the phytase, nor the transgenic pigs have been approved
for use under commercial conditions.
Exogenous phytase improves the ATTD of P (Brana et al., 2006; Akinmusire and Adeola,
2009), and Ca (Lei et al., 1993; Kornegay and Qian, 1996; Radcliffe et al., 1998; Nyannor et al.,
2007), and phytase is, therefore, routinely added to diets fed to pigs. The effects of phytase on
the STTD of P, however, have not been determined, and it is not proven if phytase has the same
effect on the STTD of P as is has on the ATTD of P.

15
CORN CO-PRODUCTS
Growth in the USA ethanol industry has yielded many corn co-products that can be
potentially used in the feeding of livestock. In 2006, 14% of the US corn crop was used for
ethanol production. Biofuel production in 2008 represented 2.5% of the fuel usage for
transportation in USA (Gibson and Hughes, 2009). With the increasing demand for biofuels,
more co-products are expected to be commercially available for the livestock industry in the
future. Some of these products include DDGS, HP-DDG, and corn germ, which are produced by
the corn ethanol industry.
The use of DDGS in swine diets has become common and levels of up to 30% may be
included in diets fed to swine (Stein and Shurson, 2009). Distillers dried grains with solubles
contains a relatively great amount of P and this P has a greater ATTD than P in corn (Pedersen et
al. 2007; Stein and Shurson, 2009) because the PA is partly destroyed during the production of
DDGS (Stein and Shurson, 2009).
New technologies such as Bfrac, which was introduced by the Poet Company (Sioux
Falls, SD), have been used to dehull and degerm corn before fermentation. The degerming
process yields corn germ. When corn is dehulled and degermed, its fermentation to ethanol
yields HP-DDG (Widmer et al., 2007). The ATTD and STTD of P in HP-DDG are similar to that
in DDGS, but the ATTD and STTD of P in corn germ is similar to corn (Widmer et al., 2007).
There are, however, no data on the effects of phytase on the ATTD and STTD of P in DDGS,
HP-DDG, and corn germ, and it is not known if the response to phytase is similar in these co-
products.
16
CONCLUSIONS
Present in every cell in the body, P is an indispensable mineral for pigs. Before
absorption in the small intestine, P must be hydrolyzed to phosphate. Most of the P in plant
ingredients is in the form of PA, which is biologically unavailable for absorption in the gut. For
that reason, phytase is commonly supplemented to swine diets and this improves P utilization by
pigs. Relative bioavailability and ATTD of P have been measured in many feed ingredients, but
these values cannot always be used to calculate the P requirement of pigs because the standards
used to measure values for relative bioavailability vary among experiments and because ATTD
values do not account for basal EPL and. Basal EPL can be directly measured by feeding pigs a
P-free diet and this value can be used to correct ATTD for EPL to calculate STTD of P. Values
for STTD of P are believed to be additive in mixed diets. The ethanol production in U.S. has
increased and many co-products are now available to be fed to pigs. Therefore, the STTD of P
needs to be measured not only in traditional feed ingredients (corn, SBM), but also in ingredients
from the ethanol industry, and the beneficial effects of phytase in improving the STTD of P in
these ingredients need to be validated.
SCOPE OF THESIS
The development of a data base with STTD of P values in various ingredients is
important to establish a new concept for diet formulation based on STTD values. Currently, the
ethanol industry is projected to continue increasing, which will lead to less corn and more corn
co-products to be used by the livestock industry. Effects of new phytases also need to be tested in
swine diets. The integration of more accurate values of digestible P for diet formulation with the

17
use of feed ingredients highly available in P, and the continuous supplementation of diets with
phytase will likely diminish the negative impacts of P excretion to the environment.

18
LITERATURE CITED
Akinmusire, A. S., and O. Adeola. 2009. True digestibility of phosphorus in canola and soybean
meals for growing pigs: Influence of microbial phytase. J. Anim. Sci. 87: 977-983.
Anderson, J. 1991. Nutritional biochemistry of calcium and phosphorus. J. Nutr. Biochem.
2:300-307.
Anderson, J. J. B., P. J. Klemmer, M. L. S. Watts, S. C. Garner, and M. S. Calvo. 2006.
Phosphorus. Pages 383-395 in Present Knowledge in Nutrition. B. A. Bowman and R. M.
Russell, ed. ILSI Press, International Life Sciences Institute, Washington, DC.
Berndt, T., and R. Kumar. 2007. Phosphatonins and the regulation of phosphate homeostasis.
Annu. Rev. Physiol. 69:341-359.
Bohlke, R. A., R. C. Thaler, and H. H. Stein. 2005. Calcium, phosphorus, and amino acid
digestibility in low-phytate corn, normal corn, and soybean meal by growing pigs. J.
Anim. Sci. 83:2396-2403.
Bohn, L., A. S. Meyer, and S. K. Rasmussen. 2008. Phytate: impact on environment and human
nutrition. A challenge for molecular breeding. J. Zhejiang Univ. Sci. B. 9:165-191.
Bowen, R. 2003. Parathyroid hormone.
http://www.vivo.colostate.edu/hbooks/pathphys/endocrine/thyroid/pth.html. Accessed
Oct. 16, 2009.
Brady, S. M., J. J. Callan, D. Cowan, M. McGrane, and J. V. O`Doherty. 2002. Effect of phytase
inclusion and calcium/phosphorus ratio on the performance and nutrient retention of
grower-finisher pigs fed barley/wheat/soya bean meal-based diets. J. Sci. Food. Agric.
82:1780-1790.

19
Brana, D. V., M. Ellis, E. O. Castaneda, J. S. Sands, and D. H. Baker. 2006. Effect of a novel
phytase on growth performance, bone ash, and mineral digestibility in nursery and
grower-finisher pigs. J. Anim. Sci. 84:1839-1849.Breves, G., and B. Schroder. 1991.
Comparative aspects of gastrointestinal phosphorus metabolism. Nutr. Res. Rev. 4:125-
140.
Brinch-Pedersen, H., F. Hatzack, E. Stöger, E. Arcalis, K. Pontopidan, and P. B. Holm. 2006.
Heat-stable phytases in transgenic wheat (Triticum aestivum L.): deposition pattern,
thermostability, and phytate hydrolysis. J. Agric. Food Chem. 54:4624-4632.
Bruce, J. A. M., and F. Sundstol. 1995. The effect of microbial phytase in diets for pigs on
apparent ileal and faecal digestibility, pH and flow of digesta measurements in growing
pigs fed a high-fibre diet. Can. J. Anim. Sci. 75:121-127.
Cashman, K. D., and A. Flynn. 1999. Optimal nutrition: calcium, magnesium and phosphorus.
Proceedings of the Nutrition Society. 58:477-487.
Crenshaw, T. D. 2001. Calcium, phosphorus, vitamin D, and vitamin K in swine nutrition. Pages
188-209 in Swine Nutrition. A. J. Lewis and L. L. Southern, ed CRC Press, Boca Raton,
FL.
Cromwell, G. L. 2009. ASAS Centennial Paper: Landmark discoveries in swine nutrition in the
past century. J. Anim. Sci. 87:778-792.
Cromwell, G. L. 2005. Phosphorus and swine nutrition. Pages 607-634 in Phosphorus:
Agriculture and the Environment. Agronomy monograph no. 46. American Society of
Agronomy, Crop Science Society of America, Soil Science Society of America, Madison,
WI.
20
Cromwell, G. L., R. D. Coffey, G. R. Parker, H. J. Monegue, and J. H. Randolph. 1995. Efficacy
of a recombinant-derived phytase in improving the bioavailability of phosphorus in corn-
soybean meal diets for pigs. J. Anim. Sci. 73:2000-2008.
Cromwell, G. L. 1992. The biological availability of phosphorus in feedstuffs for pigs. Pig News
Inf. 13:75-78.
Fan, M. Z., T. Archbold, W. C. Sauer, D. Lackeyram, T. Rideout, Y. Gao, C. F. M. de Lange,
and R. R. Hacker. 2001. Novel methodology allows simultaneous measurement of true
phosphorus digestibility and the gastrointestinal endogenous phosphorus outputs in
studies with pigs. J. Nutr. 131:2388-2396.
Fandrejewski, H., and A. Rymarz. 1986. Effect of feeding level on Ca, P, K and Na content in
the bodies of growing boars and gilts. Livest. Prod. Sci. 14:211-215.
Forsberg, C. W., J. P. Phillips, S. P. Golovan, M. Z. Fan, R. G. Meidinger, A. Ajakaiye, D.
Hilborn, and R. R. Hacker. 2003. The Enviropig physiology, performance, and
contribution to nutrient management advances in a regulated environment: the leading
edge of change in the pork industry. J. Anim. Sci. 81:E68-E77.
Gibson, W. R., and S. R. Hughes. 2009. Integrated biorefineries with engineered microbes and
high-value co-products for profitable biofuels production. In Vitro Cell. Dev. Biol.-Plant.
45:218-228.
Golovan, S. P., R. G. Meidinger, A. Ajakaiye, M. Cottrill, M. Z. Wiederkehr, D. J. Barney, C.
Plante, J. W. Pollard, M. Z. Fan, M. A. Hayes, J. Laursen, J. P. Hjorth, R. R. Hacker, J. P.
Phillips, and C. W. Forsberg. 2001. Pigs expressing salivary phytase produce low-
phosphorus manure. Nat. Biotechnol. 19:741-745.
21
Guggenbuhl, P., A. P. Quintana, and C. S. Nunes. 2007. Comparative effects of three phytases
on phosphorus and calcium digestibility in the growing pig. Livest. Sci. 109:258-260.
Jongbloed, A. W., Z. Mroz, and P. A. Kemme. 1992. The effect of supplementary Aspergillus
niger phytase in diets for weanling pigs on concentration and apparent digestibility of dry
matter, total phosphorus, and phytic acid in different sections of the alimentary tract. J.
Anim. Sci. 70:1159-1168.
Johnston, S. L., S. B. Williams, L. L. Southern, T. D. Bidner, L. D. Bunting, J. O. Matthews, and
B. M. Olcott. 2004. Effect of phytase addition and dietary calcium and phosphorus levels
on plasma metabolites and ileal and total-tract nutrient digestibility in pigs. J. Anim. Sci.
82:705-714.
Kim, E. J., C. Martinez Amezcua, P. L. Utterback, and C. M. Parsons. 2008. Phosphorus
bioavailability, true metabolizable energy, and amino acid digestibilities of high protein
corn distillers dried grains and dehydrated corn germ. Poult. Sci. 87:700-705.
Knowlton, K. F., J. S. Radcliffe, C. L. Novak, and D. A. Emmerson. 2004. Animal management
to reduce phosphorus losses to the environment. J. Anim. Sci. 82:E173-195.
Kornegay, E. T., and H. Qian. 1996. Replacement of inorganic phosphorus by microbial phytase
for young pigs fed on a maize-soyabean-meal diet. Br. J. Nutr. 76:563-578.
Lei, X. G., P. K. Ku, E. R. Miller, and M. T. Yokoyama. 1993. Supplementing corn-soybean
meal diets with microbial phytase linearly improves phytate phosphorus utilization by
weanling pigs. J. Anim. Sci. 71:3359-3367.
Liao, S. F., A. K. Kies, W. C. Sauer, Y. C. Zhang, M. Cervantes, and J. M. He. 2005. Effect of
phytase supplementation to a low- and a high-phytate diet for growing pigs on the
digestibilities of crude protein, amino acids, and energy. J. Anim. Sci. 83: 2130-2136.
22
Marks, J., S. K. Srai, J. Biber, H. Murer, R. J. Unwin, and E. S. Debnam. 2006. Intestinal
phosphate absorption and the effect of vitamin D: a comparison of rats with mice. Exp.
Physiol. 91:531-537.
Metzler, B. U., and R. Mosenthin. 2008. A review of interactions between dietary fiber and the
gastrointestinal microbiota and their consequences on intestinal phosphorus metabolism
in growing pigs. Asian-Aust. J. Anim. Sci. 4:603-615.
Nahm, K. H. 2004. Additives to reduce phosphorus excretion and phosphorus solubility in
poultry and swine manure. Aust. J. Exp. Agr. 44:717-728.
Noureddini, H., M. Malik, J. Byun, and A. J. Ankeny. 2009. Distribution of phosphorus
compounds in corn processing. Bioresource Technol. 100:731-736.
NRC. 1998. Nutrient Requirements of Swine. 10th ed. Natl. Acad. Press, Washington
D.C.
Nyannor, E. K., P. Williams, M. R. Bedford, and O. Adeola. 2007. Corn expressing an
Escherichia coli-derived phytase gene: a proof of concept nutritional study in pigs. J.
Anim. Sci. 85:1946-1952.
Pallauf, J., and G. Rimbach. 1997. Nutritional significance of phytic acid and phytase. Arch.
Anim. Nutr. 50:301-319.
Pedersen, C., M. G. Boersma, and H. H. Stein. 2007. Digestibility of energy and phosphorus in
ten samples of distillers dried grains with solubles fed to growing pigs. J. Anim. Sci.
85:1168-1176.
Petersen, G. I., and H. H. Stein. 2006. Novel procedure for estimating endogenous losses and
measurement of apparent and true digestibility of phosphorus by growing pigs. J. Anim.
Sci. 84:2126-2132.

23
Pettey, L. A., G. L. Cromwell, and M. D. Lindemann. 2006. Estimation of endogenous
phosphorus loss in growing and finishing pigs fed semi-purified diets. J. Anim. Sci. 84:
618-626.
Raboy, V., K. A. Young, J. A. Dorsch, and A. Cook. 2001. Genetics and breeding of seed
phosphorus and phytic acid. J. Plant Physiol. 158:489-497.
Radcliffe, J. S., Z. Zhang, and E. T. Kornegay. 1998. The effects of microbial phytase, citric
acid, and their interaction in a corn-soybean meal based diet for weanling pigs. J. Anim.
Sci. 76:1880-1886.
Rao, D. E. C. S., T. P. Reddy, and V. D. Reddy. 2009. Molecular characterization,
physicochemical properties, known and potential applications of phytases: An overview.
Crit. Rev. Biotechnol. 29:182-198.
Rimbach, G., J. Pallauf, J. Moehring, K. Kraemer, and A. M. Minihane. 2008. Effect of dietary
phytase and microbial phytase on mineral and trace element bioavailability – a literature
review. Curr. Top. Nutr. Res. 6:131-144.
Selle, P. H., and V. Ravindran. 2008. Phytate-degrading enzymes in pig nutrition. Livest. Sci.
113:99-122.
Shen, Y., M. Z. Fan, A. Ajakaiye, and T. Archbold. 2002. Use of the regression analysis
technique to determine the true phosphorus digestibility and the endogenous phosphorus
output associated with corn in growing pigs. J. Nutr. 132:1199-1206.
Stein, H. H., and G. C. Shurson. 2009. BOARD-INVITED REVIEW: The use and application of
distillers dried grains with solubles in swine diets. J. Anim. Sci. 87:1292-1303.

24
Stein, H. H., C. T. Kadzere, S. W. Kim, and P. S. Miller. 2008. Influence of dietary phosphorus
concentration on the digestibility of phosphorus in monocalcium phosphate by growing
pigs. J. Anim. Sci. 86:1861-1867.
Steiner, T., R. Mosenthin, B. Zimmermann, R. Greiner, and S. Roth. 2007. Distribution of
phytase activity, total phosphorus and phytate phosphorus in legume seeds, cereals and
cereal by-products as influenced by harvest year and cultivar. Anim. Feed Sci. Technol.
113:320-334.
Taylor, J. G., and D. A. Bushinsky. 2009. Calcium and phosphorus homeostasis. Blood Purificat.
27:387-394.
Traylor, S. L., G. L. Cromwell, and M. D. Lindemann. 2005. Bioavailability of phosphorus in
meat and bone meal for swine. J. Anim. Sci. 83:1054-1061.
Weremko, D., H. Fandrejewski, and T. Zebrowska. 1997. Bioavailability of phosphorus in feeds
of plant origin for pigs – Review. Asian Austr. J. Anim. Sci. 10:551-566.
Widmer, M. R., L. M. McGinnis, and H. H. Stein. 2007. Energy, phosphorus, and amino acid
digestibility of high-protein distillers dried grains and corn germ fed to growing pigs. J.
Anim. Sci. 85:2994-3003.
Woyengo, T. A., A. J. Cowieson, O. Adeola, and C. M. Nyachoti. 2009. Ileal digestibility and
endogenous flow of minerals and amino acids: responses to dietary phytic acid in piglets.
Br. J. Nutr. 102:428-433.
Woyengo, T. A., J. S. Sands, W. Guenter, and C. M. Nyachoti. 2008. Nutrient digestibility and
performance responses of growing pigs fed phytase- and xylanase-supplemented wheat-
based diets. J. Anim. Sci. 86:848-857

25
CHAPTER 3
PERFORMANCE AND PHOSPHORUS BALANCE OF PIGS FED DIETS
FORMULATED ON THE BASIS OF VALUES FOR STANDARDIZED TOTAL TRACT
DIGESTIBILITY OF PHOSPHORUS
ABSTRACT
Three experiments were conducted to test the hypothesis that pigs fed diets that are equal in
digestible P will perform equally well regardless of the concentration of total P in the diets, and
that the addition of microbial phytase, distillers dried grains with solubles (DDGS), or a
combination of phytase and DDGS will result in a reduction in P excretion. In Exp. 1, a P-free
diet and 6 diets containing corn, soybean meal (SBM), or DDGS without or with microbial
phytase (500 phytase units per kg, Optiphos 2000, Enzyvia, Sheridan, IN) were formulated. Diets
were fed for 12 d to 42 pigs (initial BW: 13.5 ± 3.9 kg) that were housed in metabolism cages
that allowed for total collections of feces. Basal endogenous P losses (EPL) were determined to
be 199 mg/kg DMI for pigs fed the P-free diet. Addition of phytase increased (P < 0.01) the
standardized total tract digestibility (STTD) of P in corn (64.4 vs. 26.4%) and SBM (74.9 vs.
48.3%), but there was no effect of the addition of phytase on the STTD of P in DDGS (75.5 vs.
72.9%). In Exp. 2, a total of 160 pigs (initial BW: 11.25 ± 1.95 kg) were allotted to 4 corn-SBM
based diets in a 2 × 2 factorial design with 2 levels of phytase (0 or 500 phytase units per kg) and
2 levels of DDGS (0 or 20%). All diets were formulated to be below the requirement for
digestible P and they contained 0.32% STTD P according to STTD values determined in Exp. 1.
Diets were fed for 21 d and results showed that inclusion of phytase to the diet containing no

26
DDGS tended (P < 0.10) to decrease G:F, but inclusion of 20% DDGS to the diets tended (P <
0.10) to increase ADG, ADFI, and final BW. In Exp. 3, diets from Exp. 2 were fed to 24 pigs
(initial BW: 14.6 ± 1.4 kg) that were placed in metabolism cages. Feces and urine were collected
for 5 d. Phytase and DDGS increased (P < 0.01) the apparent total tract digestibility of P in the
diets. Absorption of P was greater (P < 0.05) for pigs fed corn-SBM-DDGS diets than for pigs
fed corn-SBM diets, and phytase, DDGS, or the combination of phytase and DDGS, reduced (P
< 0.01) P excretion. In conclusion, the addition of phytase increased the STTD of P in corn and
SBM, but had no effect on the STTD of P in DDGS. Diets may be formulated based on STTD
values without compromising pig performance, and dietary phytase, DDGS, or the combination
of phytase and DDGS will reduce P excretion from growing pigs.
Key words: digestibility, endogenous losses, excretion, phosphorus, phytase, pig
INTRODUCTION
Phosphorus excretion from pigs can be reduced if phytase is added to diets based on
soybean meal (SBM) and corn (Cromwell et al., 1995). It is also believed that P excretion can be
reduced if distillers dried grains with solubles (DDGS) is used because the digestibility of P is
greater in DDGS than in corn and SBM (Stein and Shurson, 2009). Values for the apparent total
tract digestibility (ATTD) of P in corn, SBM, and DDGS have been reported (Bohlke et al.,
2005; Pedersen et al., 2007), but values for ATTD do not account for the endogenous P losses
(EPL). Endogenous P losses can be measured using the regression procedure (Fan et al., 2001),
which is believed to yield total EPL, or by using a P-free diet (Petersen and Stein, 2006), which
yields basal EPL. Basal endogenous losses of nutrients are endogenous losses that are related

27
only to the DMI of the animal and independent of dietary compositon (Hess and Sève, 1999;
Stein et al., 2007). If values for ATTD of P are corrected for total EPL, values for true total tract
digestibility of P are calculated, whereas values for standardized total tract digestibility (STTD)
are calculated by correcting ATTD values for basal EPL. For AA, it has been demonstrated that
digestibility values based on standardized ileal digestibility of AA and CP are additive in mixed
diets, which is not always the case for values based on apparent ileal digestibility (Stein et al.,
2005). It is, therefore, believed that values for STTD of P are also additive in mixed diets, but
this concept has not been experimentally verified. The STTD of P in corn, SBM, and DDGS has
not been reported and the effect of microbial phytase on STTD in those ingredients has not been
measured. The objectives of the current experiments, therefore, were to test the following
hypotheses: 1) the STTD of P in corn, SBM, and DDGS fed to growing pigs will increase if
microbial phytase is used; 2) pigs fed diets that contain equal quantities of STTD P will perform
equally well regardless of the concentration of total P in the diets, and 3) the addition of
microbial phytase, DDGS, or a combination of phytase and DDGS to diets fed to pigs will result
in a reduction in P-excretion.
MATERIALS AND METHODS
Three experiments were conducted. The Institutional Animal Care and Use Committee at
the University of Illinois reviewed and approved the protocols for all experiments. Pigs used in
Exp. 1 were the offspring of line 337 boars that were mated to C-22 females while pigs used in
Exp. 2 and 3 were the offspring of Landrace boars mated to Yorkshire-Duroc females (Pig
Improvement Company, Hendersonville, TN).
28
Exp. 1. P-digestibility
Diets, Animals, and Experimental Design. Seven diets were formulated (Tables 3.1 and 3.2).
Two diets were based on corn, 2 diets were based on soybean meal, and 2 diets were based on
DDGS. Corn, soybean meal, or DDGS were the only source of P in the diets, and 1 of the diets
from each ingredient contained no phytase while the other diet contained 500 phytase units
(FTU) per kg of microbial phytase (Optiphos 2000, Enzyvia, Sheridan, IN). A P-free diet was
also formulated.
A total of 42 growing barrows (initial BW: 13.5 ± 3.9 kg) were used. Pigs were placed in
metabolism cages equipped with a feeder and a nipple drinker and randomly allotted to the 7
dietary treatments with 6 pigs per treatment.
Feeding and Sample Collection. The quantity of feed provided per pig daily was calculated as 3
times the estimated requirement for maintenance energy (i.e., 106 kcal ME per kg 0.75
; NRC,
1998) and divided into 2 equal meals. At the conclusion of the experiment, the unconsumed feed
was mixed within pig and analyzed for DM, P, and Ca and the amount of DM, P, and Ca in the
unconsumed feed was subtracted from the quantity of DM, P, and Ca that was provided. Water
was available at all times. The initial 5 d were considered an adaptation period to the diet. An
indigestible marker was added to the morning meals that were fed on d 6 and 11, and fecal
materials originating from the feed provided from d 6 to d 11 were collected according to the
marker to marker approach (Adeola, 2001). Chromic oxide was used to mark the beginning of
collection while ferric oxide was used to mark the end of collection. Fecal samples were stored at
-20oC immediately after collection.
Sample Analysis and Data Processing. Fecal samples were dried at 65oC in a forced air oven
and finely ground before analysis. Fecal, diet, and ingredient samples were analyzed in duplicate
29
for DM by oven drying at 135°C for 2 h (method 930.15; AOAC, 2005) and for P by inductively
coupled plasma spectroscopy (method 985.01; AOAC, 2005) after wet ash sample preparation
(method 975.03; AOAC, 2005). Diets and ingredients were analyzed for AA (method 982.30 E
(a, b, c); AOAC, 2005), ADF (method 973.18; AOAC, 2005), and for NDF (Holst, 1973). Diets
were also analyzed for CP by combustion (method 990.03; AOAC, 2005). Corn, SBM, DDGS,
and all diets were analyzed for phytase activity (Phytex Method, version 1; Eurofins, Des
Moines, IA).
The ATTD (%) of P in each diet was calculated according to the following equation:
ATTD (%) = [(Pi – Pf)/Pi] x 100,
where Pi is the total P intake (g) from d 6 to 11 and Pf is the total fecal P output (g) originating
from the feed that was provided from d 6 to 11.
The basal endogenous P losses (mg/kg of DMI) were measured from pigs fed the P-free
diet according to the following equation:
EPL (mg/kg DMI) = ([Pf/Fi] x 1,000 x 1,000),
where EPL is the endogenous P loss and Fi is the total feed (g DM) intake from d 6 to 11. The
daily EPL loss for pigs fed the P-containing diets was calculated by multiplying the calculated
EPL per kg DMI by the DMI of each pig.
The STTD of P was calculated using the following equation:
STTD (%) = ([Pi – {Pf – EPL}/Pi]) x 100,
where STTD (%) is the standardized total tract digestibility of P.
Data were analyzed using the GLM procedure of SAS (SAS Institute Inc., Cary, NC).
The UNIVARIATE procedure in SAS was used to confirm that variances were homogenous and
also to analyze for outliers, but no outliers were identified. The ATTD and STTD of P in corn,

30
SBM, and DDGS without and with microbial phytase were compared within each ingredient
using an ANOVA. The LSMeans statement was used to calculate mean values and the PDIFF
option was used to separate mean values if significant. The pig was the experimental unit and an
alpha value of 0.05 was used to assess significance among means.
Exp. 2. Performance
Diets, Animals, and Experimental Design. A total of 160 pigs (initial BW: 11.25 ± 1.95 kg)
were weaned at approximately 20 d of age and fed a common phase 1 diet. On d 11 post-
weaning, pigs were randomly allotted to 4 diets in a 2 x 2 factorial experiment with 2 levels of
DDGS (0 or 20%) and 2 levels of phytase (0 or 500 FTU per kg, Optiphos 2000; Enzyvia,
Sheridan, IN). These diets (Tables 3.3 and 3.4) were fed for 3 weeks. All diets were formulated
to contain 0.32% STTD P and values for the concentration of STTD of P in corn, soybean meal,
and DDGS without and with phytase that were measured in Exp. 1 were used to formulate the
diets used in Exp. 2. For dicalcium phosphate, a value for STTD of P of 88% was used (Petersen
and Stein, 2006). Pigs were housed in 1.2 x 1.4 m pens with fully slatted floors. There were 4
pigs per pen and 10 replicate pens per treatment. Feed and water were provided on an ad libitum
basis throughout the experiment.
Sample Analysis and Data Processing. Individual pig BW was recorded at the start and at the
conclusion of the experiment. Daily feed allotments were recorded as well. Diets were analyzed
for phytase, AA, ADF, NDF, CP, DM, and P as described for Exp. 1. Diets were also analyzed
for Ca by inductively coupled plasma spectroscopy (method 985.01; AOAC, 2005) after wet ash
sample preparation (method 975.03; AOAC, 2005). At the conclusion of the experiment, data
were summarized to calculate ADG, ADFI, and G:F for each pen and treatment group. Data were
analyzed as a 2 x 2 factorial using the Proc Mixed procedure of SAS. The UNIVARIATE

31
procedure was used to verify the homogeneity of variances and to analyze for outliers, but no
outliers were identified. The model included DDGS, phytase, and the interaction between DDGS
and phytase as the fixed effects, while block was included as a random effect. The pen was the
experimental unit for all calculations and an alpha level of 0.05 was used to assess significance
among means.
Exp. 3. Phosphorus Balance
The 4 diets that were used in Exp. 2 were also used in Exp. 3. Twenty four pigs (initial
BW: 14.6 ± 1.4 kg) were placed in metabolism cages and allotted to the 4 experimental diets
with 6 pigs per diet. The quantity of feed provided per pig daily was calculated as 3 times the
estimated requirement for maintenance energy and divided into 2 equal meals. At each feeding,
unconsumed feed in the feeders was removed and weighted. Water was available at all times.
The initial 5 d were considered an adaptation period to the diet. During the following 5 d, urine
was collected in buckets containing 20 mL of sulfuric acid. Fecal samples were also collected
over a 5 d period using the marker to marker procedure as described for Exp. 1.
Feces and urine were analyzed for Ca and P as described for Exp. 1 and 2. The ATTD of
P and Ca was also calculated as described for Exp. 1. The retention of P was calculated as
previously outlined (Petersen and Stein, 2006) using the following equation:
Pr = ([Pi – {Pf + Pu}]/Pi) x 100,
where Pr is P retention (%), Pi is the intake of P (g), Pf is the fecal output of P, and Pu is the
urinary output of P(g) over the collection period. The retention of Ca was also calculated using
this equation. Data were analyzed as described for Exp. 2.

32
RESULTS
Exp. 1. P-digestibility
Pigs remained healthy and readily consumed their diets throughout the experiment. Feed
intake, P intake, and fecal output were not affected by the absence or presence of phytase in corn,
SBM, or DDGS (Table 3.5). Phosphorus concentration in feces was reduced from 1.98 to 1.15%
(P < 0.001) in pigs fed corn and from 2.84 to 1.84% (P < 0.001) in pigs fed SBM when phytase
was used. The daily P output in feces was also reduced from 0.97 to 0.52 g (P < 0.05) for corn
and from 0.81 to 0.48 g (P < 0.001) for SBM when phytase was added to the diets. In contrast,
there was no difference in P concentration in feces or in P output in feces when phytase was
added to the DDGS diet. The ATTD of P increased (P < 0.001) from 19.9 to 57.8% for corn and
from 41.5 to 68.4% for SBM when phytase was added to the diets, but the ATTD of P in DDGS
was not affected by the addition of phytase. The basal EPL was measured at 199 mg/kg DMI
from pigs fed the P-free diet. The calculated daily basal EPL for pigs fed the P-containing diets
was not influenced by the presence of phytase in the diet regardless of which ingredient was
used. The STTD of P increased (P < 0.001) in corn and SBM when phytase was used, (from 26.4
to 64.4% and from 48.3 to 74.9%, respectively), but the STTD of P in DDGS without phytase
(72.9%) was not different from the STTD of P in DDGS with phytase (75.5%).
Exp. 2. Performance
The initial BW of pigs was similar across treatments (Table 3.6). After 21 d, final BW
was recorded and no difference was detected among treatments although pigs fed the corn-SBM-
DDGS diets tended (P < 0.10) to have a greater final BW than pigs fed the corn-SBM diets.
Likewise, there was a tendency (P < 0.10) for pigs fed corn-SBM-DDGS diets to have a greater
ADG and ADFI than pigs fed the corn-SBM diets, but there was no effect of phytase on ADG or

33
ADFI. The interaction between phytase and DDGS was significant (P < 0.05) for G:F. Inclusion
of phytase to the diet containing no DDGS tended (P < 0.10) to decrease G:F from 0.661 to
0.614, while in the diet containing 20% DDGS, G:F was not affected by the addition of phytase.
Exp. 3. Phosphorus Balance
No differences in ADFI were observed among treatments (Table 3.7), but the daily P
intake was lower (P < 0.01) for pigs fed diets containing phytase than for pigs fed diets
containing no phytase. Fecal P output was reduced (P < 0.01) for pigs fed diets containing
phytase or DDGS compared with pigs fed the diet without phytase or DDGS. The reduction in
fecal P output caused by the addition of phytase to the diets was greater for pigs that were fed
corn-SBM diets than for pigs that were fed corn-SBM-DDGS diets, resulting in an interaction (P
< 0.01). The ATTD of P increased (P < 0.01) from 56.1 to 71.5% in the corn-SBM diet and from
62.3 to 74.1% in the corn-SBM-DDGS diet when phytase was used. The inclusion of DDGS to
the corn-SBM diet also increased (P < 0.01) the ATTD of P. Urine P output was reduced (P <
0.01) when phytase was added to the diets, but DDGS did not affect urinary P output.
Phosphorus absorption was greater (P < 0.05) for pigs fed corn-SBM-DDGS diets than for pigs
fed corn-SBM diets, but there was no effect of phytase on P absorption. Phytase improved (P <
0.01) P retention in the corn-SBM diet from 56.03 to 71.48% and in the corn-SBM-DDGS diet
from 62.16 to 74.01%, but when calculated as g/d, P retention was not affected by the addition of
phytase to the diet. However, pigs fed diets containing DDGS retained more P (P < 0.05) than
pigs fed the diets containing no DDGS. Phosphorus excretion was reduced (P < 0.01) by phytase
and by DDGS, but in the diets containing DDGS, this reduction was less pronounced than in the
diets containing no DDGS (interaction, P < 0.01).

34
There was a tendency (P = 0.07) for an increase in Ca intake when phytase was added to
the diets. Fecal Ca output was reduced (P < 0.01) from 1.21 to 0.85 g/d, and from 1.12 to 0.75
g/d when phytase was added to the corn-SBM and corn-SBM-DDGS diets, respectively. The
ATTD of Ca increased (P < 0.01) in the corn-SBM diet from 69.65 to 80.42% and in the corn-
SBM-DDGS diet from 71.22 to 81.04% when phytase was used. Likewise, Ca absorption
increased (P < 0.01) in the corn-SBM diet from 2.71 to 3.49 g/d and in the corn-SBM-DDGS
diet from 2.79 to 3.20 g/d when phytase was used. The inclusion of DDGS to the diets decreased
(P < 0.01) urine Ca output, but phytase increased (P < 0.01) urine Ca output from 0.24 to 0.74
g/d in corn-SBM diets, and from 0.14 to 0.42 g/d in corn-SBM-DDGS diets. When Ca retention
was calculated as g/d, no differences among treatments were observed. However, Ca retention
measured as a percentage of intake was greater (P < 0.05) and Ca excretion was lower (P < 0.05)
for pigs fed diets containing DDGS compared with pigs fed diets without DDGS. There were,
however, no effects of phytase on Ca retention or on Ca excretion.
DISCUSSION
In most diets fed to pigs in the U.S., corn and SBM are the main ingredients. Most of the
organic P in these feed ingredients is bound in the form of phytate (Erdman, 1979), which is
poorly digested by pigs due to the lack of phytase in the pigs` gastro-intestinal tract (Pointillart et
al., 1984). However, addition of microbial phytase to diets fed to pigs increases P digestibility
because phytase partially degrades phytate in the stomach and small intestine, which results in
release of P that can be absorbed (Maga, 1982).

35
Values for the ATTD of P in corn and SBM that were measured in the current experiment
are in agreement with values reported by Bohlke et al. (2005) and Pedersen et al. (2007). The
ATTD of P in DDGS was previously reported with values ranging from 50 to 68% (Pedersen et
al., 2007; Stein et al., 2009) and the ATTD of P in DDGS measured in this experiment is similar
to the greatest values in this range. This observation confirms that the ATTD of P in DDGS is
much greater than in corn.
The total EPL has been measured using the regression method, which resulted in values
between 70 mg/kg DMI (Dilger and Adeola, 2006; Pettey et al., 2006) and 670 mg/kg DMI
(Shen et al., 2002). In the current experiment the basal EPL was measured by feeding a P-free
diet and a value of 199 mg/kg of DMI was obtained. This value is within the range (139 to 211
mg/kg of DMI) that has been reported for pigs fed a P-free diet (Petersen and Stein, 2006; Stein
et al., 2006; Widmer et al., 2007).
To our knowledge, the STTD of P in corn, SBM, and DDGS has not been previously
reported. However, the true total tract digestibility of P in corn is 59% (Shen et al., 2002), and in
SBM, the true total tract digestibility of P has been reported to be between 41 and 59% (Fan et
al., 2001; Ajakaiye et al., 2003; Akinmusire and Adeola, 2009). Values for the STTD of P in
corn and SBM that were calculated in the present experiment (26 and 48%, respectively), are
lower than the values for true total tract digestibility because STTD values are only corrected for
basal EPL, whereas values for true total tract digestibility are corrected for total EPL. Therefore,
it is expected that values for STTD are lower than values for true total tract digestibility.
Phytase supplementation increased the ATTD and STTD of P in corn and SBM, which
was expected because phytate is degraded by phytase (Selle and Ravindran, 2008), and more P is
released in the stomach and small intestine when phytase is added to the diet. In the present

36
experiment, the ATTD of P in SBM increased from 41.5 to 68.4% when phytase was used and
these values are in agreement with the ATTD of P in SBM without and with phytase (38.6 and
71.2%, respectively) that were recently reported (Akinmusire and Adeola, 2009). During
processing of corn in ethanol plants, a portion of the phytate is hydrolyzed, which is the reason
for the greater ATTD of P in DDGS than in corn (Stein and Shurson, 2009). Because of the
lower concentration of phytate in DDGS, phytase is not as effective in increasing the digestibility
of P in DDGS as in corn and SBM. To our knowledge, no other data for the ATTD or the STTD
of P in DDGS with phytase have been reported.
To compensate for the low digestibility of P in corn and SBM, inorganic P in the form of
dicalcium phosphate is usually added to diets fed to pigs, but because of the increased
digestibility of P in diets containing phytase or DDGS, less inorganic P is needed in the diet if
phytase or DDGS are used. We hypothesized that if diets are formulated to contain the same
amount of STTD P, no differences in pig performance would be observed, regardless of the level
of inorganic P in the diet. In Exp. 2, therefore, all diets were formulated to contain 0.32% STTD
P and the inclusion of dicalcium phosphate was reduced in the diets containing phytase or DDGS
and no inorganic P was used in the diet containing both phytase and DDGS. The tendency for a
reduced G:F for pigs fed the corn-SBM diet containing phytase compared with pigs fed the same
diet without phytase was surprising. This response has not been observed in previous
experiments with phytase and we did not make a similar observation in the DDGS containing
diet with phytase. The fact that P-retention was similar for the diet containing phytase as for the
control diet suggests that the tendency for a reduced G:F for the pigs fed the phytase containing
diet was not caused by a P-deficiency. It is, however, possible that the Ca:P ratios of the diets
may have influenced the G:F. The analyzed Ca and P concentrations of the diets used in Exp. 2

37
and 3 shows that the concentration of Ca was slightly greater and P concentration was less in the
corn-SBM diet containing phytase compared with the diet containing no phytase, which results
in differences in the Ca:P ratios between these 2 diets. A Ca:P ratio at or greater than 1.5:1 may
reduce feed efficiency of growing pigs (Liu et al., 1998; Brady et al., 2002) compared with pigs
fed diets with a narrower Ca:P ratio.
Differences in Ca:P ratios may also influence measured values for the ATTD of P in feed
ingredients (Liu et al., 1998). The Ca:P ratios in Exp. 1 did vary among ingredients but the ratio
was kept constant within each ingredient regardless of whether or not phytase was included in
the diet. It is, therefore, unlikely that the Ca:P ratios influenced the response to phytase that were
measured in Exp. 1. The fact that we obtained ATTD values for corn, SBM, and DDGS that
agree with previous data also indicates that the ratios used in Exp. 1 did not significantly
influence the results. However, effects of the interaction between phytase and Ca:P ratios on
measured values for ATTD and STTD of P in feed ingredients is an area that has not been well
studied and something that should be addressed in the future.
The fact that we did not observe a significant difference in performance among pigs fed
the 4 diets in Exp. 2 shows that values for STTD of P can be used in diet formulation and that no
inorganic P is needed in the diet if both phytase and DDGS are used. We are not aware of any
other data illustrating the consequences of formulating diets based on the STTD of P and we
believe that this is the first time that it has been demonstrated that pigs from 11 kg can be fed
diets containing no inorganic P if phytase and DDGS are included in the diet.
As expected, the excretion of P from the pigs was reduced if phytase or DDGS was added
to the diet, because the total concentration of P was lower in these diets than in the diet
containing no phytase or DDGS. However, the retention of P was not reduced when phytase was
38
used and pigs fed the diets containing DDGS actually had a greater retention of P than pigs fed
the diets without DDGS as demonstrated in Exp. 3. These observations show that the values for
the STTD of P that were measured in Exp. 1 did not overestimate the digestibility of P in corn,
SBM, or DDGS. The increase in the ATTD of P in the diets used in Exp. 3 as phytase was added
to the diets is also in agreement with the values obtained in Exp.1. The small, but significant,
reductions in urinary P for both groups of pigs fed phytase-containing diets compared with pigs
fed diets containing no phytase might indicate that the STTD of P in the phytase-containing
ingredients was slightly overestimated. However, these differences are so small that they are
likely of no practical significance. This conclusion is supported by the fact that the small, but not
significant, differences in P-retention between pigs fed phytase-containing diets and pigs fed
diets containing no phytase were 10 to 20 times greater than the small differences in urine output
of P.
Results of Exp. 3 also showed that although the ATTD of P in DDGS is not increased
when phytase is added (Exp. 1), the ATTD of P in a corn-SBM-DDGS diet is improved by
phytase. The reason for this observation is that corn and SBM contain phytate that can serve as
substrate for phytase. Therefore, the improvement in the ATTD of P by microbial phytase in a
mixed diet containing corn, SBM, and DDGS is due to the presence of phytate in corn and SBM.
The ATTD of Ca in the diets used in Exp. 3 increased as phytase was added to the diets
although almost all the Ca in the diets was inorganic Ca from limestone and dicalcium
phosphate. These results are in agreement with data reported by Guggenbuhl et al. (2007) that
also showed that phytase increased the ATTD of Ca. One possible mechanism by which Ca
absorption is increased by phytase is that phytate hydrolysis reduces phytate esters and,
therefore, reduces the ability of phytate to chelate Ca. As a result, the formation of an insoluble

39
Ca-phytate complex is reduced and Ca availability is increased when phytase is added to the diet
(Selle et al., 2009). This may also explain why a lower Ca:P ratio is recommended in diets
containing phytase than in diets containing no phytase (Lei et al., 1994; Liu et al., 1998).
The reduction in urinary Ca output for pigs fed the DDGS containing diets compared
with pigs fed the diets without DDGS is most likely a consequence of the increased P-retention
for pigs fed these diets. Bone tissue synthesis requires both P and Ca and as more P is retained,
more Ca is also needed to synthesize bones, which results in less Ca being excreted in the urine
(Stein et al., 2006).
The 3 experiments were all relatively short in duration and Ca and P status of pigs may
be influenced in the short term by changes in the concentration of Ca and P that are stored in
bone tissue of the pigs. The fact that within each combination of diets, no differences in P-
retention were observed, however, indicates that results of the 3 experiments were not influenced
by changes in bone concentrations, but longer term experiments need to be conducted to verify
this hypothesis.
Conclusions
The results of the present experiments showed that diets for pigs may be formulated
based on STTD of P. If phytase, DDGS, or the combination of phytase and DDGS is used, P
excretion is reduced and diets that contain much less inorganic P than conventional diets may be
used without reducing pig performance. More research is needed to determine STTD of P in
other feed ingredients and also to measure the requirements of STTD of P. If such data are
generated, diets can be formulated based on STTD of P, which may result in more accurate
formulation and in a reduction in P-excretion.

40
LITERATURE CITED
Adeola, O. 2001. Digestion and balance techniques in pigs. Pages 903 – 916 in Swine Nutrition.
A. J. Lewis and L. L. Southern, eds. CRC Press, Washington, DC. Swine Nutrition, 2nd
ed. CRC Press, N.Y.
Ajakaye, A., M. Z. Fan, T. Archbold, R. R. Hacker, C. W. Forsberg, and J. P. Phillips. 2003.
Determination of true digestive utilization of phosphorus and the endogenous phosphorus
outputs associated with soybean meal for growing pigs. J. Anim. Sci. 81:2766-2775.
Akinmusire, A. S., and O. Adeola. 2009. True digestibility of phosphorus in canola and soybean
meals for growing pigs: Influence of microbial phytase. J. Anim. Sci. 87:977-983.
AOAC. 2005. Official Methods of Analysis. 18th ed. Assoc. Offic. Anal. Chem. Arlington, VA.
Bohlke, R. A., R. C. Thaler, and H. H. Stein. 2005. Calcium, phosphorus, and amino acid
digestibility in low-phytate corn, normal corn, and soybean meal by growing pigs. J.
Anim. Sci. 83:2396-2403.
Brady, S. M., J. J. Callan, D. Cowan, M. McGrane, and J. V. Doherty. 2002. Effect of phytase
inclusion and calcium/phosphorus ratio on the performance and nutrient retention of
grower-finisher pigs fed barley/wheat/soya bean meal-based diets. J. Sci. Food Agric.
82:1780-1790.
Cromwell, G. L., R. D. Coffey, G. R. Parker, H. J. Monegue, and J. H. Randolph. 1995. Efficacy
of a recombinant-derived phytase in improving the bioavailability of phosphorus in corn-
soybean meal diets for pigs. J. Anim. Sci. 73:2000-2008.
Dilger, R. N., and O. Adeola. 2006. Estimation of true phosphorus digestibility and endogenous
phosphorus loss in growing pigs fed conventional and low-phytate soybean meals. J.
Anim. Sci. 84:627-634.

41
Erdman, J. W., Jr. 1979. Oilseed Phytates: Nutritional implication. J. Am. Oil Chem. Soc. 56:
736-741.
Fan, M. Z., T. Archbold, W. C. Sauer, D. Lackeyram, T. Rideout, Y. Gao, C. F. M. de Lange,
and R. R. Hacker. 2001. Novel methodology allows simultaneous measurement of true
phosphorus digestibility and the gastrointestinal endogenous phosphorus outputs in
studies with pigs. J. Nutr. 131:2388-2396.
Guggenbuhl, P., P. Quintana, and C. S. Nunes. 2007. Comparative effects of three phytases on
phosphorus and calcium digestibility in the growing pig. Livest. Sci. 109:258-260.
Hess, V., and B. Sève. 1999. Effects of body weight and feed intake level on basal ileal
endogenous losses in growing pigs. J. Anim. Sci. 77:3281-3288.
Holst, D. O. 1973. Holst filtration apparatus for Van Soest detergent fiber analysis. J. AOAC.
56:1352-1356.
Lei, X. G., P. K. Ku, E. R. Miller, M. T. Yokoyama, and D. E. Ullrey. 1994. Calcium level
affects the efficacy of supplemental microbial phytase in corn-soybean meal diets of
weanling pigs. J. Anim. Sci. 72:139-143.
Liu, J., D. W. Bollinger, D. R. Ledoux, and T. L. Veum. 1998. Lowering the dietary calcium to
total phosphorus ratio increases phosphorus utilization in low-phosphorus corn-soybean
meal diets supplemented with microbial phytase for growing-finishing pigs. J. Anim. Sci.
76:808-813.
Maga, J. A. 1982. Phytate: Its chemistry, occurrence, food interactions, nutritional significance,
and methods of analysis. J. Agric. Food Chem. 30:1–9.
NRC. 1998. Nutrient requirements of swine. 10th rev. ed. Natl. Acad. Press, Washington, DC.
42
Pedersen C, M. G. Boersma, and H. H. Stein. 2007. Digestibility of energy and phosphorus in ten
samples of distillers dried grains with solubles fed to growing pigs. J. Anim. Sci.
85:1168-1176.
Petersen, G. I., and H. H. Stein. 2006. Novel procedure for estimating endogenous losses and
measurement of apparent and true digestibility of phosphorus by growing pigs. J. Anim.
Sci. 84:2126-2132.
Pettey, L. A., G. L. Cromwell, and M. D. Lindemann. 2006. Estimation of endogenous
phosphorus loss in growing and finishing pigs fed semi-purified diets. J. Anim. Sci.
84:618-626.
Pointillart, A., N. Fontaine, and M. Thomasset. 1984. Phytate phosphorus utilization and
intestinal phosphatases in pigs fed low phosphorus: Wheat or corn diets. Nutr. Rep. Int.
29:473-483.
Selle, P. H., and V. Ravindran. 2008. Phytate-degrading enzymes in pig nutrition. Livest. Sci.
113:99-122.
Selle, P. H., A. J. Cowieson, and V. Ravindran. 2009. Consequences of calcium interactions with
phytate and phytase for poultry and pigs. Livest. Sci. doi: 10.1016/j.livsci.2009.01.006.
Shen, Y., M. Z. Fan, A. Ajakaiye, and T. Archbold. 2002. Use of the regression analysis
technique to determine the true phosphorus digestibility and the endogenous phosphorus
output associated with corn in growing pigs. J. Nutr. 132:1199-1206.
Stein, H. H., and G. C. Shurson. 2009. BOARD INVITED REVIEW: The use and application of
distillers dried grains with solubles (DDGS) in swine diets. J. Anim. Sci. 87:1292-1303.

43
Stein, H. H., S. P. Connot, and C. Pedersen. 2009. Energy and nutrient digestibility in four
sources of distillers dried grains with solubles produced from corn grown within a narrow
geographical area and fed to growing pigs. Asian-Austr. J. Anim. Sci. 22:1016-1025.
Stein, H. H., B. Sève, M. F. Fuller, P. J. Moughan, and C. F. M. de Lange. 2007. Invited review:
Amino acid bioavailability and digestibility in pig feed ingredients: Terminology and
application. J. Anim. Sci. 85:172-180.
Stein, H. H., M. G. Boersma, and C. Pedersen. 2006. Apparent and true total tract digestibility
of phosphorus in field peas (Pisum sativum L.) by growing pigs. Can. J. Anim. Sci.
86:523-525.
Stein, H. H., C. Pedersen, A. R. Wirt, and R. A. Bohlke. 2005. Additivity of values for apparent
and standardized ileal digestibility of amino acids in mixed diets fed to growing pigs. J.
Anim. Sci. 83:2387-2395.
Widmer, M. R., L. M. McGinnis, and H. H. Stein. 2007. Energy, phosphorus, and amino acid
digestibility of high-protein distillers dried grains and corn germ fed to growing pigs. J.
Anim. Sci. 85:2994-3003.

44
Table 3.1. Ingredient composition of experimental diets (as-fed basis), Exp. 1
Ingredient,% Corn Soybean meal DDGS1 P-free
Phytase, FTU/kg2: 0 500 0 500 0 500
Ground corn 97.10 97.10 - - - - -
Soybean meal (48%) - - 40.00 40.00 - - -
DDGS1
- - - - 50.00 50.00 -
Sugar - - 10.00 10.00 20.00 20.00 20.00
Soybean oil 1.00 1.00 3.00 3.00 - - 4.00
Ground limestone 1.18 1.18 1.20 1.20 1.20 1.20 0.80
Salt 0.40 0.40 0.40 0.40 0.40 0.40 0.40
Vitamin mineral premix3 0.30 0.30 0.30 0.30 0.30 0.30 0.30
Phytase premix4 - 0.03 - 0.03 - 0.03 -
Cornstarch 0.03 - 45.10 45.08 28.10 28.08 49.22
Potassium carbonate - - - - - - 0.40
Magnesium oxide - - - - - - 0.10
Solka floc5
- - - - - - 4.00

45
Table 3.1. (Cont.)
Gelatin6
- - - - - - 20.00
AA mixture7 - - - - - - 0.78
1 DDGS = distillers dried grains with solubles.
2 FTU = phytase units.
3 The vitamin-micromineral premix provided the following quantities of vitamins and micro minerals per kilogram of complete
diet: Vitamin A, 11,128 IU; vitamin D3, 2,204 IU; vitamin E, 66 IU; vitamin K, 1.42 mg; thiamin, 0.24 mg; riboflavin, 6.58 mg;
pyridoxine, 0.24 mg; vitamin B12, 0.03 mg; D-pantothenic acid, 23.5 mg; niacin, 44 mg; folic acid, 1.58 mg; biotin, 0.44 mg; Cu, 10
mg as copper sulfate; Fe, 125 mg as iron sulfate; I, 1.26 mg as potassium iodate; Mn, 60 mg as manganese sulfate; Se, 0.3 mg as
sodium selenite; and Zn, 100 mg as zinc oxide.
4 Optiphos 2000, Enzyvia, Sheridan, IN.
5 Fiber Sales and Development Corp., Urbana, OH.
6 Pork gelatin obtained from Gelita Gelatine USA Inc., Sioux City, IA.
7
Provided the following quantities (%) of AA: DL-methionine, 0.27; L-threonine, 0.08; L-tryptophan, 0.14; L-histidine, 0.08;
L-isoleucine, 0.16; and L-valine, 0.05.
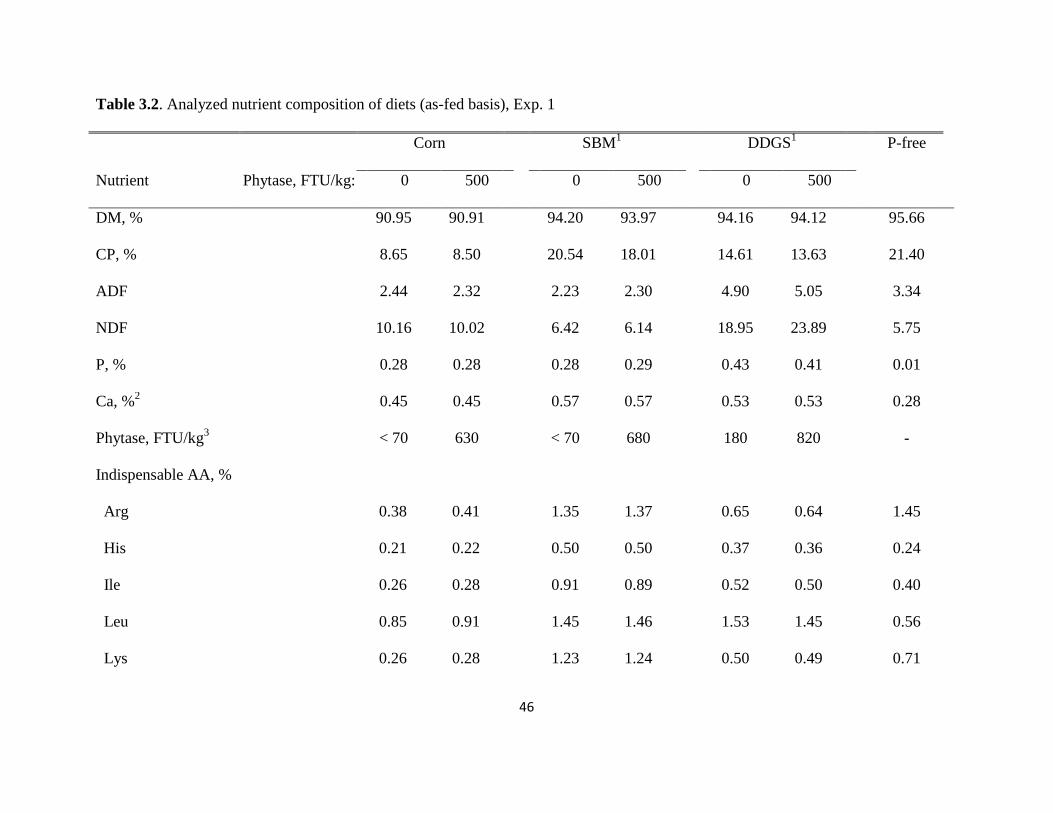
46
Table 3.2. Analyzed nutrient composition of diets (as-fed basis), Exp. 1
Corn SBM1
DDGS1 P-free
Nutrient Phytase, FTU/kg: 0 500 0 500 0 500
DM, % 90.95 90.91 94.20 93.97 94.16 94.12 95.66
CP, % 8.65 8.50 20.54 18.01 14.61 13.63 21.40
ADF 2.44 2.32 2.23 2.30 4.90 5.05 3.34
NDF 10.16 10.02 6.42 6.14 18.95 23.89 5.75
P, % 0.28 0.28 0.28 0.29 0.43 0.41 0.01
Ca, %2
0.45 0.45 0.57 0.57 0.53 0.53 0.28
Phytase, FTU/kg3
< 70 630 < 70 680 180 820 -
Indispensable AA, %
Arg 0.38 0.41 1.35 1.37 0.65 0.64 1.45
His 0.21 0.22 0.50 0.50 0.37 0.36 0.24
Ile 0.26 0.28 0.91 0.89 0.52 0.50 0.40
Leu 0.85 0.91 1.45 1.46 1.53 1.45 0.56
Lys 0.26 0.28 1.23 1.24 0.50 0.49 0.71

47
Table 3.2 (Cont.)
Met 0.15 0.15 0.25 0.25 0.27 0.26 0.38
Phe 0.36 0.38 0.95 0.95 0.64 0.62 0.39
Thr 0.25 0.27 0.70 0.73 0.48 0.45 0.39
Trp 0.06 0.06 0.35 0.38 0.16 0.16 0.15
Val 0.35 0.37 0.94 0.91 0.69 0.66 0.50
Dispensable AA, %
Ala 0.53 0.57 0.84 0.84 0.97 0.94 1.61
Asp 0.49 0.53 2.15 2.17 0.89 0.86 1.07
Cys 0.16 0.16 0.27 0.27 0.26 0.25 0.02
Glu 1.29 1.38 3.53 3.59 2.23 2.22 1.88
Gly 0.30 0.32 0.84 0.84 0.57 0.57 4.31
Pro 0.58 0.63 0.88 0.89 0.95 0.90 2.33
Ser 0.31 0.34 0.86 0.92 0.55 0.52 0.55
Tyr 0.24 0.26 0.68 0.69 0.49 0.47 0.13
1 SBM = soybean meal; DDGS = distillers dried grains with solubles.
48
2
Values for Ca were calculated (NRC, 1998) rather than analyzed.
3 FTU = phytase units per kg, measured by the Phytex Method, version 1; Eurofins, Des Moines, IA.

49
Table 3.3. Ingredient composition of experimental diets (as-fed basis), Exp. 2 and 3
Diet: Corn-SBM1
Corn-SBM-DDGS1
Ingredient,% Phytase, FTU/kg2: 0 500 0 500
Corn 61.76 62.08 47.89 48.15
Soybean meal, 48% 32.00 32.00 26.00 26.00
Distillers dried grains with solubles - - 20.00 20.00
Soybean oil 3.00 3.00 3.00 3.00
Limestone 0.85 1.31 1.15 1.52
Dicalcium phosphate 1.15 0.35 0.65 -
L-lysine HCL 0.28 0.28 0.40 0.40
DL-methionine 0.13 0.13 0.08 0.08
L-threonine 0.13 0.13 0.11 0.11
L-tryptophan - - 0.02 0.02
Salt 0.40 0.40 0.40 0.40
Vitamin-mineral premix3 0.30 0.30 0.30 0.30
Phytase4 - 0.03 - 0.03
1 SBM = soybean meal; DDGS = distillers dried grains with solubles.
2 FTU = phytase units measured by the Phytex Method, version 1; Eurofins, Des Moines,
IA.
3 The vitamin-micromineral premix provided the following quantities of vitamins and
micro minerals per kilogram of complete diet: Vitamin A, 11,128 IU; vitamin D3, 2,204 IU;
vitamin E, 66 IU; vitamin K, 1.42 mg; thiamin, 0.24 mg; riboflavin, 6.58 mg; pyridoxine, 0.24

50
Table 3.3. (Cont.)
mg; vitamin B12, 0.03 mg; D-pantothenic acid, 23.5 mg; niacin, 44 mg; folic acid, 1.58 mg;
biotin, 0.44 mg; Cu, 10 mg as copper sulfate; Fe, 125 mg as iron sulfate; I, 1.26 mg as potassium
iodate; Mn, 60 mg as manganese sulfate; Se, 0.3 mg as sodium selenite; and Zn, 100 mg as zinc
oxide.
4 Optiphos 2000 (2,000 phytase units per gram), Enzyvia, Sheridan, IN.

51
Table 3.4. Nutrient composition of diets (as-fed basis), Exp. 2 and 3
Diet: Corn-SBM1
Corn-SBM-DDGS1
Nutrient Phytase, FTU/kg2: 0 500 0 500
DM, % 85.92 85.02 84.31 85.99
CP, % 19.29 17.93 20.55 20.83
ADF 2.69 2.64 4.31 4.57
NDF 10.26 10.68 18.40 16.62
Ca, % 0.62 0.66 0.60 0.60
P, % 0.59 0.44 0.58 0.48
ATTD3 of P, % of diet P
49.8 66.4 51.7 66.3
STTD4
of P, % of diet 0.32 0.32 0.32 0.32
Phytase, FTU/kg
190 690 140 680
Indispensable AA, %
Arg 1.22 1.26 1.27 1.26
His 0.51 0.53 0.57 0.57
Ile 0.81 0.84 0.88 0.88
Leu 1.53 1.59 1.86 1.85
Lys 1.29 1.37 1.37 1.38
Met 0.38 0.43 0.41 0.40
Phe 0.88 0.92 0.98 0.97
Thr 0.75 0.81 0.81 0.82
Trp 0.24 0.22 0.24 0.24

52
Table 3.4. (Cont.)
Val 0.91 0.94 1.03 1.02
Dispensable AA, %
Ala 0.89 0.93 1.10 1.09
Asp 1.86 1.95 1.90 1.89
Cys 0.30 0.31 0.34 0.34
Glu 3.13 3.27 3.37 3.34
Gly 0.77 0.81 0.85 0.85
Pro 0.96 1.00 1.16 1.16
Ser 0.69 0.76 0.76 0.75
Tyr 0.59 0.61 0.69 0.66
1 SBM = soybean meal; DDGS = distillers dried grains with solubles.
2
FTU = phytase units measured by the Phytex Method, version 1; Eurofins, Des Moines,
IA.
3 Calculated based on values for ATTD in corn, SBM, and DDGS obtained in Exp. 1. For
dicalcium phosphate, a value for ATTD of P of 81% was used (Petersen and Stein, 2006).
4 STTD of P = standardized total tract digestible P; values calculated based on
digestibility values measured in Exp. 1. For dicalcium phosphate, a value of 88% was used
(Petersen and Stein, 2006).
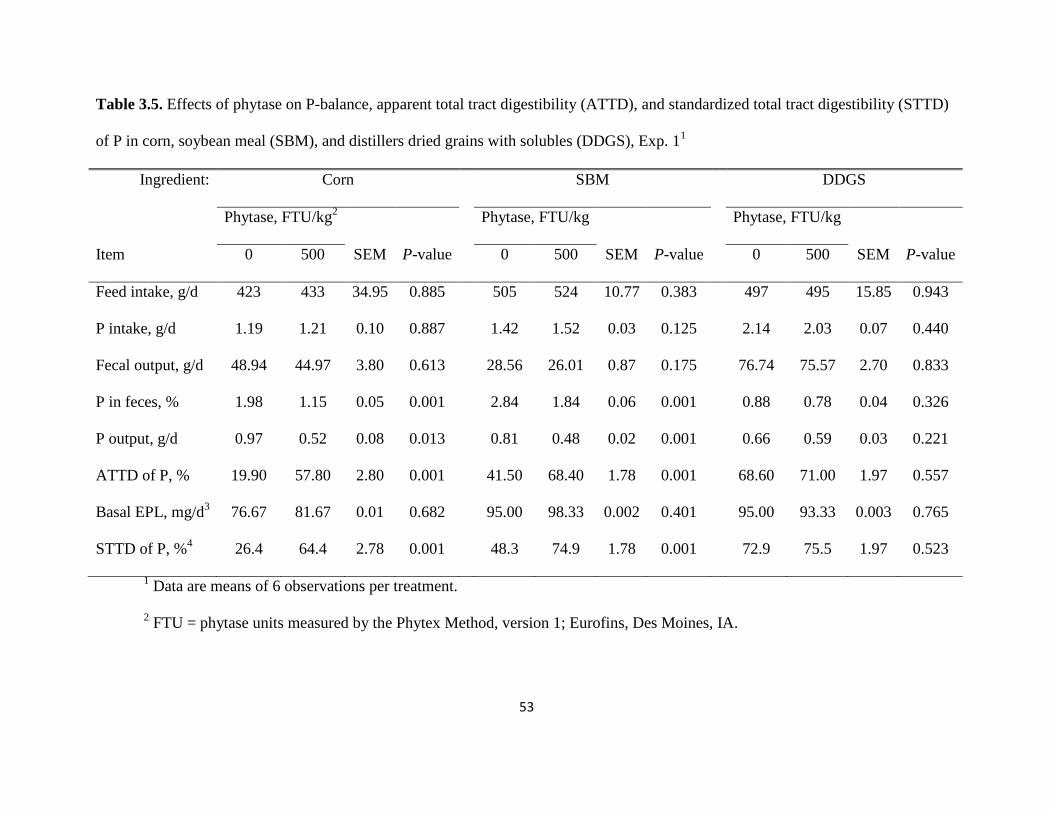
53
Table 3.5. Effects of phytase on P-balance, apparent total tract digestibility (ATTD), and standardized total tract digestibility (STTD)
of P in corn, soybean meal (SBM), and distillers dried grains with solubles (DDGS), Exp. 11
Ingredient: Corn SBM DDGS
Phytase, FTU/kg2
Phytase, FTU/kg
Phytase, FTU/kg
Item 0 500 SEM P-value 0 500 SEM P-value 0 500 SEM P-value
Feed intake, g/d 423 433 34.95 0.885 505 524 10.77 0.383 497 495 15.85 0.943
P intake, g/d 1.19 1.21 0.10 0.887 1.42 1.52 0.03 0.125 2.14 2.03 0.07 0.440
Fecal output, g/d 48.94 44.97 3.80 0.613 28.56 26.01 0.87 0.175 76.74 75.57 2.70 0.833
P in feces, % 1.98 1.15 0.05 0.001 2.84 1.84 0.06 0.001 0.88 0.78 0.04 0.326
P output, g/d 0.97 0.52 0.08 0.013 0.81 0.48 0.02 0.001 0.66 0.59 0.03 0.221
ATTD of P, % 19.90 57.80 2.80 0.001 41.50 68.40 1.78 0.001 68.60 71.00 1.97 0.557
Basal EPL, mg/d3
76.67 81.67 0.01 0.682 95.00 98.33 0.002 0.401 95.00 93.33 0.003 0.765
STTD of P, %4 26.4 64.4 2.78 0.001 48.3 74.9 1.78 0.001 72.9 75.5 1.97 0.523
1 Data are means of 6 observations per treatment.
2 FTU = phytase units measured by the Phytex Method, version 1; Eurofins, Des Moines, IA.
54
Table 3.5. (Cont.)
3 EPL = endogenous P loss was measured from pigs fed the P-free diet at 199 mg/kg DMI. The daily basal EPL (mg/d) for
each diet was calculated by multiplying the EPL (mg/kg DMI) by the daily DMI of each diet.
4 Values for STTD were calculated by correcting values of ATTD for basal endogenous losses.
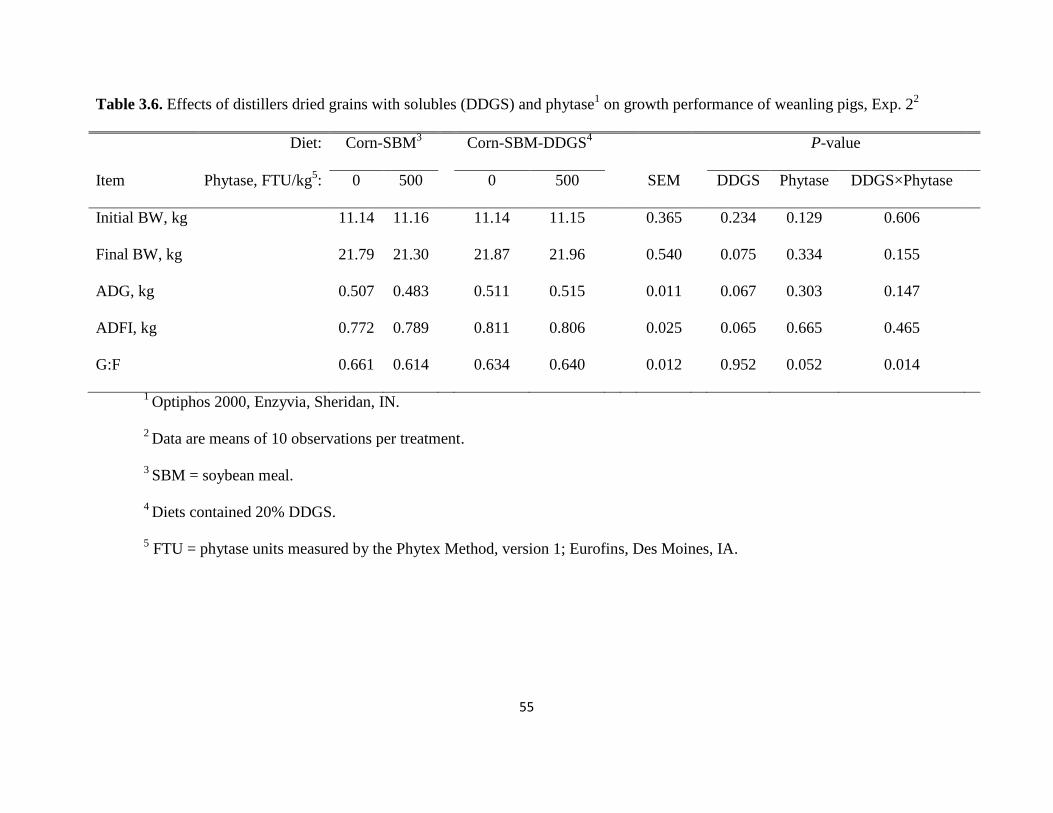
55
Table 3.6. Effects of distillers dried grains with solubles (DDGS) and phytase1 on growth performance of weanling pigs, Exp. 2
2
Diet: Corn-SBM3
Corn-SBM-DDGS4 P-value
Item Phytase, FTU/kg5: 0 500 0 500 SEM DDGS Phytase DDGS×Phytase
Initial BW, kg 11.14 11.16 11.14 11.15 0.365 0.234 0.129 0.606
Final BW, kg 21.79 21.30 21.87 21.96 0.540 0.075 0.334 0.155
ADG, kg 0.507 0.483 0.511 0.515 0.011 0.067 0.303 0.147
ADFI, kg 0.772 0.789 0.811 0.806 0.025 0.065 0.665 0.465
G:F 0.661 0.614 0.634 0.640 0.012 0.952 0.052 0.014
1 Optiphos 2000, Enzyvia, Sheridan, IN.
2 Data are means of 10 observations per treatment.
3 SBM = soybean meal.
4 Diets contained 20% DDGS.
5 FTU = phytase units measured by the Phytex Method, version 1; Eurofins, Des Moines, IA.

56
Table 3.7. Phosphorus and Ca balance, and apparent total tract digestibility (ATTD) of P for pigs fed corn-soybean meal (SBM) diets
or corn-SBM-distillers dried grains with solubles (DDGS) diets without or with microbial phytase, Exp. 31
Diet: Corn-SBM
Corn-SBM-DDGS2 P-value
Item Phytase, FTU/kg3: 0 500 0 500 SEM DDGS Phytase DDGS×Phytase
Feed intake, g/d 633.3 657.8 652.8 658.0 23.368 0.611 0.445 0.618
P intake, g/d 3.74 2.89 3.79 3.16 0.131 0.178 < 0.01 0.351
Fecal P output, g/d 1.68 0.82 1.43 0.82 0.042 < 0.01 < 0.01 < 0.01
ATTD of P, % 56.1 71.5 62.3 74.1 1.240 < 0.01 < 0.01 0.153
Urine P output, mg/d 2.55 1.32 3.44 1.16 0.647 0.559 0.011 0.399
Absorbed P, g/d 2.05 2.07 2.35 2.33 0.125 0.029 0.991 0.829
P retention, g/d 2.05 2.07 2.35 2.33 0.125 0.029 0.991 0.879
P retention, % 56.03 71.48 62.16 74.01 1.234 < 0.01 < 0.01 0.156
P excretion, g/d 1.68 0.82 1.43 0.82 0.042 < 0.01 < 0.01 <0.01
Ca intake, g/d 3.93 4.34 3.92 3.95 0.145 0.108 0.078 0.125
Fecal Ca output, g/d 1.21 0.85 1.12 0.75 0.083 0.230 < 0.01 0.940
ATTD of Ca, % 69.65 80.42 71.22 81.04 2.222 0.613 < 0.01 0.824

57
Table 3.7. (Cont.)
Urine Ca output, g/d 0.24 0.74 0.14 0.42 0.050 < 0.01 < 0.01 0.045
Absorbed Ca, g/d 2.72 3.49 2.80 3.20 0.170 0.493 <0.01 0.232
Ca retention, g/d 2.48 2.75 2.66 2.78 0.154 0.566 0.231 0.701
Ca retention, % 63.24 63.44 67.70 70.49 2.633 0.041 0.577 0.623
Ca excretion, g/d 1.45 1.59 1.26 1.17 0.101 <0.01 0.823 0.277
1 Data represent the mean of 6 observations per treatment.
2 Diets contained 20% DDGS.
3 FTU = phytase units measured by the Phytex Method, version 1; Eurofins, Des Moines, IA.

58
CHAPTER 4
EFFECTS OF A NOVEL PHYTASE IN CORN-SOYBEAN MEAL FED TO WEANLING
AND GROWING PIGS
ABSTRACT
Two experiments were conducted to evaluate the effects of adding a novel bacterial 6-phytase
expressed in a strain of Aspergillus oryzae (Ronozyme HiPhos, DSM Nutritional Products,
Parsippany, NJ) on the apparent total tract digestibility (ATTD) of P in corn soybean meal diets
fed to weanling and growing pigs. In Exp. 1, 6 diets were formulated. The positive control diet
was a corn-soybean meal diet that contained dicalcium phosphate to bring the total concentration
of P to 0.66%. A negative control diet (0.36% P) without dicalcium phosphate was also
formulated. Four additional diets that were similar to the negative control diet with the exception
that they contained microbial phytase at levels of 500, 1,000, 2,000, or 4,000 phytase units
(FTU) per kg were also formulated. Forty eight weanling pigs (initial BW: 13.5 ± 2.45 kg) were
placed in metabolism cages and randomly allotted to the 6 dietary treatments in a randomized
complete block design. Feces were collected over a 5-d period. The total P output and the P
concentration in feces were reduced (linear and quadratic, P < 0.01) as phytase was added to the
negative control diet. The ATTD of P was greater (P < 0.01) for the positive control diet (60.5%)
than for the negative control diet (40.5%), but increased (linear and quadratic, P < 0.01) as
phytase was added to the negative control diet (40.5 vs. 61.6, 65.1, 68.7, and 68.0%). The
breakpoint for the ATTD of P (68.4%) was reached at a phytase inclusion level of 1,016 FTU/kg.
In Exp. 2, 6 diets were formulated using the same principles as in Exp. 1. A total of 24 growing

59
pigs (initial BW: 36.2 ± 4.0 kg) were randomly allotted to the 6 dietary treatments in a balanced
2 period changeover design. The total P output and P concentration in feces were reduced (linear
and quadratic, P < 0.01) as phytase was added to the negative control diet. The ATTD of P was
greater (P < 0.01) for the positive control diet (59.4%) than for the negative control diet (39.8%)
and increased (linear and quadratic, P < 0.01) as phytase was added to the negative control diet
(39.8 vs. 58.1, 65.4, 69.1, and 72.8%). The breakpoint for the ATTD of P (69.1%) was reached at
a phytase inclusion level of 801 FTU/kg. In conclusion, Ronozyme HiPhos improved the ATTD
of P and reduced P excretion in both weanling and growing pigs.
Key words: calcium, digestibility, phosphorus, pigs, phytase
INTRODUCTION
Most of the P in cereal grains and oilseeds is bound in phytate (Erdman, 1979). Because
pigs lack endogenous phytases, phytate cannot be digested in the small intestine (Selle and
Ravindran, 2008). As a consequence, large amounts of P are excreted in the manure, which may
potentially cause environmental pollution. Divalent cations such as Ca likely form insoluble
phytate complexes, which may reduce the hydrolysis of phytate. Phytases are enzymes capable
of hydrolyzing the phytate molecule, which results in the release of the P in phytate as well as
Ca, which can then be absorbed and utilized by pigs (Selle and Ravindran, 2008). Addition of
microbial phytase to swine diets, therefore, improves P utilization by pigs (Cromwell et al.,
1993; Akinmusire and Adeola, 2009). Phytases are classified based on where they initiate the
hydrolysis of the phytate molecule (Brana et al., 2006). Most of microbial phytases are classified
as 3 or 6-phytases. A 3-phytase initiates the hydrolysis of phytate at the third phosphate ester

60
group, while a 6-phytase initiates hydrolysis of phytate at the sixth phosphate ester group on the
phytate molecule (Brana et al., 2006). Several microbial phytases are commercially available and
the inclusion of exogenous phytase to swine diets has become a routine practice, but new and
more efficient microbial phytases are constantly being developed. A novel bacterial 6-phytase
(Ronozyme HiPhos, DSM Nutritional Products, Parsippany, NJ) produced from Aspergillus
oryzae was developed, but there is no information on the effectiveness of this phytase when fed
to pigs. Therefore, 2 experiments were conducted to test the hypothesis that inclusion of
Ronozyme HiPhos in a corn-soybean meal diet will increase the digestibility of P and Ca by
weanling and growing pigs.
MATERIALS AND METHODS
Diets, Animals, and Experimental Design, Exp. 1
Six diets were formulated (Tables 4.1 and 4.2). The positive control diet was a corn-
soybean meal diet that contained quantities of Ca and P sufficient to meet the requirement of Ca
and P for weanling (10-20 kg) pigs (NRC, 1998). Dicalcium phosphate and limestone were used
to bring the total concentration of P and Ca in this diet to 0.66 and 0.86%, respectively. A
negative control diet that was similar to the positive control diet with the exception that
cornstarch replaced dicalcium phosphate was also formulated. This diet contained 0.36% P and
0.48% Ca. Four additional diets that were similar to the negative control diet with the exception
that microbial phytase (Ronozyme HiPhos, DSM Nutritional Products, Passipany, NJ) was
included in the amounts of 500, 1,000, 2,000, or 4,000 phytase units (FTU) were also
formulated.

61
A total of 48 weanling pigs (initial BW: 13.5 ± 2.45 kg) were used in a randomized
complete block design. Pigs were the offspring of Landrace boars that were mated to Large
White x Duroc sows (Pig Improvement Company, Hendersonville, TN). Pigs were blocked by
BW and randomly allotted to the 6 dietary treatments in 8 blocks using the Experimental Animal
Allotment Program (Kim and Lindemann, 2007). Pigs were placed in metabolism cages
equipped with a feeder and a nipple drinker that allowed for total collection of feces.
Diets, Animals, and Experimental Design, Exp. 2
Six diets were also formulated for Exp. 2 (Tables 4.3 and 4.4). The positive control diet
was a corn-soybean meal diet that contained Ca and P in quantities sufficient to meet the
requirement of Ca and P for 20-50 kg pigs (NRC, 1998). Dicalcium phosphate and limestone
were used to bring the total concentration of P and Ca in this diet to 0.56 and 0.79%,
respectively. A negative control diet that was similar to the positive control diet with the
exception that cornstarch replaced dicalcium phosphate was also formulated. This diet contained
0.33% P and 0.58% Ca. Four additional diets that were similar to the negative control diet were
formulated to contain the same levels of phytase as in the diets used in Exp. 1. A total of 24
growing barrows were used in a 2 period changeover design (Gill and Magee, 1976). Pigs were
the offspring of Landrace boars that were mated to Large White × Duroc sows (Pig Improvement
Company, Hendersonville, TN). In period 1, pigs (initial BW of 36.2 ± 4.0 kg) were placed
individually in metabolism cages and randomly allotted to the 6 dietary treatments in 4 blocks
based on BW using the Experimental Animal Allotment Program (Kim and Lindemann, 2007).
In period 2, the same pigs (initial BW of 47.3 ± 5.3 kg) used in period 1were allotted in a way
that potential residual effects were balanced (i.e., one pig did not receive the same dietary

62
treatment as in period 1, and one dietary treatment did not follow another dietary treatments
more than once). The cages were equipped with a feeder and a nipple drinker.
Feeding and Sample Collection, Exp. 1 and Exp. 2
The amount of feed provided daily was calculated as 3 times the estimated requirement
for maintenance energy (i.e., 106 kcal ME per kg 0.75
; NRC, 1998) and divided into 2 equal
meals. Water was available at all times. The initial 5 d were considered an adaptation period to
the diet. From d 6 to 11, fecal materials were collected according to the marker to marker
approach (Adeola, 2001). Chromic oxide and ferric oxide were used to determine the beginning
and the conclusion of collections, respectively. Fecal samples were stored at -20˚C immediately
after collection.
Sample Analysis and Data Processing, Exp. 1 and Exp. 2
At the conclusion of each experiment, fecal samples were dried in a forced air oven and
finely ground. Fecal samples and diets were analyzed for Ca and P by inductively coupled
plasma (ICP) spectroscopy (method 985.01; AOAC Int., 2007) after wet ash sample preparation
(method 975.03; AOAC Int., 2007). Diets were also analyzed for AA (method 982.30 E (a, b, c);
AOAC Int., 2007), ADF (method 973.18; AOAC Int., 2007), NDF (Holst, 1973), DM by oven
drying at 135°C for 2 h (method 930.15; AOAC Int., 2007), ash (method 942.05; AOAC Int.,
2007), CP (method 990.03; AOAC Int., 2007) using an Elementar Rapid N-cube protein/nitrogen
apparatus (Elementar Americas Inc., Mt. Laurel, NJ), and for phytase activity (DSM Nutritional
Products, Passipany, NJ).
The apparent total tract digestibility (ATTD) of P in each diet was calculated according to
the following equation:
ATTD (%) = [(Pi – Pf)/Pi] x 100,

63
where Pi = total P intake (g) from d 6 to 11 and Pf = total fecal P output (g) originating from the
feed that was provided from d 6 to 11(Petersen and Stein., 2006).
For Exp. 1, data were analyzed as a randomized complete block design using the Proc
Mixed Procedure in SAS. The UNIVARIATE procedure was used to verify homogeneity of
variances and to identify outliers. The model included diet as the main effect and block as a
random effect. For Exp. 2, data were analyzed as a changeover design using the Proc Mixed
Procedure in SAS. The UNIVARIATE procedure was used to verify homogeneity of variances
and to identify outliers. One outlier was identified and removed from the data set. The model
included diet as the main effect while block and period were random effects. The effects of block
and period were not significant and, therefore, sequentially removed from the final model. For
both experiments, a contrast of the positive control diet vs. the negative control diet was
performed to analyze the effects of removing inorganic P from the diets, and orthogonal
polynomial contrasts were conducted to test linear and quadratic responses to the inclusion of
phytase in the diets. Appropriate coefficients for unequally spaced concentrations of
supplemental phytase were obtained using the interactive matrix language procedure (Proc IML)
of SAS. The minimum level of phytase that was needed to maximize the ATTD of P and Ca
were estimated by subjecting the treatment means to a least squares broken-line analysis as
described by Robbins et al. (2006). The pig was the experimental unit for all analyses and an
alpha level of 0.05 was used to assess significance among means.

64
RESULTS
Exp. 1, Weanling Pigs
There was no difference in feed intake and in fecal output among treatments (Table 4.5).
Phosphorus intake was greater (P < 0.01) for pigs fed the positive control diet than for pigs fed
the negative control diet. The concentration of P excreted in the feces was lower (P < 0.05) for
pigs fed the negative control diet than for pigs fed the positive control diet. Likewise, pigs that
were fed phytase containing diets had less (linear and quadratic, P < 0.01) concentration of P in
feces than pigs fed the negative control diet. The daily P output was also less (P < 0.01) for pigs
fed the negative control diet than for pigs fed the positive control diet, and the inclusion of
increasing levels of phytase to the negative control diet caused linear and quadratic reductions (P
< 0.01) in P output. The ATTD of P was greater (P < 0.01) for pigs fed the positive control diet
than for pigs fed the negative control diet (60.5 vs. 40.5%), but, the ATTD of P increased (linear
and quadratic, P < 0.01) as phytase was added to the negative control diet (61.6, 65.1, 68.7, and
68.0% for pigs fed diets containing 500, 1,000, 2,000, or 4,000 FTU of phytase, respectively).
Phosphorus absorption was greater (P < 0.01) for pigs fed the positive control diet than for pigs
fed the negative control diet (2.6 vs. 0.9 g/d), but the addition of phytase to the negative control
diet increased (linear and quadratic, P < 0.01) P absorption to 1.4, 1.5, 1.5, and 1.5 g/d. The
breakpoint for phytase concentration resulted in an ATTD of P of 68.4%, which was reached
when 1,016 FTU/kg of phytase was added to the diet (Figure 4.1).
Calcium intake was greater (P < 0.01) for pigs fed the positive control diet than for pigs
fed the negative control diet (5.6 vs. 3.0 g/d). Pigs that were fed phytase containing diets tended
(P = 0.06) to have a greater Ca intake than pigs fed the negative control diet. Concentration of Ca
in feces was greater (P < 0.05) for pigs fed the positive control diet compared with pigs fed the

65
negative control diet (2.29 vs. 1.86%), but pigs fed phytase containing diets had less Ca
concentration in feces than pigs fed the negative control diet (linear and quadratic, P < 0.01). The
daily Ca output was also greater (P < 0.01) for pigs fed the positive control diet than for pigs fed
the negative control diet (1.5 vs. 1.1 g/d), but the addition of 500, 1,000, 2,000, or 4,000 FTU/kg
of phytase to the negative control diet reduced (linear and quadratic, P < 0.01) Ca output to 0.80,
0.60, 0.52, and 0.50%, respectively. The ATTD of Ca was greater (P < 0.05) for pigs fed the
positive control diet than for pigs fed the negative control diet (72.5 vs. 63.9%), but pigs fed
diets containing 500, 1,000, 2,000, or 4,000 FTU/kg of phytase had greater (linear and quadratic,
P < 0.01) ATTD of Ca than pigs fed the negative control diet (73.7, 81.7, 84.8, and 84.6%). The
absorption of Ca was reduced (P < 0.01) from 4.0 to 2.0 g/d for pigs fed the negative control diet
rather than the positive control diet, but Ca absorption was increased (linear and quadratic, P <
0.01) for pigs fed phytase containing diets compared with pigs fed the negative control diet (2.0
vs. 2.2, 2.7, 3.0, and 2.7 g/d). The breakpoint for phytase concentration was reached when 1,155
FTU/kg of phytase was added to the diet. This inclusion level resulted in an ATTD of Ca of
84.7% (Figure 4. 2).
Exp. 2, Growing Pigs
Throughout the experiment, pigs remained healthy and readily consumed their diets. One
of the pigs, however, was removed from the experiment due to coprophagy. No differences in
feed intake were observed among treatments (Table 4.6). Phosphorus intake was greater (P <
0.01) for pigs fed the positive control diet than for pigs fed the negative control diet (8.5 vs. 4.8
g/d). Fecal output tended (P = 0.08) to be greater for pigs fed the positive control diet than for
pigs fed the negative control diet. The P concentration in feces was less (linear and quadratic, P
< 0.01) for pigs fed phytase containing diets than for pigs fed the negative control diet. The daily
66
P output was less (P < 0.01) for pigs fed the negative control diet than for pigs fed the positive
control diet (2.9 vs. 3.4 g/d), and the addition of phytase to the negative control diet reduced
(linear and quadratic, P < 0.01) the daily P output (2.1, 1.8, 1.5, and 1.4 g/d). The ATTD of P
was greater (P < 0.01) for pigs fed the positive control diet than for pigs fed the negative control
diet (59.4 vs. 39.8%). Pigs fed phytase containing diets also had greater (linear and quadratic, P
< 0.01) ATTD of P than pigs fed the negative control diet (58.1, 65.4, 69.1, and 72.8%).
Phosphorus absorption was greater (P < 0.01) for pigs fed the positive control diet than for pigs
fed the negative control diet (5.1 vs. 1.9 g/d), and the addition of phytase to the negative control
diet increased (linear and quadratic, P < 0.01) absorption of P to 3.0, 3.3, 3.5, and 3.7 g/d.
Calcium intake was greater (P < 0.01) for pigs fed the positive control diet than for pigs
fed the negative control diet (12.0 vs. 8.5 g/d). Concentration of Ca in feces was reduced (linear
and quadratic, P < 0.01) as phytase was added to the negative control diet (2.33 vs. 1.40, 1.29,
1.22, and 0.91%). The daily Ca output tended (P = 0.07) to be greater for pigs fed the positive
control diet compared with pigs fed the negative control diet (3.2 vs. 2.7 g/d), but addition of
phytase to the negative control diet reduced (linear and quadratic, P < 0.01) the daily Ca output
to 1.6, 1.5, 1.5, and 1.1 g/d. There was also a tendency (P = 0.07) for pigs fed the positive control
diet to have a greater ATTD of Ca than pigs fed the negative control diet (72.9 vs. 67.3%). As
phytase was added to the negative control diet, the ATTD of Ca increased (linear and quadratic,
P < 0.01) to 81.4, 82.6, 82.4, and 85.6%. Calcium absorption was greater (P < 0.01) for pigs fed
the positive control diet than for pigs fed the negative control diet (8.8 vs. 5.7 g/d). Likewise,
pigs fed phytase containing diets had greater (P < 0.01) absorption of Ca than pigs fed the
negative control diet.
67
The breakpoint for phytase concentration resulted in an ATTD of P of 69.1%, which was
reached when 801 FTU/kg of phytase was added to the diet (Figure 4.3). For the ATTD of Ca,
the breakpoint for phytase concentration was reached when 574 FTU/kg of phytase was added to
the diet, which resulted in an ATTD of Ca of 83.5% (Figure 4.4).
DISCUSSION
Phytase supplementation increased P digestibility, which was expected because phytase
hydrolyses the phytate molecule in corn and SBM, and therefore, releases some of the P that is
bound to the phytate molecule (Cromwell et al., 1993). The beneficial effect of various microbial
phytases on the ATTD of P in corn-soybean meal diets has been demonstrated (Kerr et al.,
2009). There are, however, no data on the effect of adding the new bacterial 6-phytase,
Ronozyme HiPhos to diets for swine. The values for the ATTD of P measured in the present
experiment for weanling pigs are in agreement with those measured by Lei et al. (1993) and Qian
et al. (1996). In the case of growing pigs, research conducted by Harper et al. (1997) and
Johnston et al. (2004) also resulted in P digestibility values that were similar to the P digestibility
values measured in the present experiment. The present data also demonstrates that P
digestibility reaches a plateau at levels of 1,016 and 801FTU/kg (Exp.1 and Exp. 2,
respectively), which is in agreement with previous work showing maximum responses to a
fungal phytase at levels around 1,000 FTU/kg in corn-SBM diets (Beers and Jongbloed, 1992;
Kornegay and Qian, 1996; Yi et al., 1996). Because P is better utilized by pigs when phytase is
added to corn-soybean meal diets, the fecal excretion of P is reduced, which is in agreement with
data from Selle and Ravindran (2008). Results from the present experiment showed that

68
improvements on the ATTD of P by the addition of Ronozyme HiPhos to corn-soybean meal
diets are of similar magnitude as other commercially available 6-phytases (Kerr et al., 2009).
The concentration of Ca in the feces was reduced by the addition of phytase to the diets
because the ATTD of Ca was increased. These results are in agreement with data reported by
Pallauf et al. (1992), Lei et al. (1993), and Guggenbuhl et al. (2007). The Ca digestibility values
that were measured in the present experiments are comparable with those measured by Qian et
al. (1996) and Harper et al. (1997) for weanling and growing pigs, respectively. To our
knowledge, there are no previous data on the effects of graded levels of phytase on Ca
digestibility, but results of this experiment demonstrated that Ca digestibility in corn-soybean
meal diets is maximized if 1,155 or 574 FTU/kg of phytase are added to diets fed to weanling or
growing pigs, respectively. One possible reason for the increase in Ca digestibility with
supplemental phytase is that in the process of phytate hydrolysis, phytate esters are reduced and
as a consequence, the ability of phytate to chelate Ca is also reduced (Selle et al., 2009). The
present data are in agreement with Adeola et al. (1995) who also verified that Ca absorption is
increased when phytase is supplemented to corn-soybean meal diets.
Although our objective was not to compare P and Ca digestibility between weanling and
growing pigs, it is notable that the digestibility values for P and Ca obtained for weanling and
growing pigs were very similar. This observation is in agreement with data from Kemme et al.
(1997) who also concluded that there are no differences in the digestibility of P and Ca between
weanling pigs and growing-finishing pigs.
Conclusions
Results from the present experiments show that bacterial 6-phytase obtained from
Aspergillus oryzae (Ronozyme HiPhos) may be used in corn-soybean meal diets to improve the

69
ATTD of P and Ca. Inclusion levels of 800 to 1,000 FTU/kg of phytase will result in maximum
ATTD of P and Ca and no further increases in ATTD of P and Ca are achieved by supplementing
Ronozyme HiPhos phytase at levels greater than 1,000 FTU/kg. Supplementation of corn-
soybean meal diets with Ronozyme HiPhos phytase also results in a reduction of P excretion in
the feces of the pigs.

70
LITERATURE CITED
Adeola, O. 2001. Digestion and balance techniques in pigs. Pages 903-916 in Swine Nutrition.
A. J. Lewis and L. L. Southern, eds. CRC Press, Washington, DC. Swine Nutrition, 2nd
ed. CRC Press, N. Y.
Akinmusire, A. S., and O. Adeola. 2009. True digestibility of phosphorus in canola and soybean
meals for growing pigs: Influence of microbial phytase. J. Anim. Sci. 87:2766-2775.
AOAC Int. 2007. Official Methods of Analysis .18th ed. Rev. 2. W. Howitz, and G. W. Latimer
Jr., ed. AOAC Int., Gaithersburg, MD.
Beers, S., and A. W. Jongbloed. 1992. Effect of supplementary Aspergillus niger phytase in diets
for piglets on their performance and apparent digestibility of phosphorus. Anim. Prod.
55:425-430.
Bohlke, R. A., R. C. Thaler, and H. H. Stein. 2005. Calcium, phosphorus, and amino acid
digestibility in low-phytate corn, normal corn, and soybean meal by growing pigs. J.
Anim. Sci. 83:2396-2403.
Brana, D. V., M. Ellis, E. O. Castaneda, J. S. Sands, and D. H. Baker. 2006. Effects of a novel
phytase on growth performance, bone ash, and mineral digestibility in nursery and
grower-finisher pigs. J. Anim. Sci. 84:1839-1849.
Cromwell, G. L., T. S. Stahly, R. D. Coffey, H. J. Monegue, and J. H. Randolph. 1993. Efficacy
of phytase in improving the bioavailability of phosphorus in soybean meal and corn-
soybean meal diets for pigs. J. Anim. Sci. 71:1831-1840.
Erdman, J. W., Jr. 1979. Oilseed Phytates: Nutritional implication. J. Am. Oil. Chem. Soc. 56:
736-741.

71
Gill, J. L., and W. T. Magee. 1976. Balanced two-period changeover designs for several
treatments. J. Anim. Sci. 42:775-777.
Guggenbuhl, P., P. Quintana, and C. S. Nunes. 2007. Comparative effects of three phytases on
phosphorus and calcium digestibility in the growing pig. Livest. Sci. 109:258-260.
Harper, A. F., E. T. Kornegay, and T. C. Schell. 1997. Phytase supplementation of low-
phosphorus growing-finishing pig diets improves performance, phosphorus digestibility,
and bone mineralization and reduces phosphorus excretion. J. Anim. Sci. 75:3174-3186.
Holst, D. O. 1973. Holst filtration apparatus for Van Soest detergent fiber analysis. J. AOAC
56:1352–1356.
Johnston, S. L., S. B. Williams, L. L. Southern, T. D. Bidner, L. D. Bunting, J. O. Matthews, and
B. M. Olcott. 2004. Effect of phytase addition and dietary calcium and phosphorus levels
on plasma metabolites and ileal and total-tract nutrient digestibility in pigs. J. Anim. Sci.
82:705-714.
Kim, B. G., and M. D. Lindemann. 2007. A new spreadsheet method for the experimental animal
allotment. J. Anim. Sci. 85 (Suppl. 2):218. (Abstr.)
Kemme, P. A., A. W. Jongbloed, Z. Mroz, and A. C. Beynen. 1997. The efficacy of Aspergillus
niger phytase in rendering phytate phosphorus available for absorption in pigs is
influenced by pig physiological status. J. Anim. Sci. 75:2129-2138.
Kerr, B. J., T. E. Weber, P. S. Miller, and L. L. Southern. 2009. Effect of phytase on apparent
total tract digestibility of phosphorus in corn-soybean meal diets fed to finishing pigs. J.
Anim. Sci. 88:238-247.
Kornegay, E. T., and H. Qian. 1996. Replacement of inorganic phosphorus by microbial phytase
for young pigs fed on a maize-soyabean-meal diet. Br. J. Nutr. 76:563-578.

72
Lei, X. G., P. K. Ku, E. R. Miller, and M. T. Yokoyama. 1993. Supplementing corn-soybean
meal diets with microbial phytase linearly improves phytate phosphorus utilization by
weanling pigs. J. Anim. Sci. 71:3359-3367.
NRC. 1998. Nutrient requirements of swine. 10th rev. ed. Natl. Acad. Press, Washington, DC.
Pallauf, J., D. Hohler, G. Rimback and H. Neusser. 1992. Effect of microbial phytase
supplementation to a maize-soya-diet on the apparent absorption of phosphorus and
calcium in piglets. J. Anim. Physiol. Anim. Nutr. 67:30-40.
Petersen, G. I., and H. H. Stein. 2006. Novel procedure for estimating endogenous losses and
measurement of apparent and true digestibility of phosphorus by growing pigs. J. Anim.
Sci. 84:2126-2132.
Qian, H., E. T. Kornegay, and D. E. Conner, Jr. 1996. Adverse effects of wide
calcium:phosphorus ratios on supplemental phytase efficacy for weanling pigs fed two
dietary phosphorus levels. J. Anim. Sci 74:1288-1297.
Robbins, K. R., A. M. Saxton, and L. L. Southern. 2006. Estimation of nutrient requirements
using broken-line regression analysis. J. Anim. Sci. 84:155-165.
Selle, P. H., and V. Ravindran. 2008. Phytate-degrading enzymes in pig nutrition. Livest. Sci.
113:99-122.
Selle, P. H., A. J. Cowieson, and V. Ravindran. 2009. Consequences of calcium interactions with
phytate and phytase for poultry and pigs. Livest. Sci. doi:10.1016/j.livsci.2009.01.006.
Yi, Z., E. T. Kornegay, V. Ravindran, M. D. Lindemann, and J. H. Wilson. 1996. Effectiveness
of Natuphos® phytase in improving the bioavailabilities of phosphorus and other nutrients
in soybean meal based semipurified diets for young pigs. J. Anim. Sci. 74:1601-1611.

73
Table 4.1. Composition (as-is basis) of experimental diets, Exp. 1
Diets
Ingredient, %
Positive
Control
Negative
Control
Negative control + Phytase (FTU/kg)1
500 1,000 2,000 4,000
Ground corn 60.60 60.60 60.60 60.60 60.60 60.60
Soybean meal, 48% 32.00 32.00 32.00 32.00 32.00 32.00
Soybean oil 3.00 3.00 3.00 3.00 3.00 3.00
Ground limestone 0.90 0.90 0.90 0.90 0.90 0.90
Dicalcium phosphate 1.65 - - - - -
Cornstarch - 1.65 1.625 1.60 1.55 1.45
L-lysine HCL 0.15 0.15 0.15 0.15 0.15 0.15
Salt 0.40 0.40 0.40 0.40 0.40 0.40
Phytase premix 2 - - 0.025 0.05 0.10 0.20
Vit. mineral premix 3 0.30 0.30 0.30 0.30 0.30 0.30
Mecadox premix 4 1.00 1.00 1.00 1.00 1.00 1.00
Total 100.00 100.00 100.00 100.00 100.00 100.00
1FTU = phytase units.

74
Table 4.1 (Cont.)
2Ronozyme HiPhos, DSM Nutritional Products, Parsippany, NJ. Produced by mixing
3.4% of concentrated phytase (58,700 units/g) and 96.6% cornstarch.
3Provided the following quantities of vitamins and micro minerals per kilogram of
complete diet: Vitamin A, 11,128 IU; vitamin D3, 2,204 IU; vitamin E, 66 IU; vitamin K, 1.42
mg; thiamin, 0.24 mg; riboflavin, 6.58 mg; pyridoxine, 0.24 mg; vitamin B12, 0.03 mg; D-
pantothenic acid, 23.5 mg; niacin, 44 mg; folic acid, 1.58 mg; biotin, 0.44 mg; Cu, 10 mg as
copper sulfate; Fe, 125 mg as iron sulfate; I, 1.26 mg as potassium iodate; Mn, 60 mg as
manganese sulfate; Se, 0.3 mg as sodium selenite; and Zn, 100 mg as zinc oxide.
4The Mecadox premix (Phibro Animal Health, NJ) provided 55 mg per kg of Carbadox to
the complete diet.

75
Table 4.2. Analyzed nutrient composition of diets (as-fed basis), Exp. 1
Diets
Item
Positive
control
Negative
control
Negative control + Phytase (FTU/kg)1
500 1,000 2,000 4,000
ADF, % 2.70 2.98 2.79 3.04 2.95 2.72
NDF, % 8.44 9.50 9.84 10.09 8.91 9.55
P, % 0.66 0.36 0.36 0.36 0.36 0.35
Ca, % 0.86 0.48 0.48 0.51 0.56 0.53
CP, % 18.33 17.96 17.24 18.03 19.24 18.27
DM, % 87.42 88.02 87.97 88.08 88.25 88.15
Ash, % 5.74 4.99 4.43 4.27 4.08 4.10
Phytase, FTU/kg1
91 80 440 958 1743 3974
Indispensible AA, %
Arg 1.26 1.30 1.28 1.19 1.22 1.24
His 0.50 0.53 0.52 0.49 0.50 0.51
Ile 0.80 0.84 0.85 0.81 0.81 0.84
Leu 1.60 1.66 1.64 1.57 1.57 1.60
Lys 1.18 1.21 1.20 1.13 1.15 1.20
Met 0.29 0.32 0.31 0.29 0.29 0.30
Phe 0.92 0.95 0.95 0.90 0.90 0.93
Thr 0.71 0.75 0.71 0.67 0.69 0.69
Trp 0.24 0.24 0.24 0.24 0.23 0.24
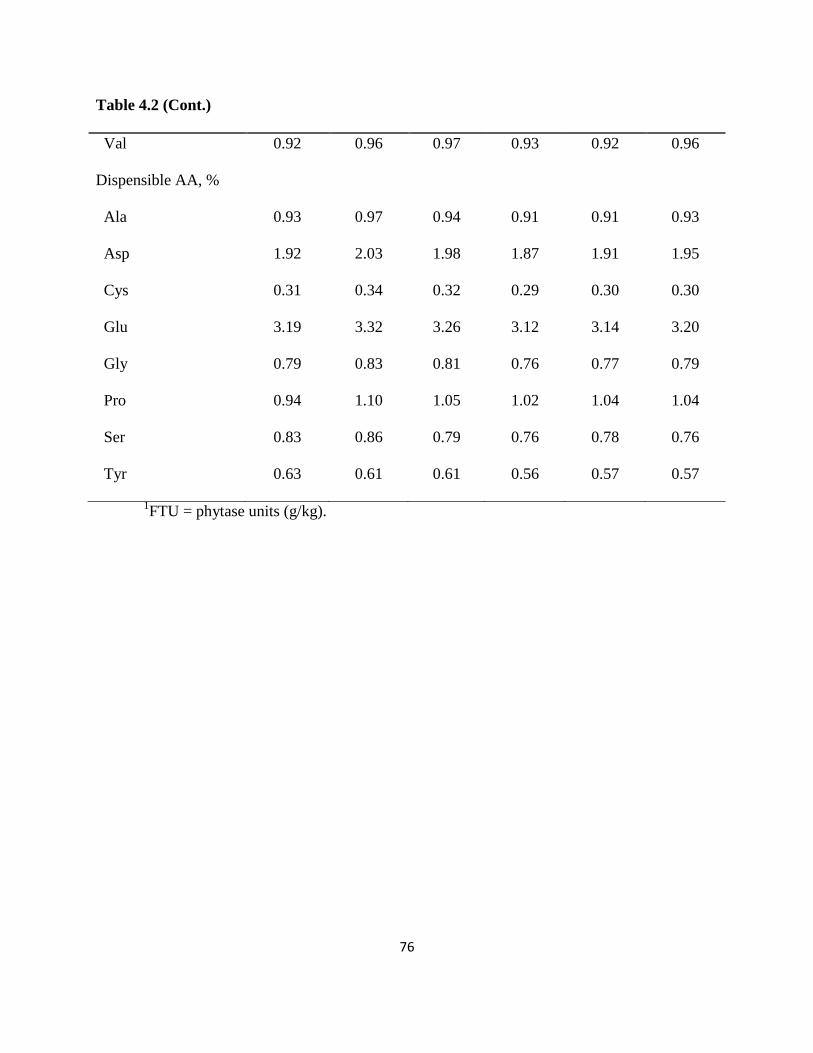
76
Table 4.2 (Cont.)
Val 0.92 0.96 0.97 0.93 0.92 0.96
Dispensible AA, %
Ala 0.93 0.97 0.94 0.91 0.91 0.93
Asp 1.92 2.03 1.98 1.87 1.91 1.95
Cys 0.31 0.34 0.32 0.29 0.30 0.30
Glu 3.19 3.32 3.26 3.12 3.14 3.20
Gly 0.79 0.83 0.81 0.76 0.77 0.79
Pro 0.94 1.10 1.05 1.02 1.04 1.04
Ser 0.83 0.86 0.79 0.76 0.78 0.76
Tyr 0.63 0.61 0.61 0.56 0.57 0.57
1FTU = phytase units (g/kg).

77
Table 4.3. Composition (as-is basis) of experimental diets, Exp. 2
Diets
Ingredient, %
Positive
control
Negative
control
Negative control + Phytase (FTU/kg)1
500 1,000 2,000 4,000
Ground corn 65.80 65.80 65.80 65.80 65.80 65.80
Soybean meal, 48% 29.50 29.50 29.50 29.50 29.50 29.50
Soybean oil 2.00 2.00 2.00 2.00 2.00 2.00
Ground limestone 0.95 0.95 0.95 0.95 0.95 0.95
Dicalcium phosphate 1.05 - - - - -
Cornstarch - 1.05 1.025 1.00 0.975 0.95
Salt 0.40 0.40 0.40 0.40 0.40 0.40
Phytase premix 2 - - 0.025 0.05 0.075 0.10
Vit. mineral premix 3 0.30 0.30 0.30 0.30 0.30 0.30
Total 100.00 100.00 100.00 100.00 100.00 100.00
1FTU = phytase units.
2Ronozyme HiPhos, DSM Nutritional Products, Parsippany, NJ. Produced by mixing
3.4% of concentrated phytase (58,700 units/g) and 96.6% cornstarch.
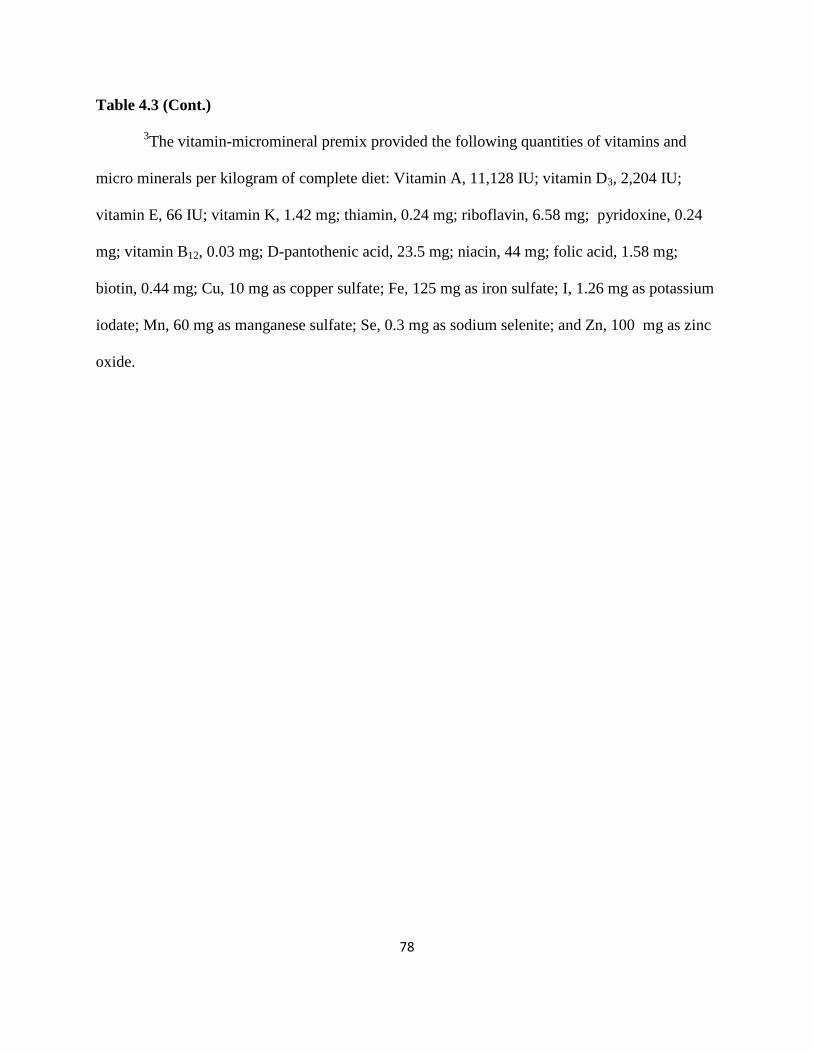
78
Table 4.3 (Cont.)
3The vitamin-micromineral premix provided the following quantities of vitamins and
micro minerals per kilogram of complete diet: Vitamin A, 11,128 IU; vitamin D3, 2,204 IU;
vitamin E, 66 IU; vitamin K, 1.42 mg; thiamin, 0.24 mg; riboflavin, 6.58 mg; pyridoxine, 0.24
mg; vitamin B12, 0.03 mg; D-pantothenic acid, 23.5 mg; niacin, 44 mg; folic acid, 1.58 mg;
biotin, 0.44 mg; Cu, 10 mg as copper sulfate; Fe, 125 mg as iron sulfate; I, 1.26 mg as potassium
iodate; Mn, 60 mg as manganese sulfate; Se, 0.3 mg as sodium selenite; and Zn, 100 mg as zinc
oxide.

79
Table 4.4. Analyzed nutrient composition of diets (as-fed basis), Exp. 2
Diets
Item
Positive
control
Negative
control
Negative control + Phytase (FTU/kg)1
500 1,000 2,000 4,000
ADF, % 2.64 2.63 2.61 2.64 2.67 2.84
NDF, % 12.11 8.02 8.81 7.71 7.80 8.52
P, % 0.56 0.33 0.34 0.34 0.34 0.34
Ca, % 0.79 0.58 0.59 0.57 0.56 0.54
CP, % 20.45 21.94 21.29 21.00 20.92 20.45
DM, % 88.30 88.36 88.32 88.19 88.21 88.34
Ash, % 4.73 3.98 3.88 4.02 4.02 4.07
Phytase, FTU/kg1
39 41 373 984 1773 3681
Indispensible AA, %
Arg 1.23 1.22 1.17 1.23 1.23 1.26
His 0.53 0.50 0.50 0.50 0.50 0.51
Ile 0.84 0.81 0.78 0.81 0.82 0.84
Leu 1.63 1.58 1.54 1.60 1.59 1.62
Lys 1.08 1.06 1.02 1.07 1.07 1.09
Met 0.30 0.29 0.28 0.29 0.29 0.29
Phe 0.92 0.90 0.86 0.90 0.90 0.92
Thr 0.70 0.70 0.65 0.70 0.68 0.69
Trp 0.25 0.24 0.25 0.25 0.24 0.25
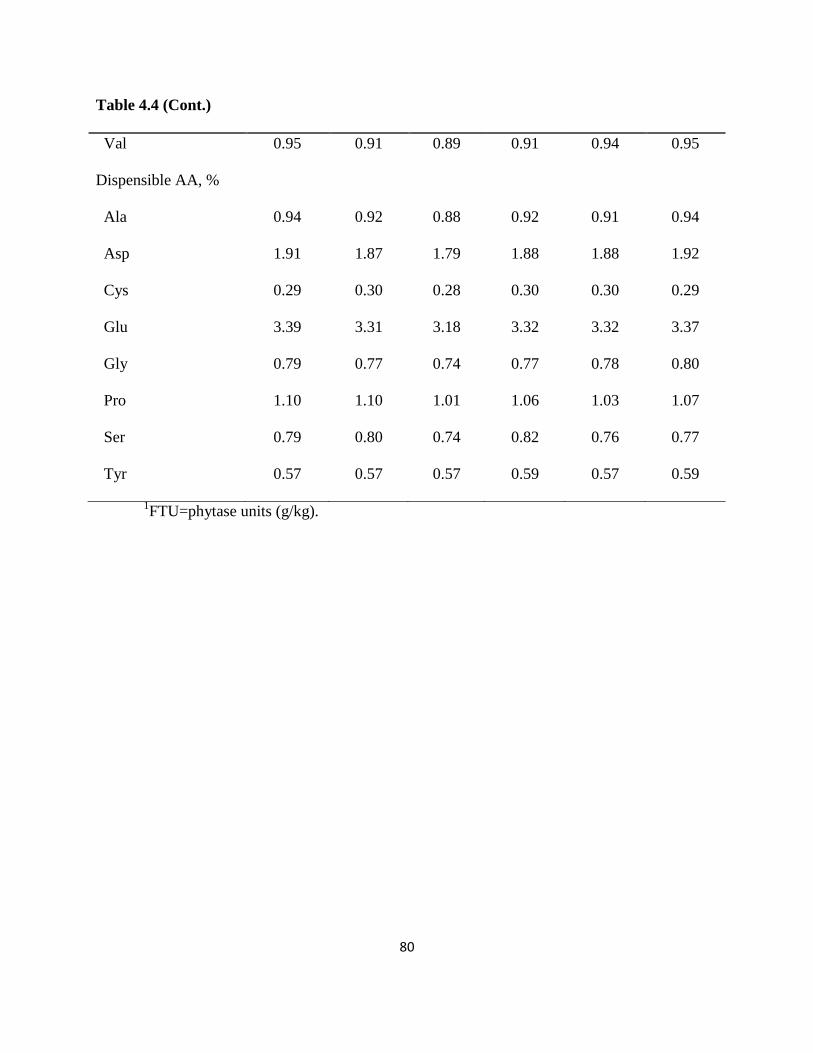
80
Table 4.4 (Cont.)
Val 0.95 0.91 0.89 0.91 0.94 0.95
Dispensible AA, %
Ala 0.94 0.92 0.88 0.92 0.91 0.94
Asp 1.91 1.87 1.79 1.88 1.88 1.92
Cys 0.29 0.30 0.28 0.30 0.30 0.29
Glu 3.39 3.31 3.18 3.32 3.32 3.37
Gly 0.79 0.77 0.74 0.77 0.78 0.80
Pro 1.10 1.10 1.01 1.06 1.03 1.07
Ser 0.79 0.80 0.74 0.82 0.76 0.77
Tyr 0.57 0.57 0.57 0.59 0.57 0.59
1FTU=phytase units (g/kg).

81
Table 4.5. Effects of phytase on apparent total tract digestibility (ATTD) of P and Ca in weanling pigs1, Exp. 1
Diets P-value P-value2
Item
Positive
control
Negative
control
Negative control + Phytase (FTU/kg) SEM Positive
vs.
Negative
Negative
vs.
Phytase
L Q
500 1,000 2,000 4,000
Feed intake, g/d 645 633 629 646 624 611 18.06 0.646 0.769 0.277 0.685
P intake, g/d 4.3 2.3 2.3 2.3 2.3 2.1 0.08 < 0.01 0.676 0.122 0.494
Fecal output, g/d 66.5 58.8 58.1 56.1 57.1 62.6 3.77 0.157 0.942 0.370 0.361
P in feces, % 2.53 2.30 1.51 1.46 1.22 1.10 0.07 0.023 < 0.01 < 0.01 < 0.01
P output, g/d 1.7 1.4 0.9 0.8 0.7 0.7 0.07 < 0.01 < 0.01 < 0.01 < 0.01
ATTD of P, % 60.5 40.5 61.6 65.1 68.7 68.0 2.34 < 0.01 < 0.01 < 0.01 < 0.01
P absorption, g/d 2.6 0.9 1.4 1.5 1.5 1.5 0.07 < 0.01 < 0.01 < 0.01 < 0.01
Ca intake, g/d 5.6 3.0 3.0 3.3 3.5 3.2 0.10 < 0.01 0.068 0.072 < 0.01
Ca in feces, % 2.29 1.86 1.37 1.11 0.94 0.79 0.13 0.019 < 0.01 < 0.01 < 0.01
Ca output, g/d 1.5 1.1 0.8 0.6 0.5 0.5 0.08 < 0.01 < 0.01 < 0.01 < 0.01
ATTD of Ca, % 72.5 63.9 73.7 81.7 84.8 84.6 2.30 0.012 < 0.01 < 0.01 < 0.01

82
Table 4.5 (Cont.)
Ca absorption, g/d 4.0 2.0 2.2 2.7 3.0 2.7 0.12 < 0.01 < 0.01 < 0.01 < 0.01
1Data are means of 8 observations per treatment.
2L = linear contrast; Q = quadratic contrast.

83
Table 4.6. Effects of phytase on apparent total tract digestibility (ATTD) of P and Ca in growing pigs1, Exp. 2
Diets P-value P-value2
Item
Positive
control
Negative
control
Negative control + Phytase (FTU/kg) SEM Positive
vs.
Negative
Negative
vs.
Phytase
L Q
500 1,000 2,000 4,000
Feed intake, g/d 1521 1460 1506 1497 1476 1476 58.08 0.471 0.674 0.930 0.808
P intake, g/d 8.5 4.8 5.1 5.1 5.0 5.0 0.23 < 0.01 0.368 0.825 0.582
Fecal output, g/d 132.9 118.2 116.9 116.0 117.5 124.0 5.48 0.076 0.957 0.356 0.529
P in feces, % 2.59 2.44 1.82 1.52 1.31 1.09 0.07 0.170 < 0.01 < 0.01 < 0.01
P output, g/d 3.4 2.9 2.1 1.8 1.5 1.4 0.10 < 0.01 < 0.01 < 0.01 < 0.01
ATTD of P, % 59.4 39.8 58.1 65.4 69.1 72.8 2.25 < 0.01 < 0.01 < 0.01 < 0.01
P absorption, g/d 5.1 1.9 3.0 3.3 3.5 3.7 0.24 < 0.01 < 0.01 < 0.01 < 0.01
Ca intake, g/d 12.0 8.5 8.9 8.5 8.3 8.0 0.36 < 0.01 0.902 0.128 0.838
Ca in feces, % 2.45 2.33 1.40 1.29 1.22 0.91 0.13 0.539 < 0.01 < 0.01 < 0.01
Ca output, g/d 3.2 2.7 1.6 1.5 1.5 1.1 0.16 0.068 < 0.01 < 0.01 < 0.01
ATTD of Ca, % 72.9 67.3 81.4 82.6 82.4 85.6 2.05 0.069 < 0.01 < 0.01 < 0.01
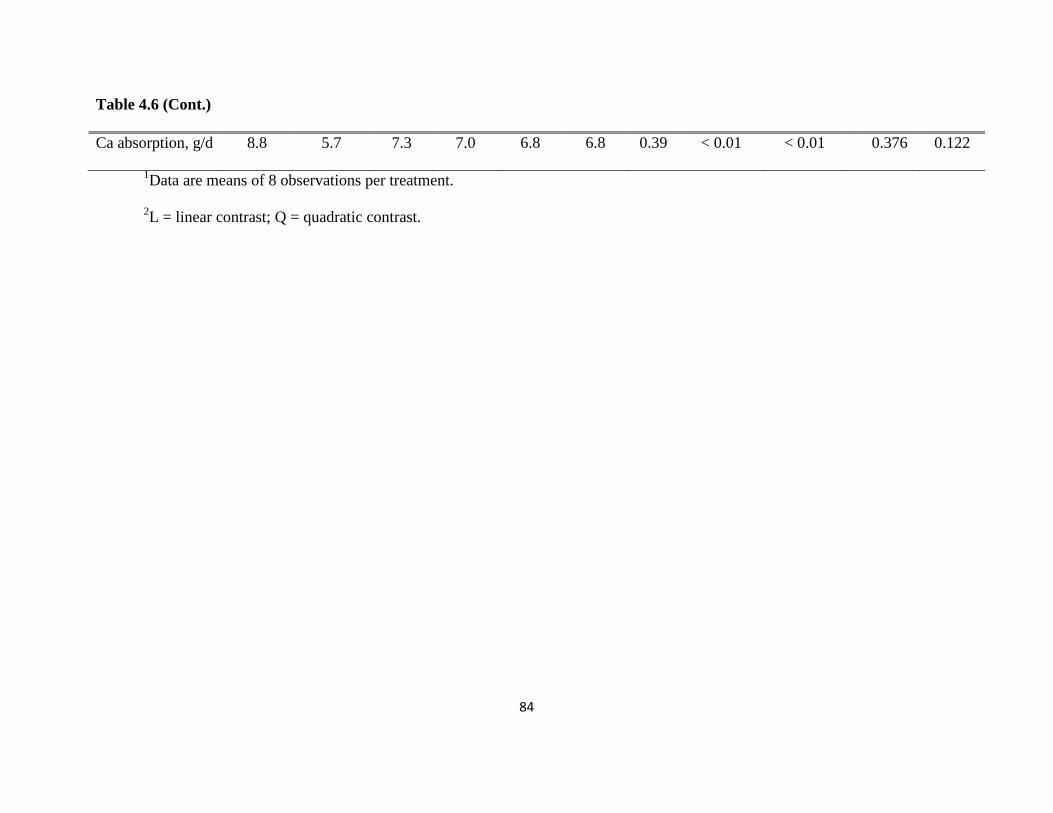
84
Table 4.6 (Cont.)
Ca absorption, g/d 8.8 5.7 7.3 7.0 6.8 6.8 0.39 < 0.01 < 0.01 0.376 0.122
1Data are means of 8 observations per treatment.
2L = linear contrast; Q = quadratic contrast.

85
Figure 4.1. Fitted broken-line plot of ATTD of P as a function of dietary phytase level (Exp. 1)
with observed treatment mean values (n = 8 observations per treatment mean). The minimal
dietary phytase level determined by broken-line analysis using least squares methodology was
1,016 FTU/kg (Y plateau = 68.4; slope below breakpoint = -0.025; Adjusted R2 = 0.873).
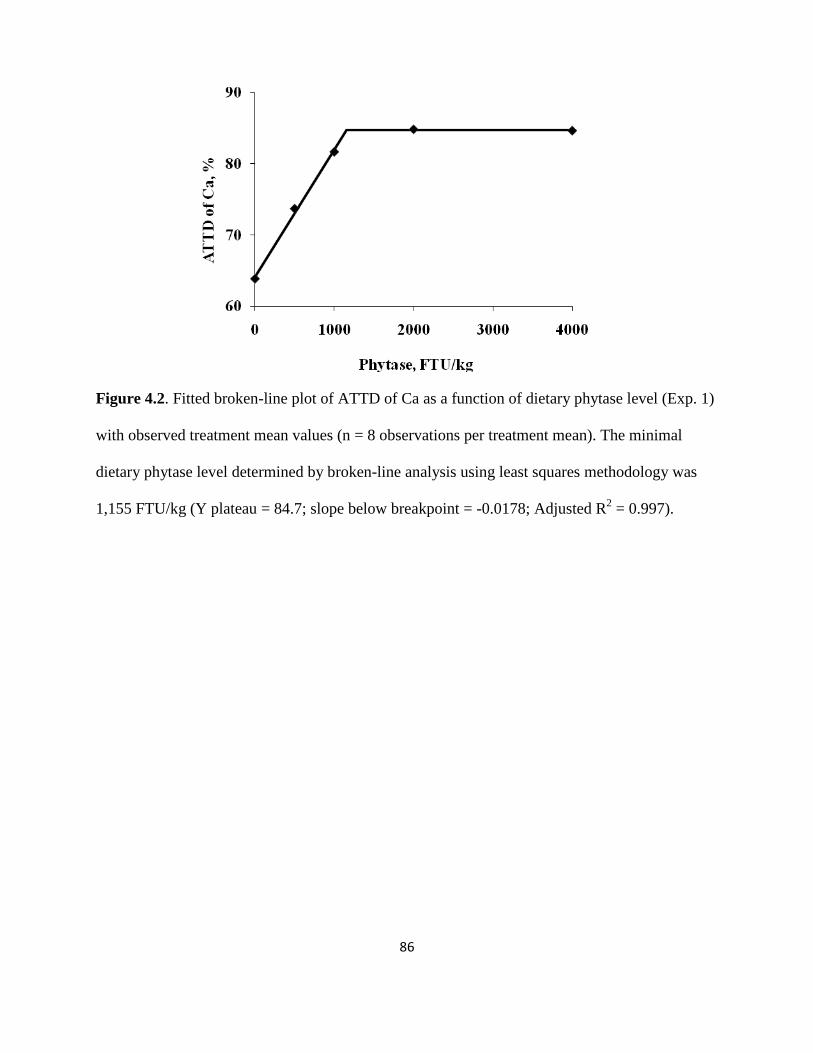
86
Figure 4.2. Fitted broken-line plot of ATTD of Ca as a function of dietary phytase level (Exp. 1)
with observed treatment mean values (n = 8 observations per treatment mean). The minimal
dietary phytase level determined by broken-line analysis using least squares methodology was
1,155 FTU/kg (Y plateau = 84.7; slope below breakpoint = -0.0178; Adjusted R2 = 0.997).

87
Figure 4.3. Fitted broken-line plot of ATTD of P as a function of dietary phytase level (Exp. 2)
with observed treatment mean values (n = 8 observations per treatment mean). The minimal
dietary phytase level determined by broken-line analysis using least squares methodology was
801 FTU/kg (Y plateau = 69.1; slope below breakpoint = -0.036; Adjusted R2 = 0.947).

88
Figure 4.4. Fitted broken-line plot of ATTD of Ca as a function of dietary phytase level (Exp. 2)
with observed treatment mean values (n = 8 observations per treatment mean). The minimal
dietary phytase level determined by broken-line analysis using least squares methodology was
574 FTU/kg (Y plateau = 83.5; slope below breakpoint = -0.0283; Adjusted R2 = 0.958).

89
CHAPTER 5
EFFECTS OF GRADED LEVELS OF PHYTASE ON APPARENT AND
STANDARDIZED TOTAL TRACT DIGESTIBILITY OF PHOSPHORUS IN CORN
AND CORN CO-PRODUCTS
ABSTRACT
An experiment was conducted to measure the effects of graded levels of microbial phytase on
the standardized total tract digestibility (STTD) of P in corn, distillers dried grains with solubles
(DDGS), high protein distillers dried grains (HP-DDG), and corn germ. A second objective was
to develop regression equations to predict the response of adding phytase to each of these
ingredients. Four corn based diets, 4 DDGS based diets, 4 HP-DDG based diets, and 4 corn germ
based diets were formulated. The 4 diets with each ingredient contained 0, 500, 1,000, or 1,500
phytase units (FTU) per kg (Optiphos 2000, Enzyvia, Sheridan, IN). A P-free diet was also
formulated to measure the basal endogenous losses of P. A total of 102 pigs (initial BW: 18.2 ±
2.1 kg) were individually housed in metabolism cages equipped with a feeder and a nipple
drinker and a screen floor that allowed for total collection of feces. Pigs were allotted to the 17
diets in a randomized complete block design with 6 replicates per diet. Supplementation of
microbial phytase increased (linear, P < 0.01; quadratic, P < 0.05) the STTD of P in corn from
40.9 to 67.5, 64.5, and 74.9%, tended to increase (linear, P =0.07) the STTD of P in DDGS from
76.9 to 82.9, 82.5, and 83.0%, increased (linear, P < 0.01; quadratic, P < 0.05) the STTD of P in
HP-DDG from 77.1 to 88.0, 84.1, and 86.9% , and increased (linear and quadratic, P < 0.01) the
STTD of P in corn germ from 40.7 to 59.0, 64.4, and 63.2% in diets supplemented with 0, 500,

90
1,000, or 1,500 FTU/kg of phytase, respectively. Regression equations were developed to allow
the calculation of the STTD of P with any level of phytase (Optiphos 2000, Enzyvia, Sheridan,
IN) for each of the test ingredients. Therefore, results of this experiment allow the prediction of
the amount of digestible P in corn and corn germ containing any level of phytase between 0 and
1,500 FTU.
Key words: digestibility, endogenous losses, phosphorus, phytase, pig
INTRODUCTION
Corn contains approximately 0.26% P (NRC, 1998), but the digestibility is low because
most of the P in corn is bound to phytate, which is poorly digested by pigs (Selle and Ravindran,
2008). The low digestibility of P in corn is compensated by supplementation of diets with
inorganic P. This practice has become expensive because of increasing prices of inorganic P. In
an attempt to mitigate this problem, Almeida and Stein (2009) measured standardized total tract
digestibility (STTD) of P in corn, soybean meal (SBM), and distillers dried grains with solubles
(DDGS) with 0 or 500 phytase units (FTU) per kg. It was concluded from this work that the
STTD of P is increased in corn and SBM, but not in DDGS if 500 FTU of microbial phytase is
added to the diets. There are, however, no data on the effects of adding microbial phytase to
other corn co-products such as high protein distillers dried grains (HP-DDG) and corn germ. The
effects of adding graded levels of exogenous phytase to corn, DDGS, HP-DDG, and corn germ
have also not been reported and the inclusion rate of phytase that is needed to maximize the
STTD of P in these ingredients is not known. The objectives of this experiment were to measure
the effects of graded levels of phytase on the STTD of P in corn, DDGS, HP-DDG, and corn

91
germ, and to develop regression equations to predict the response of adding different levels of
phytase to each ingredient.
MATERIALS AND METHODS
The protocol for the experiment was reviewed and approved by the Institutional Animal
Care and Use Committee at the University of Illinois. Pigs used in the experiment were the
offspring of Landrace boars that were mated to Large White sows (Genetiporc, Alexandria, MN).
Diets, Animals, and Experimental Design
Distillers dried grains with solubles and corn germ were obtained from Poet Nutrition,
Coon Rapids, IA, and HP-DDG was obtained from Poet Nutrition, Corning, IA (Table 5.1). A
commercial hybrid of corn was obtained locally. Seventeen diets were formulated (Tables 5.2
and 5.3). There were 4 corn based diets, 4 DDGS based diets, 4 HP-DDG based diets, and 4 corn
germ based diets. Phytase (Optiphos 2000, Enzyvia, Sheridan, IN) was added at levels of 0, 500,
1,000, or 1,500 phytase units (FTU) per kg to the 4 diets with each ingredient. A P-free diet was
used to measure the basal endogenous P loss (EPL) from the pigs. A total of 102 growing pigs
(initial BW: 18.2 ± 2.1 kg) were housed in metabolism cages equipped with a feeder and a nipple
drinker that allowed for total collection of feces. Pigs were allotted to the 17 diets in a
randomized complete block design. The Experimental Animal Allotment Program (Kim and
Lindemann, 2007) was used to allot pigs to the 17 diets based on BW with 6 replicate pigs per
diet.

92
Feeding and Sample Collection
The daily amount of feed provided to the pigs was calculated as 3 times the estimated
requirement for maintenance energy (i.e., 106 kcal ME per kg 0.75
; NRC, 1998) and fed in 2
equal meals. Pigs were allowed ad libitum access to water throughout the experiment. There was
a 5 d adaptation period to the diets, which was followed by total collection of feces from d 6 to
11 according to the marker to marker approach (Adeola, 2001). In the morning meal of d 6,
chromic oxide was added to the diets to determine the beginning of collections, and on d 11,
ferric oxide was added to the diets to determine the end of collections. Fecal samples were
collected twice daily and stored at -20˚C immediately after collection.
Sample Analysis and Data Processing
Prior to analysis, fecal samples were dried in a forced air oven and finely ground through
a 2 mm screen using a Thomas-Wiley mill (Model 4, Swedesboro, NJ). After wet ash sample
preparation (method 975.03; AOAC Int., 2007), fecal samples, ingredients, and diets were
analyzed for Ca and P by inductively coupled plasma (ICP) spectroscopy (method 985.01;
AOAC Int., 2007) and for DM by oven drying at 135˚C for 2 h (method 930.15; AOAC Int.,
2007). Ingredients and diets were also analyzed for CP (method 990.03; AOAC Int., 2007) using
an Elementar Rapid N-cube protein/nitrogen apparatus (Elementar Americas Inc., Mt. Laurel,
NJ), ADF (method 973.18; AOAC Int., 2007), NDF (Holst, 1973), and for phytase activity
(Phytex Method, version 1; Eurofins, Des Moines, IA). Ingredients were also analyzed for AA
(method 982.30 E (a, b, c); AOAC Int., 2007) and for phytate (Eurofins, Des Moines, IA) using
the method of Ellis et al. (1977).
The ATTD (%) of P in each diet was calculated according to the following equation:
ATTD (%) = [(Pi – Pf)/Pi] x 100,

93
where Pi is the total P intake (g) from d 6 to 11 and Pf is the total fecal P output (g) originating
from the feed that was provided from d 6 to 11 (Petersen and Stein, 2006).
The basal EPL (mg/kg DMI) was measured from pigs fed the P-free diet according to the
following equation:
EPL (mg/kg DMI) = ([Pf/Fi] x 1,000 x 1,000),
where EPL is the endogenous P loss and Fi is the total feed (g) intake from d 6 to 11 (Petersen
and Stein, 2006).
Values for the daily EPL of pigs fed the P containing diets were calculated by
multiplying the basal EPL by the average daily DMI of each pig during the 5 d collection period.
The STTD of P was calculated using the following equation:
STTD (%) = ([Pi – {Pf – EPL}/Pi]) x 100,
where STTD (%) is the standardized total tract digestibility of P.
Data were analyzed as a randomized complete block design using the Proc Mixed
Procedure in SAS. The UNIVARIATE procedure in SAS was used to confirm that variances
were homogenous and also to analyze for outliers, but no outliers were identified. The model
included diet as the fixed effect and replicate as a random effect. No effects of replicate were
observed, and therefore, replicate was removed from the final model. The effects of adding
graded levels of phytase to each ingredient were analyzed by orthogonal polynomial contrasts.
Appropriate coefficients for unequally spaced concentrations of supplemental phytase were
obtained using the Proc IML of SAS. Estimates for the regression equations between STTD of P
and analyzed phytase inclusion level were determined by submitting each treatment observations
to Proc GLM of SAS. The pig was the experimental unit and an alpha value of 0.05 was used to
assess significance among means.

94
RESULTS
Throughout the adaptation period pigs remained healthy and readily consumed their diets.
During the 5 d collection period, however, 1 pig that was fed the corn germ diet without phytase
was diagnosed with pneumonia, and therefore, removed from the experiment. All of the
remaining pigs were healthy until the end of the experiment.
The analyzed values for phytase activity of all diets were slightly less than the calculated
values (Table 5.3) despite the fact that the phytase activity in the phytase premix was analyzed
immediately prior to diet mixing. Because of this discrepancy, analyzed values for phytase
activity were used in all statistical analysis. The basal EPL was measured at 206 mg/kg DMI
from pigs fed the P-free diet.
Digestibility of P in Corn
No differences in fecal output were detected among treatments (Table 5.4). Phytase
increased (linear, P < 0.05) ADFI, P intake and EPL. The concentration of P in feces was
reduced (linear and quadratic, P < 0.01) from 1.94 to 1.25, 1.15, and 0.94% for pigs that were fed
diets that were supplemented with 0, 420, 720, or 1,100 FTU of phytase, respectively. Likewise,
daily P output was linearly (P < 0.01) and quadratically (P < 0.05) reduced from 1.0 to 0.6, 0.7,
and 0.6 g/d for pigs that were fed diets that were supplemented with 0, 420, 720, or 1,100 FTU of
phytase, respectively. The ATTD and STTD of P were linearly (P < 0.01) and quadratically (P <
0.05) increased from 33.5 to 60.1, 57.0, and 67.4%, and from 40.9 to 67.5, 64.5, and 74.9% for
pigs that were fed diets that were supplemented with 0, 420, 720, or 1,100 FTU of phytase,
respectively.

95
Digestibility of P in DDGS
No differences in ADFI, P intake, daily fecal output, or EPL were observed among
treatments. Concentration of P in feces decreased (linear, P < 0.01) as graded levels of phytase
were added to the diets. Likewise, the daily P output was reduced (P < 0.05) by the addition of
phytase to the diets. Addition of phytase to the diets tended (linear, P = 0.08) to increase the
ATTD and STTD of P from 72.6 to 78.6, 78.2, and 78.6%, and from 76.9 to 82.9, 82.5, and
83.0% in pigs that were fed diets containing 130, 430, 770, or 1,100 FTU of phytase,
respectively.
Digestibility of P in HP-DDG
There were no differences in ADFI, P intake, daily fecal output, or EPL among diets.
Addition of phytase to the diets reduced (linear, P < 0.01; quadratic, P < 0.05) the concentration
of P in feces. Phytase also reduced (linear, P < 0.01; quadratic, P < 0.05) P excretion from 0.4 to
0.3, 0.3, and 0.3 g/d in pigs that were fed diets containing 0, 500, 770, or 1,100 FTU of phytase,
respectively. Addition of phytase to the diets increased (linear, P < 0.01; quadratic, P < 0.05) the
ATTD of P from 68.6 to 79.5, 75.6, and 78.4%, and the STTD of P from 77.1 to 88.0, 84.1, and
86.9% in pigs that were fed diets containing 0, 500, 770, or 1,100 FTU of phytase, respectively.
Digestibility of P in Corn Germ
There were no differences in ADFI, P intake, daily fecal output, and EPL among
treatments. Addition of phytase to the diets reduced (linear and quadratic, P < 0.01) the
concentration of P in the feces. Likewise, addition of phytase to the diets reduced (linear and
quadratic, P < 0.01) the daily P output from 2.2 to 1.6, 1.3, and 1.4 g/d for pigs that were fed
diets containing 110, 390, 910, and 1,400 FTU of phytase, respectively. Addition of phytase to
the diets increased (linear and quadratic, P < 0.01) the ATTD of P from 37.3 to 55.7, 63.0, and

96
59.8%, and the STTD of P from 40.7 to 59.0, 64.4, and 63.2% in pigs that were fed diets
containing 110, 390, 910, and 1,400 FTU of phytase, respectively.
Regression Equations
Regression equations for the STTD of P as affected by microbial phytase in corn, HP-
DDG, and corn germ are presented in Table 5.5. Addition of phytase to DDGS did not affect the
STTD of P, and therefore, a regression equation for this ingredient is not presented.
DISCUSSION
Phosphorus and Phytate P in Ingredients
The concentration of P that was measured in ingredients used in this experiment is in
agreement with the values reported by Widmer et al. (2007) and NRC (1998). The phytic acid
data demonstrates that on a percentage basis, corn and corn germ contain similar amounts of
phytic acid (72 and 76% of total P, respectively), and that DDGS and HP-DDG also have similar
concentrations of phytic acid, but these amounts are much less (30 and 28% of total P,
respectively) than in corn and corn germ. The reason for these differences is that during the
production of DDGS and HP-DDG, some of the phytic acid is hydrolyzed, which results in a
reduced concentration of phytate-bound P.
ATTD and STTD Values of P in Ingredients without Phytase
The value for the ATTD of P in corn measured in the present experiment is in agreement
with values reported by Bünzen et al. (2008) and Stein et al. (2009). The ATTD of P in corn
germ was greater than the value reported by Widmer et al. (2007). This difference may be due to
different processing of corn to obtain corn germ, or differences between corn hybrids that were
used to obtain the corn germ. The ATTD of P in DDGS has been reported to vary from 50 to

97
69% (Pedersen et al., 2007; Almeida and Stein, 2009; Stein et al., 2009). In the present
experiment, the value for the ATTD of P in DDGS is close to the greatest value in this range.
This observation confirms that the ATTD of P in DDGS is much greater than in corn, which is
likely a consequence of the reduced concentration of phytate in DDGS compared with corn. The
ATTD of P in HP-DDG measured in this experiment is similar to the ATTD of P in DDGS, and
slightly greater than the value reported by Widmer et al. (2007). This observation indicates that
the ATTD of P in HP-DDG and DDGS are similar as would be expected from the similar content
of phytate in these 2 ingredients. We are not aware of any other experiments in which the ATTD
of P in these 2 ingredients has been measured.
The value for the basal EPL that was measured in this experiment is very close to
previous values (Stein et al., 2006; Widmer et al., 2007; Almeida and Stein, 2009). Values for
the STTD of P are expected to be greater than the ATTD values because they are corrected for
basal EPL, and results from the present experiment confirm this hypothesis. If values for the
ATTD of P are corrected for total EPL, true total tract digestibility values are obtained and these
values are expected to be greater than STTD values. The value calculated for the STTD of P in
corn in the present experiment is in agreement with this theory because it is within the range for
the ATTD (31.9%) and true total tract digestibility (49.2%) of P in corn reported by Stein et al.
(2009) and Wu et al. (2008), respectively. The value for the STTD of P in DDGS is in agreement
with the value reported by Almeida and Stein, (2009). Likewise, the STTD of P in HP-DDG and
in corn germ measured in the present experiment is in agreement with the STTD of P that was
measured in HP-DDG and in corn germ by Widmer et al. (2007).

98
Effects of Phytase
Supplementation of diets with phytase resulted in increased STTD of P, which was
expected because hydrolysis of phytate by microbial phytase liberates P in the intestines of pigs,
and therefore, improves the digestibility of P (Selle and Ravindran, 2008). Phytase increases the
STTD of P in corn and soybean meal (Almeida and Stein, 2009), but to our knowledge, there are
no data on the effects of graded levels of phytase on the STTD of P in corn, DDGS, HP-DDG,
and corn germ. Although the objective of this experiment was not to compare the STTD of P
among ingredients, our data suggest that the effect of phytase on the STTD of P in corn and corn
germ seems to be greater than the effect of phytase on the STTD of P in DDGS and HP-DDG.
Corn and corn germ contain greater amounts of phytate than DDGS and HP-DDG. During the
processing of corn to obtain ethanol, it is possible that some of the phytate present in corn is
hydrolyzed. Therefore, the lack of substrate in DDGS and HP-DDG may inhibit the effectiveness
of phytase in improving the STTD of P in these ingredients, which is not the case in corn and
corn germ.
Regression equations
The regression equations determined in this experiment allow calculation of the STTD of
P with any level of phytase between 0 and 1,500 FTU (Optiphos 2000, Enzyvia, Sheridan, IN).
The r2
value for the regression equation of HP-DDG indicates that the model accounts for only
36% of the variation of the STTD of P, and that the relationship between graded levels of
phytase and the STTD of P in HP-DDG is unlikely to be linear or quadratic. As a result, it is
possible to predict the amount of digestible P in corn or corn germ containing different levels of
phytase, but the regression equation for HP-DDG may not be adequate to predict the effect of

99
phytase on the STTD of P. This suggests that the effect of phytase on the STTD of P in HP-DDG
needs further investigation.

100
LITERATURE CITED
Adeola, O. 2001. Digestion and balance techniques in pigs. Pages 903-916 in Swine Nutrition.
A. J. Lewis and L. L. Southern, eds. CRC Press, Washington, DC. Swine Nutrition, 2nd
ed. CRC Press, N. Y.
Almeida, F. N., and H. H. Stein. 2009. Effects of phytase supplementation on apparent and
standardized total tract digestibility of P in corn, SBM, and distillers dried grains with
solubles (DDGS) fed to growing pigs. J. Anim. Sci. 87 (Suppl. 2):509. (Abstr.).
AOAC Int. 2007. Official Methods of Analysis .18th ed. Rev. 2. W. Howitz, and G. W. Latimer
Jr., ed. AOAC Int., Gaithersburg, MD.
Bünzen, S., H. S. Rostagno, D. C. Lopes, F. A. M. Hashimoto, P. C. Gomes, and L. R. Apolônio.
2008. Phosphorus digestibility from vegetal feed origins determined in growing and
finishing pigs. R. Bras. Zootec. 37:1236-1242.
Ellis, R., E. R. Morris, and C. Philpot. 1977. Quantitative determination of phytate in the
presence of high inorganic phosphate. Anal. Biochem. 77:539-539.
Holst, D. O. 1973. Holst filtration apparatus for Van Soest detergent fiber analysis. J. AOAC
56:1352–1356.
Kim, B. G., and M. D. Lindemann. 2007. A new spreadsheet method for the experimental animal
allotment. J. Anim. Sci. 85 (Suppl. 2):218. (Abstr.)
NRC. 1998. Nutrient requirements of swine. 10th rev. ed. Natl. Acad. Press, Washington, DC.
Pedersen C, M. G. Boersma, and H. H. Stein. 2007. Digestibility of energy and phosphorus in ten
samples of distillers dried grains with solubles fed to growing pigs. J. Anim. Sci.
85:1168-1176.

101
Petersen, G. I., and H. H. Stein. 2006. Novel procedure for estimating endogenous losses and
measurement of apparent and true digestibility of phosphorus by growing pigs. J. Anim.
Sci. 84:2126-2132.
Selle, P. H., and V. Ravindran. 2008. Phytate-degrading enzymes in pig nutrition. Livest. Sci.
113:99-122.
Stein, H. H., M. G. Boersma, and C. Pedersen. 2006. Apparent and true total tract digestibility
of phosphorus in field peas (Pisum sativum L.) by growing pigs. Can. J. Anim. Sci.
86:523-525.
Stein, H. H., S. P. Connot, and C. Pedersen. 2009. Energy and nutrient digestibility in four
sources of distillers dried grains with solubles produced from corn grown within a narrow
geographical area and fed to growing pigs. Asian-Aust. J. Anim. Sci. 22:1016-1025.
Widmer, M. R., L. M. McGinnis, and H. H. Stein. 2007. Energy, phosphorus, and amino acid
digestibility of high-protein distillers dried grains and corn germ fed to growing pigs. J.
Anim. Sci. 85:2994-3003.
Wu, Z., Z. Ruan, Y. G. Zhang, Y. Q. Hou, Y. L. Yin, T. J. Li, R. L. Huang, W. Y. Chu, X. F.
Kong, B. Gao, and L. X. Chen. 2008. True digestibility of phosphorus in different
resources of feed ingredients in growing pigs. Asian-Aust. J. Anim. Sci. 21:107-119.

102
Table 5.1. Analyzed nutrient composition of ingredients
Ingredient
Item Corn DDGS1
HP-DDG2
Corn germ
Ca, % 0.01 0.02 0.01 0.02
Total P, % 0.25 0.85 0.39 1.41
Phytate P, % 0.18 0.26 0.11 1.07
Non-phytate P3, % 0.07 0.59 0.28 0.33
DM, % 86.67 91.18 91.35 91.45
CP, % 7.27 26.41 38.09 15.36
ADF 3.16 7.30 14.37 8.00
NDF 17.40 28.93 27.68 28.87
Phytase, FTU/kg4
< 70 < 70 < 70 180
Indispensable AA, %
Arg 0.34 1.16 1.37 1.07
His 0.19 0.71 1.00 0.41
Ile 0.24 1.00 1.61 0.45
Leu 0.74 2.84 5.16 1.02
Lys 0.24 0.87 1.05 0.80
Met 0.14 0.51 0.80 0.25
Phe 0.32 1.18 2.08 0.58
Thr 0.23 0.98 1.34 0.51
Trp 0.05 0.20 0.22 0.10

103
Table 5.1 (Cont.)
Val 0.33 1.32 1.95 0.73
Dispensable AA, %
Ala 0.47 1.78 2.82 0.88
Asp 0.44 1.67 2.35 1.10
Cys 0.16 0.57 0.76 0.30
Glu 1.09 3.51 6.10 1.79
Gly 0.28 1.05 1.26 0.77
Pro 0.53 1.87 3.23 0.90
Ser 0.29 1.13 1.60 0.58
Tyr 0.21 0.95 1.51 0.40
1DDGS = distillers dried grains with solubles.
2
HP-DDG = high protein distillers dried grains.
3Calculated as the difference between phytate-P and total P.
4FTU = phytase units per kg.
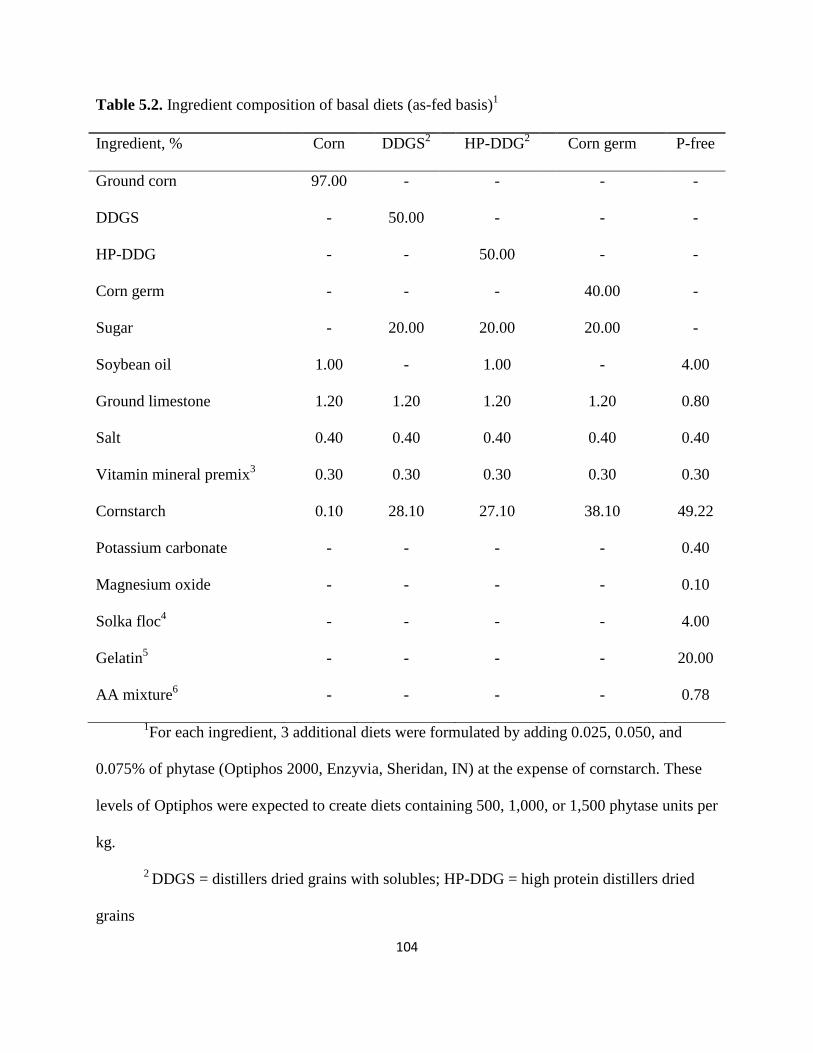
104
Table 5.2. Ingredient composition of basal diets (as-fed basis)1
Ingredient, % Corn DDGS2
HP-DDG2
Corn germ P-free
Ground corn 97.00 - - - -
DDGS - 50.00 - - -
HP-DDG - - 50.00 - -
Corn germ - - - 40.00 -
Sugar - 20.00 20.00 20.00 -
Soybean oil 1.00 - 1.00 - 4.00
Ground limestone 1.20 1.20 1.20 1.20 0.80
Salt 0.40 0.40 0.40 0.40 0.40
Vitamin mineral premix3
0.30 0.30 0.30 0.30 0.30
Cornstarch 0.10 28.10 27.10 38.10 49.22
Potassium carbonate - - - - 0.40
Magnesium oxide - - - - 0.10
Solka floc4
- - - - 4.00
Gelatin5
- - - - 20.00
AA mixture6
- - - - 0.78
1For each ingredient, 3 additional diets were formulated by adding 0.025, 0.050, and
0.075% of phytase (Optiphos 2000, Enzyvia, Sheridan, IN) at the expense of cornstarch. These
levels of Optiphos were expected to create diets containing 500, 1,000, or 1,500 phytase units per
kg.
2 DDGS = distillers dried grains with solubles; HP-DDG = high protein distillers dried
grains

105
Table 5.2 (Cont.)
3 The vitamin-micromineral premix provided the following quantities of vitamins and
micro minerals per kilogram of complete diet: Vitamin A, 11,128 IU; vitamin D3, 2,204 IU;
vitamin E, 66 IU; vitamin K, 1.42 mg; thiamin, 0.24 mg; riboflavin, 6.58 mg; pyridoxine, 0.24
mg; vitamin B12, 0.03 mg; D-pantothenic acid, 23.5 mg; niacin, 44 mg; folic acid, 1.58 mg;
biotin, 0.44 mg; Cu, 10 mg as copper sulfate; Fe, 125 mg as iron sulfate; I, 1.26 mg as potassium
iodate; Mn, 60 mg as manganese sulfate; Se, 0.3 mg as sodium selenite; and Zn, 100 mg as zinc
oxide.
4 Fiber Sales and Development Corp., Urbana, OH.
5 Pork gelatin obtained from Gelita Gelatine USA Inc., Sioux City, IA.
6
Provided the following quantities (%) of AA per kg of complete diet: DL-methionine,
0.27; L-threonine, 0.08; L-tryptophan, 0.14; L-histidine, 0.08; L-isoleucine, 0.16; and L-valine,
0.05.

106
Table 5.3. Analyzed nutrient composition of diets (as-fed basis)
Corn DDGS1
HP-DDG2
Corn Germ P-free
Phytase3
0 500 1000 1500 0 500 1000 1500 0 500 1000 1500 0 500 1000 1500
Item
Ca, % 0.50 0.50 0.54 0.53 0.37 0.46 0.63 0.67 0.45 0.58 0.71 0.49 0.47 0.50 0.56 0.60 -
P, % 0.24 0.24 0.24 0.24 0.45 0.45 0.45 0.45 0.23 0.23 0.23 0.23 0.56 0.56 0.56 0.56 -
DM, % 86.70 86.85 86.91 86.93 92.57 92.81 93.27 94.08 93.32 93.07 93.43 93.39 93.07 93.21 92.01 92.31 91.59
CP, % 6.89 7.05 6.86 7.20 14.26 14.08 14.50 13.89 20.10 19.89 20.88 20.82 5.85 7.20 6.71 7.21 22.12
ADF 2.78 2.61 2.77 2.77 3.39 3.53 3.69 4.09 6.37 6.17 7.43 6.33 2.89 3.96 3.34 3.51 -
NDF 15.26 17.30 20.22 17.50 13.88 14.92 15.25 15.96 16.49 13.96 14.82 15.02 12.74 16.88 15.27 11.77 -
Phytase3
< 70 420 720 1,100 130 430 770 1,100 < 70 500 770 1,100 110 390 910 1,400 -
1 DDGS = distillers dried grains with solubles.
2 HP-DDG = high protein distillers dried grains.
3 Expressed as phytase units per kg.
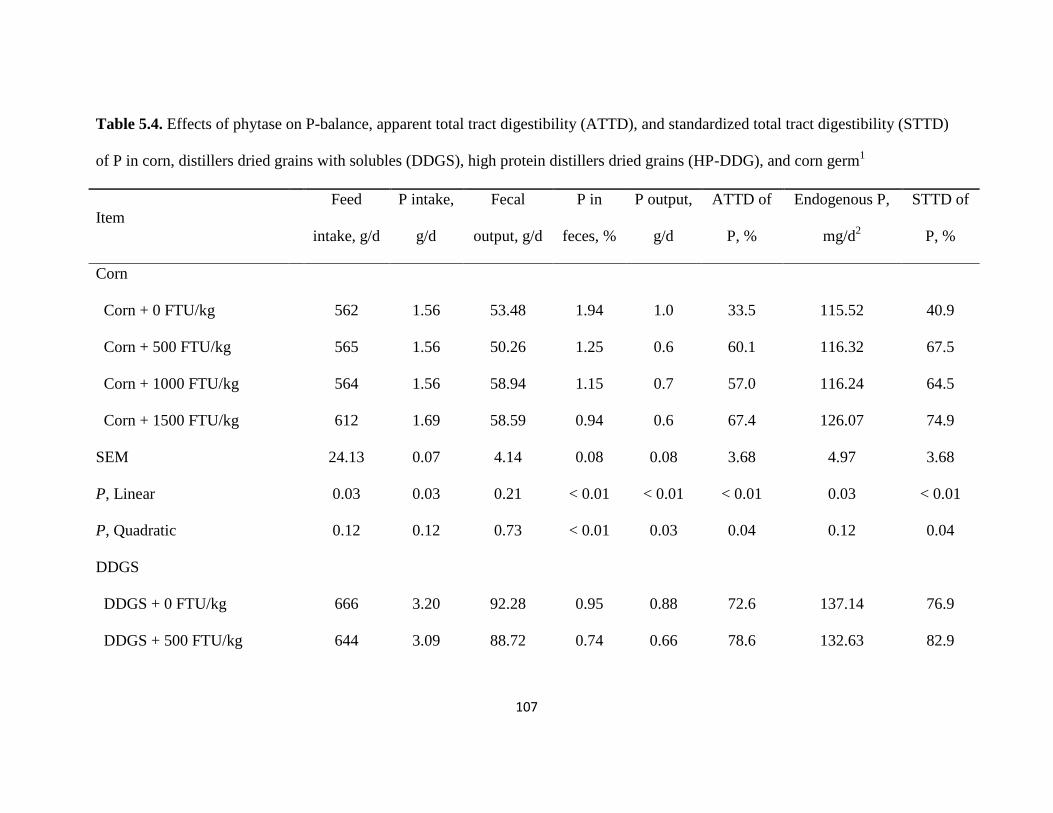
107
Table 5.4. Effects of phytase on P-balance, apparent total tract digestibility (ATTD), and standardized total tract digestibility (STTD)
of P in corn, distillers dried grains with solubles (DDGS), high protein distillers dried grains (HP-DDG), and corn germ1
Item
Feed
intake, g/d
P intake,
g/d
Fecal
output, g/d
P in
feces, %
P output,
g/d
ATTD of
P, %
Endogenous P,
mg/d2
STTD of
P, %
Corn
Corn + 0 FTU/kg 562 1.56 53.48 1.94 1.0 33.5 115.52 40.9
Corn + 500 FTU/kg 565 1.56 50.26 1.25 0.6 60.1 116.32 67.5
Corn + 1000 FTU/kg 564 1.56 58.94 1.15 0.7 57.0 116.24 64.5
Corn + 1500 FTU/kg 612 1.69 58.59 0.94 0.6 67.4 126.07 74.9
SEM 24.13 0.07 4.14 0.08 0.08 3.68 4.97 3.68
P, Linear 0.03 0.03 0.21 < 0.01 < 0.01 < 0.01 0.03 < 0.01
P, Quadratic 0.12 0.12 0.73 < 0.01 0.03 0.04 0.12 0.04
DDGS
DDGS + 0 FTU/kg 666 3.20 92.28 0.95 0.88 72.6 137.14 76.9
DDGS + 500 FTU/kg 644 3.09 88.72 0.74 0.66 78.6 132.63 82.9

108
Table 5.4 (Cont.)
DDGS + 1000 FTU/kg 682 3.25 95.08 0.75 0.72 78.2 140.56 82.5
DDGS + 1500 FTU/kg 680 3.22 94.03 0.71 0.68 78.6 140.21 83.0
SEM 39.02 0.19 4.88 0.06 0.07 2.09 8.03 2.09
P, Linear 0.40 0.64 0.60 < 0.01 0.11 0.08 0.40 0.07
P, Quadratic 0.64 0.72 0.80 0.13 0.21 0.20 0.65 0.20
HP-DDG
HP-DDG + 0 FTU/kg 536 1.29 53.91 0.75 0.4 68.6 110.39 77.1
HP-DDG + 500 FTU/kg 547 1.32 52.29 0.52 0.3 79.5 112.64 88.0
HP-DDG + 1000 FTU/kg 525 1.27 52.00 0.59 0.3 75.6 108.14 84.1
HP-DDG + 1500 FTU/kg 563 1.36 54.77 0.53 0.3 78.4 115.91 86.9
SEM 11.60 0.03 2.59 0.06 0.03 2.57 2.39 2.57
P, Linear 0.27 0.31 0.84 < 0.01 < 0.01 < 0.01 0.27 < 0.01
P, Quadratic 0.26 0.27 0.41 0.03 0.02 0.04 0.26 0.04
Corn germ

109
Table 5.4 (Cont.)
Corn germ + 0 FTU/kg3
581 3.48 70.14 3.14 2.2 37.3 119.61 40.7
Corn germ + 500 FTU/kg 586 3.50 61.47 2.57 1.6 55.7 120.68 59.0
Corn germ + 1000 FTU/kg 580 3.52 61.93 2.11 1.3 63.0 119.54 64.4
Corn germ + 1500 FTU/kg 581 3.51 60.26 2.35 1.4 59.8 119.62 63.2
SEM 15.80 0.09 3.67 0.16 0.11 2.37 3.25 2.21
P, Linear 0.91 0.69 0.43 < 0.01 < 0.01 < 0.01 0.91 < 0.01
P, Quadratic 0.81 0.76 0.25 0.02 < 0.01 < 0.01 0.81 < 0.01
1 Data are means of 6 observations per treatment.
2 Calculated by multiplying the basal EPL (206 mg/kg DMI) measured from pigs fed P-free diet by the DMI of each individual
pig fed P containing diets.
3
Data are means of 5 observations.

110
Table 5.5. Regression equations for the STTD of P in corn, HP-DDG, and corn germ against
phytase units (FTU) per kilogram of ingredient.
Item Regression equation r2
P-value
Corn 42.34 + 0.059FTU – 0.000028FTU2
0.63 < 0.01
HP-DDG 77.55 + 0.023FTU – 0.000014FTU2
0.36 < 0.01
Corn germ 34.50 + 0.067FTU – 0.000034FTU2
0.79 < 0.01

111
CHAPTER 6
CONCLUSIONS
It is concluded that values for the standardized total tract digestibility (STTD) of P can be
measured by correcting apparent total tract digestibility (ATTD) values for basal endogenous P
losses (EPL), which can be calculated by feeding pigs a P-free diet. The STTD of P in distillers
dried grains with solubles (DDGS) and in high protein distillers dried grains (HP-DDG) is much
greater than the STTD of P in corn, soybean meal (SBM), and corn germ because during the
ethanol production process most of the phytate present in corn is degraded.
It was also concluded that exogenous phytase improves the STTD of P in corn, SBM,
HP-DDG, and in corn germ. In DDGS, however, the effects of phytase on improving P
digestibility were not confirmed. The use of linear broken-line equations is a good predictor for
the amount of exogenous phytase needed to maximize P utilization by pigs fed corn-SBM diets.
Our research demonstrated that at levels greater than 1,000 phytase units per kg, P digestibility
reaches a plateau.
Diet costs and P excretion are reduced if diets for pigs are formulated based on values for
the STTD of P without compromising pig performance. No inorganic P is needed if the
combination of DDGS and phytase is used in the diets.
There is a need for developing a data base with STTD of P in various feed ingredients. If
such data base is established, commercial diets may be formulated based on values for the STTD
of P and this will likely improve P utilization by pigs resulting in reduced diet costs as well as
reduced P excretion in manure.