Effects of medium components on L-ornithine production by Brevibacterium ketoglutamicum
5
Biotechnol. Bioprocess Eng. 1996, 1, 41-45 Effects of Medium Components on L-Ornithine Production by Brevibacterium ketoglutamicum Tae Ho Lee, Yong Keun Chang +, Wook Sang Ryu*, Bong Hyun Chung* and Young Hoon Park* Department of Chemical Engineering and Bioprocess Engineering Research Center, Korea Advanced Institute of Science and Technology, Taejon 305-70 ]_,Korea *Korea Research Institute ofBioscience & Biotechnology, P.O. Box 17, Taejon 305-606, Korea Effects of yeast extract and ammonium sulfate were investigated on the production of L-or- nithine by an m-ginine auxotroph, Brevibaeterium ketoglutamicum in flask and batch cul- tures. Yeast extract as an arginine source and ammonium sulfate as an inorganic nitrogen source had significant effects on L-ornithine production and cell growth. L-ornithine pro- duction was repressed by the excessive addition of arginine. Reversion of auxotrophic cells to the wild type was observed when the initial yeast extract concentration was too low. There existed optimum concentrations of yeast extract and ammonium sulfate for L-or- nithine production. The effects of yeast extract and ammonium sulfate concentrations on the Leudeking-Piret model parameters were examined to analyze the relationship between cell growth and L-ornithine production. Key words: L-ornithine, Brevibacterium ketoglutarnicurn, auxotroph, L-arginine INTRODUCTION L-ornithine belongs to the glutamic acid family and is an intermediate metabolite in arginine biosynthesis. It is known to be effective for the treatment of liver diseases. Kinoshita et al. [11 reported that a citrulline- requiring mutant of Corynebacterium gIutamieurn ac- cumulated L-ornithine with a high .yield under ap- propriate fermentation conditions. L-ornithine, as weli as citrulline and arginine, is syn- thesized via glutamic acid consuming energy (ATP), by- drogen donors, and other amino acids. Therefore, L-or- nithine production requires large amounts of carbon and nitrogen sources as well as aerobic culture con- ditions. Since L-ornithine (CsHI202N~) contains two ni- trogen atoms, the shortage of nitrogen source has an undesirable effect on its production. The shortage of ammonium ion promotes c~-ketoglutaric acid pro- duction, which results in a decrease of L-ornithine yield. Although a large amount of ammonium ion is re- quired, high ammonium concentration is inhibitory not only to the cell growth, but also to the production of L-ornithine [2]. When an arginine-auxotrophic mutant is used, ar- ginine or arginine-containing organic nutrients such as peptone or yeast extract must be supplied. The biosynthetic pathway of L-ornithine from giutamic acid and regulatory mechanisms involved have been studied in glutamic acid-producing bacteria [3, 4, 5]. The formation of N-acetyIglutamokinase, the second enzyme involved in this pathway, has been reported to be repressed by L-arginine in Brevibacterium flavum Corresponding author Tel: 042-869-3927 Fax: 042-869-8800 e-maih [email protected] [6]. In addition, its activity is inhibited by an excess amount of L-arginine. Therefore, the level of L-ar- gimne should be carefully controlled in the ferment- ative production of L-ornithine [7, 8, 9]. As mentioned above, there have been a number of re- ports on the effects of arginine or ammonium ion on L- ornithine production. However, modelling of this pro- cess has never been attempted, which would be useful for understanding the fermentation process and the pattern of L-ornithine production. In this study, the el- fects of yeast extract, arginine, and ammonium sulfate on L-ornithine production by Brevibacterium keto- glutamicum were evaluated in flask and batch cub tures. Some modelling considerations were made on the kinetic relationship between ornithine production and cell g~owth, and on how the kinetic parameters were affected by the varying concentrations of the key components. MATERIALS AND METHODS Microorganism The microorganism used in this study was Bre- vibacterium ketoglutarnicurn 1047, which is an L-argi- nine or, more precisely, L-citruiline a~xotrophic mu- tant. Stock culture was prepared in a glycerol solution (15%) and stored at -4~ Culture Condition The growth medium used for inoculum was a YPD medium (glucose 2%, yeast extract 1%, peptone t%, pH 7.0). The seed culture was prepared by growing cells in a 250 mL shake-flask containing 100 mL of medium for 12 hours. A basal medium (Table I(A)) was used for
-
Upload
tae-ho-lee -
Category
Documents
-
view
217 -
download
1
Transcript of Effects of medium components on L-ornithine production by Brevibacterium ketoglutamicum
Biotechnol. Bioprocess Eng. 1996, 1, 41-45
E f f e c t s of M e d i u m C o m p o n e n t s on L - O r n i t h i n e P r o d u c t i o n by Brevibacterium ketoglutamicum
Tae Ho Lee, Yong K e u n Chang +, Wook S a n g Ryu*, B o n g H y u n Chung* and Y o u n g Hoon Park*
Depar tment of Chemical Engineering and Bioprocess Engineering Research Center, Korea Advanced Inst i tute of Science and Technology, Taejon 305-70 ]_, Korea *Korea Research Inst i tute ofBioscience & Biotechnology, P.O. Box 17, Taejon 305-606, Korea
Effects of yeast extract and ammonium sulfate were investigated on the production of L-or- nithine by an m-ginine auxotroph, Brevibaeterium ketoglutamicum in flask and batch cul- tures. Yeast extract as an arginine source and ammonium sulfate as an inorganic nitrogen source had significant effects on L-ornithine production and cell growth. L-ornithine pro- duction was repressed by the excessive addition of arginine. Reversion of auxotrophic cells to the wild type was observed when the initial yeast extract concentration was too low. There existed optimum concentrations of yeast extract and ammonium sulfate for L-or- nithine production. The effects of yeast extract and ammonium sulfate concentrations on the Leudeking-Piret model parameters were examined to analyze the relationship between cell growth and L-ornithine production.
Key words: L-ornithine, Brevibacterium ketoglutarnicurn, auxotroph, L-arginine
I N T R O D U C T I O N
L-ornithine belongs to the glutamic acid family and is an intermediate metabolite in arginine biosynthesis. It is known to be effective for the t r ea tment of liver diseases. Kinoshita et al. [11 reported tha t a citrulline- requir ing mu tan t of Corynebacterium gIutamieurn ac- cumula ted L-orni thine with a high .yield under ap- propriate fermentat ion conditions.
L-ornithine, as weli as citrulline and arginine, is syn- thesized via glutamic acid consuming energy (ATP), by- drogen donors, and other amino acids. Therefore, L-or- nithine production requires large amounts of carbon and nitrogen sources as well as aerobic culture con- ditions. Since L-ornithine (CsHI202N~) contains two ni- trogen atoms, the shortage of nitrogen source has an undesirable effect on its production. The shortage of a m m o n i u m ion p romotes c~-ketoglutaric acid pro- duction, which resul ts in a decrease of L-ornithine yield. Although a large amount of ammonium ion is re- quired, high ammonium concentrat ion is inhibi tory not only to the cell growth, but also to the production of L-ornithine [2].
When an arginine-auxotrophic mu tan t is used, ar- ginine or arginine-containing organic nut r ients such as peptone or yeas t extract mus t be supplied. The b iosynthe t ic pa thway of L-orni thine from giutamic acid and regulatory mechanisms involved have been studied in glutamic acid-producing bacteria [3, 4, 5]. The formation of N-acetyIglutamokinase, the second enzyme involved in this pathway, has been reported to be repressed by L-arginine in Brevibacterium flavum
Corresponding author Tel: 042-869-3927 Fax: 042-869-8800 e-maih [email protected]
[6]. In addition, its activity is inhibited by an excess amount of L-arginine. Therefore, the level of L-ar- gimne should be carefully controlled in the ferment- ative production of L-ornithine [7, 8, 9].
As mentioned above, there have been a number of re- ports on the effects of arginine or ammonium ion on L- ornithine production. However, modelling of this pro- cess has never been at tempted, which would be useful for unders tanding the fermentat ion process and the pa t te rn of L-ornithine production. In this study, the el- fects of yeas t extract, arginine, and ammonium sulfate on L-orni th ine product ion by Brevibacterium keto- glutamicum were evaluated in flask and batch cub tures. Some modelling considerations were made on the kinetic relationship between ornithine production and cell g~owth, and on how the kinetic parameters were affected by the varying concentrations of the key components.
MATERIALS AND METHODS
Microorganism
The microorganism used in this s tudy was Bre- vibacterium ketoglutarnicurn 1047, which is an L-argi- nine or, more precisely, L-citruiline a~xotrophic mu- tant . Stock culture was prepared in a glycerol solution (15%) and stored at -4~
Culture Condition
The growth medium used for inoculum was a YPD medium (glucose 2%, yeast extract 1%, peptone t%, pH 7.0). The seed culture was prepared by growing cells in a 250 mL shake-flask containing 100 mL of medium for 12 hours. A basal medium (Table I(A)) was used for
42 BioteehnoL Bioprocess Eng. 1996, Vol. 1, No. 1
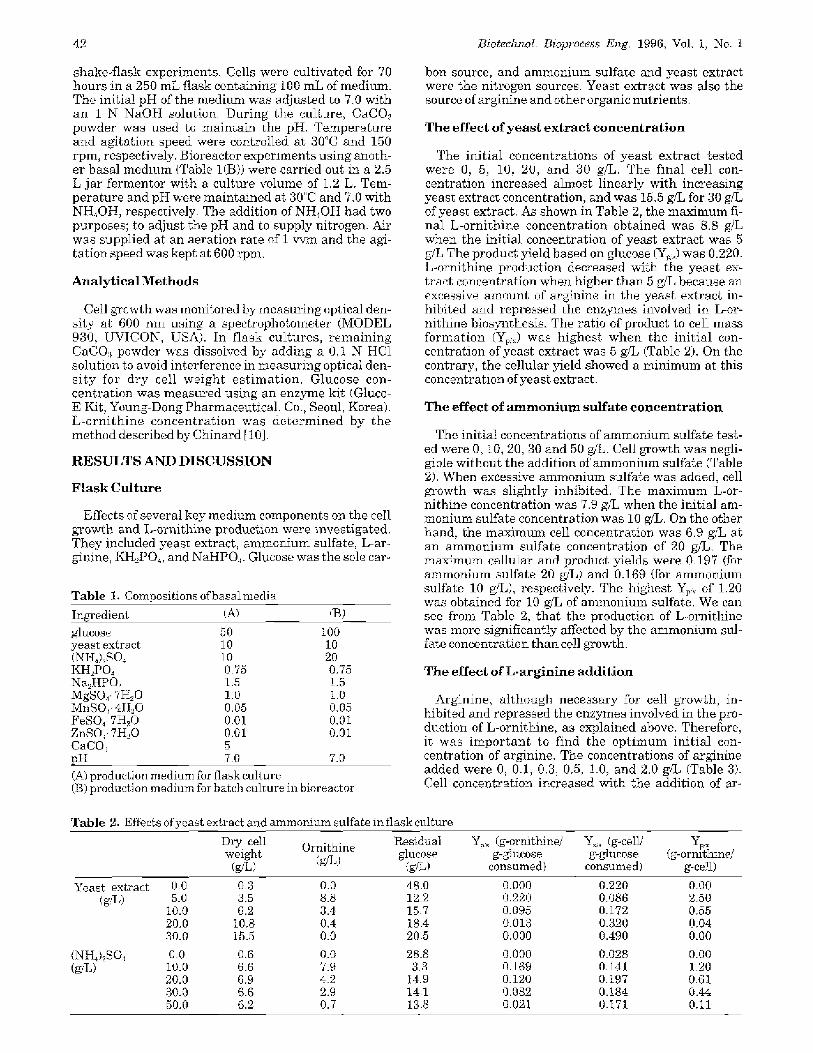
shake-f lask experiments. Cells were cult ivated for 70 hours in a 250 mL flask containing 100 mL of medium. The initial pH of the medium was adjusted to 7.0 with an 1 N N a O H solution. Dur ing the culture, CaCOa powder was used to main ta in the pH. T e m p e r a t u r e and ag i t a tkm speed were controlled a t 30~C and 150 rpm, respectively. Bioreactor exper iments us ing anoth- er basal med ium (Table I(B)) were carried out in a 2.5 L j a r fe rmente r with a cul ture volume of 1.2 L. Tem- pe ra tu re and p H were main ta ined at 30"C and %0 with NH.,OH, respectively. The addition of NH~OH had two purposes; to adjust the pH and to supply nitrogen. Air was supplied at an aerat ion ra te of 1 vvm and the agi- tat ion speed was kept at 600 rpm.
Analyt ica l Methods
Cell growth was monitored by measu r ing optical den- sity a t 600 mn using a spec t rophotometer (MODEL 930, UVICON, USA). In f lask cul tures , r e m a i n i n g CaCO:, powder was dissolved by adding a 0.1 N HC1 solution to avoid interference in measu r ing optical den- s i ty for d ry cell we igh t e s t ima t ion . Glucose con- cent ra t ien was measured using an enzyme kit (Gluco- E Kit, Young-Dong Pharmaceut ical . Ca., Seoul, Korea). L - o r n i t h i n e concen t ra t ion was d e t e r m i n e d by the method described by Chinard [I0].
R E S U L T S A N D D I S C U S S I O N
Flask Culture
Effects of several key med ium components on the ceil growth and L-ornithine product ion were investigated. They included yeas t extract, a m m o n i u m sulfate, L-ar- ginine, Kt-t~PO~, and NaHPO.,. Glucose was the sole car-
Tab le 1. Compositions of basal media
Ingn-edient (A) (13)
glucose 50 i00 yeast extract 10 i0 (NHd,:SO~ 10 20 KH~P04 0.75 0.75 Na2HPO~ 1,5 1.5 MgSQ. 7H20 1.0 1.0 MnSO," 4H20 0.05 0.05 FeSO< 7H~O 0.01 0.0i ZnSO,~, 7H~O 0,01 0.01 CaCO:~ 5 pH 7.0 7.0 (A) production medium for flask culture (B) production medium for batch culture in bioreactor
ben source, and a m m o n i u m sulfate and yeas t extract were the ni t rogen sources. Yeast extract was also the source of arginine and other organic nutr ients .
T h e effect of y ea s t extract c o n c e n t r a t i o n
The ini t ial concent ra t ions of yea s t ex t rac t tes ted were 0, 5, 10, 20, and 30 g/L. The f inal cell con- centrat ion increased almost l inearly with increasing yeas t extract concentration, and was 15.5 g/L for 30 g/L of yeas t extract. As shown in Table 2, the m a x i m u m fi- nal L-orni th ine concentra t ion obtained was 8.8 g./L when the initial concentrat ion of yeas t extract was 5 g/L The product yield based on glucose (Y,:.,) was 0.220. L-orni thine production decreased with the yeas t ex- t ract concentrat ion when higher than 5 g/L because an excessive amoun t of a r ~ n i n e in the yeas t extract in- hibited and repressed the enzymes involved in L-or- ni thine biosynthesis. The ratio of product to cell mass fo rma t ion (Yp...5 was h ighes t w h e n the in i t ia l con- centrat ion of yeas t extract was 5 g/L (Table 2). On the contrary, the cellular yield showed a m i n i m u m at this concentrat ion of yeas t extract.
T h e effect of a m m o n i u m sulfate c o n c e n t r a t i o n
The initial concentrat ions of ammonium sulfate test- ed were 0, 10, 20, 30 and 50 g/L. Celt growth was negli- gible wi thout the addition of a m m o n i u m sulfate (Table 2). When excessive a m m o n i u m sulfate was added, cell gTewth was sl ightly inhibited. The m a x i m u m L-or- ni thine concentrat ion was 7.9 g,'% when the initial am- monium sulfate concentrat ion was 10 g/L. On the other hand, the m a x i m u m cell concentrat ion was 6.9 g,(L a t an a m m o n i u m sulfate concentrat ion of 20 g/L. The m a x i m u m cellular and product yields were 0.197 (for a m m o n i u m sulfate 20 g/L) and 0.169 (for a m m o n i u m sulfate 10 g/L), respectively. The highest Yp..~ of 1.20 was obtained for 10 g/L of a m m o n i u m sulfate. We can see from Table 2, tha t the production of L-ornithine was more significantly affected by the a m m o n i u m sul- fate concentrat ion than cell growth.
T h e e f f ec t o f L - a r g i n i n e a d d i t i o n
Arginine, a l though necessa ry for celt gro~ath, in- hibited and repressed the enzymes involved in the pro- duction of L-ornithine, as explained above. Therefore, it was i m p o r t a n t to find the o p t i m u m ini t ial con- centrat ion of arginine. The concentrat ions of arginine added were 0, 0.1, 0.3, 0.5, 1.0, and 2.0 g/L (Table 3). Ceil concentrat ion increased with the addition of or-
Tab le 2. Eft~cts of yeast extract and ammonium sulfate in flask culture
Dl'y cell Ornithine Residual Y~ (g-ornithine] Y~.~ (g-cell/ Yp~ weight (g/L) glucose g-glucose g-glucose (g-ormthine/
(g/L) %/L) consumed) consumed) g-cell)
Yeast extract 0.0 0.3 0.0 48.0 0.000 0.220 0.00 (g[L) 5.0 3.5 8.8 12.2 0.220 0.086 2.50
10.0 6.2 3.4 15.7 0.095 0.172 0.55 20.0 10.8 0.4 18.4 0.013 0.320 0,04 30.0 15.5 0.0 20.5 0.000 0.490 0.00
(NKd2SO~ 0.0 0.6 0.0 28.8 0.000 0.028 0.00 (f~'%) i0.0 6.6 7.9 3,3 0,169 0,141 1,20
20.0 6,9 4.2 14.9 0,120 0,197 0.61 30_0 6.6 2.9 14.1 0.082 0.184 0.44 50.0 6.2 0.7 13.8 0.021 0.171 0.ii
Biotechnol. Bioprocess Eng. 1996, Vol. 1, No. 1
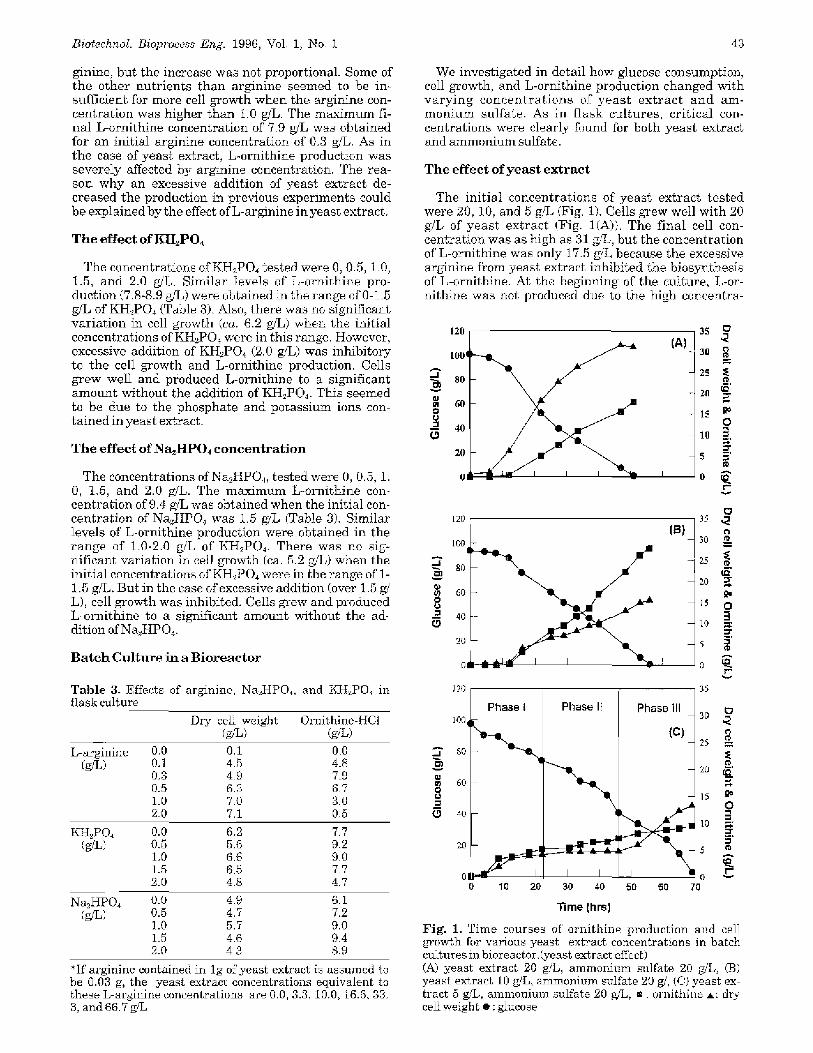
ginine, but the increase was not proportional. Some of t he other nu t r ien ts than arginine seemed to be in- sufficient for more cell growth when the arginine con- centra t ion was higher than t.0 g/L. The m a x i m u m fi- na l L-ornithine concentrat ion of 7.9 g/L was obtained for an initial arginine concentrat ion of 0.3 g/L. As in the case of yeas t extract, L-ornithine production was severely affected by arginine concentration. The rea- son why an excessive addi t ion of yeas t ex t rac t de- creased the production in previous exper iments could be explained by the effect of L-arginine in yeas t extract .
The effect of KH=PO~
The concentrat ions of KH2PO4 tested were O, 0.5, 1.0, 1.5, and 2.0 g/L. Simi lar levels of L-orni th ine pro- duction (7.8-8.9 g/L) were obtained in the range of 0-2.5 g / L o f K H . , P O 4 (Table 3). Also, there was no significant var ia t ion in cell growth (ca. 6.2 g/L) when the initial concentrat ions of KH~PO, were in this range. However, excessive addition of KH.,PO4 (2.0 g/L) was inhibi tory to the cell growth and L-ornithine production. Cells grew well and produced L-ornithine to a significant a m o u n t wi thout the addition of KH2PO4. This seemed to be due to the phosphate and po tass ium ions con- ta ined in yeas t extract.
The effect of NazHPO4 concentration
The concentrat ions of Na2HPO4, tes ted were 0, 0.5, i. 0, 1.5, and 2.0 g/L. The maximum L-ornithine con- centration of 9.4 gi~ was obtained when the initial con- centration of Na~HPO~ was 1.5 g/L (Table 3). Similar levels of L-ornithine production were obtained in the r a n g e of 1.0-2.0 g/L of KI-[2P04. There was no sig- nif icant var ia t ion in cell growth (ca. 5.2 g/L) when the init ial concentrat ions of KH,,PO4 were in the range of 1- 1.5 g/L. But in the case of excessive addition (over 1.5 g~ L), cell growth was inhibited. Cells grew and produced L-orni th ine to a significant amoun t without the ad- dition of Na.,HP04.
Batch Culture in a Bioreactor
Table 3. Effects of arginine, Na2HP04, and KH~PO~ in flask calture
D ~ ceil w e i ~ t Ornithine-HC1 (g~) (g/L)
L-arginine (g/L)
0.0 0.1 0.0 0J 4.5 4.8 0.3 4.9 7.9 0.5 6.3 6.7 1.0 7.0 3.0 2.0 7.1 0.5
Kt-I2P04 0.0 6.2 7.7 (g~) 0,5 5.6 9,2
1.0 6.6 9.0 1.5 6,5 7.7 2.0 4.8 4.7
N a 2 H P O 4 0.0 4.9 6. i (g/L) 0.5 4.7 7.2
1.0 5.7 9.0 t.5 4.6 9.4 2.0 4.3 8.9
*If arginine contained in lg of yeast extract is assumed to be 0.03 g, the yeast extract concentrations equivalent to these L-arginine concentrations are 0.0, 3.3, 10.0, 16.6, 33. 3, and 66.7 g/L
43
We invest igated in detail how glucose consumption, cell growth, and L-ornithine production changed with v a r y i n g c o n c e n t r a t i o n s of y e a s t e x t r a c t a n d am- mon ium sulfate . As in f lask cul tures , cri t ical con- centra t ions were clearly found for both yeas t extract and a m m o n i u m sulfate.
The effect of yeast extract
The init ial concentra t ions of yea s t ex t rac t tes ted were 20, t0, and 5 g/L (Fig. 1). Cells grew well with 20 g/L of yea s t ex t rac t (Fig. I(A)). The f inal cell con- centra t ion was as high as 31 g.'L, but the concentrat ion of L-orni thine was only 17.5 g/L because the excessive arginine from yeas t extract inhibited the biosynthesis of L-ornithine. At the beginning of the culture, L-or- ni thine was not produced due to the high concentra-
12o ~ (A) 13 o3s ~g
811 - -. 2O
611 - 15
"~ 40 - 10
200 S ~ '
. i 11
t20 35 ,r
i Iml
/ 2o
as 40 10
20 - - 5 ~ '
0 J 0 G
~20 ~ - - 35
~L- Phase { Phase I[ Phase {H i00 30
g~176 ,: 20
15 go
40 {o _~
2 s
o [ - 0 10 20 3o 4o so so 7o
"time (hrs)
Fig. 1. Time courses of ornithine production and cell growth for various yeast extrac~ concentrations in batch c~altures in bioreactor.(yeast extract effect) (A) yeast extract 20 g/L, ammonium sulfate 20 ~%, (]3) yeast extract 10 g/L, ammonium sulfate 20 g/, (Ct yeast ex- tract 5 g,%, ammonium sulfate 20 9.%, | : ornithine ~: d D" celt weight r : glucose

44
120
...M
o u~ o
lO01
80
60
40
~0
01
(A) 35 0
30 o
25
K
0 10 ~_,
.9 .~'
0
o
_=_
35 0 ,.2
30
20 ,~'
0
5
=
120 [ 35
(st 100 -- 30
80 25
l0
5
0
120
t j
i004 ~X~
20
0 o 10 20 30 4o
Time (hrs)
(c)
,$0 6o
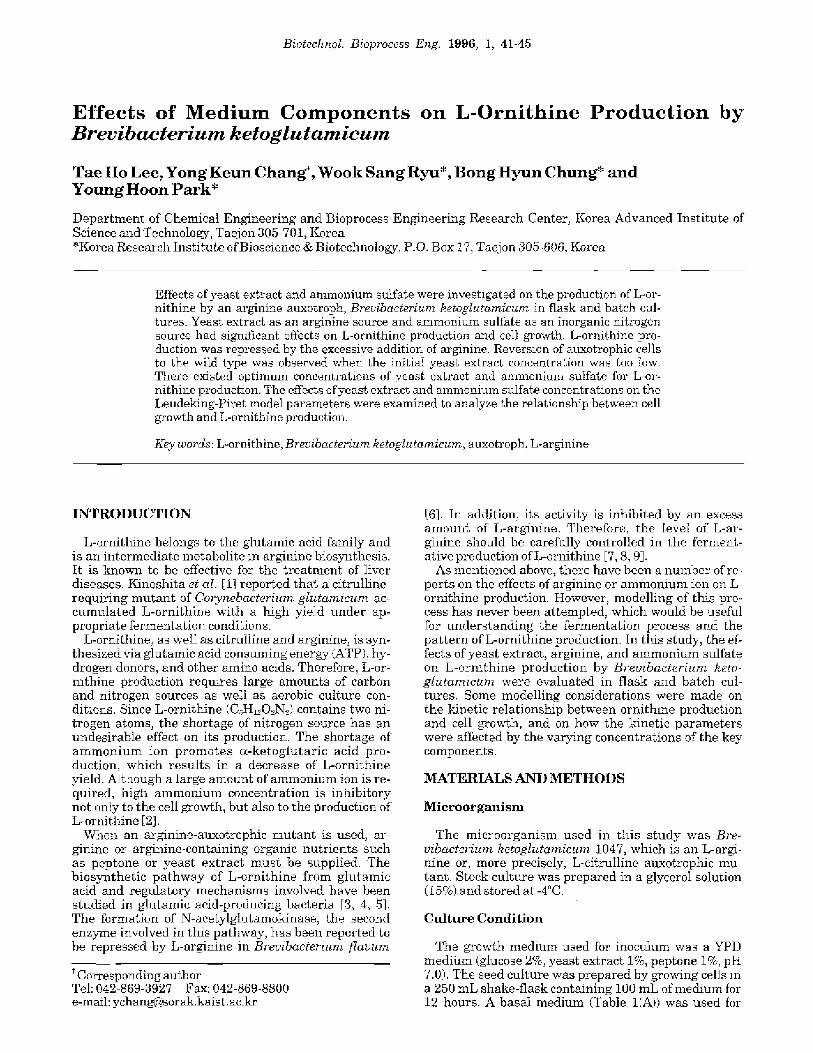
Fig. 2. Time courses of ornithine production and cell growth for various ammonium sulfate concentrations in batch cultures in bioreactor (ammonium sulfate effect). (A) ammonium sulfate 30 g/L, yeast extract 10 g/L, (B) am- monimn sulfate 20 g,", yeast extract 10 g,.%, (C) ammonium sulfate 10 g/L, yeast extract 10 g/L, ,, : ornithine A: din cell weight �9 : glucose
tion of arginine. After 12 hours, L-ornithine started to be produced. Glucose (100 gfL) was completely con- sumed in 52 hours.
As shown in Fig. 2(B), cult ivation with a lower con- centra t ion of yeas t extract (10 g,%) resul ted in a higher concentrat ion of L-ornithine(28.3 g~%). The final cell concentrat ion was 17 g/L, which was much lower than t h a t obtained with 20 g~L of yeast extract. Glucose was completely consumed in 55 hours.
Fig. I(C) shows the resul ts for 5 ~ L of yeas t extract. This concentrat ion was tbund to be the op t i m u m in the f lask culture in which a lewer glucose concentrat ion of 50 g..,'L was used. Cell concent ra t ion inc reased ex- ponen t i a l ly to 4 g/L (Phase i), and t h e r e a f t e r cell ga.owth was re tarded for 30 hours due to the depletion of yeas t extract (Phase II). Cell concentrat ion again in- creased after 46 hours (Phase III). This was due to the a p p e a r a n c e of r e v e r t a n t cells tha t lost the charac- ter is t ics of" an anx~troph. A low production of L-or- ni thine (10 g/L) was obtained due to the growth of re-
Biotechnol. Bioprocess Eng. 1996, Vol. 1, No. 1
ve r t an t cells and the inhibition of' arginine produced by the rever tan t cells.
The effect of varying concentrat ion of yeas t extract is summar ized in Table 4. The mean cell concentration (X) is defined as the average of the initial and final cell concentrat ions in each run or each phase of a run, which is roughly the ha l f of the final concentration since the initial celt concentrat ion is negligible. Such definition of X can be justif ied since the profiles of the cell concen t ra t ion a re a lmos t l inear . Here , a sys- temat ic analysis is in need, especially for the ease of 5 g/ L of yeas t extract concentration, which showed a rath- er complex nature. Orni thine is a p r i m a r y metaboli te and i ts p r o d u c t i o n is closely assoc ia ted with cell growth. I f we assume ornithine production is solely de- p e n d e n t on cell growth, the r a t e of orn i th ine pro- duction can be represen ted by
dP dX - (1)
dt dl
where ~ is a proport ional constant. This equat ion can be recast in an integrated f o r m , / ~ P : a A X . From this
we know tha t Ya.x- /~P - (~. Therefore, if the above A X
assumpt ion is true, the values of YP,rX for Phase I and Phase I I should be, even though roughly, the same. But, the value for Phase I I is considerably higher than t h a t for Phase I. Th is sugges t s an a u g m e n t e d ex- pression is in need for the analysis of ornithine pro- duction characteristics. For this reason, we suggest the Leudeking-Piret kinetics which is represen ted by
d-F- = a ~x + ~X (2) dt dt
This can be recas~ in an in tegra ted form
/~P = a/,.X + ~ X ~ t or Y~,.x = a+~ X~" (3) •
Following this expression, the higher value YP/X for Phase II is due to the larger value of the second term,
x -,%t. This is thought to be due to both an increased ,5.7<
value o f ~ and an increased value of ~ "~t (11.0 for /_\X
Phase I, 118.7 for Phase II). However, the first pa r t of the a rgument tha t an increased ~ causes the increased Y~,.x is not clear yet. It can be also explained by analyz- ing the da ta for the cases of 10 and 20 g/L of yeas t ex-
t ract concentrations. For both cases, the t e r m $ K /At A X
has the similm" value. But, Yr, x for the case of 10 a.% is much higher than tha t for 20 g/L. This is solely due to the larger value of~ for the case of 10 a~L. The reason is, as men t ioned earlier , t h a t the concentra t ion of or- ginine contained in yeas t extract ma in ta ined at a low- er level than the case of 20 ~% of yeas t extract con- centration. In conclusion, orni tbine formation can be r e p r e s e n t e d by a Leudek ing -P i r e t type kinet ic ex- pression in which the p a r a m e t e r ~ is negat ively de- penden t on the arginine concentration. The tow value of Yr• for Phase III seems to be due to the appearance and active growth of nonproductive r eve r t an t cells and thus a totally different analysis should be done for this.
T h e e f f e c t o f a m m o n i u m s u l f a t e
The ini t ial concen t r a t i ons of a m m o n i u m sulfa te
Biotechnol. Bioprocess Eng. 1996, Vol. 1, No. t 45
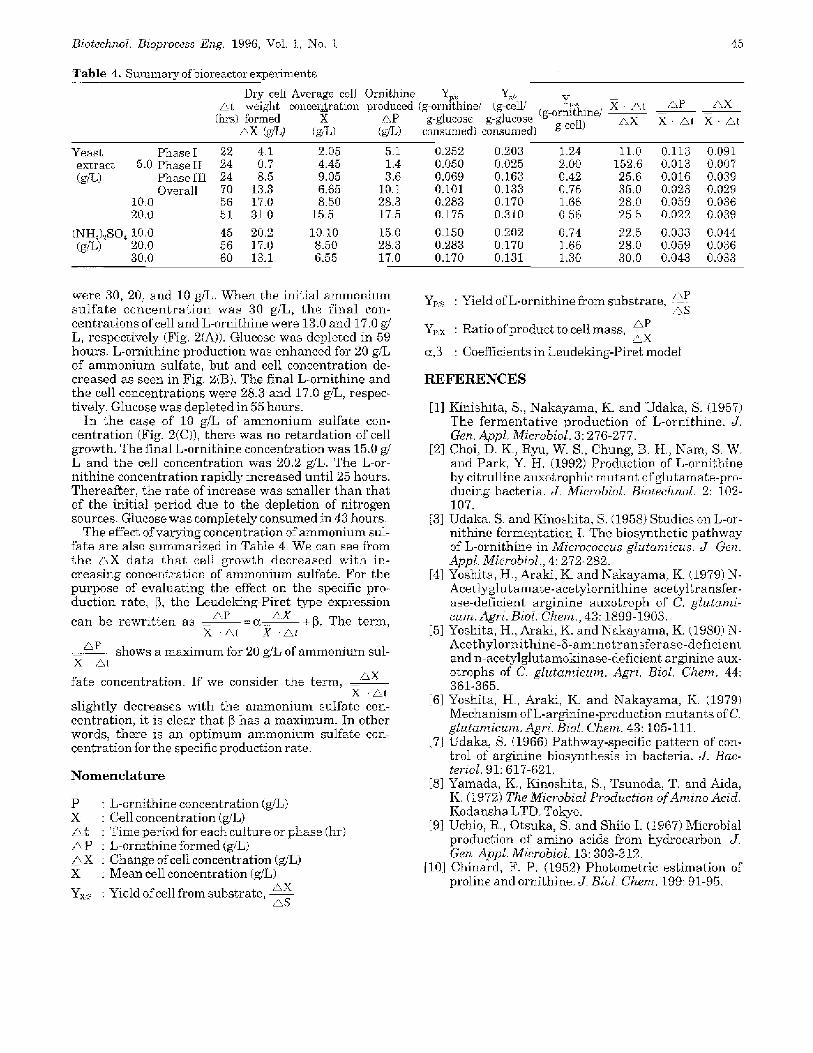
T a b l e 4. Summary. ofbioreactor experiments
Dry cell Average cell Ornithine Y~,,.~ ~'.t weight coneentrat.ion produced (g-ornithine/
(hrs) formed X .&P ~,X (g/L) (~'L) (g/L)
Y~' Y"'~ X- At AP z",X (g-cell,' (g-ornithine/
g-glucose g-glucose g-ceil) AX X, /Z_.t X , /_',d consumed) consumed)
Yeast Phase I 22 4.1 2.05 5.1 0.252 extract 5.0 Phase II 24 0.7 4.45 1.4 0.050 (g/L) Phase IiI 24 8.5 9.05 3.6 0.069
Overall 70 13.3 6.65 10. t 0.101 10,0 56 17.0 8.50 28.,3 0.283 20,0 51 3] .0 15.5 17.5 0.175
(NH~),,SO4 i0.0 45 20.2 i0.i0 15.0 0.150 (g./L) 20,0 56 17.0 8.50 28.3 0.283
30.0 60 13.1 6.55 17.0 0.170
0.203 1.24 l l .0 0.113 0.091 0.025 2.00 152.6 0.013 0.007 0.163 0.42 25.6 0.016 0.039 0.133 0.76 35.0 0.023 0.029 0.170 1.66 28.0 0.059 0.036 0.310 0.56 25.5 0.022 0.039
0.202 0.74 22.5 0.033 0.044 0.170 ] .66 28.0 0.059 0.036 0.131 t.30 30.0 0.043 0.033
were 30, 20, and 10 g/L. When the initial a m m o n i u m s u l f a t e c o n c e n t r a t i o n was 30 giL, the f inal con- eent ra t ions of cell and L-ornithine were 13.0 and 1%0 g/ L, respect ively (Fig. 2(A)). Glucose was depleted in 59 hours. L-ornithine production was enhanced for 20 g,% of a m m o n i u m sulfate, but and cell concentrat ion de- creased as seen in Fig. 203). The final Lmrni th ine and the cell concentrat ions were 28.3 and 1%0 gfL, respec- tively. Glucose was depleted in 55 hours.
In the ease of 10 g/L of a m m o n i u m sulfa te con- cent ra t ion (Fig. 2(C)), there was no re ta rda t ion of cell growth. The final L-ornithine concentrat ion was 15.0 g/ L and the cell concentration was 20.2 gj%. The L-or- ni thine concentrat ion rapidly increased unti l 25 hours. Thereaf ter , the ra te of increase was smal ler than tha t of the initial period due to the depletion of nitrogen sources. Glucose was eompletely consumed in 43 hours.
The effect of varying concentrat ion of a m m o n i u m sul- fate are also summar ized in Table 4. We can see from the /.',X d a t a t h a t cell g rowth d e c r e a s e d wi th in- creas ing concentrat ion of a m m o n i u m sulfate. For the purpose of eva lua t ing the effect on the specific pro- duction rate , [~, the Leudeking-Piret type expression
can be r ewr i t t en as z',P - a .... ~.X +[3. The term, X_ . A~ X �9
AP shows a m a x i m u m for 20 K/L of a m m o n i u m sul- x -&t
fate concentrat ion. I f we consider the term, _ / ' X X ./". t
s l ight ly decreases with the a m m o n i u m sulfate con- centrat ion, i t is clear tha t V~ has a max imum. In other words, there is an op t imum a m m o n i u m sulfate con- centra t ion for the specific production rate.
N o m e n c l a t u r e
P : L-ornithine concentrat ion (g/L) X : Cell concentrat ion (g,%) ~ t : Time period for each culture or phase (hr) z~P : L-ornithine formed (g/L) z~X : Change of cell concentration (g/L) X : Mean cell concentrat ion (K/L)
Y• : Yield of cell from substrate, AX /,.S
YP..s : Yield of L-ornithine from substrate , AP
/.,p Y~,.x : Ratio of product to cell mass, ~ x
a,~ : Coef f ic ien ts inLeudeMng-Pi re tmodeI
R E F E R E N C E S
[11 Kinishita, S., N a k a y a m a , K. and Udaka, S. (1957) The f e rmen ta t i ve product ion of L-orni thine. d. Gen. Appl. Microbiol. 3: 276-277.
[2] Choi, D. K., Ryu, W. S., Chung, B. H., Nam, S. W. and Park, Y. H. (1992) Production of L-ornithine by citrulline auxotrophic m u t a n t o f g h t a m a t e - p r o - dueing bacteria. J . Microbiol. Biotechnol. 2: 102- 107.
[3] Udaka, S. and Kinoshita, S. (1958) Studies on L-or- ni thine fe rmenta t ion I. The biosynthet ic pa thway of L-ornithine in Micrococcus glutamicus. J. Gen. Appl. Mierobiol., 4: 272-282.
[4] Yoshita, H., Araki, K. and N a k a y a m a , K. (1979) N- A c e t l y g h t a m a t e - a e e t y l o r n i t h i n e ace ty t t ransfer - ase-deficient arginine auxotroph of C, glutami- cure. Agri. Biol. Chem, 43: 1899-1903.
[5] Yoshita, H., Araki, K. and Nakayama , K. (t980) N- A c e t h y l o r n i t h i n e - 8 - a m i n o t r a n s f e r a s e - d e f i c i e n t and n-acetylglutamokinase-deficient arginine aux- otrophs of C. glutamicum. Agri. Bid. Chem. 44: 361-365.
[6] Yoshita, H , Araki, K. and Nakayama , K. (1979) Mechanism of L-arginine-production m u t a n t s of C. glutamicum. Agri. Biol. Chem. 43: 105-111.
[7] Udaka, S. (1966) Pathway-specif ic pa t t e rn of con- trol of arginine biosynthesis in bacteria, J. Bac- teriol. 9i: 617-621.
[8] Yamada, K , Kinoshita, S., Tsunoda, T. and Aide, K (1972) The Microbial Production of Amino Acid. Kodansha LTD. Tokyo.
[9] Uchio, R , Otsuka, S. and Shiio I. (1967) Microbial product ion of amino acids from hydrocarbon. J. Gen. Appl. Microbiol. 13: 303-312.
[10] Chinard, F. P. (1952) Photometr ic es t imat ion of proline and ornithine. J . Biol. Chem, 199: 91-95.