Effects of machining abuse on the surface properties of ... · (RCCM-2007 Class 1) employing...
18
Effects of machining abuse on the surface properties of AISI 316L stainless steel A. Maurotto a,* , D. Tsivoulas b,c , Y. Gu b , M. G. Burke b a Nuclear AMRC, The University of Sheffield, Advanced Manufacturing Park, Rotherham, S60 5WG, UK b Materials Performance Centre, The University of Manchester, Manchester, Oxford Road, M13 9PL, UK c Clean Energy/Nuclear Services, Amec Foster Wheeler, 601 Faraday Street, Birchwood Park, Warrington, WA3 6GN, UK * Corresponding author’s email: [email protected] ; phone +441142158013 Abstract A Design of Experiments (DoE) approach was used to characterise the effects of dry machining at abusive conditions on the austenitic stainless steel AISI 316L. Surface roughness, hardness, martensite fraction, residual stresses and surface defects (welded chips, cracks) were evaluated against the cutting parameters (speed, depth-of-cut and feed) to build a model weighting their contribution. Results are presented in colour contour plots which allow for an in-depth understanding of the parameters’ combined effects on the surface properties of the material upon dry milling. Using the statistical model it was possible to identify optimum combinations of cutting parameters on the grounds of minimising undesirable effects on the material. Eventually, a sample “risk of failure” map was derived by evaluating the impact of the process parameters’ statistical variations. Keywords: Austenitic stainless steel; Milling; Martensite; Residual Stress; Surface integrity. 1. Introduction Austenitic stainless steels are used in various industrial applications when high corrosion resistance and ductility are required. They see widespread use in the nuclear and chemical industries; generally in aggressive environments where a passive oxide layer on the surface can prove beneficial [1]. On the other hand, alloyed stainless steels are characterised by poor machinability due to their high ductility and low heat conductivity [2]. One of the main issues arising from abusive machining of stainless steels is the formation of α’ and ε martensite, which is believed to be more severe in AISI 304L than in AISI 316L. In any case, careful manufacture is of key importance in maintaining the desirable fatigue and corrosion resistance properties of the finished components
Transcript of Effects of machining abuse on the surface properties of ... · (RCCM-2007 Class 1) employing...

Effects of machining abuse on the surface properties of
AISI 316L stainless steel
A. Maurottoa,* , D. Tsivoulasb,c, Y. Gub, M. G. Burkeb
a Nuclear AMRC, The University of Sheffield, Advanced Manufacturing Park, Rotherham, S60 5WG, UK
b Materials Performance Centre, The University of Manchester, Manchester, Oxford Road, M13 9PL, UK
c Clean Energy/Nuclear Services, Amec Foster Wheeler, 601 Faraday Street, Birchwood Park, Warrington,
WA3 6GN, UK
* Corresponding author’s email: [email protected] ; phone +441142158013
Abstract
A Design of Experiments (DoE) approach was used to characterise the effects of dry machining at
abusive conditions on the austenitic stainless steel AISI 316L. Surface roughness, hardness,
martensite fraction, residual stresses and surface defects (welded chips, cracks) were evaluated
against the cutting parameters (speed, depth-of-cut and feed) to build a model weighting their
contribution. Results are presented in colour contour plots which allow for an in-depth
understanding of the parameters’ combined effects on the surface properties of the material upon
dry milling. Using the statistical model it was possible to identify optimum combinations of cutting
parameters on the grounds of minimising undesirable effects on the material. Eventually, a sample
“risk of failure” map was derived by evaluating the impact of the process parameters’ statistical
variations.
Keywords: Austenitic stainless steel; Milling; Martensite; Residual Stress; Surface integrity.
1. Introduction
Austenitic stainless steels are used in various industrial applications when high corrosion resistance
and ductility are required. They see widespread use in the nuclear and chemical industries;
generally in aggressive environments where a passive oxide layer on the surface can prove
beneficial [1]. On the other hand, alloyed stainless steels are characterised by poor machinability
due to their high ductility and low heat conductivity [2]. One of the main issues arising from
abusive machining of stainless steels is the formation of α’ and ε martensite, which is believed to be
more severe in AISI 304L than in AISI 316L. In any case, careful manufacture is of key importance
in maintaining the desirable fatigue and corrosion resistance properties of the finished components
[3].
A well-known consequence of abusive machining is the generation of high residual stresses due to
severe deformation on the surface, which results in a strain misfit through the material volume [4].
During the cutting process the material is subject to compressive stresses at the tip of the cutting
tool and tensile stresses at its end [5]. Additionally, the heat generated during machining can
contribute to increasing the overall tensile stress field [6]. Excessive plastic deformation in stainless
steels is also known to promote the formation of strain-induced martensite, ultimately reducing the
ductility of the finished surfaces and adding to the development of residual stresses due to the
volume misfit between the transformed phase and austenite [7].
The aim of the present work is to characterise the response of AISI 316L to abusive dry-milling
conditions using an extended range of cutting parameters and a Design of Experiments (DoE)
approach. To this end, a statistical model capable of predicting surface integrity with respect to
interactions of the different cutting parameters in challenging machining conditions is employed.
2. Material and methods
The material investigated in the current study is a commercially available AISI 316L austenitic
stainless steel. A rolled, laser-cut, 20 mm thick plate was band sawn into coupons and the
machining tests were carried out on the plane defined by the rolling direction (RD) and normal
direction (ND). Care was taken to remove the laser-cut edge prior to any machining process [8].
The machining of a narrow groove J-weld was the selected cutting method due to the combination
of side-milling and face-milling which are necessary to create the curvature leading to the fillet on
the edge of the sample. Each test was conducted with a new cutting tool edge, as tool wear is known
to affect both the magnitude of residual stresses and the surface integrity of the finished components
[6].
Experiments were performed on a Mazak Vertical Centre Smart 430A (3-axis milling machine) with
a Sandvik Coromill R300 tool head, having a diameter of 53 mm, extra close pitch and 5 insert
posts. Commercially available tungsten carbide inserts (grade 1040) with a diameter of 12 mm
(R300-1240) were selected for the machining tests due to their sharp ground edge and hard coating.
A 7° positive rake angle was selected for the tool with the aim of reducing build-up edge formation
under the challenging dry milling conditions.
A “Design of Experiments” (DoE) approach was used to minimise the number of trials needed to
complete the characterisation. A full factorial design with three centre points (N=11) was used to

identify which cutting parameters and their interactions had a statistically significant effect on the
measured responses. Tests were always randomised to minimise the effect of slight differences in
the cutting conditions or machine/operator effects.
The DoE incorporated three key process parameters (Table 1); depth of cut (ap), feed per tooth (fz)
and cutting speed (Vc). Variability and repeatability of the system's response were estimated by
centre point replicates. Analysis was performed using Umetric's software Modde version 10.1.1 and
the Partial Least Squares method to process multiple responses at the same time, taking their
covariance into account [9].
Table 1: Range of process parameters used in this work.
Abbreviation Parameter Range
Vc Cutting speed 120-350 m/min
ap Depth of cut 1.5-3.0 mm
fz Feed per tooth 0.15-0.35 mm
Several responses (Table 2) were recorded from experimental tests in both side-milling and face-
milling; residual stresses, roughness, quality, ferrite content, Vickers micro-hardness of the surface
at shallow (~5 μm) and deep (>25 μm) penetration of the indenter. Residual stress measurements
were performed using X-ray diffraction in a Proto iXRD Combo residual stress analyser. Electron
backscatter diffraction (EBSD) analysis was performed on the machined cross-section samples
using an FEI Quanta 650 FEG-SEM operated at 20 kV to assess the thickness of the deformed layer.
Penetrating dye and developer were used to reveal the presence of hidden cracks or welded chips on
the surface of the finished component. A certified evaluator performed a standard procedure
(RCCM-2007 Class 1) employing Johnson and Allen chemicals; JAP (solvent washable dye), JAC-
2 (hydrocarbon based solvent), JAD (solvent based developer). Coupons were assigned score
numbers according to the number of defects present; 1 for no defects, 2 for one or two defects, and
3 for more than two defects. Strain-induced martensite was assessed using a feritscope (Fischer
FMP30) combining eddy currents and magnetic detection by averaging five areas for each sample.
Surface roughness was evaluated by a Mitutoyo Surftest SJ-410 stylus instrument, by averaging 10
areas for each sample. Five machined surfaces in the fillet area (face-milled) and five surfaces in the
side-milled area were selected for each machining coupon.

Table 2: Process responses used as model input (aim to minimise them all).
Response Type
Ra face-mill Quantitative continuous
Ra side-mill “
Residual stress “
Ferrite side-mill “
Vickers hardness (shallow) “
Vickers hardness (deep) “
Quality Quantitative multi-level
3. Results
3.1 Surface roughness
Several measurements were averaged for each individual sample to minimise the effects of material
inhomogeneity or any accidental handling damage. The standard deviation was used to evaluate the
quality of the measured data; replicate samples were used to verify the response of the system.
In Figures 1a and 2a, each point represents the median roughness of a work-piece. Surface
roughness Ra appeared to show little dependence on the cutting parameters with the exception of
few extremes. As expected, the results for face-milled and side-milled specimens exhibited
completely different spreads, with those for the latter being significantly higher. In both cases the
proposed model showed high adherence (R2) and predictive power (Q2) to the experimental results
with excellent model validity (MoV) and good reproducibility (Rep). Results were normally
distributed in both cases (Figures 1b and 2b, 1d and 2d) whereas plots 1c and 2c identified the
coefficients on each model and their statistical significance.

Figure 1: Face-milled surface statistics plot for roughness Ra ; a) result plot, b) model evaluation
parameters, c) coefficient effect, d) normality check.
Figure 2: Side-milled surface statistics plot for roughness Ra; a) result plot, b) model evaluation
parameters, c) coefficient effect, d) normality check.
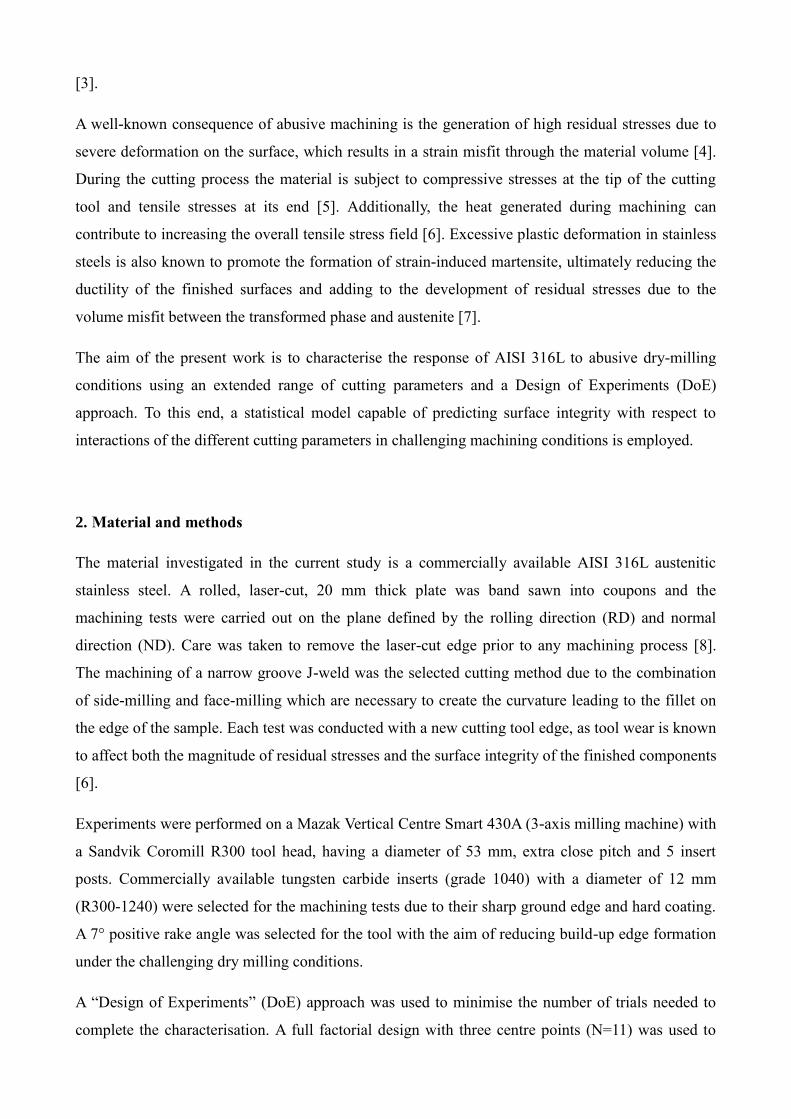
3.2 Residual stresses
X-ray diffraction was employed to measure surface residual stresses (Figure 3a). Similar to the
previous cases, data obtained from seven areas on the side-milled surface of each work-piece were
averaged. This was done to minimise the effects of local heterogeneities in the microstructure and
limit influences of potential surface defects, which could affect the stress values. The measured
response (RS) exhibited large sensitivity to changes in cutting parameters and a consistent trend for
all data points (Figure 3a, 3d). The centre points appeared to exhibit satisfactory reproducibility of
the process since the extremes differed by only ~40-50 MPa. This value lies within the experimental
error of the employed method. Results appeared moderately sensitive to cutting speed variations,
and much less sensitive to changes in the depth of cut (Figure 3c). All data points are within ±1.6
standard deviation with normally distributed residuals. Satisfactory R2, Q2 and MoV values showed
a good fit with the experimental data (Figure 3b).
Figure 3: Statistics plot for residual stress (RS) in side-milled surfaces; a) result plot, b) model
evaluation parameters, c) coefficient effect, d) normality check.
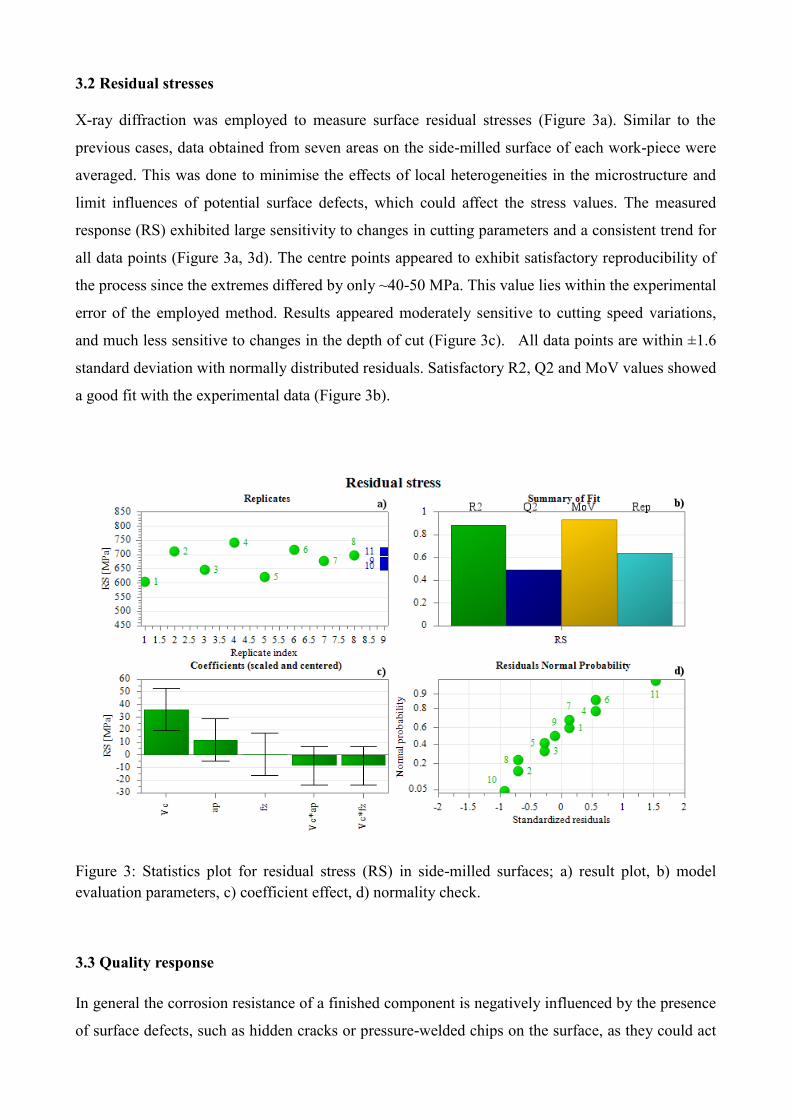
3.3 Quality response
In general the corrosion resistance of a finished component is negatively influenced by the presence
of surface defects, such as hidden cracks or pressure-welded chips on the surface, as they could act
as nuclei or crevices for corrosion. To empirically investigate the presence of surface defects the
“colour contrast solvent-removable method” was employed to reveal defects that were not visually
detectable..
Figure 4 presents details of the quality response. Most samples scored between 2 and 3 with mainly
chip-welding defects observed (Figure 4a). Points appear to be normally distributed with all
residuals lying on almost a straight line between ±2 standard deviation, an indication of the good
quality of the data (Figure 4d).. However, the replicate plot showed high variance in all samples
(Figure 4a). The corresponding model was affected by limited adherence to the experimental data
and poor predictive power (Figure 4b).
Figure 4: Statistics for Quality response; a) result plot, b) model evaluation parameters, c)
coefficient effect, d) normality check.
3.4 Phase transformations
Grain size reduction, hardening, and formation of strain-induced α’ martensite are common features
of abusively machined stainless steels. During milling, a fraction of the austenite phase transforms
to α’ martensite and martensite, the remaining austenite deforms by slip or twinning [7]. The
surface mechanical properties change greatly adjacent to the surface due to the combined effect of
the fine grain size and the presence of a complex deformed layer.
A feritscope produced by Fischer (model FMP30) was used to assess the combined martensite and

ferrite volume fractions for a measurement depth of approximately 2 mm. In the non-machined
material, measurements correspond solely to the amount of delta ferrite in the AISI 316L stainless
steel, since no martensite is present. In contrast, after deformation the ferritscope measurement
consists of both the delta ferrite and martensite, since they are both ferromagnetic.
Figure 5 shows the predictions of the proposed statistical model for the martensite content. The
model appears to have good adherence to the experimental data, as the high R2 value suggests, but
poor predictive power (low Q2). Noise in the experimental data prevented the development of a
more accurate response model.
Figure 5: Statistics for delta ferrite + martensite content in side-milled specimens; a) result plot, b)
model evaluation parameters, c) coefficient effect, d) normality check.
3.5 Deformation depth
Effects of machining on the surface microstructure were investigated in detail by SEM-EBSD
analysis. The EBSD maps in Figure 6 illustrate the deformed microstructure immediately below the
machined surface in two samples: one with the lowest measured surface hardness, and one with the
highest surface hardness.
The regions adjacent to the surface in the Euler colour maps of Figure 6a and d have considerable
proportions of non-indexed points due to the extensive local deformation. There is a high density
Delta Ferrite + Martensite
Delta Ferrite + Martensite (%)
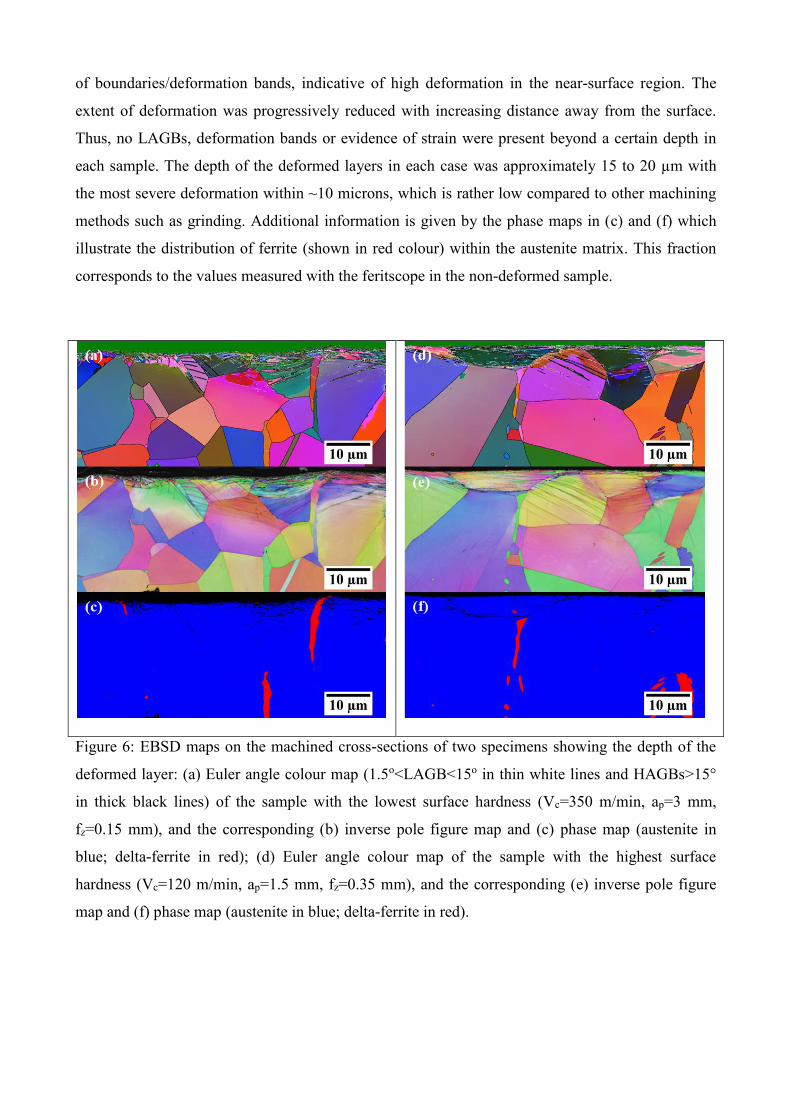
of boundaries/deformation bands, indicative of high deformation in the near-surface region. The
extent of deformation was progressively reduced with increasing distance away from the surface.
Thus, no LAGBs, deformation bands or evidence of strain were present beyond a certain depth in
each sample. The depth of the deformed layers in each case was approximately 15 to 20 µm with
the most severe deformation within ~10 microns, which is rather low compared to other machining
methods such as grinding. Additional information is given by the phase maps in (c) and (f) which
illustrate the distribution of ferrite (shown in red colour) within the austenite matrix. This fraction
corresponds to the values measured with the feritscope in the non-deformed sample.
Figure 6: EBSD maps on the machined cross-sections of two specimens showing the depth of the
deformed layer: (a) Euler angle colour map (1.5o<LAGB<15o in thin white lines and HAGBs>15°
in thick black lines) of the sample with the lowest surface hardness (Vc=350 m/min, ap=3 mm,
fz=0.15 mm), and the corresponding (b) inverse pole figure map and (c) phase map (austenite in
blue; delta-ferrite in red); (d) Euler angle colour map of the sample with the highest surface
hardness (Vc=120 m/min, ap=1.5 mm, fz=0.35 mm), and the corresponding (e) inverse pole figure
map and (f) phase map (austenite in blue; delta-ferrite in red).

4. Discussion
4.1 Overall evaluation of responses
The developed statistical model appears to satisfactorily predict effects of abusive machining in
AISI 316L and shows a good fit with experimental data (R2) for residual stress (RS), surface
roughness (Ra in both face- and side-mill) and martensite content (see Figure 9) in side-milled
specimens (Figure 7). Predictive power (Q2) was sufficient for the same responses apart from the
martensite content. The quality response was not as accurate, since it showed poor R2 and Q2.
Figure 7: Summary of model validity data for the proposed statistical model.
In order to summarise large amounts of information, contour plots were generated using the
developed statistical model. The presence of three parameters would require a 3D space to generate
a planar plot; however, this type of plot is difficult to read and interpret. By fixing the response
surface at various feed per tooth (fz) values, 2D plots were obtained where only cutting speed (Vc)
and depth of cut (ap) varied (Figures 8 and 9). This approach greatly simplified the analysis of the
results.
Although coefficient plots are presented for all the investigated parameters, those for the quality
response were not included in this work due to the relative poor quality of the predictions. Quality,
however, appeared to be little influenced by the cutting speed and depth of cut, but showed a strong
dependence on feed per tooth. Higher fz consistently resulted in a larger number of defects on the
Delta Ferrite
+ Martensite
surface.
4.1.1 Surface quality
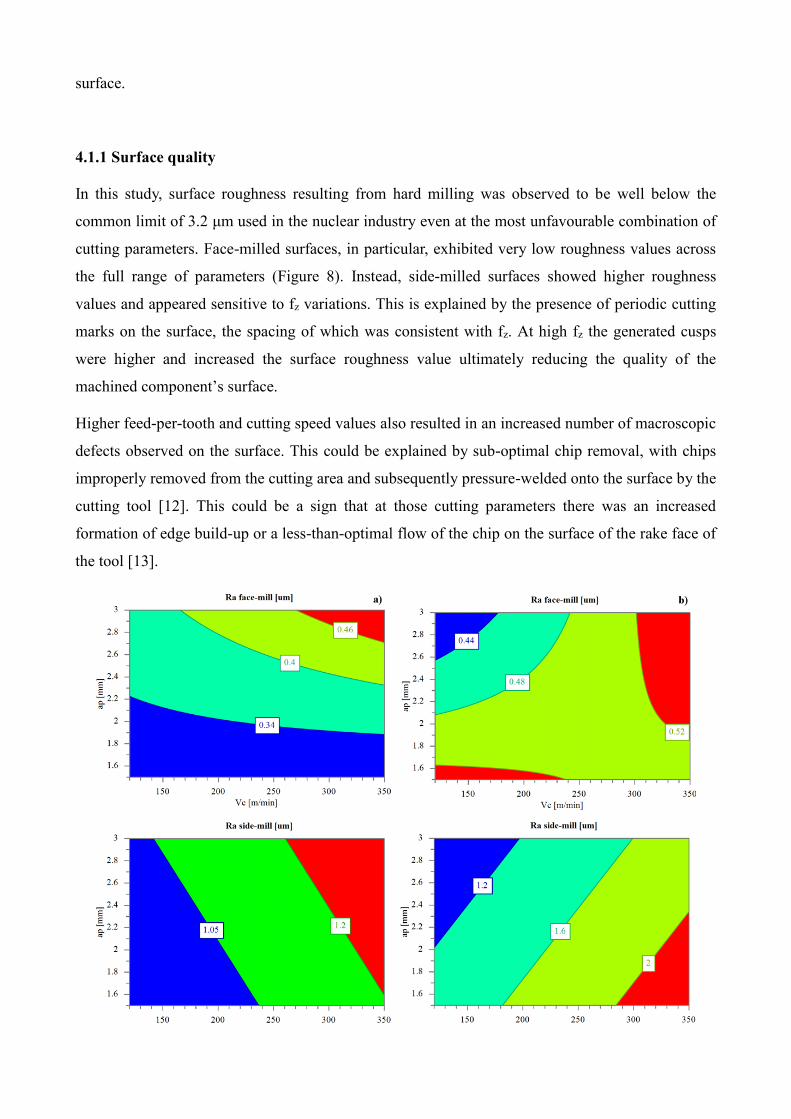
In this study, surface roughness resulting from hard milling was observed to be well below the
common limit of 3.2 μm used in the nuclear industry even at the most unfavourable combination of
cutting parameters. Face-milled surfaces, in particular, exhibited very low roughness values across
the full range of parameters (Figure 8). Instead, side-milled surfaces showed higher roughness
values and appeared sensitive to fz variations. This is explained by the presence of periodic cutting
marks on the surface, the spacing of which was consistent with fz. At high fz the generated cusps
were higher and increased the surface roughness value ultimately reducing the quality of the
machined component’s surface.
Higher feed-per-tooth and cutting speed values also resulted in an increased number of macroscopic
defects observed on the surface. This could be explained by sub-optimal chip removal, with chips
improperly removed from the cutting area and subsequently pressure-welded onto the surface by the
cutting tool [12]. This could be a sign that at those cutting parameters there was an increased
formation of edge build-up or a less-than-optimal flow of the chip on the surface of the rake face of
the tool [13].
Figure 8: Contour plot of Roughness Ra for face- and side- milled surfaces at; a) fz=0.15 mm, and b)
fz=0.35 mm.
The roughness of face-milled specimens appeared to increase marginally with ap and fz but
remained below 3.2 μm in the full experimental range (Figure 8a,b). Even at cutting speeds that
were almost three times the recommended values (Vc=135 m/min, ap=0.15 mm, fz=0.1 mm) with
high ap and fz, surface roughness was always below the study set limit of Ra=3.2 µm. Roughness
measured on side-milled surfaces was always double or triple the face-milled values, approaching
Ra= 2 µm for high Vc, fz and low ap (Figure 8c,d). The spread of results in the latter was also higher.
In addition, the effects of feed-per-tooth on roughness were statistically greater for side-milled
surfaces.
4.1.2 Residual stresses
Residual stresses are normally generated when machining a component and, when strongly tensile,
can negatively influence the resistance to stress corrosion cracking [11]. Tensile residual stresses
were observed in the dry-machined AISI 316L. The measured values were above the yield stress of
the bulk material and were indicative of a large strain misfit between the deformed surface layer and
the bulk microstructure.
Surface residual stresses appeared to increase with increasing ap and Vc in Figure 9, at low fz (0.15
mm). However, the feed-per-tooth values did not strongly influence measured residual stresses
within the entire range of cutting parameters evaluated. In Figure 9, the dependence of residual
stresses on cutting speed may be explained by the effects of temperature [14]; at higher speeds the
additional friction increases the thermal field which, in turn, favours adhesion of the chip to the rake
face of the tool. Figure 8 presents the effects of this process: at higher Vc the surface roughness
increased, a sign that the increased adhesion of the chip to the rake face of the tool impaired chip
removal. Finally, metallurgical alterations and material volume changes are also dependent on
temperature, ultimately leading to an increased tensile stress field when Vc is raised [15]. In this
case, the absence of lubricant helps in a better understanding of the underlying process, without
masking the variation of friction between chip and rake face of the tool. It is prudent to expect that
the addition of lubricant could partially mitigate the negative effects of increased fz and Vc on
surface residual stresses by providing extra cooling and lubrication to the tool-chip interface [12].

Figure 9: Contour plots of residual stresses, ferrite (delta + martensite) content and hardness for
variable Vc and ap at; a) fz=0.15 mm, and b) fz=0.35 mm.
4.1.3 Surface hardening
The hardness of the surface layer was measured with an indenter penetrating to a shallow depth (~5
µm) for each machined specimen. Low or no sensitivity of hardness to cutting speed was observed
at high fz, whereas at low fz a rather high response to ap was noted. Deep hardness (~25 µm) results
were similar for both the fz cases (0.15-0.35 mm); a strong sensitivity of hardness to ap and marginal
effects of Vc on hardness was observed. In general deep-seated hardness measurements were less
Delta Ferrite + Martensite Delta Ferrite + Martensite
sensitive to changes in the machining parameters than the near-surface measurements and exhibited
smaller differences between extremes in machining parameters.
The significantly higher-than-yield surface stresses observed in the dry machining of AISI 316L
were indicative of substantial microstructural modifications in the near-surface regions. Previous
studies on this class of material showed that surface layers mainly consisted of equiaxed austenite
grains as well as strain-induced martensite [16]. Shallow (near-surface) hardness measurements
showed sensitivity only for ap (Figure 9). This could be explained by progressive hardening due to
increased deformation and steeper temperature gradients generated by the primary deformation
zone. An opposite effect was shown in the case of deeper hardening yet with peak stress values
significantly lower than the previous case. This was possibly a result of a larger (deeper) primary
deformation zone [17].
A qualitative assessment of martensite content was attempted using a magnetic detector as
conventional XRD is not suitable for measuring the thin surface layers (<5 µm) in the present
samples [18]. Figure 9 shows the significant effect of fz on martensite content whereas the effect of
ap is more limited. This could be explained by the slower progression of the tool leading to
increased abrasion on the freshly machined surface. At high fz, the cutting tool moves forward faster
and there is limited overlap of tool trajectories over the surface, therefore reducing the temperature
and localised strain effects [19]. The measured martensite content should, however, be considered
as qualitative only for a series of reasons. The probe depth with this magnetic technique is
approximately 2 mm, with gradually reducing sensitivity with depth. The measured percentage of
martensite/delta ferrite represents, in fact, the weighted average over the measured volume and thus
will deviate from representative values when the depth of the deformed surface layer varies. In
Figure 9 the inverse proportionality between measured martensite content and depth of cut ap is
noticeable. This trend is consistent with the observed increase in hardness for shallow penetration of
the indenter and both indicate strong grain refinement and possibly a partial phase change from
austenite to strain-induced martensite in the layer adjacent to the surface [16].
4.2 Risk of failure in meeting acceptance parameters
In manufacturing large components, it is of great importance to ensure that the finished product
does not exceed the acceptance parameters. By estimating the statistical variability of the three main
process parameters, namely cutting speed Vc, depth of cut ap, feed-per-tooth fz, and employing the
statistical model developed from the design of experiments, it is possible to calculate the probability
that the finished component would not satisfy at least one of the critical parameters, namely surface

roughness, residual stresses, hardness [10], which can be arbitrarily set for any given application.
Figure 10: Risk of failure in meeting at least one of critical parameters for different cutting
parameters.
Given the maximum acceptable roughness commonly employed in the nuclear industry (Ra=3.2 um)
and aiming to minimise residual stresses and hardness, it is possible to calculate the domain of
cutting parameters that would have the lowest risk of the finished component failing to meet the set
acceptance parameters. In Figure 10 the risk of failure to meet at least one of the critical parameters
is represented in a sample colour map. Probabilities were calculated for a simulated sampling of one
million components and are represented for p=0.95. A normal distribution is assumed for the input
cutting parameters. It is noticeable that both high and low fz bring a higher risk of failure whereas
the lowest failure rate arises from medium fz, medium-low Vc and medium-high ap. Within the
limits of this approach, this range of parameters corresponds to a reduction of residual stresses,
hardness and roughness of the component, the latter being the most limiting factor. The derived
“risk of failure” map and the failure rate prediction represent a valuable tool for reduction of
variability and the costs associated with machining and can be tailored for any given process and its
acceptance parameters.

5. Conclusions
The developed statistical model is useful for evaluating a robust set of machining parameters that
would decrease the likelihood of a detrimental effect in the performance of dry milled AISI 316L
components. Excellent agreement between experimental and statistical results was obtained for
cutting parameters sampled within the experimental space used in this work, with reduced accuracy
for cutting parameters increasingly further from the evaluated space.
Strain-induced martensite is a common occurrence in abusively machined austenitic stainless steels
[24]. The deformed surface layer caused high tensile stresses and high local hardness. Its thickness
appeared to be dependent on ap and fz.
The statistical model also verified the interdependence of the milling parameters. In short, surface
roughness values were excellent for face-milled specimens and acceptable for side-milled ones with
a strong dependency on fz in both cases, whereas residual stresses increased with increasing Vc and
ap, but decreased for higher values of feed-per-tooth fz.
The generation of a sample “risk of failure” map allowed to demonstrate the capability of the DoE
approach for preliminary selection of a range of cutting parameters that could optimise the material
properties. The generation of similar maps for different processes and acceptance parameters would
allow for an improvement in process control and its potential automation.
Acknowledgments
UK’s Engineering and Physical Sciences Research Council (EPSRC) funding under the NNUMAN
(New NUclear MANufacturing) research programme (EP/J021172/1) is acknowledged. The authors
would like to thank Sandvik Coromant for access to their equipment, and assistance from their staff.

References
[1] M.C. Bloom, CN. Newport, W.A. Fraser, Steel corrosion mechanism, The Growth and
Breakdown of Protective Films in High‐Temperature Aqueous Systems: 15% NaOH at 316°C.
Journal of the Electrochemical Society, 111 (1964) 1343-1347.
[2] M.P. Groover, Fundamentals of Modern Manufacturing-Materials Processes and Systems,
Prentice-Hall, Englewood Cliffs, NJ, USA, 1990.
[3] K. Tetal, Machining of Stainless Steels, in: ASM Handbook: Machining, Vol. 16 (Ed. by J.R.
Davis), ASM International, USA, 1989, pp. 681-707.
[4] D.Y. Jang, T.R. Watkins, K.J. Kozaczek, C.R. Hubbard, O.B. Cavin, Surface residual stresses in
machined austenitic stainless steel. Wear, 194 (1996) 168-173.
[5] F. Klocke, E. Brinksmeier, K. Weinert, Capability profile of hard cutting and grinding
processes. CIRP Annals - Manufacturing Technology, 54 (2005) 22-45.
[6] H.K. Tönshoff, C. Arendt, R.B. Amor, Cutting of hardened steel. CIRP Annals - Manufacturing
Technology, 49 (2000) 547-566.
[7] B.N. Pathak, K.L. Sahoo, M. Mishra, Effect of machining parameters on cutting forces and
surface roughness in Al-(1-2) Fe-1V-1Si alloys. Materials and Manufacturing Processes, 28
(2013) 463-469.
[8] H. Gökkaya, The Effects of Machining Parameters on Cutting Forces, Surface Roughness,
Built-Up Edge (BUE) and Built-Up Layer (BUL) During Machining AA2014 (T4) Alloy.
Strojniški vestnik - Journal of Mechanical Engineering, 56 (2010) 584-593.
[9] L. Eriksson, S. Wold, Design of Experiments: Principles and Applications, Umetrics Academy,
Umeå, Sweden, 2008.
[10] S. Ghosh, V. Kain, Microstructural changes in AISI 304L stainless steel due to surface
machining: Effect on its susceptibility to chloride stress corrosion cracking. Journal of Nuclear
Materials, 403 (2010) 62-67.
[11] W. Li, Y. Guo, C. Guo, Superior surface integrity by sustainable dry hard milling and impact
on fatigue. CIRP Annals - Manufacturing Technology, 62 (2013) 567-570.
[12] F. Jiang, J. Li, L. Yan, J. Sun, S. Zhang, Optimizing end-milling parameters for surface
roughness under different cooling/lubrication conditions. Int J Adv Manuf Technol, 51 (2010)
841-851.
[13] S.R. Das, K. Amaresh, D. Dhupal, Effect of machining parameters on surface roughness in
machining of hardened aisi 4340 steel using coated carbide inserts. International Journal of
Innovation and Applied Studies, 2 (2013) 445-453.
[14] N. Ben Moussa, H. Sidhom, C. Braham, Numerical and experimental analysis of residual stress
and plastic strain distributions in machined stainless steel. International Journal of Mechanical
Sciences, 64 (2012) 82-93.
[15] C. Wiesner, Residual stresses after orthogonal machining of AlSl 304: numerical calculation of
the thermal component and comparison with experimental results. Metallurgical Transactions A,
23 (1992) 989-996.
[16] R. M’Saoubi, J.C. Outeiro, B. Changeux, J.L. Lebrun, A. Morão Dias, Residual stress analysis
in orthogonal machining of standard and resulfurized AISI 316L steels. Journal of Materials
Processing Technology, 96 (1999) 225-233.
[17] J. Sun, Y.B. Guo, A comprehensive experimental study on surface integrity by end milling Ti–
6Al–4V. Journal of Materials Processing Technology, 209 (2009) 4036-4042.
[18] M.C. Shaw, Metal Cutting Principles, Oxford University Press, Oxford, UK, 1997.
[19] V. Marinov, Manufacturing Processes for Metal Products, Kendall Hunt Publishing Company,
2010.
[20] A.J. Wilkinson, Quantitative deformation studies using electron back scatter patterns. Acta
Metallurgica et Materialia, 39 (1991) 3047-3055.
[21] A.J. Wilkinson, P.B. Hirsch, Electron diffraction based techniques in scanning electron
microscopy of bulk materials. Micron, 28 (1997) 279-308.
[22] L. Sun, M.J. Thomas, B.P. Wynne, E.J. Palmiere, K.P. Mingard, B. Roebuck, Mapping
microstructure inhomogeneity using electron backscatter diffraction in 316L stainless steel
subjected to hot plane strain compression tests. Materials Science Technology, 26 (2010) 1477-
1486.
[23] J.-Y. Kang, B. Bacroix, H. Réglé, K.H. Oh, H.-C. Lee, Effect of deformation mode and grain
orientation on misorientation development in a body-centered cubic steel. Acta Materialia, 55
(2007) 4935-4946.
[24] R. M’Saoubi, J.C. Outeiro, H. Chandrasekaran, O.W. Dilon Jr., I.S. Jawahir, A review of
surface integrity in machining and its impact on functional performance and life of machined
products. International Journal of Sustainable Machining, 1 (2008) 203-236.