Effects of land use on taxonomic and functional diversity ...
12
1 3 Oecologia (2016) 181:959–970 DOI 10.1007/s00442-015-3512-2 HIGHLIGHTED STUDENT RESEARCH Effects of land use on taxonomic and functional diversity: a cross‑taxon analysis in a Mediterranean landscape Violeta Hevia 1 · Carlos P. Carmona 2,3 · Francisco M. Azcárate 2 · Mario Torralba 4 · Paloma Alcorlo 1 · Rubén Ariño 1 · Jorge Lozano 5 · Sara Castro‑Cobo 6 · José A. González 1 Received: 6 February 2015 / Accepted: 17 November 2015 / Published online: 10 December 2015 © Springer-Verlag Berlin Heidelberg 2015 separately at two different spatial scales: the sampling unit scale and the site scale. Land-use intensity effects on TD and FD were quite different and highly varied among the four biotic groups, with no single clear pattern emerging that could be considered general for all organisms. Additive partitioning of species diversity revealed clear contrasting patterns between TD and FD in the percentage of variabil- ity observed at each spatial scale. While most variability in TD was found at the larger scales, irregardless of organ- ism group and land-use type, most variability in FD was found at the smallest scale, indicating that species turnover among communities is much greater than functional trait turnover. Finally, we found that TD and FD did not vary consistently, but rather followed different trajectories that largely depended on the biotic group and the intensity of land-use transformation. Our results highlight that the rela- tionship of land use with TD and FD is highly complex and context-dependent. Keywords Biodiversity · Diversity partitioning · Functional traits · Land-use intensity · Spatial scale Abstract Land-use change is the major driver of biodi- versity loss. However, taxonomic diversity (TD) and func- tional diversity (FD) might respond differently to land-use change, and this response might also vary depending on the biotic group being analysed. In this study, we compare the TD and FD of four biotic groups (ants, birds, herba- ceous, woody vegetation) among four land-use types that represent a gradient of land-use intensity in a Mediter- ranean landscape (Mediterranean shrublands, dehesas, mixed-pine forests, olive groves). Analyses were performed Communicated by Daniel Laughlin. Electronic supplementary material The online version of this article (doi:10.1007/s00442-015-3512-2) contains supplementary material, which is available to authorized users. Understanding how land use affects biodiversity and ecosystem functioning in different organisms and at different spatial scales in the current context of global change is of critical importance, particularly in the Mediterranean region where biodiversity is threatened by multiple drivers. Our study, which was part of the PhD dissertation of the first author, shows that taxonomic diversity and functional diversity respond differently to land-use intensity and that this response varies among taxonomic groups. Specifically, we found that changes in land use do not necessarily lead to the loss of functional diversity mediated by the loss of species and/or functional traits, with this effect being dependent on the biotic group analysed. * Violeta Hevia [email protected] 1 Social–Ecological Systems Laboratory, Department of Ecology, Universidad Autónoma de Madrid, Darwin 2, 28049 Madrid, Spain 2 Terrestrial Ecology Group, Department of Ecology, Universidad Autónoma de Madrid, Darwin 2, 28049 Madrid, Spain 3 Department of Botany, Faculty of Science, University of South Bohemia, 37005 Ceske Budejovice, Czech Republic 4 Department of Geosciences and Natural Resource Management, University of Copenhagen, Rolighedsvej 23, 1958 Frederiksberg C, Denmark 5 Departamento de Ciencias Naturales, Sección de Biología Básica y Aplicada, Universidad Técnica Particular de Loja, San Cayetano Alto, C/París s/n., 1101608 Loja, Ecuador
Transcript of Effects of land use on taxonomic and functional diversity ...
1 3
Oecologia (2016) 181:959–970DOI 10.1007/s00442-015-3512-2
HIGHLIGHTED STUDENT RESEARCH
Effects of land use on taxonomic and functional diversity: a cross‑taxon analysis in a Mediterranean landscape
Violeta Hevia1 · Carlos P. Carmona2,3 · Francisco M. Azcárate2 · Mario Torralba4 · Paloma Alcorlo1 · Rubén Ariño1 · Jorge Lozano5 · Sara Castro‑Cobo6 · José A. González1
Received: 6 February 2015 / Accepted: 17 November 2015 / Published online: 10 December 2015 © Springer-Verlag Berlin Heidelberg 2015
separately at two different spatial scales: the sampling unit scale and the site scale. Land-use intensity effects on TD and FD were quite different and highly varied among the four biotic groups, with no single clear pattern emerging that could be considered general for all organisms. Additive partitioning of species diversity revealed clear contrasting patterns between TD and FD in the percentage of variabil-ity observed at each spatial scale. While most variability in TD was found at the larger scales, irregardless of organ-ism group and land-use type, most variability in FD was found at the smallest scale, indicating that species turnover among communities is much greater than functional trait turnover. Finally, we found that TD and FD did not vary consistently, but rather followed different trajectories that largely depended on the biotic group and the intensity of land-use transformation. Our results highlight that the rela-tionship of land use with TD and FD is highly complex and context-dependent.
Keywords Biodiversity · Diversity partitioning · Functional traits · Land-use intensity · Spatial scale
Abstract Land-use change is the major driver of biodi-versity loss. However, taxonomic diversity (TD) and func-tional diversity (FD) might respond differently to land-use change, and this response might also vary depending on the biotic group being analysed. In this study, we compare the TD and FD of four biotic groups (ants, birds, herba-ceous, woody vegetation) among four land-use types that represent a gradient of land-use intensity in a Mediter-ranean landscape (Mediterranean shrublands, dehesas, mixed-pine forests, olive groves). Analyses were performed
Communicated by Daniel Laughlin.
Electronic supplementary material The online version of this article (doi:10.1007/s00442-015-3512-2) contains supplementary material, which is available to authorized users.
Understanding how land use affects biodiversity and ecosystem functioning in different organisms and at different spatial scales in the current context of global change is of critical importance, particularly in the Mediterranean region where biodiversity is threatened by multiple drivers. Our study, which was part of the PhD dissertation of the first author, shows that taxonomic diversity and functional diversity respond differently to land-use intensity and that this response varies among taxonomic groups. Specifically, we found that changes in land use do not necessarily lead to the loss of functional diversity mediated by the loss of species and/or functional traits, with this effect being dependent on the biotic group analysed.
* Violeta Hevia [email protected]
1 Social–Ecological Systems Laboratory, Department of Ecology, Universidad Autónoma de Madrid, Darwin 2, 28049 Madrid, Spain
2 Terrestrial Ecology Group, Department of Ecology, Universidad Autónoma de Madrid, Darwin 2, 28049 Madrid, Spain
3 Department of Botany, Faculty of Science, University of South Bohemia, 37005 Ceske Budejovice, Czech Republic
4 Department of Geosciences and Natural Resource Management, University of Copenhagen, Rolighedsvej 23, 1958 Frederiksberg C, Denmark
5 Departamento de Ciencias Naturales, Sección de Biología Básica y Aplicada, Universidad Técnica Particular de Loja, San Cayetano Alto, C/París s/n., 1101608 Loja, Ecuador

960 Oecologia (2016) 181:959–970
1 3
Introduction
Land-use change is the most important direct driver of bio-diversity loss at a global scale (Pereira et al. 2012) and has the additional large capacity to modify ecosystem func-tioning (Hector et al. 2001) and the provision of ecosys-tem services (Díaz et al. 2007; Nagendra et al. 2013; Allan et al. 2015). Most of the literature exploring the relation-ship between land-use change and biodiversity loss has focused on taxonomic diversity (TD) (Milder et al. 2008), with other components of biodiversity, such as functional diversity (FD), receiving less attention (Feld et al. 2009). FD is the value and range of functional traits of organisms present in a given ecosystem (Díaz and Cabido 2001), and a thorough understanding of FD is critical for addressing ecological questions (Mouillot et al. 2005; Mason and de Bello 2013).
Although researchers are showing an increasing inter-est in the study of FD and its dependence on environmen-tal conditions (Mayfield et al. 2010), relatively few studies have linked FD responses with changes in land use. It has been shown that intensification processes tend to reduce FD, but the results of such studies are highly dependent on the site and the taxonomic group being studied (Flynn et al. 2009). Otherwise, it is highly uncertain whether changes in TD associated with land use are mirrored by changes in FD (Mayfield et al. 2010; Carmona et al. 2012). As TD and FD responses might differ, exploring their relationship will provide a more complete picture of the potential conse-quences of land-use change (Mayfield et al. 2010).
Scientific literature exploring FD has been historically biased towards certain taxonomic groups. Most of the studies published to date have focused on vegetation and invertebrates (i.e., insects) at local scales, with vertebrates being the least studied group (Hevia et al., under review). The response of functional traits to land-use change or other drivers of change may vary across different organ-ism groups, depending, for example, on their home range, degree of mobility and size. Consequently, site-based studies applying the trait-based approach simultaneously to several taxonomic groups and trophic levels might be one approach to properly address the effects of drivers of change on FD. Recent research has begun to use this multi-trophic approach (Moretti et al. 2013), seeking to combine taxonomic and functional indicators across trophic levels to develop more comprehensive biodiversity monitoring (Van-dewalle et al. 2010).
In addition, a multi-scale perspective is necessary to improve our understanding of the effect of land-use change
on species diversity and traits (Gilroy et al. 2015). The spa-tial scale of analysis can highly influence the form of the relationship between diversity and ecosystem processes (Gross et al. 2000; Symstad et al. 2003). Consequently, there is a need to address the scale effects of land-use activ-ities on biotic communities and to explore potential differ-ences among groups of organisms (de Lima et al. 2013).
In the study reported here, we compared the TD and FD of four different biotic groups (ants, birds, herbaceous vegetation, woody vegetation) among four land-use types (Mediterranean shrublands, dehesas, mixed-pine forests, olive groves) that represent a gradient of land-use intensity in the Mediterranean landscape. We tested: (1) how dif-ferent biotic groups respond to land-use type, (2) how the spatial scale of analysis (sampling unit vs. sampling site) provides different information about the potential effects of land-use change on biodiversity and (3) whether changes in TD and FD follow similar patterns of change along the intensity gradient.
Materials and methods
Study area
The study site is the upper watershed of the Guarrizas River (tributary of the Guadalquivir River), which is located in Eastern Sierra Morena (Jaén, Spain) [see Electronic Sup-plementary Material (ESM) 1]. The area covers 28,123 ha and includes five municipalities: Aldeaquemada, Santa Elena, Vilches, Navas de San Juan and Santisteban del Puerto. The area is characterised by a continental Mediter-ranean climate, with mean annual precipitation of 700 mm and mean annual temperature of 15 °C. The study year was slightly wet, with rainfall exceeding the long-term mean precipitation for Jaén province by approximately 25 %, although it was within the typical variability range for this climate (AEMET 2012). The elevation of the study site ranges from 700 to 950 m a.s.l., and the lithology is mainly quartzite, slate and sandstone.
Four dominant land-use types occupy over 60 % of the study area: Mediterranean shrublands, dehesas, mixed-pine forests and olive groves (see ESM 2). Mediterranean shrublands represent the natural vegetation of the study area, which mainly consists of holm oaks (Quercus ilex) and shrub and bush formations. These areas are usually managed for conservation purposes combined, in a num-ber of privately owned lands, with tourism or game hunt-ing. Dehesas are Mediterranean agrosilvopastoral ecosys-tems and represent the first—and least intense–degree of land-use transformation. These systems consist of pasture-lands with scattered trees (primarily holm oaks), which are mostly managed for extensive pastoralism with cattle,
6 Estación Biológica de Doñana, Consejo Superior de Investigaciones Científicas (CSIC), Avda. Américo Vespucio s/n, 41092 Seville, Spain
961Oecologia (2016) 181:959–970
1 3
sheep and goats. Rearing of fighting bulls is also com-mon in the dehesas of the study area. Mixed-pine forests (mainly Pinus pinaster, but with several other species of coniferous trees also present) represent a more intense degree of land-use transformation, primarily due to planta-tion programmes developed in the 1960s. Current manage-ment practices in these areas have the combined aim to thin the pine forests, extracting pine wood, and to promote re-colonisation of native Mediterranean woody species (e.g., Q. ilex, Q. faginea, Q. coccifera, Arbutus unedo). Finally, olive groves are intensively managed for olive oil produc-tion and represent the most intense land-use transformation in the study area. Management practices in olive groves include periodic fumigation and, occasionally, soil tilling.
Sampling design and data collection
We selected 20 sampling sites (5 in each land-use type) for birds, herbaceous and woody vegetation, and 40 sampling
sites (10 per land-use type) for ants. All sampling sites shared the same slope and orientation. We used different transects to sample the studied organisms, with the starting point of each transect randomly placed in each site. Sam-pling was conducted in May 2012.
Herbaceous vegetation
A 100-m-long transect was placed in each of the sampling sites, and ten 20 × 20-cm sampling units were regularly distributed along this transect. We identified all of the spe-cies present within the quadrat and estimated their coverage using the following categories: (1) <12.5 %; (2) 12.5–25 %; (3) 26–50 %; (4) 51–75 %; (5) >75 %. Based on a full list of species present at the site, we subsequently added a sixth category: (0) absent. Each species was then characterised according to three quantitative traits and six qualitative traits (Table 1) which have been reported to be relevant for dispersion, establishment and persistence (Weiher et al.
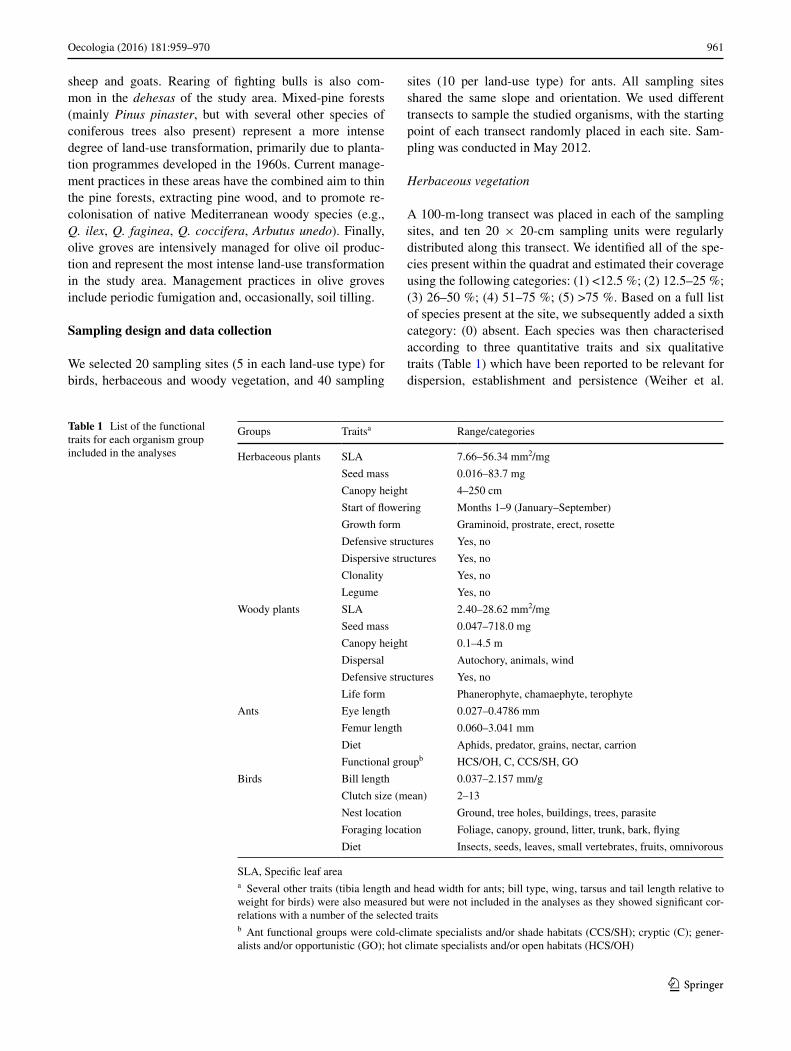
Table 1 List of the functional traits for each organism group included in the analyses
SLA, Specific leaf areaa Several other traits (tibia length and head width for ants; bill type, wing, tarsus and tail length relative to weight for birds) were also measured but were not included in the analyses as they showed significant cor-relations with a number of the selected traitsb Ant functional groups were cold-climate specialists and/or shade habitats (CCS/SH); cryptic (C); gener-alists and/or opportunistic (GO); hot climate specialists and/or open habitats (HCS/OH)
Groups Traitsa Range/categories
Herbaceous plants SLA 7.66–56.34 mm2/mg
Seed mass 0.016–83.7 mg
Canopy height 4–250 cm
Start of flowering Months 1–9 (January–September)
Growth form Graminoid, prostrate, erect, rosette
Defensive structures Yes, no
Dispersive structures Yes, no
Clonality Yes, no
Legume Yes, no
Woody plants SLA 2.40–28.62 mm2/mg
Seed mass 0.047–718.0 mg
Canopy height 0.1–4.5 m
Dispersal Autochory, animals, wind
Defensive structures Yes, no
Life form Phanerophyte, chamaephyte, terophyte
Ants Eye length 0.027–0.4786 mm
Femur length 0.060–3.041 mm
Diet Aphids, predator, grains, nectar, carrion
Functional groupb HCS/OH, C, CCS/SH, GO
Birds Bill length 0.037–2.157 mm/g
Clutch size (mean) 2–13
Nest location Ground, tree holes, buildings, trees, parasite
Foraging location Foliage, canopy, ground, litter, trunk, bark, flying
Diet Insects, seeds, leaves, small vertebrates, fruits, omnivorous

962 Oecologia (2016) 181:959–970
1 3
1999). Canopy height (defined as the distance between the highest photosynthetic leaf and the plant’s base) was measured following the guidelines provided by Cornelissen et al. (2003), specific leaf area (SLA) measurements were obtained from the TRY database (Kattge et al. 2011), and seed mass measurements were obtained from the SID data-base (Royal Botanic Gardens Kew 2015). Data on qualita-tive traits were obtained from Blanca et al. (2009) and Cas-troviejo (2009).
Woody vegetation
Each of the sampling sites consisted of a 1 km-long tran-sect. Ten 10 × 10-m sampling units were regularly dis-tributed along this transect. We identified all of the woody species present within the plot and estimated their cover-age using the same scale used for herbaceous vegetation. Each species was then characterised according to three quantitative traits and three qualitative traits (Table 1) that have been reported to be relevant for dispersion, establish-ment and persistence (McIntyre et al. 2007). Life form was characterised according to the Raunkiaer system for clas-sification of life form. Canopy height was measured in situ, SLA measurements were obtained from the TRY database (Kattge et al. 2011), and seed mass measurement were obtained from the SID database (Royal Botanic Gardens Kew 2015). Data on the remaining traits were obtained from Blanca et al. (2009), Castroviejo (2009) and Ruiz de la Torre (2006).
Ants
Each sampling site consisted of a 50-m-long transect where one pitfall trap was placed systematically every 10 m, accounting for a total of five pitfall traps per sampling site. Traps were 2 cm in diameter and 5 cm deep and contained a mixture of 70 % ethanol and 30 % monoethylene glycol. Pitfall traps were left in the field for 7 days. Despite some limitations to this capture approach, pitfall traps are consid-ered to be the most objective and fastest method to sample ground-dwelling ants (Nash et al. 2004).
Ants were identified to the species level with a binocular microscope and were then characterised according to four quantitative and two qualitative functional traits (Table 1). The selection of these traits was based on important char-acteristics recognised in ant ecology (Azcárate et al. 2013). We measured eye length, head width, tibia length and femur length in a sample size of ten individuals per species randomly selected from the whole sample. Qualitative traits were obtained from Azcárate and Peco (2012) and Hevia et al. (2013). Specifically, to classify species into functional groups (i.e. groups of species that respond to disturbance in a similar manner), we followed the classification of Roig
and Espadaler (2010), who delineated eight categories: invasive and/or exotic, generalists and/or opportunistic, social parasites, specialist predators, coarse woody debris specialists, cold-climate specialists and/or shade habitats, hot climate specialists and/or open habitats and cryptic.
Birds
In each sampling unit, the bird community was surveyed by means of five point counts separated by 200 m and located along a randomly selected 1-km linear transect. All counts were performed in the early morning (2 h after sunrise) or late afternoon (2 h before sunset), avoiding rainy or windy days. We spent 5 min on each point count, recording every bird heard or seen within a 50-m radius (birds overflying the plot were not included).
We selected five quantitative and four qualitative func-tional traits (Table 1), based on bird traits linked to ecosys-tem response to disturbance (Petchey and Gaston 2006). Quantitative traits were obtained from the National Ring-ing Database of the Spanish Ornithological Society and only birds ringed in the Eastern Sierra Morena area were selected for the analysis. Qualitative traits were obtained from the published literature (Cramp and Perrins 1994).
TD and FD calculation
Quantitative traits were log-transformed as needed to attain a normal distribution of trait values. Qualitative traits were split into binary traits which allowed a species to be classi-fied into more than one group. The month in which flower-ing started was considered to be a circular trait (e.g., the correct dissimilarity between one species flowering in Jan-uary and one flowering in December is 1 month; Leps et al. 2006). For each trait of each biotic group, we calculated a matrix of dissimilarities among species using Gower dis-tances. We subsequently performed Mantel tests (9999 permutations) between the respective matrices of trait dis-tances between species and discarded traits that yielded significant correlations with other traits to avoid redundant information. With the final set of traits for each biotic group (Table 1), we calculated a matrix of pairwise functional dis-similarities (using Gower distances) between species con-sidering multiple traits. In this calculation, the functional dissimilarity between any two species varies between 0 (when the traits of two species are identical) and 1 (when two species are completely dissimilar).
For each biotic group, we considered two different spa-tial scales: (1) the sampling unit scale, which represented the smallest unit of collected information for that biotic group (e.g. 20 × 20-cm quadrats for herbaceous plants, or pitfall traps for ants) and (2) the site scale, which was com-posed of a number of sampling units placed at the same
963Oecologia (2016) 181:959–970
1 3
spatial location (e.g. the 10 quadrats or the 5 pitfall traps placed on a given dehesa grassland). To calculate the rela-tive abundance of documented species at the site scale, we averaged their coverage in the sampling units (in the case of plants) or calculated the proportion of sampling units in which each species was present (in the case of ants and birds).
We calculated the FD of each biotic group using the Rao index:
where dij is the dissimilarity in trait values between each pair of coexisting species i and j, while pi and pj indicate the relative abundances of species i and j, respectively, in the community under consideration(Ricotta and Moretti 2011). In addition, we calculated the Simpson index of diversity:
The Simpson index of diversity is equivalent to the Rao index when all the dissimilarities between species are equal to 1 (Leps et al. 2006). Finally, we expressed both TD and FD in terms of equivalent numbers (de Bello et al. 2010). The hierarchical nature of our sampling design (sampling units within sites), along with the combined use of the Rao and Simpson indices, provided a common framework to study the partitioning of both TD and FD across spatial scales (de Bello et al. 2010; Carmona et al. 2012).
We studied the changes in diversity across spatial scales and land-use types using two complementary analyses. First, we calculated FD and TD at the two spatial scales considered (diversity within sampling units and diversity within sites) using the relative abundance of each species at each scale to calculate the Rao index and the Simpson index of diversity. In addition, for each of the considered land-use types and biotic groups, we performed a parti-tion of diversity at different spatial scales. Following de Bello et al. (2010), we first calculated α-diversity (within sampling units) and γ-diversity (total diversity, calculated by pooling all of the sampling units of all the sites). This information allowed us to calculate β-diversity, which is the difference between γ-diversity and the average of the α-diversity of the sampling units and expresses the pro-portion of diversity that occurs due to differences between sampling units.
Subsequently, we repeated this process, but considered site as the level at which α-diversity is calculated (de Bello et al. 2010). In this second case, β-diversity represents the proportion of diversity that is found between the sites
Rao =
S∑
i=1
S∑
j=1
dijpipj,
Simpson index = 1−
S∑
i=1
p2i .
considered in the whole study area. Therefore, for each land-use type and biotic group, we partitioned TD and FD at three hierarchical levels: within sampling units, within sites and between sites (Carmona et al. 2012).
Data analysis
The differences in TD and FD between land-use types were examined at the two considered spatial scales (sam-pling unit and site) for all of the biotic groups under con-sideration. Using linear mixed models, we first examined the effect of land-use type on diversity at the sampling unit scale, with site as a random-effects factor to account for the lack of independence of sampling units within sites and the type of land use as a fixed-effects factor. Whenever we found a significant (P < 0.05) effect of land-use type on the considered diversity index, we used the R add-on package multcomp to perform a Tukey post hoc test to detect any differences between individual land-use types.
We also analysed the differences in diversity between land-use types at the site scale by performing analyses of variance, in which we used land use as the explanatory variable. Similarly, we performed a Tukey HSD post hoc test for cases where land use had a significant effect. All of these analyses, as well as the partitioning of diversity described in this section, were performed using the R data analysis software (v.3.1.1.; Team R Core 2014).
Results
Effects on taxonomic and functional diversity across scales and biotic groups
Herbaceous plant diversity
A total of 117 herbaceous species were recorded during sampling, of which 50 species were recorded in Mediterra-nean shrublands, 83 in dehesas, nine in mixed-pine forests and five in olive groves (see ESM 3, Table 1).
At the sampling unit scale, TD differed among the four land-use types (F = 38.56; P < 0.0001), being significantly higher in dehesas than in the other three land-use types which in turn did not significantly differ from each other (Fig. 1). We also found significant differences among land-use types for FD (F = 37.73; P < 0.0001), with the high-est and lowest values being obtained in dehesas and olive groves, respectively (Fig. 1). The TD and FD values of Mediterranean shrublands and mixed-pine forests did not differ significantly.
At the site scale, TD differed among land-use types (F = 10.93; P = 0.0009). Specifically, TD was signifi-cantly higher in dehesas than in all other land-use types,

964 Oecologia (2016) 181:959–970
1 3
which in turn did not significantly differ from each other (Fig. 1). This result contrasted with that obtained for FD, where only olive groves (with extremely low FD values) differed from the other land-use types (Fig. 1).
Woody plant diversity
A total of 41 woody species were recorded during sam-pling, of which 30 species were recorded in Mediterranean shrublands, 15 in dehesas, 22 in mixed-pine forests and five in olive groves (see ESM 3, Table 2).
At the sampling unit scale, the TD and FD of woody vegetation differed among land-use types (F = 62.85, P < 0.0001 and F = 68.07, P < 0.0001, respectively). Med-iterranean shrublands had the highest TD values, followed by mixed-pine forests, with dehesas and olive groves hav-ing the lowest TD values (Fig. 1). By contrast, FD was sig-nificantly higher in mixed-pine forests than in Mediterra-nean shrublands, with dehesas and olive groves having yet lower FD values (Fig. 1).
At the site scale, TD and FD also differed among stud-ied land-use types, following similar patterns to those observed at the sampling unit scale (F = 14.66, P < 0.0001
and F = 10.36, P = 0.0005, respectively). However, the differences in TD between Mediterranean shrublands and mixed-pine forests, as well as those between mixed-pine forests and dehesas, were not significant. With respect to FD, while at the sampling unit scale there were differences between Mediterranean shrublands and dehesas, at the site scale this difference disappeared (Fig. 1).
Ant diversity
Six sampling units (three in Mediterranean shrublands, two in dehesas and one in mixed-pine forests) were elimi-nated because some pitfall traps were lost or damaged. Of the remaining 34 sampling units, a total of 33 species were captured, with 25 species recorded in Mediterranean shrub-lands, 23 in dehesas, 20 in mixed-pine forests and 22 in olive groves (see ESM 3, Table 3).
At the sampling unit scale, TD was significantly lower in mixed-pine forests and olive groves than in the other land-use types (F = 15.28; P < 0.0001; Fig. 1). Signifi-cantly higher FD was detected in Mediterranean shrublands than in mixed-pine forests and olive groves (F = 8.62; P < 0.0001; Fig. 1). By contrast, at the site scale, we found
Fig. 1 Boxplots showing the effect of land-use type on taxonomic diversity (TD; Simpson’s index) (a, b) and functional diversity (FD; Rao index) (c, d) for the four biotic groups at the sampling unit (a, b) and sampling site (c, d) scale. Bars mean ± standard error of the
mean (SEM). Different lowercase letters indicate significant differ-ences for the effect of land-use type (Tukey’s test, P < 0.05) in each biotic group
965Oecologia (2016) 181:959–970
1 3
no difference in TD or FD among any of the land-use types (F = 1.75, P = 0.175 and F = 0.533, P = 0.662, respec-tively; Fig. 1).
Bird diversity
A total of 38 bird species were recorded during sampling, with 23 species recorded in Mediterranean shrublands, 26 in dehesas, 14 in mixed-pine forests and 23 in olive groves (see ESM 3, Table 4).
At the sampling unit scale, land use had a significant effect on bird TD (F = 11.19; P < 0.0001), which was sig-nificantly higher in dehesas than in the other land-use types (Fig. 1), with mixed-pine forests having the lowest values. However, FD exhibited no significant differences among land-use types (F = 0.561; P = 0.641). At the site scale, TD showed a similar pattern, with higher diversity in dehe-sas, followed by Mediterranean shrublands, while mixed-pine forests had the lowest values. In contrast, FD was
significantly higher in mixed-pine forests than in the other land-use types (Fig. 1).
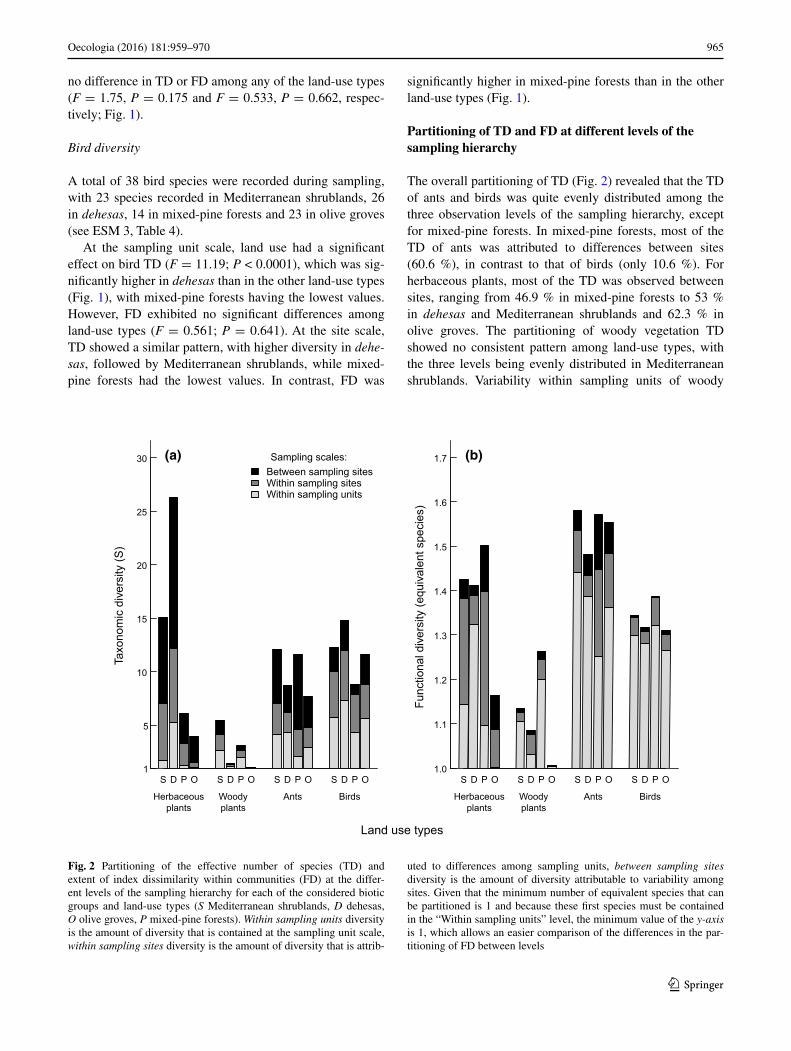
Partitioning of TD and FD at different levels of the sampling hierarchy
The overall partitioning of TD (Fig. 2) revealed that the TD of ants and birds was quite evenly distributed among the three observation levels of the sampling hierarchy, except for mixed-pine forests. In mixed-pine forests, most of the TD of ants was attributed to differences between sites (60.6 %), in contrast to that of birds (only 10.6 %). For herbaceous plants, most of the TD was observed between sites, ranging from 46.9 % in mixed-pine forests to 53 % in dehesas and Mediterranean shrublands and 62.3 % in olive groves. The partitioning of woody vegetation TD showed no consistent pattern among land-use types, with the three levels being evenly distributed in Mediterranean shrublands. Variability within sampling units of woody
Sampling scales:Between sampling sitesWithin sampling sitesWithin sampling units
Taxo
nom
ic d
iver
sity
(S)
(a)
S D P O S D P O S D P O S D P O
Land use types
Herbaceousplants
Woodyplants
Ants Birds
1
5
10
15
20
25
30
Func
tiona
l div
ersi
ty (e
quiv
alen
t spe
cies
)
S D P O S D P O S D P O S D P O
Herbaceousplants
Woodyplants
Ants Birds
(b)
1.0
1.1
1.2
1.3
1.4
1.5
1.6
1.7
Fig. 2 Partitioning of the effective number of species (TD) and extent of index dissimilarity within communities (FD) at the differ-ent levels of the sampling hierarchy for each of the considered biotic groups and land-use types (S Mediterranean shrublands, D dehesas, O olive groves, P mixed-pine forests). Within sampling units diversity is the amount of diversity that is contained at the sampling unit scale, within sampling sites diversity is the amount of diversity that is attrib-
uted to differences among sampling units, between sampling sites diversity is the amount of diversity attributable to variability among sites. Given that the minimum number of equivalent species that can be partitioned is 1 and because these first species must be contained in the “Within sampling units” level, the minimum value of the y-axis is 1, which allows an easier comparison of the differences in the par-titioning of FD between levels

966 Oecologia (2016) 181:959–970
1 3
vegetation explained most of the diversity in mixed-pine forests, dehesas and olive groves.
The partitioning pattern of FD differed greatly from that of TD. For all four biotic groups, most of the variability in FD occurred within the sampling unit scale (with per-centages of mostly >90 %), irregardless of land-use type (Fig. 2).
Relationship of FD and TD
The vectors of change for TD and FD along the studied gradient of land-use intensity (i.e. from Mediterranean shrublands to the other three land uses) showed clearly dif-ferent patterns in the four biotic groups (Fig. 3). In the case of herbaceous and woody vegetation, vectors of change towards olive groves showed a decline for both TD and FD. In contrast, for land-use change to mixed-pine forests, we found no significant differences except for FD of woody vegetation. Regarding the transformation to dehesas, the results showed an increase in TD for herbaceous plants and a decrease for woody plants, with FD remaining quite simi-lar in both biotic groups (Fig. 3).
In the case of ants, changes along the land use gradient were less noticeable and non-significant (Fig. 3). A clear
contrasting pattern was visible for birds. Land use change to mixed-pine forests showed that FD increased, whereas TD decreased, similar to the pattern observed for woody vegetation (Fig. 3).
Discussion
Our results show that land-use transformation exerts impor-tant effects on biodiversity. However, in our study, these effects differed significantly among the various biotic groups and spatial scales studied. Moreover, we found that the two components of diversity analysed here (TD and FD) did not consistently vary with land-use change.
How do different biotic groups respond to changes in land‑use intensity?
Several studies have documented declines in the diversity of birds, mammals, plants and insects due to agricultural intensification at several spatial scales (Benton et al. 2002; Flynn et al. 2009; Breitbach et al. 2010). However, most of these studies have addressed their research questions by exploring a single taxonomic group or a single aspect
(a) Herbaceous plants
1.0
1.1
1.2
1.3
1.4
1.5
0 5 10 15
�
�
Mediterranean shrublandsDehesasMixed−pine forestsOlive groves
(b) Woody plants
1.0
1.1
1.2
1.3
1 2 3 4
�
(c) Ants
1.35
1.40
1.45
1.50
1.55
1.60
4.0 4.5 5.0 5.5 6.0 6.5 7.0
�
1.30
1.35
1.40
1.45
7 8 9 10 11 12
(d) Birds
�
Func
tiona
l div
ersi
ty (R
ao)
Taxonomic diversity (S)
Fig. 3 The relationships of FD to TD in different land-use types for herbaceous plants (a), woody plants (b), ants (c) and birds (d) at the sampling site scale. Arrows indicate the vectors for changes in TD and FD from Mediterranean shrublands (considered as the natural
vegetation in the study area) to the other land-use types. Solid lines Significant changes in both TD and FD, dash-dot lines significant changes in TD, dashed line significant changes in FD. Values are given as the mean ± SEM
967Oecologia (2016) 181:959–970
1 3
of diversity. The few studies that have explored taxonomic and functional aspects of diversity simultaneously for sev-eral organism groups suggest that land-use effects on diver-sity are group-dependent (Flynn et al. 2009).
We found that herbaceous vegetation diversity declined after changes towards more intense land-use types, with the exception of dehesas, which showed the highest herbaceous TD (at both spatial scales analysed) and FD (at the sam-pling unit scale) values. These results may be due to (1) the elimination of competition with woody vegetation, result-ing in more available resources for herbaceous vegetation, or (2) the effects of increased grazing, which reduces the abundance of dominant species, facilitating the presence of subordinate ones. Furthermore, livestock in dehesas plays a relevant role in seed dispersion, with potential positive effects on species diversity (Malo and Suárez 1995).
By contrast, our results on woody vegetation show a more complex pattern of response to land use. At both spatial scales, Mediterranean shrublands and mixed-pine forests had the highest TD values for woody vegetation, whereas mixed-pine forests had the highest FD values. This result may be due to the particular vegetation composition of mixed-pine forests in our study area, which present a singular mixture of native and introduced species. Conse-quently, the contrasting trait values of the pines (e.g. higher canopy height) with those of other woody species compos-ing the understory resulted in a greater proportion of the functional space being occupied and, therefore, high FD values. Indeed, further intensification leading to the disap-pearance of all woody species other than pines would prob-ably cause a drastic reduction in FD.
We expected that ants, as semi-sessile organisms (Van-dermeer and Yitbarek 2012), would exhibit a marked response to land use, similar to that recorded for herba-ceous and woody vegetation. However, we did not detect any difference in TD or FD among land uses at the large scale. By contrast, at the sampling unit scale we detected reduced TD and FD (compared with Mediterranean shrub-lands) on mixed-pine forests and olive groves. This result may be due to the small-scale homogenisation effect caused by human practices, such as tillage or fumigation in olive groves, or to the continuous needle cover and shadow effect from pine plantations.
We found that birds exhibited lower TD with more intense land use, supporting previous research (Verhulst et al. 2004; Flynn et al. 2009). However, FD values did not follow a clear response pattern to land use at either of the spatial scales studied, in contrast with previous findings in Europe (Gregory et al. 2005). Notably, mixed-pine for-ests had the highest FD values and the lowest TD values for birds. These results indicate that the bird species present in mixed-pine forests are more functionally different from each other (i.e. fewer redundant species because changes in
TD had little effect on FD; Petchey et al. 2007) compared to bird species identified in other land-use types. This pat-tern is similar to that observed for woody vegetation; thus, these two results may be correlated, whereby more func-tionally different tree growth forms are associated with more functionally distinct bird communities.
Finally, although not a goal of our study itself, future research that explores how functional traits between biotic groups are related through trophic interactions would be of high interest to complete our understanding of the effects of land-use intensification. This trait-based multitrophic perspective has been proposed as the next step forward for advancing biodiversity–ecosystem functioning research (Lavorel et al. 2013).
How does the spatial scale of analysis affect biodiversity changes?
Land-use change might exert changes in biodiversity at multiple spatial scales (Kleijn et al. 2009). We used two complementary analyses to assess the effects of spatial scale and land-use type on biodiversity. These two analyses provided different results. For example, no clear general-ised pattern was observed when analysing the overall FD and TD values at the two spatial scales being considered (diversity within sampling units and diversity within sites). In the case of ants, differences were found at the smaller scale, while no significant differences were detected at the larger scale. Ant diversity (both TD and FD) may vary across a wide range of spatial scales (Andersen 1997). The opposite occurred with the FD of birds, which showed no differences at the smaller scale but was significantly differ-ent at the larger scale, although only in mixed-pine forests. Regarding plants, both groups showed differences in TD and FD at both spatial scales. These results may be due to issues with the spatial scales used in our study, which may not have been sufficiently different. The potential differ-ences in TD and FD might be more evident if compared at the regional (landscape) or global scale (Gotelli and Ellison 2002).
Alternatively, the analysis based on the additive parti-tioning of diversity (exploring α- and β-diversities) allowed us to better clarify the response of TD and FD to land-use transformation at different spatial scales. Previous studies have demonstrated that the additive partitioning of spe-cies diversity is particularly relevant and useful for analys-ing the determinants of species diversity at multiple spatial scales and for designing more effective strategies for bio-diversity monitoring and conservation (Veech et al. 2002; Carmona et al. 2012). In our case, we found clear contrast-ing patterns between TD and FD in the proportion of vari-ability observed at each spatial scale. While most of the variability in TD was found at the larger scales (“within

968 Oecologia (2016) 181:959–970
1 3
sampling sites” and “between sampling sites”), irregard-less of organism group and land-use type, the greatest part of FD was found at the smallest scale of study (“within sampling unit”). This result indicates that species turnover among communities is much greater than functional trait turnover, which in turn shows that, for the traits selected for this research, the studied communities are ecologically redundant (de Bello et al. 2009). Although similar patterns have been previously described for plant communities (de Bello et al. 2009; Carmona et al. 2012), this is, to the best of our knowledge, the first time that it has been reported simultaneously for different taxonomic groups.
Do FD and TD follow similar patterns of change?
Human-induced land-use change usually causes species losses, and it is frequently assumed that this results in a loss of functional trait diversity. This is the most likely response because FD (calculated using the Rao index or other indi-ces) and TD are not completely independent of each other, but rather display a positive correlation (Laliberté and Leg-endre 2010). Mayfield et al. (2010) used the term “sampling effect” to refer to this positive relationship between species richness and FD observed in communities (Tilman et al. 1997). Accordingly, new traits will accumulate with the ran-dom addition of new species to a community or, similarly, traits will be lost when species are lost in a random fashion.
However, the responses of TD and FD could follow dif-ferent patterns if the addition or loss of species is not ran-dom with respect to their functional traits. Particularly, if many species exhibit similar traits (i.e., they are redundant), the strength of the TD–FD relationship would be reduced (Naeem and Wright 2003). A concomitant loss of species and functional trait diversity would be, in these cases, just one of a range of potential responses to land-use change. Mayfield et al. (2010) proposed eight theoretical response trajectories (vectors of change) that might appear in natural communi-ties affected by human-induced land-use change, with their occurrence being mostly determined by changes in processes of competitive exclusion and/or environmental filtering.
Our results are consistent with Mayfield’s proposal, showing that the vectors of change in FD and TD exhibit very different response trajectories along a land-use inten-sity gradient and that the pattern of response is highly dependent on the biotic group under analysis. In the most extreme example of land-use transformation consid-ered in our study (i.e., from Mediterranean shrublands to olive groves), the observed vectors of change in all biotic groups revealed a concurrent decrease in both TD and FD (although only significant for herbaceous and woody plants). However, our results are more heterogeneous when analysing land-use transformation to dehesas or mixed-pine forests.
Transformation to dehesas produced completely differ-ent results in all four studied biotic groups. Ant and bird diversity did not show significant patterns of change. In the case of herbaceous vegetation, there was a significant increase in species diversity, which was not matched by a similar change in functional trait diversity, resulting in an herbaceous community with high functional redundancy (i.e. the number of species possessing similar traits). This type of land-use transformation implies that the clearing of dense tree coverage relaxes competitive interactions and/or increases the availability of resources for herbaceous plants, allowing more functionally similar species from the regional pool to coexist. Dehesas, as pastoral systems that were originally forested, might still support high levels of TD, associated with the replacement of a larger variety of growth forms for numerous species with the same herba-ceous growth form. In dehesas, the functional redundancy of herbaceous vegetation illustrates how functional trait diversity and TD may be decoupled.
In the case of woody vegetation, the opposite was observed in the trajectory of change from Mediterranean shrublands to dehesas, with the noticeable decrease in TD not being matched by a decrease in functional trait diversity. In this case, woody species richness might have declined due to the increased importance of environmen-tal filters, such as livestock grazing pressure on sprouting plants. If these species losses are evenly distributed across functional trait groups, then no corresponding loss of func-tional trait diversity would be expected.
Land-use transformation from Mediterranean shrublands to mixed-pine forests has induced changes in FD and TD that are more difficult to interpret. The reduction in species diversity was accompanied by an increase in functional trait diversity of birds and woody plants. According to Mayfield et al. (2010), this vector of change seems relatively unlikely and is only expected to occur when major species losses under land-use change are mitigated by the colonisation of species with diverse functional types. This phenomenon is probably the case in our study area, as pines are currently being logged for wood, while forests are managed to allow the gradual process of natural vegetation recovery, result-ing in a mixture of pure coniferous forest plantations with typical Mediterranean forests (dominated by Quercus spp.) at different states of regeneration, with a wide range of heights and growth forms.
In conclusion, our results support the argument that the relationship of land use with TD and FD is highly complex and context-dependent (Naeem and Wright 2003). Impor-tantly, we demonstrate that changes in land use do not nec-essarily lead to the loss of FD mediated by the loss of spe-cies and/or functional traits, this effect being dependent on the biotic group analysed and the type and intensity of land transformation. Thus, conservation studies on the effects of
969Oecologia (2016) 181:959–970
1 3
land-use change should consider the particularities of each study site, the effect of spatial scale and biotic group when analysing the possible trajectories of change in both TD and FD.
Acknowledgments Financial support was received from the Spanish Ministry of Economy and Competitiveness (Project CGL2011-30266). Carlos P. Carmona was supported by a Marie Curie Intra-European Fellowship within the 7th European Commu-nity Framework Programme (TANDEM; Project ID 626392). Jorge Lozano was supported by a Prometeo Fellowship from the SENES-CYT, a national agency for Education and Science of the Government of Ecuador. Special thanks to Ana P. García-Nieto for map design and to César A. López, Desiree Rivera, Pedro Zorrilla-Miras, and Jorge Ortega for field assistance. We also thank three anonymous review-ers for the comments of the previous version of the manuscript. We appreciate the use of data from the TRY initiative on plant traits (http://www.try-db.org). The TRY initiative and database are hosted, developed and maintained by J. Kattge and G. Bönisch (Max Planck Institute for Biogeochemistry, Jena, Germany). TRY is currently sup-ported by DIVERSITAS/Future Earth and the German Centre for Integrative Biodiversity Research (iDiv) Halle-Jena-Leipzig. The experiments comply with the current laws of the country (Spain) in which the experiments were performed.
Author contribution statement VH, CPC, FMA, PA, and JAG designed experimental research, VH, CPC, FMA and JAG wrote the manuscript, FMA, MT and PA sampled, identified and measured functional traits of woody and herbaceous vegetation, VH, FMA, JAG, SCC and RA sampled and identified ants, SCC measured func-tional traits of ants, JAG, JL and VH sampled birds, CPC and VH per-formed statistical analyses.
References
Agencia Estatal de Meteorología (AEMET) (2012) Informe agro-meteorológico y fenológico de la primavera de 2012. AEMET, Madrid. Available at: http://www.aemet.es/documentos/es/serviciosclimaticos/vigilancia_clima/fenologia/feno_prima-vera_2012.pdf. Accessed 2 June 2015
Allan E, Manning P, Alt F, Binkenstein J, Blaser S, Blüthgen N, Böhm S, Grassein F, Hölzel N, Klaus VH, Kleinebecker T, Mor-ris EK, Oelmann Y, Prati D, Renner SC, Rillig MC, Schaefer M, Schloter M, Schmitt B, Schöning I, Schrumpf M, Solly E, Sorkau E, Steckel J, Steffen-Dewenter I, Stempfhuber B, Tschapka M, Weiner CN, Weisser WW, Werner M, Westphal C, Wilcke W, Fischer M (2015) Land use intensification alters eco-system multifunctionality via loss of biodiversity and changes to functional composition. Ecol Lett 18(8):834–843
Andersen A (1997) Using ants as bioindicators: multiscale issues in ant community ecology. Ecol Soc 1:8
Azcárate FM, Peco B (2012) Abandonment of graz-ing in a Mediterranean grassland area: consequences for ant assemblages. Insect Conserv Divers 5:279–288. doi:10.1111/j.1752-4598.2011.00165.x
Azcárate FM, Seoane J, Castro S, Peco B (2013) Drove roads: key-stone structures that promote ant diversity in Mediterranean forest landscapes. Acta Oecol 49:107–115. doi:10.1016/j.actao.2013.03.011
Benton TG, Bryant DM, Cole L, Crick HQP (2002) Linking agricul-tural practice to insect and bird populations: a historical study over three decades. J Appl Ecol 39:673–687
Blanca G, Cabezudo B, Cueto M, Fernández López C, Morales Torres C (2009) Flora Vascular de Andalucía Oriental, 4 vols. Conseje-ría de Medio Ambiente, Junta de Andalucía, Sevilla
Breitbach N, Laube I, Steffan-Dewenter I, Böhning-Gaese K (2010) Bird diversity and seed dispersal along a human land-use gradi-ent: high seed removal in structurally simple farmland. Oecolo-gia 162:965–976
Carmona CP, Azcárate FM, de Bello F, Ollero HS, Lepš J, Peco B (2012) Taxonomical and functional diversity turnover in Mediterranean grasslands: interactions between graz-ing, habitat type and rainfall. J Appl Ecol 49:1084–1093. doi:10.1111/j.1365-2664.2012.02193.x
Castroviejo S (2009) Flora ibérica: Plantaginaceae–Scrophulariaceae. Consejo Superior de Investigaciones Científicas, Madrid
Cornelissen JHC, Lavorel S, Garnier E, Díaz S, Buchmann N, Gur-vich DE, Reich PB, Steege HT, Morgan HD, van der Heijden MGA, Pausas JG, Poorter H (2003) A handbook of protocols for standardised and easy measurement of plant functional traits worldwide. Aust J Bot 51:335
Cramp S, Perrins CM (eds) (1994) Handbook of the Birds of the Western Palearctic. Oxford University Press, Oxford
De Bello F, Thuiller W, Lepš J, Choler P, Clément JC, Macek P, Sebastià MT, Lavorel S (2009) Partitioning of functional diver-sity reveals the scale and extent of trait convergence and diver-gence. J Veg Sci 20:475–486
De Bello F, Lavorel S, Díaz S, Harrington R, Cornelissen JHC, Bardgett RD, Berg MP, Cipriotti P, Feld CK, Hering D, Martins da Silva P, Potts SG, Sandin L, Souse JP, Storkey J, Wardle DA, Harrison PA (2010) Towards an assessment of multiple ecosys-tem processes and services via functional traits. Biodivers Con-serv 19:2873–2893. doi:10.1007/s10531-010-9850-9
De Lima RF, Dallimer M, Atkinson PW, Barlow J (2013) Biodiversity and land-use change: understanding the complex responses of an endemic-rich bird assemblage. Divers Distrib 19:411–422
Dı́az S, Cabido M (2001) Vive la différence: plant functional diversity matters to ecosystem processes. Trends Ecol Evol 16:646–655. doi:10.1016/S0169-5347(01)02283-2
Díaz S, Lavorel S, de Bello F, Quétier F, Grigulis K, Robson TM (2007) Incorporating plant functional diversity effects in ecosys-tem service assessments. Proc Natl Acad Sci USA 104:20684–20689. doi:10.1073/pnas.0704716104
Feld CK, Martins da Silva P, Paulo Sousa J, de Bello F, Bugter R, Grandin U, Hering D, Lavorel S, Mountford O, Pardo I, Pärtel M, Sandin L, Jones KB, Harrison P (2009) Indicators of biodi-versity and ecosystem services: a synthesis across ecosystems and spatial scales. Oikos 118:1862–1871
Flynn DFB, Gogol-Prokurat M, Nogeire T, Molinari N, Richers BT, Lin BB, Simpson N, Mayfield MM, DeClerck F (2009) Loss of functional diversity under land use intensification across multiple taxa. Ecol Lett 12:22–33. doi:10.1111/j.1461-0248.2008.01255.x
Gilroy JJ, Medina Uribe CA, Haugaasen T, Edwards DP (2015) Effect of scale on trait predictors of species responses to agriculture. Conserv Biol 29(2):463-472. doi:10.1111/cobi.12422
Gotelli NJ, Ellison AM (2002) Biogeography at a regional scale: determinants of ant species density in New England bogs and forests. Ecology 83:1604–1609
Gregory RD, van Strien A, Vorisek P, Meyling AWG, Noble DG, Fop-pen RP, Gibbons DW (2005) Developing indicators for European birds. Philos Trans R Soc Lond B 360:269–288
Gross KL, Willig MR, Gough L, Inouye R, Cox SB (2000) Patterns of species density and productivity at different spatial scales in herbaceous plant communities. Oikos 89:417–427
Hector A, Joshi J, Lawler S, Spehn EM, Wilby A (2001) Conserva-tion implications of the link between biodiversity and ecosystem functioning. Oecologia 129:624–628

970 Oecologia (2016) 181:959–970
1 3
Hevia V, Azcárate FM, Oteros-Rozas E, González JA (2013) Explor-ing the role of transhumance drove roads on the conservation of ant diversity in Mediterranean agroecosystems. Biodivers Con-serv 22:2567–2581. doi:10.1007/s10531-013-0539-8
Kattge J, Díaz S, Lavorel S, Prentice IC, Leadley P, Bönisch G, Gar-nier E, Westoby M, Reich PB, Wrightet IJ (2011) TRY—a global database of plant traits. Glob Change Biol 17:2905–2935
Kleijn D, Kohler F, Báldi A, Batáry P, Concepción ED, Clough Y, Díaz M, Gabriel D, Holzschuh A, Knop E, Kovács A, Marshall EJP, Tscharntke T, Verhulst J (2009) On the relationship between farmland biodiversity and land-use intensity in Europe. Proc Biol Sci 276:903–909
Laliberté E, Legendre P (2010) A distance-based framework for measuring functional diversity from multiple traits. Ecology 91:299–305
Lavorel S, Storkey J, Bardgett RD, de Bello F, Berg MP, Le Roux X, Moretti M, Mulder C, Pakeman RJ, Díaz S, Harrington R (2013) A novel framework for linking functional diversity of plants with other trophic levels for the quantification of ecosystem services. J Veg Sci 24(5):942–948
Leps J, De Bello F, Lavorel S, Berman S (2006) Quantifying and interpreting functional diversity of natural communities: practi-cal considerations matter. Preslia 78:481–501
Malo JE, Suárez F (1995) Herbivorous mammals as seed dispersers in a Mediterranean dehesa. Oecologia 104:246–255. doi:10.1007/BF00328589
Mason NWH, de Bello F (2013) Functional diversity: a tool for answering challenging ecological questions. J Veg Sci 24:777–780. doi:10.1111/jvs.12097
Mayfield MM, Bonser SP, Morgan JW, Aubin I, McNamara S, Vesk PA (2010) What does species richness tell us about functional trait diversity? Predictions and evidence for responses of species and functional trait diversity to land-use change. Glob Ecol Bio-geogr. doi:10.1111/j.1466-8238.2010.00532.x
McIntyre PB, Jones LE, Flecker AS, Vanni MJ (2007) Fish extinc-tions alter nutrient recycling in tropical freshwaters. Proc Natl Acad Sci USA 104:4461–4466
Milder JC, Lassoie JP, Bedford BL (2008) Conserving biodiversity and ecosystem function through limited development: an empiri-cal evaluation. Conserv Biol 22:70–79
Moretti M, de Bello F, Ibanez S, Fontana S, Pizzatti GB, Dziock F, Rixen C, Lavorel S (2013) Linking traits between plants and invertebrate herbivores to track functional effects of land-use changes. J Veg Sci 24:949–962. doi:10.1111/jvs.12022
Mouillot D, Mason WHN, Dumay O, Wilson JB (2005) Functional regularity: a neglected aspect of functional diversity. Oecologia 142:353–359
Naeem S, Wright JP (2003) Disentangling biodiversity effects on ecosystem functioning: deriving solutions to a seemingly insur-mountable problem. Ecol Lett 6:567–579
Nagendra H, Reyers B, Lavorel S (2013) Impacts of land change on biodiversity: making the link to ecosystem services. Curr Opin Environ Sustain 5:503–508
Nash MS, Bradford DF, Franson SE, Neale AC, Whitford WG, Heggem DT (2004) Livestock grazing effects on ant communi-ties in the eastern Mojave Desert, USA. Ecol Indic 4:199–213
Pereira HM, Navarro LM, Martins IS (2012) Global biodiversity change: the bad, the good, and the unknown. Annu Rev Environ Resour 37:25–50
Petchey OL, Gaston KJ (2006) Functional diversity: back to basics and looking forward. Ecol Lett 9:741–758
Petchey OL, Evans KL, Fishburn IS, Gaston KJ (2007) Low func-tional diversity and no redundancy in British avian assemblages. J Anim Ecol 76:977–985
Ricotta C, Moretti M (2011) CWM and Rao’s quadratic diver-sity: a unified framework for functional ecology. Oecologia 167:181–188
Roig X, Espadaler X (2010) Propuesta de grupos funcionales de hor-migas para la Península Ibérica y Baleares, y su uso como bioin-dicadores. Iberomyrmex 2:28–29
Royal Botanic Gardens Kew (2015) Seed Information Database (SID). Version 7.1. Available from: http://data.kew.org/sid/
Ruiz de la Torre J (2006) Flora mayor. Dirección General para la Bio-diversidad. Ministerio de Medio Ambiente, Madrid
Symstad AJ, Chapin FS, Wall DH, Gross KL, Huenneke LF, Mittel-bach GG, Peters DPC, Tilman D (2003) Long-term and large-scale perspectives on the relationship between biodiversity and ecosystem functioning. Bioscience 53:89
Team R Core (2014) R: a language and environment for statistical computing. R Foundation for Statistical Computing, Vienna, Austria
Tilman D, Knops J, Wedin D, Reich P, Ritchie M, Siemann E (1997) The influence of functional diversity and composition on eco-system processes. Science 277(5330):1300–1302. doi:10.1126/science.277.5330.1300
Vandermeer J, Yitbarek S (2012) Self-organized spatial pattern determines biodiversity in spatial competition. J Theor Biol 300:48–56
Vandewalle M, Bello F, Berg MP, Bolger T, Dolédec S, Dubs F, Feld CK, Harrington R, Harrison PA, Lavorel S, Martins da Silva P, Moretti M, Niemelä J, Santos P, Sattler T, Sousa JP, Sykes MT, Vanbergen AJ, Woodcock BA (2010) Functional traits as indicators of biodiversity response to land use changes across ecosystems and organisms. Biodivers Conserv 19:2921–2947. doi:10.1007/s10531-010-9798-9
Veech JA, Summerville KS, Crist TO, Gering JC (2002) The additive partitioning of species diversity: recent revival of an old idea. Oikos 99:3–9
Verhulst J, Báldi A, Kleijn D (2004) Relationship between land-use intensity and species richness and abundance of birds in Hun-gary. Agric Ecosyst Environ 104:465–473
Weiher E, van der Werf A, Thompson K, Roderick M, Garnier E, Eriksson O (1999) Challenging Theophrastus: a common core list of plant traits for functional ecology. J Veg Sci 10:609–620