Effects of L WR Coolant Environments on Fatigue …existing fatigue S-N data; at strain amplitudes
54
NUREG/CR-5704 ANL-98/31 Effects of L WR Coolant Environments on Fatigue Design Curves of Austenitic Stainless Steels Argonne National Laboratory U.S. Nuclear Regulatory Commission Office of Nuclear Regulatory Research Washington, DC 20555-0001 OAGI0000629 00001
Transcript of Effects of L WR Coolant Environments on Fatigue …existing fatigue S-N data; at strain amplitudes

NUREG/CR-5704 ANL-98/31
Effects of L WR Coolant Environments on Fatigue Design Curves of Austenitic Stainless Steels
Argonne National Laboratory
U.S. Nuclear Regulatory Commission Office of Nuclear Regulatory Research Washington, DC 20555-0001
OAGI0000629 00001
Effects of L WR Coolant Environments on Fatigue Design Curves of Austenitic Stainless Steels
Manuscript Completed: November 1998 Date Published: April 1999
Prepared by 0. K. Chopra
Argonne National Laboratory 9700 South Cass A venue Argonne, IL 60439
M. McNeil, NRC Project Manager
Prepared for Division of Engineering Technology Office of Nuclear Regulatory Research U.S. Nuclear Regulatory Commission Washington, DC 20555-0001 NRC Job Code W6610
NUREG/CR-5704 ANL-98/31
OAGI0000629 00002

NUREG/CR-5704 ii
OAGI0000629 00003
EFFECTS OF LWR COOLANT ENVIRONMENTS ON FATIGUE DESIGN CURVES OF AUSTENITIC STAINLESS STEELS
by
0. K. Chopra
Abstract
The ASME Boiler and Pressure Vessel Code provides rules for the construction of nuclear power plant components. Figures 1-9.1 through 1-9.6 of Appendix I to Section III of the Code specify fatigue design curves for structural materials. While effects of reactor coolant environments are not explicitly addressed by the design curves, test data indicate that the Code fatigue curves may not always be adequate in coolant environments. This report summarizes work performed by Argonne National Laboratory on fatigue of austenitic stainless steels in light water reactor (L WR) environments. The existing fatigue S-N data have been evaluated to establish the effects of various material and loading variables such as steel type, dissolved oxygen level, strain range, strain rate, and temperature on the fatigue lives of these steels. Statistical models are presented for estimating the fatigue S-N curves as a function of material, loading, and environmental variables. Design fatigue curves have been developed for austenitic stainless steel components in LWR environments. The extent of conservatism in the design fatigue curves and an alternative method for incorporating the effects of LWR coolant environments into the ASME Code fatigue evaluations are discussed.
iii NUREG/CR-5704
OAGI0000629 00004

NUREG/CR-5704 iv
OAGI0000629 00005
Contents
Executive Summary .................................................................................................... ix
Acknowledgments.......................................................................................................... xi
1 Introduction . . . . . . . . . . . . . . . . . . . . . . . . . . . . . . . . . . . . . . . . . . . . . . . . . . . . . . . . . . . . . . . . . . . . . . . . . . . . . . . . . . . . . . . . . . . . . . . . . . . . . . . . . . . 1
2 Experimental.......................................................................................................... 3
3 Overview of Fatigue S-N Data.................................................................................. 9
3.1 Air Environment............................................................................................ 9
3.2 LWR Environments........................................................................................ 12
3.2.1 Strain Rate......................................................................................... 13
3.2.2 Strain Amplitude................................................................................ 13
3.2.3 Dissolved Oxygen............................................................................... 14
3.2.4 Temperature . . .. . . . . .. . . . . .. . . . . .. . . . . .. . . . . .. . . . . .. . . . . .. . . . . .. . . . . .. . . . . .. . . . . .. . . . . .. . . . . .. . . . . 15
3.3 CastStainlessSteels ...................................................................................... 16
4 Mechanism of Fatigue Crack Initiation..................................................................... 18
4.1 Formation of Engineering Cracks.................................................................... 18
4.2 Environmental Effects.................................................................................... 20
5 Statistical Model..................................................................................................... 24
6 Design Fatigue Curves . . . . . . . . . . . . . . . . . . . . . . . . . . . . . . . . . . . . . . . . . . . . . . . . . . . . . . . . . . . . . . . . . . . . . . . . . . . . . . . . . . . . . . . . . . . . 28
7 Fatigue Life Correction Factor.................................................................................. 31
8 Conservatism in Design Fatigue Curves . . . . . . . . . . . . . . . . . . . . . . . . . . . . . . . . . . . . . . . . . . . . . . . . . . . . . . . . . . . . . . . . . . . 31
9 Fatigue Evaluations in LWR Environments............................................................... 33
v NUREG /CR-5 704
OAGI0000629 00006
10 Summary............................................................................................................... 33
10.1 Air Environment............................................................................................ 34
10.2 LWR Environments........................................................................................ 34
10.3 Fatigue Design Curves in LWR Environments.................................................. 35
References.............................................................................................................. 35
NUREG/CR-5704 vi
OAGI0000629 00007

Figures
1. Fatigue S-N data for CSs and austenitic SSs in water 2
2. Configuration of fatigue test specimen ................................................................... 4
3. Schematic diagram of autoclave system for fatigue tests in water environment.......... 4
4. Total applied displacement and strain in specimen gauge section during stroke-controlled tests with a sawtooth waveform.................................................... 6
5. Fatigue S-N behavior for Types 304, 316, and 316NG austenitic SSs in air at various temperatures............................................................................................. 10
6. Effect of strain rate on fatigue lives of austenitic SSs in air for various strain ranges. 10
7. Effect of strain range on cyclic strain-hardening behavior of Type 316NG SS in air at room temperature and 288oC ............................................................................. 11
8. Cyclic stress-strain curves for Types 316NG, 304, and 316 SSs in air at room temperature and 288°C.. .. . . . . .. . . . . .. . . . . .. . . . . .. . . . . .. . . . . .. . . . . .. . . . . .. . . . . .. . . . . .. . . . . .. . . . . .. . . . . .. . . . . .. . . 11
9. Fatigue strain amplitude-vs.-life data for Types 316NG and 304 SS in water at 288°C ................................................................................................................... 12
10. Dependence of fatigue life of austenitic SSs on strain rate in low- and high-DO water .................................................................................................................... 13
11. Results of strain rate change tests on Type 316 SS in low-DO water at 325oC.. .. . . . . .. . 14
12. Change in fatigue lives of austenitic SSs in low-DO water with temperature.............. 15
13. Waveforms for change in temperature during exploratory fatigue tests ...................... 15
14. Fatigue life of Type 316 SS under varying temperature indicated by horizontal bars ... 16
15. Fatigue strain amplitude-vs.-life data for CF-8M cast SSs in air............................... 17
16. Effect of strain rate on cyclic-hardening behavior of wrought and cast SSs in air at 288°C ................................................................................................................... 17
17. Fatigue strain amplitude-vs.-life data for CF-8M cast SSs in water.......................... 18
18. Dependence of fatigue lives of CF-8M cast SSs on strain rate in low-DO water at various strain amplitudes . . . . . . . . . . . . . . . . . . . . . . . . . . . . . . . . . . . . . . . . . . . . . . . . . . . . . . . . . . . . . . . . . . . . . . . . . . . . . . . . . . . . . . 18
19. Growth of cracks in smooth fatigue specimens........................................................ 19
20. Schematic illustration of short-crack behavior 20
vii NUREG/CR-5704
OAGI0000629 00008
21. Photomicrographs of gauge surface of Type 316NG SS specimens tested in air, simulated PWR water, and high-DO water ............................................................. 21
22. Schematic illustration of film rupture/slip dissolution process................................. 22
23. Photomicrographs of fracture surfaces of Types 304 and 316NG SS specimens tested in air, high-DO water, and low-DO, simulated PWR water. ............................. 23
24. Experimental and predicted values of fatigue lives of austenitic SSs in air and water environments . . . . . . . . . . . . . . . . . . . . . . . . . . . . . . . . . . . . . . . . . . . . . . . . . . . . . . . . . . . . . . . . . . . . . . . . . . . . . . . . . . . . . . . . . . . . . . . . . . . . . . . . 26
25. Experimental fatigue lives and those estimated from statistical models for austenitic SSs in water environments..................................................................................... 26
26. Residual error for austenitic SSs as a function of test temperature........................... 27
27. Residual error for austenitic SSs as a function of material heat................................ 27
28. Residual error for austenitic SSs as a function of loading strain rate......................... 27
29. Residual error for austenitic SSs as a function of applied strain amplitude................ 28
30. Residual error for austenitic SSs as a function of dissolved oxygen in water . . . . . . . . . . . . . . 28
31. ASME and statistical-model design fatigue curves for Types 304 and 316 SS in air . . 30
32. ASME and statistical-model design fatigue curves for Types 304 and 316 SS in water with <0.05 ppm DO ...................................................................................... 30
33. ASME and statistical-model design fatigue curves for Types 304 and 316 SS in water with ~0.05 ppm DO . . .. . . . . .. . . . . .. . . . . .. . . . . .. . . . . .. . . . . .. . . . . .. . . . . .. . . . . .. . . . . .. . . . . .. . . . . .. . . . . .. . . . . 30
Tables
1. Composition (in wt. %) of wrought and cast SSs used for fatigue tests........................ 3
2. Fatigue test results for Type 316NG austenitic SS . . .. . . . . .. . . . . .. . . . . .. . . . . .. . . . . .. . . . . .. . . . . .. . . . . . 7
3. Fatigue test results for Type 304 austenitic SS at 288oC . . .. . . . . .. . . . . .. . . . . .. . . . . .. . . . . .. . . . . .. . . 8
4. Fatigue test results for CF-8M cast SSs at 288oC .................................................... 8
5. Subfactors that may be used to account for effects of various variables on fatigue life........................................................................................................................ 32
NUREG/CR-5704 viii
OAGI0000629 00009
Executive Summary
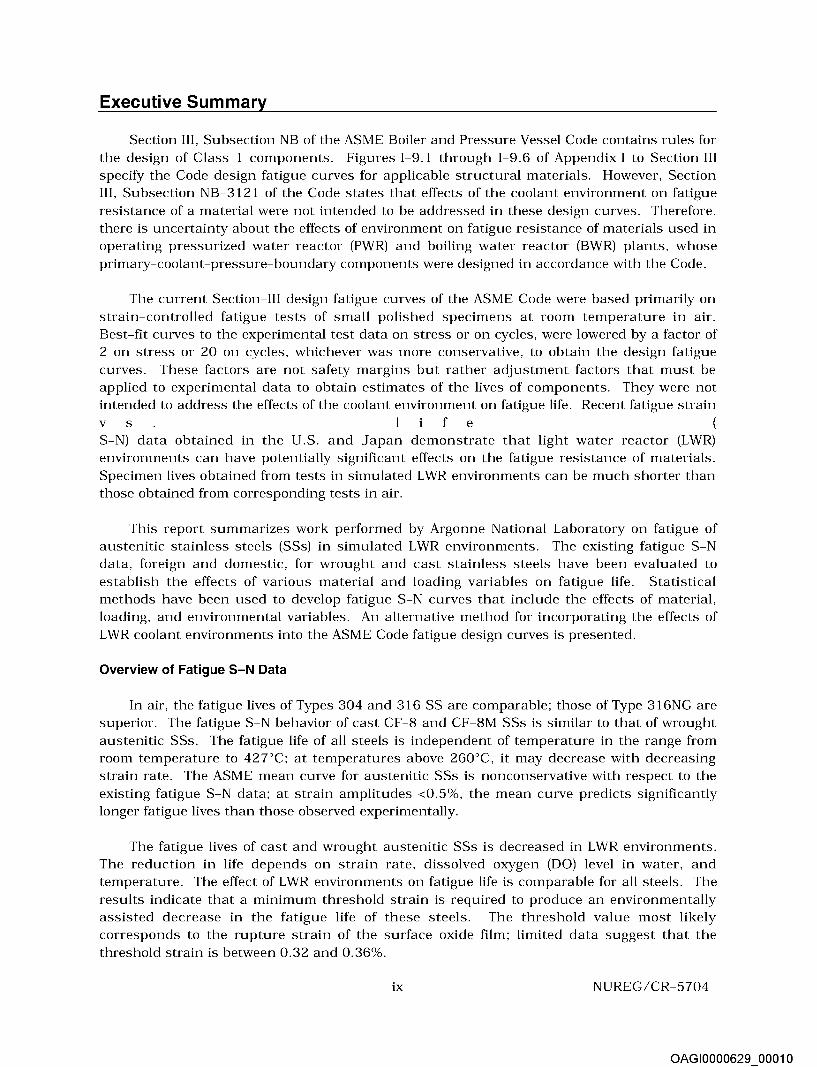
Section III, Subsection NB of the ASME Boiler and Pressure Vessel Code contains rules for the design of Class 1 components. Figures I-9.1 through I-9.6 of Appendix I to Section III specify the Code design fatigue curves for applicable structural materials. However, Section III, Subsection NB-3121 of the Code states that effects of the coolant environment on fatigue resistance of a material were not intended to be addressed in these design curves. Therefore, there is uncertainty about the effects of environment on fatigue resistance of materials used in operating pressurized water reactor (PWR) and boiling water reactor (BWR) plants, whose primary-coolant-pressure-boundary components were designed in accordance with the Code.
The current Section-III design fatigue curves of the ASME Code were based primarily on strain-controlled fatigue tests of small polished specimens at room temperature in air. Best-fit curves to the experimental test data on stress or on cycles, were lowered by a factor of 2 on stress or 20 on cycles, whichever was more conservative, to obtain the design fatigue curves. These factors are not safety margins but rather adjustment factors that must be applied to experimental data to obtain estimates of the lives of components. They were not intended to address the effects of the coolant environment on fatigue life. Recent fatigue strain v s 1 f e (
S-N) data obtained in the U.S. and Japan demonstrate that light water reactor (LWR) environments can have potentially significant effects on the fatigue resistance of materials. Specimen lives obtained from tests in simulated LWR environments can be much shorter than those obtained from corresponding tests in air.
This report summarizes work performed by Argonne National Laboratory on fatigue of austenitic stainless steels (SSs) in simulated L WR environments. The existing fatigue S-N data, foreign and domestic, for wrought and cast stainless steels have been evaluated to establish the effects of various material and loading variables on fatigue life. Statistical methods have been used to develop fatigue S-N curves that include the effects of material, loading, and environmental variables. An alternative method for incorporating the effects of LWR coolant environments into the ASME Code fatigue design curves is presented.
Overview of Fatigue S-N Data
In air, the fatigue lives of Types 304 and 316 SS are comparable; those of Type 316NG are superior. The fatigue S-N behavior of cast CF-8 and CF-SM SSs is similar to that of wrought austenitic SSs. The fatigue life of all steels is independent of temperature in the range from room temperature to 427"C; at temperatures above 260°C, it may decrease with decreasing strain rate. The ASME mean curve for austenitic SSs is nonconservative with respect to the existing fatigue S-N data; at strain amplitudes <0.5%, the mean curve predicts significantly longer fatigue lives than those observed experimentally.
The fatigue lives of cast and wrought austenitic SSs is decreased in LWR environments. The reduction in life depends on strain rate, dissolved oxygen (DO) level in water, and temperature. The effect of LWR environments on fatigue life is comparable for all steels. The results indicate that a minimum threshold strain is required to produce an environmentally assisted decrease in the fatigue life of these steels. The threshold value most likely corresponds to the rupture strain of the surface oxide film; limited data suggest that the threshold strain is between 0.32 and 0.36%.
ix NUREG/CR-5704
OAGI0000629 00010

The effects of environment on fatigue life occur primarily during the tensile-loading cycle, and at strain levels greater than the threshold value required to rupture the surface oxide film. Consequently, loading and environmental conditions, e.g., strain rate, temperature, and DO level, in excess of the oxide rupture strain during the tensile-loading cycle, are important parameters for environmentally assisted reduction of fatigue life of these steels. Unlike ferritic steels, where environmental effects are greater in high-DO environments, environmental effects on fatigue life of austenitic stainless steels are more pronounced in low- than in high-DO water. The reduction in life is greater by a factor of ""2 in simulated PWR environment, i.e., <0.01 ppm DO, than in high-DO water, i.e., ~0.1 ppm DO. Existing data are inadequate to establish the functional form for the dependence of fatigue life on DO content. Recent data indicate that conductivity of water is important for environmental effects on fatigue life in high-DO water. The fatigue lives of cast SSs are approximately the same in both high- and low-DO water and are comparable to those observed for wrought SSs in low-DO water.
The fatigue lives of austenitic SSs decrease with decreasing strain rate; the effect is greater in a low-DO PWR environment than in high-DO water. The results indicate that the rate below which the effects of strain rate on fatigue life saturate may depend on both steel type and DO level. In low-DO PWR environments, saturation strain rate appears to be at ""0.0004%/s for Type 304 SS and somewhat higher for Type 316 SS. The existing data are inadequate to establish the functional form for the dependence of life on temperature. Limited data indicate that environmental effects on fatigue life are significant at 250oC and minimal below 200°C.
Fatigue Design Curves in LWR Environments
Statistical models have been developed to predict fatigue lives of small smooth specimens of austenitic SSs as a function of material, loading, and environmental parameters. The functional form and bounding values of these parameters were based on experimental observations and data trends. The statistical models were obtained by minimizing the squared Cartesian distances from the data point to the predicted curve instead of minimizing the sum of the square of the residual errors for either strain amplitude or fatigue life. The models are recommended for predicted fatigue lives :::; 106 cycles. The results indicate that the ASME mean curve for SSs is not consistent with the experimental data at strain amplitudes <0.5% or stress amplitudes <975 MPa (<141 ksi); the ASME mean curve is non conservative.
The design fatigue curves for austenitic SSs in LWR environments were obtained by the procedure that has been used to develop the current ASME Code design fatigue curves, i.e., by adjusting the best-fit experimental curve for the effect of mean stress and setting margins of 20 on cycles and 2 on strain to account for the uncertainties in life that are associated with material and loading conditions. However, because the margin on strain for the current ASME Code design fatigue curve is closer to 1.5 than 2, a factor of 1.5 was used in developing the design fatigue curves for LWR environments. Data available in the literature were reviewed to evaluate the conservatism in the existing Code fatigue design curves. The use of a fatigue life correction factor to incorporate the effects of environment into the ASME Code fatigue evaluations is also discussed.
NUREG/CR-5704 X
OAGI0000629 00011

Acknowledgments
The author thanks J. L. Smith, W. F. Burke, T. M. Galvin, and J. Tezak for their contributions to the experimental effort and W. J. Shack and T. F. Kassner for helpful discussions. This work is sponsored by the Office of Nuclear Regulatory Research, U.S. Nuclear Regulatory Commission, under Job Code W661 0-6; Program Manager: Dr. M. B. McNeil.
xi NUREG/CR-5704
OAGI0000629 00012

NUREG/CR-5704 xii
OAGI0000629 00013

1 Introduction
Experience with operating nuclear power plants worldwide reveals that many failures, e.g., in piping components, nozzles, valves, and pumps, may be attributed to fatigue.l-3 In most cases, these failures have been associated with thermal loading due to thermal stratification or thermal striping, or with mechanical loading due to vibration. Significant thermal loadings due to flow stratification were not included in the original design basis analysis. The effect of these loadings may also have been aggravated by corrosion effects due to exposure to high-temperature aqueous environments. Fatigue cracks have been observed in pressurizer surge lines in pressurized water reactors (PWRs) (NRC Bulletin No. 88-11), and in feedwater lines connected to nozzles of pressure vessels in boiling water reactors (BWRs) and steam generators in PWRs (NRC IE Bulletin, 79-13; NRC Information Notice 93-20). These cracks have been attributed to corrosion fatigue (NRC IE Bulletin, 79-13) or strain-induced corrosion cracking4 caused by cyclic loading due to thermal stratification during startup (hot standby) and shutdown periods.
Cyclic loadings on a structural component occur because of changes in the mechanical and thermal loadings as the system goes from one set of pressure, temperature, moment, and force loading to any other load set. For each pair of load sets, an individual fatigue usage factor is determined by the ratio of the number of cycles anticipated during the lifetime of the component to the allowable cycles. Figures I-9.1 through I-9.6 of Appendix I to Section III of the ASME Boiler and Pressure Vessel CodeS specifies fatigue design curves that define the allowable number of cycles as a function of applied stress amplitude. The cumulative usage factor (CUF) is the sum of the individual usage factors, and Section III of the ASME Code requires that the CUF at each location must not exceed 1.
The Code design fatigue curves were based on strain-controlled tests of small polished specimens at room temperature in air. In most studies, the fatigue life of a test specimen is defined as the number of cycles required for the tensile stress to drop 25% from its peak value. Such a drop corresponds to an z3-mm-deep crack. Consequently, fatigue life N represents the number of cycles required to initiate a crack z3 mm deep. The best-fit curves to the experimental data were expressed in terms of the Langer equation6 of the form
Ea = B(N)-b + A, (1)
where A, B, and b are parameters of the model. Equation 1 may be written in terms of stress amplitude Sa instead of strain amplitude Ea, in which case stress amplitude is the product of strain amplitude and elastic modulus, i.e., Sa = Ea.E The design fatigue curves were obtained by decreasing the best-fit curves by a factor of 2 on stress or 20 on cycles, whichever was more conservative, at each point on the best-fit curve. As described in the ASME Section-III criteria document, these factors were intended to account for the differences and uncertainties in relating the fatigue lives of laboratory test specimens to those of actual reactor components. The factor of 20 on cycles is the product of three separate subfactors: 2 for scatter of data (minimum to mean), 2.5 for size effects, and 4 for surface finish, atmosphere, etc. "Atmosphere" was intended to reflect the effects of an industrial environment rather than the controlled environment of a laboratory. The factors of 2 and 20 are not safety margins but rather conversion factors that must be applied to the experimental data to obtain reasonable
OAGI0000629 00014

"' w a)
~ 1.0 0.. E <(
c -~
U3 0.1
0
!i
Temp. ("C) <150 15(}-250 DO (ppm) 0:0.05 0.05-{).2 Rate (%/s) <:0.4 0.01-{).4
0--- s (wt. %) <:0.006 <:0.006
'---. !', &!
0 Q__ Mean Curve
~m:~ RTAir
¢ ~o~u~o,o~ ~ 00 !', ~Yo
• :?/ !', 0 Ci§g5"(Jt6 0
/ ---S;J ASME Design Curve
Fatigue Life (Cycles)
'I
Austenitic Stainless Steels
0 0
Temp. ("C): 100-200 25(}-325 26(}-325 DO (ppm) : ~0.005 ~0.005 <:0.2
'···· .. ~' ~~,, •00> "::, c:,: RTAir
~~~ / 0~~ilf:l5~ ~?p .J:' 0~¢---~~
0&/.~
ASME Design Curve ,1 ,1
Fatigue Life (Cycles)
Figure 1. Fatigue S-N data for CSs and austenitic SSs in water (RT = room temperature)
estimates of the lives of actual reactor components. In a benign environment, some fraction of the factors actually represents a safety margin.
Subsection NB-3121 of Section III of the Code states that the data on which the fatigue design curves (Figs. I-9.1 through I-9.6) are based did not include tests in the presence of corrosive environments that might accelerate fatigue failure. Article B-2131 in Appendix B to Section III states that the owner's design specifications should provide information about any reduction to fatigue design curves that is required because of environmental conditions. Recent fatigue strain-vs.-life (S-N) data illustrate potentially significant effects of light water reactor (LWR) coolant environments on the fatigue resistance of carbon steels (CSs) and low-alloy steels (LASs), 7-20 as well as of austenitic stainless steels (SSs),21-31 (Fig. 1). Under certain conditions of loading and environment, fatigue lives of CSs can be a factor of 70 lower in the environment than in air.10,17-20
Therefore, the margins in the ASME Code may be less conservative than originally intended.
A program is being conducted at Argonne National Laboratory (ANL) to develop data and models for predicting the effects of environment on fatigue design curves of pressure vessel and piping steels and to assess the additivity of fatigue damage under load histories typical of LWR components. Fatigue tests are being conducted to establish the effects of various loading and environmental variables on the fatigue S-N behavior of pressure boundary steels. Interim design fatigue curves that address environmental effects on fatigue life of carbon and low-alloy steels and austenitic SSs have been proposed; they are based on existing fatigue S-N data. 32 Statistical models have also been developed at ANL for estimating the effects of various material and loading conditions on the fatigue life of these materials. 33,34 Results of the statistical analysis have been used to estimate the probability of fatigue cracking in reactor components. The statistical models for carbon and low-alloy steels have recently been updated with a larger fatigue S-N data base.18-20
The interim design curve and statistical model for austenitic SSs were based on limited data. For example, nearly all of the data in water were obtained at high temperatures (280-320°C) and high levels of dissolved oxygen (DO) (0.2-8 ppm). The data were inadequate to define the loading and environmental conditions that can decrease fatigue life of austenitic SSs. The threshold for strain amplitude above which environment can decrease fatigue life, and the value of strain rate below which environmental effects saturate, were based on the data for carbon and low-alloy steels. Fatigue lives in LWR environments were assumed to be independent of temperature. Furthermore, although the proposed interim fatigue design curve33,34 for austenitic SSs was based on data
OAGI0000629 00015

obtained in high-DO water, the curve was recommended for use at all oxygen levels until additional data became available, on the assumption that this was a conservative estimate of the likely effect of DO. Recent experimental results indicate that this assumption is not true.29-31 Also, the effects of LWR environments on the fatigue lives of cast SSs have not been addressed. Recent test results and a larger fatigue S-N data base have led to the update of statistical models that were developed earlier for estimating the fatigue lives of austenitic SSs in LWR environments.31
This report summarizes available data on the effects of various material and loading variables, such as steel type, DO level, strain range, and strain rate, on the fatigue lives of wrought and cast austenitic SSs. The data have been analyzed to identify key parameters that influence fatigue life and define the threshold and saturation values of these parameters. The updated statistical models for estimating the fatigue lives of austenitic SSs in LWR environments are presented. The significance of the effect of environment on the current Code design curve is evaluated.
2 Ex peri mental
Fatigue tests have been conducted on Types 316NG and 304 SS and two heats of CF-SM cast SS to establish the effects of LWR coolant environments on fatigue lives of these steels. The chemical composition of the steels is given in Table 1. For the CF-SM steels, fatigue specimens were obtained from material that was thermally aged for 10,000 hat 4000C; Heat 74 was tested both in the unaged and aged condition. Smooth cylindrical specimens with 9.5-mm diameter and 19-mm gauge length were used for the fatigue tests (Fig. 2). A 1-11m surface finish in the axial direction on the specimen gauge length to prevent circumferential scratches that might act as sites for crack initiation.
Table 1. Composition (in wt. %) of wrought and cast SSs used for fatigue tests
Material Heat Source c p s Si Cr Ni Mn Mo Cu N
Type 316NGa D432804 Vendor 0.011 0.020 0.001 0.52 17.55 13.00 1.76 2.49 0.10 0.108 ANL 0.013 0.020 0.002 0.49 17.54 13.69 1.69 2.45 0.10 0.105
Type 304b 30956 Vendor 0.060 0.019 0.007 0.48 18.99 8.00 1.54 0.44 0.100 CF-8M c 74 ANL 0.064 0.73 19.11 9.03 0.54 2.51 0.048 CF-8M d 75 ANL 0.065 0.67 20.86 9.12 0.53 2.58 0.052
aASME SA312 seamless stainless steel pipe (hot-finished), 610-mm O.D. and 30.9-mm wall, fabricated by Sumitomo Metal Industries, Ltd. Solution-annealed at 1038-1093oC for 0.5 hand water-quenched.
bsolution-annealed at 1050oC for 0.5 h. csolutionannealed 1065-1120oC and waterquenched, measured ferrite content 18%. dsolutionannealed 1065-1120oC and waterquenched, measured ferrite content 28%.
Tests in water were conducted in a small autoclave with an annular volume of 12 mL; see Fig. 3. The once-through system consists of a 132-L supply tank, Pulsafeeder™ pump, heat exchanger, preheater, and autoclave. Water is circulated at a rate of z10 mL/min and a system
pressure of 9 MPa. The autoclave is constructed of Type 316 SS and contains a titanium liner. The supply tank and most of the low-temperature piping are Type 304 SS;
OAGI0000629 00016

~--------- 11 7/8
Figure 2. Configuration of fatigue test specimen (all dimensions in inches)
2
1. Cover-gas supply tank 2. Water supply tank 3. Pulsafeeder high-pressure pump 4. Check valve 5. Heat exchanger 6. Preheat exchanger 7. Pipe autoclave 8. Fatigue test specimen 9. MTS hydraulic collet grips
1 0. MTS load cell 11 . Displacement L VDT 12. MTS hydraulic actuator 13. ECP cell 14. Platinum electrode 15. Specimen electrode 16. Reference electrode 17. Mity Mite™ back-pressure regulator 18. Orbisphere dissolved-oxygen meter 19. MTS electrohydraulic controls
Figure 3. Schematic diagram of autoclave system for fatigue tests in water environment
titanium tubing is used in the heat exchanger and for connections to the autoclave and electrochemical potential (ECP) cell. An Orbisphere meter and CHEMetrics™ ampules were used to measure the DO concentrations in the supply and effluent water. The redox and open-circuit
OAGI0000629 00017

corrosion potentials were monitored at the autoclave outlet by measuring the ECPs of platinum and an electrode of the test material, respectively, against a 0.1-M KCll AgCll Ag external (cold) reference electrode. The measured ECPs, E(meas) (mV), were converted to the standard hydrogen electrode (SHE) scale, E(SHE) (mV), by the polynomial expression35
E(SHE) = E(meas) + 286.637- 1.0032(AT) + 1.7447x10⁻⁴(AT)2- 3.03004x10⁻⁶(AT)3, (2)
where AT (°C) is the test temperature of the salt bridge in the reference electrode minus the ambient temperature. The test facility was later modified from a once-through system to a recirculating system. For fatigue tests in high-DO environments, an ion-exchange filter was added to the return line to maintain the high resistivity of the water. Also, a filter was installed in the cover-gas line to eliminate possible contamination. A similar recirculating system was used for fatigue tests in simulated low-DO PWR environments, except that the ECP cell was bypassed during recirculation and the ion-exchange filter in the return line from the autoclave to the feedwater supply tank was excluded.
After an initial transition period, when an oxide film develops on the fatigue sample, the DO level and ECP remain constant during the fatigue tests in either the once-through or recirculating water system. Although the difference between the DO levels in the feedwater and effluent water is >0.1 ppm, the difference between the DO levels at the inlet and outlet of the autoclave is z0.02 ppm.
The DO level in the water was established by bubbling nitrogen that contains 1-2% oxygen through deionized water in the supply tank. The deionized water was prepared by passing purified water through a set of filters that comprise a carbon filter, an Organex-Q filter, two ion exchangers, and a 0.2-mm capsule filter. Water samples were taken periodically to measure pH, resistivity, and DO concentration. When the desired concentration of DO was attained, the nitrogen/oxygen gas mixture in the supply tank was maintained at a 20-kPa overpressure. After an initial transition period during which an oxide film develops on the fatigue specimen, the DO level and the ECP in the effluent water remained constant during the test. Test conditions are described in terms of the DO in effluent water.
Simulated PWR water was obtained by dissolving boric acid and lithium hydroxide in 20 L of deionized water before adding the solution to the supply tank. The DO in the deionized water was reduced to <10 ppb by bubbling nitrogen through the water. A vacuum was drawn on the tank cover gas to speed deoxygenation. After the DO was reduced to the desired level, a 34-kPa overpressure of hydrogen was maintained to provide z2 ppm dissolved hydrogen (or z23 cm3/kg) in the feedwater.
All tests were conducted at 288°C, with fully reversed axial loading (i.e., R = -1) and a triangular or sawtooth waveform. The tests in water were performed under stroke control, wherein the specimen strain was controlled between two locations outside the autoclave. Tests in air were performed under strain control with an axial extensometer; the stroke at the location used to control the water tests was also recorded. Information from the air tests was
OAGI0000629 00018

I
I
--- Strain in specimen gauge section - - - Applied displacement
Figure 4. Total applied displacement (dashed line) and strain in specimen gauge section (solid line) during stroke-controlled tests with a sawtooth waveform
used to determine the stroke required to maintain constant strain in the specimen gauge. To account for cyclic hardening of the material, the stroke that was needed to maintain constant strain was gradually increased during the test. Figure 4 shows the actual strain in the specimen gauge section during a stroke-controlled test with a sawtooth waveform. The fraction of applied displacement that goes to the specimen gauge section is not constant but varies with loading strain. Consequently, the loading rate also varies during the fatigue cycle; it is lower than the applied strain rate at strain levels below the elastic limit and higher at larger strains.
The strain-controlled fatigue tests in air on cast SS specimens showed strain ratcheting in compression. Although strain in the gauge section of the specimens remained constant, overall length of the specimens decreased during the test. The results indicated that strain ratcheting was caused by differences in the strain hardening behavior of these steels in tension and compression. For both heats of CF-SM steel, strain hardening was greater in compression than in tension. The result of this difference was a mean compressive stress, which caused strain ratcheting of the shoulder region of the specimens. To prevent strain racheting, tests in water were conducted under stroke control with a small tensile strain.
To date, the fatigue results obtained on Types 316NG and 304 SS and two heats of CF-SM cast SS in air and LWR environments are summarized in Tables 2-4. The fatigue life Nzs is defined as the number of cycles for tensile stress to drop 25% from its peak value. Fatigue lives defined by other criteria, e.g., a 50% decrease in peak tensile stress or complete failure, may be converted to an N 25 value by solving the equation
Nzs = Nx I (0.947 + 0.00212 X), (3)
where X is the failure criteria, i.e., 25, 50, or 100% decrease in peak tensile stress. For tests in water, the DO level and ECPs of platinum and SS electrodes represent the values in the effluent, and the pH and conductivity of water were both measured in the supply tank.
OAGI0000629 00019

Table 2. Fatigue test results for Type 316NG austenitic SS
Test No. Env.a
Room Temp. 1394 Air 1391 Air 1390 Air 1396 Air 1420 Air 1392 Air 1393 Air 1395 Air 1397 Air 1398 Air 1399 Air 1400 Air
288oC 1408 1790 1409 1410 1792 1407 1430 1435 1480 1485
320oC
Air Air Air Air Air Air Air Air Air Air
1405 Air 1404 Air 1406 Air
288oC 1796 1812 1791 1793 1794 1814
1426 1427 1428 1797 1414 1418 1423 1425 1431 1434
PWR PWR PWR PWR PWR PWR
Hi DO Hi DO Hi DO Hi DO Hi DO Hi DO Hi DO Hi DO Hi DO Hi DO
nob (ppb)
5 2 4 4 4
>200 >200 >200
750 >200 >200 >200 >200 >200 >200
Conduc-pH tivity c
at RT {l.tS/cm)
6.4 6.5 6.5 6.4 6.4 6.5
5.9
20.20 20.00 19.23 19.23 20.00 20.00
0.076
ECP ECP Pt mV Steel mV (SHE) (SHE)
-677 -673 -689 -686 -697 -697 -699 -700 -690 -689 -694 -691
199 64
Ten. Rate (%/s)
5.0E-1 5.0E-1 5.0E-1 5.0E-1 4.9E-1 5.0E-1 5.0E-1 5.0E-1 5.0E-1 5.0E-1 5.0E-1 5.0E-1
Comp. Rate (%/s)
5.0E-1 5.0E-1 5.0E-1 5.0E-1 4.9E-1 5.0E-1 5.0E-1 5.0E-1 5.0E-1 5.0E-1 5.0E-1 5.0E-1
5.0E-1 5.0E-1 5.0E-3 5.0E-1 5.0E-1 5.0E-1 5.0E-1 5.0E-1 5.0E-3 5.0E-1 5.0E-1 5.0E-1 5.0E-1 5.0E-1 5.0E-1 5.0E-1 4.9E-1 4.9E-1 5.1E-1 5.1E-1
Stress Range (MPa)
694.7 554.8 518.1 506.7 495.3 475.9 464.7 456.7 446.0 436.7 431.8 427.4
416.6 452.8 377.2 377.6 413.4 364.4 348.3 342.0 340.1 340.4
Strain Range
(%)
1.51 1.00 0.75 0.76 0.49 0.51 0.41 0.35 0.30 0.27 0.25 0.25
0.76 0.75 0.50 0.50 0.51 0.40 0.30 0.25 0.25 0.25
5.0E-1 5.0E-1 426.0 0.75 5.0E-1 5.0E-1 387.4 0.50 5.0E-1 5.0E-1 371.6 0.40
5.0E-1 5.0E-1 5.0E-2 5.0E-1 5.0E-3 5.0E-1 5.0E-3 5.0E-1 5.0E-3 5.0E-1 5.0E-2
8.0E-1 8.2E-2
5.0E-1
8.0E-1 8.2E-2
7.4E-3 7.4E-3 5.0E-3 5.0E-1 5.0E-1 5.0E-1 5.0E-2
5.0E-1 5.0E-1 5.0E-2
4.9E-3 4.9E-3 2.9E-1 2.9E-2
2.9E-1 2.9E-2
403.6 413.9 441.9 434.3 390.9 348.7
405.1 421.7 441.4 437.3 375.3 375.5 378.8 393.2 356.5 350.0
0.80 0.80 0.77 0.80 0.50 0.29
0.80 0.82 0.74 0.78 0.50 0.50 0.50 0.49 0.29 0.29
Life Nzs
(Cycles)
4.649 13.561 25.736 30.000 54.249 60.741
127.386 183.979 347.991 666.000
>1.900.000 1.775.000
21.548 16.765 53.144 51.194 35.710 82.691
168.852 314.352 319.308 369.206
20.425 47.011 82.691
12.500 6.375 3.040 3.020 7.370
33.200
12.069 6.679 5.897 4.520
26.230 25.714 17.812 13.684
116.754 40.643
1436 Hi DO >200 2.5E-2 2.5E-2 354.0 0.25 >1.719.851 1512 Hi DO >200 2.4E-1 2.4E-1 361.2 0.24 2.633.954
apwR = simulated PWR water containing 2 ppm lithium and 1000 ppm boron. bno and ECPs measured in effluent. cconductivity of water measured in feedwater supply tank.
OAGI0000629 00020
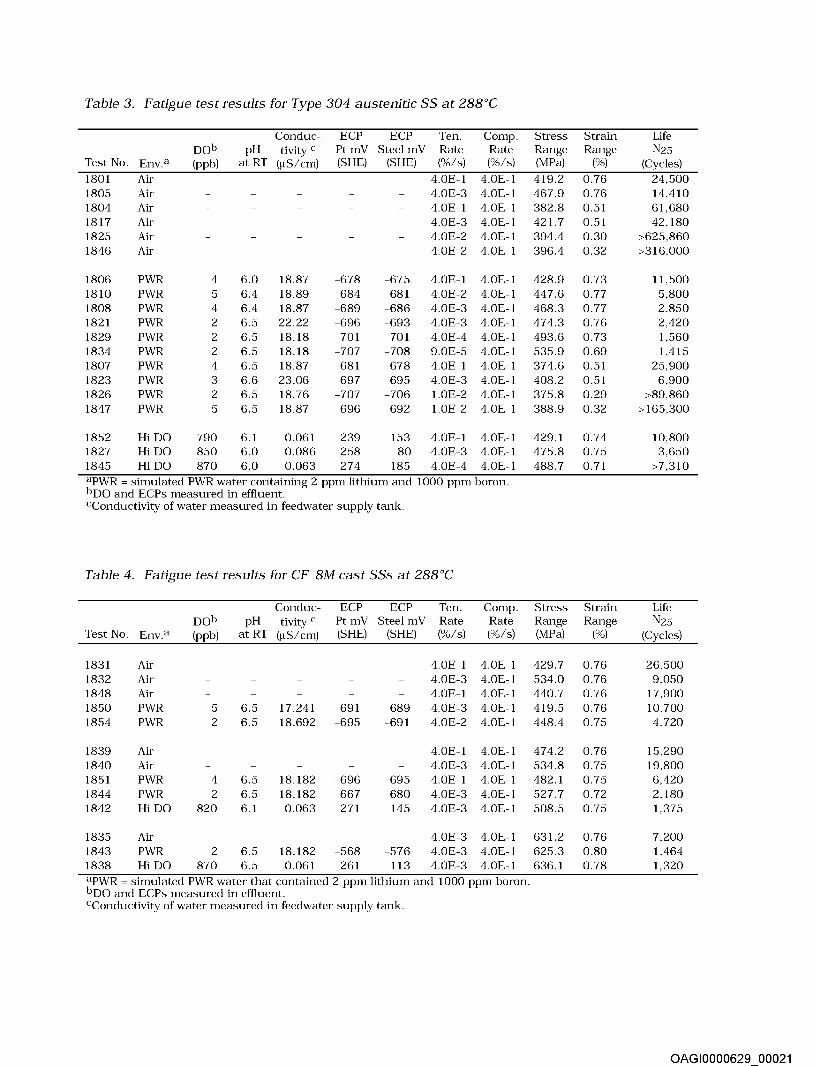
Table 3. Fatigue test results for Type 304 austenitic SS at 288oC
Test No.
1801 1805 1804 1817 1825 1846
1806 1810 1808 1821 1829 1834 1807 1823 1826 1847
Env.a
Air Air Air Air Air Air
PWR PWR PWR PWR PWR PWR PWR PWR PWR PWR
nob (ppb)
4 5 4 2 2 2 4 3 2 5
Conduc-pH tivity c
at RT {l.tS/cm)
6.0 6.4 6.4 6.5 6.5 6.5 6.5 6.6 6.5 6.5
18.87 18.89 18.87 22.22 18.18 18.18 18.87 23.06 18.76 18.87
ECP ECP Pt mV Steel mV (SHE) (SHE)
-678 -684 -689 -696 -701 -707 -681 -697 -707 -696
-675 -681 -686 -693 -701 -708 -678 -695 -706 -692
153 80
Ten. Rate (%/s)
4.0E-1 4.0E-3
Comp. Rate (%/s)
4.0E-1 4.0E-1
4.0E-1 4.0E-1 4.0E-3 4.0E-1 4.0E-2 4.0E-1 4.0E-2 4.0E-1
4.0E-1 4.0E-1 4.0E-2 4.0E-1 4.0E-3 4.0E-1 4.0E-3 4.0E-1 4.0E-4 4.0E-1 9.0E-5 4.0E-1 4.0E-1 4.0E-1 4.0E-3 4.0E-1 l.OE-2 4.0E-1 l.OE-2 4.0E-1
4.0E-1 4.0E-1 4.0E-3 4.0E-1
Stress Range (MPa)
419.2 467.9 382.8 421.7 394.4 396.4
428.9 447.6 468.3 474.3 493.6 535.9 374.6 408.2 375.8 388.9
429.1 475.8
Strain Range
(%)
0.76 0.76 0.51 0.51 0.30 0.32
0.73 0.77 0.77 0.76 0.73 0.69 0.51 0.51 0.29 0.32
0.74 0.75
1852 1827 1845
Hi nO Hi nO Hi nO
790 850 870
6.1 6.0 6.0
0.061 0.086 0.063
239 258 274 185 4.0E-4 4.0E-1 488.7 0.71
apwR = simulated PWR water containing 2 ppm lithium and 1000 ppm boron. bno and ECPs measured in effluent. cconductivity of water measured in feedwater supply tank.
Table 4. Fatigue test results for CF-SM cast SSs at 288oC
Test No. Env.a
1831 1832 1848 1850 1854
1839 1840 1851 1844 1842
1835 1843 1838
Air Air Air PWR PWR
Air Air PWR PWR Hi nO
Air PWR Hi nO
nob (ppb)
5 2
4 2
820
2 870
Conduc-pH tivity c
at RT {l.tS/cm)
6.5 6.5
6.5 6.5 6.1
6.5 6.5
17.241 18.692
18.182 18.182 0.063
18.182 0.061
ECP ECP Pt mV Steel mV (SHE) (SHE)
-691 -695
-696 -667
271
-568 261
-689 -691
-695 -680
145
-576 113
Ten. Rate (%/s)
Comp. Rate (%/s)
4.0E-1 4.0E-1 4.0E-3 4.0E-1 4.0E-1 4.0E-1 4.0E-3 4.0E-1 4.0E-2 4.0E-1
4.0E-1 4.0E-1 4.0E-3 4.0E-1 4.0E-1 4.0E-1 4.0E-3 4.0E-1 4.0E-3 4.0E-1
4.0E-3 4.0E-1 4.0E-3 4.0E-1 4.0E-3 4.0E-1
apwR = simulated PWR water that contained 2 ppm lithium and 1000 ppm boron. bno and ECPs measured in effluent. cconductivity of water measured in feedwater supply tank.
Stress Range (MPa)
429.7 534.0 440.7 419.5 448.4
474.2 534.8 482.1 527.7 508.5
631.2 625.3 636.1
Strain Range
(%)
0.76 0.76 0.76 0.76 0.75
0.76 0.75 0.75 0.72 0.75
0.76 0.80 0.78
Life Nzs
(Cycles) 24.500 14.410 61.680 42.180
>625.860 >316.000
11.500 5.800 2.850 2.420 1.560 1.415
25.900 6.900
>89.860 >165.300
10.800 3.650
>7.310
Life Nzs
(Cycles)
26.500 9.050
17.900 10.700 4.720
15.290 19.800 6.420 2.180 1.375
7.200 1.464 1.320
OAGI0000629 00021
3 Overview of Fatigue S-N Data
The relevant fatigue S-N data for austenitic SSs in air include the data compiled by Jaske and O'Donnell36 for developing fatigue design criteria for pressure vessel alloys, the JNUFAD* data base from Japan, and the results of Conway et al. 37 and Keller. 38 In water, the existing fatigue S-N data include the tests performed by General Electric Co. (GE) in a test loop at the Dresden 1 reactor,39 the JNUFAD data base, studies at Mitshubishi Heavy Industries, Ltd., (MHI),21-24 Ishikawajima-Harima Heavy Industries Co., (IHI),25 and Hitachi26,27 in Japan, and the present work at ANL.28-31 The data base for austenitic SSs is composed of 500 tests in air (240 tests on 26 heats of Type 304 SS, 170 tests on 15 heats of Type 316 SS, and 90 tests on 4 heats of Type 316 NG) and 290 tests in water (135 tests on 9 heats of Type 304 SS, 55 tests on 3 heats of Type 316 SS, and 100 tests on 4 heats of Type 316NG). Nearly 60% of the tests in air were conducted at room temperature, 20% at 250-325°C, and 20% at 350-450°C. Nearly 90% of the tests in water were conducted at temperatures between 260 and 325oC; the remainder were at lower temperatures. The data on Type 316NG in water have been obtained primarily at DO levels ~0.2 ppm and those on Type 316 SS, at ::::;0.005 ppm DO; half of the tests on Type 304 SS are at low-DO and the remaining at high-DO levels.
3.1 Air Environment
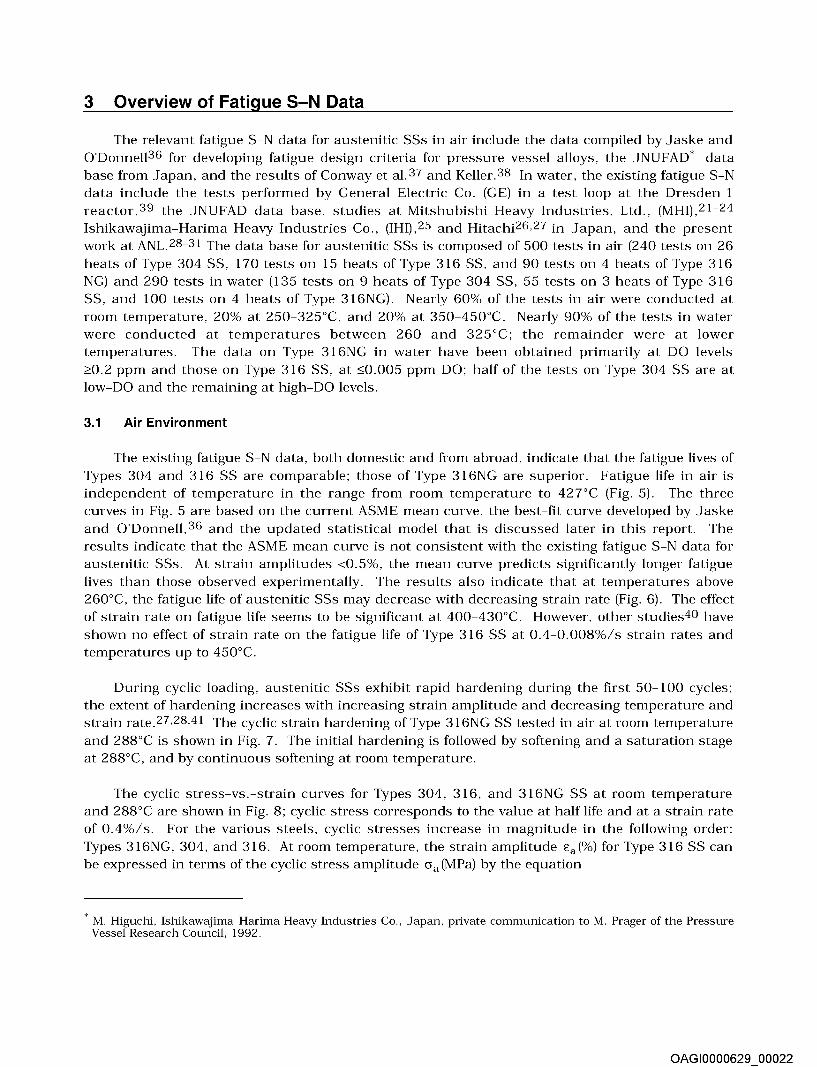
The existing fatigue S-N data, both domestic and from abroad, indicate that the fatigue lives of Types 304 and 316 SS are comparable; those of Type 316NG are superior. Fatigue life in air is independent of temperature in the range from room temperature to 427"C (Fig. 5). The three curves in Fig. 5 are based on the current ASME mean curve, the best-fit curve developed by Jaske and O'Donnell, 36 and the updated statistical model that is discussed later in this report. The results indicate that the ASME mean curve is not consistent with the existing fatigue S-N data for austenitic SSs. At strain amplitudes <0.5%, the mean curve predicts significantly longer fatigue lives than those observed experimentally. The results also indicate that at temperatures above 260°C, the fatigue life of austenitic SSs may decrease with decreasing strain rate (Fig. 6). The effect of strain rate on fatigue life seems to be significant at 400-430°C. However, other studies40 have shown no effect of strain rate on the fatigue life of Type 316 SS at 0.4-0.008%/s strain rates and temperatures up to 450°C.
During cyclic loading, austenitic SSs exhibit rapid hardening during the first 50-100 cycles; the extent of hardening increases with increasing strain amplitude and decreasing temperature and strain rate.27,28,41 The cyclic strain hardening of Type 316NG SS tested in air at room temperature and 288oC is shown in Fig. 7. The initial hardening is followed by softening and a saturation stage at 288°C, and by continuous softening at room temperature.
The cyclic stress-vs.-strain curves for Types 304, 316, and 316NG SS at room temperature and 288oC are shown in Fig. 8; cyclic stress corresponds to the value at half life and at a strain rate of 0.4%/s. For the various steels, cyclic stresses increase in magnitude in the following order: Types 316NG, 304, and 316. At room temperature, the strain amplitude Ea(%) for Type 316 SS can be expressed in terms of the cyclic stress amplitude Cia (MPa) by the equation
* M. Higuchi, Ishikawajima-Harima Heavy Industries Co., Japan, private communication toM. Prager of the Pressure Vessel Research Council, 1992.
OAGI0000629 00022
~ ~
"' w 1.0 a) "0
.€ 0.. E <(
c -~
U3
~ ~
"' w a) "0
.€ 0.. E <(
c -~
U3
0.1
Type 304 SS
0 RT
+ 100°C D 260°C 6 288°C X 300°C 0 325°C - 427-430° v
104 105 106
Fatigue Life (Cycles)
0.1 - Jaske & O'Donnell
104 105 106
Fatigue Life (Cycles)
1 o-4 1 o-3 1 o-2 1 o-1
Strain Rate (%/s)
Type 316 SS
0 RT 6 290°C 0 325°C D 400°C
D v 427-430°0 X 456°C
--- Statistical Model - Jaske & O'Donnell
------- ASME Mean Curve
1~ 1~ 1~ 1~ Fatigue Life (Cycles)
Figure 5. Fatigue S-N behavior for Types 304, 316, and 316NG austenitic SSs in air at various temperatures
Figure 6. Effect of strain rate on fatigue lives of austenitic SSs in air for various strain ranges
OAGI0000629 00023

co 0... 600 6 t)
~ 500 Q) Ol c £. 400 (f) (f) Q) .....
U5 300
D
0
Strain Range (%) 0
" 1.0 D
0 0.75 D
D 0.50 0
1'. 0.35 0 0.27
2oo~~~~~~~~=-~~~~~~~~~
1 o0 102 103 104 105
Number of Cycles
"I "I "I "I ""I "I
288°C Strain Range (%)
Strain Rate (%/s) 0 0.75
f- Open Symbols: 0.5 Closed Symbols: 0.005
0 1'. 0.50 -
-
-
-
102 103 104
Number of Cycles
Figure 7. Effect of strain range on cyclic strain-hardening behavior of Type 316NG SS in air at room temperature and 288oC
600
til 11.. 500 ~
"' 400 tl
ai "0
-~ 300
c.. E <( 200 (f) (f)
~ 100 U5
0 0.0
til 11.. 500 ~
o"' 40 o ai "0 -~ 300 c.. E <( 200 (f) (f)
~ 100 U5
0 0.0
Type 316 SS Type 304 SS
0
0 25°C !i 288-430°C
00 -~
0 0 0 0 0
£a= (a a11950)+(a a/503.2)2.1
RT 288-430°C
0.5 1.0 1 .5 0.0 0.5 1.0 1 .5
Strain Amplitude, Ea (%)
Type 316NG
£a= (a a11950)+(a a/44 7.0)2.5
£a= (a a11760)+(a a/330. 1 )3.24 0 RT 6 288°C
0.5 1.0 1 .5
Strain Amplitude, Ea (%)
Strain Amplitude, Ea (%)
Figure 8. Cyclic stress-strain curves for Types 316NG, 304, and 316 SSs in air at room temperature and 288oC
(4a)
OAGI0000629 00024

for Type 304 SS, by
(4b)
and for Type 316NG, by
(4c)
At 288-4 30oC, the cyclic stress-vs. -strain curve for Type 316 SS can be expressed by
(4d)
for Type 304 SS, by
(4e)
and for Type 316NG, by
(4f)
3.2 LWR Environments
The fatigue S-N data indicate a significant decrease in fatigue life in LWR environments (Fig. 9). The reduction in life depends on strain rate, DO level in water, and temperature.21-31 Also, environmental effects on fatigue life are comparable for all steels. To define the threshold values, the effects of various parameters on fatigue life are discussed below in greater detail.
"' w a) "0
. .e 0.. E <(
c -~
U3 0. 1
ASME Code Design Curve
..... ~"
/"; ... ~."
Strain Rate (%/s)
0 0.5 /"; 0.05 0 0.005
~" ~-" -----
/-0 ASME Code Design Curve
Best-Fit Air
0
~
Strain Rate (%/s)
0 OA D 0"04 /"; 0"01 0 0"004 v 0"0004 X 0"00009
Fatigue Life (Cycles) Fatigue Life (Cycles)
Figure 9. Fatigue strain amplitude-vs.-life data for Types 316NG and 304 SS in water at 288oC
OAGI0000629 00025

288'C; DO,; 0.005 ppm ://:: =~ Open Symbols: Type 304 Closed Symbols: Type 316NG ~
~~
Strain Rate (%/s)
Strain Amplitude (%)
v 0.6 /', 0.5 0 X
Strain Rate (%/s)
3.2.1 Strain Rate
325'C; DO,; 0.005 ppm Open Symbols: Type 304 Closed Symbols: Type 316
Figure 10. Dependence of fatigue life of austenitic SSs on strain rate in low- and high-DO water
A slow strain rate applied during the tensile-loading cycle (i.e., up-ramp with increasing strain) is primarily responsible for environmentally assisted reduction in fatigue life. Slow rates applied during both tensile- and compressive-loading cycles (i.e., up- and down-ramps) do not cause further decrease in fatigue life.29-31 The fatigue lives of austenitic SSs in low- and high-DO water are plotted as a function of tensile strain rate in Fig. 10. At both low- and high-DO levels, fatigue lives decrease with decreasing strain rate. The effect of strain rate is greater in a low-DO PWR environment than in high-DO water. In a simulated PWR environment, a decrease in strain rate from 0.4 to 0.0004%/s decreases fatigue life by a factor of z10. The results indicate that the strain rate below which effects of strain rate on fatigue life saturate may depend on both steel type and DO level. In low-DO PWR environments, saturation strain rate appears to be at ""0.0004%/s for Type 304 SS and somewhat higher for Type 316 SS (best estimate of ""0.004%/s). Limited data suggest that the saturation strain rate is also higher in high- than in low-DO water.
3.2.2 Strain Amplitude
Nearly all of the existing fatigue S-N data have been obtained under loading histories with constant strain rate, temperature, and strain amplitude. Actual loading histories encountered
OAGI0000629 00026

0.004
CD' u 0.003 >- 0 -'2 ::::-..'!' ::::i 0 Ql
0.002 :::J Ol
"-§ LL Ql
~ Ql 0.001 > E
0.000 0.0 0.2
d Threshold Strain= 0.36%
0
0
0
0.4 0.6 0.8
L'.lJast I!'.£
1.0 1.2
Figure 11 . Results of strain rate change tests on Type 316 SS in low-DO water at 325oC
during service of nuclear power plants are far more complex. Exploratory fatigue tests have been conducted with waveforms in which the slow strain rate is applied during only a fraction of the tensile loading cycle.24 The results indicate that a minimum threshold strain is required to produce an environmentally assisted decrease in fatigue life of these steels. Figure 11 shows that, for a heat of Type 316 SS, the threshold strain in low-DO water at 325oC is ""0.36%. During each cycle, relative damage due to slow strain rate is the same once the strain amplitude exceeds the threshold value.
Fatigue data from the present study indicate a threshold strain range of ""0.32% for the ANL heat of Type 304 SS. For example, the test at 0.15% strain amplitude and 0.01 %/s strain rate (as shown by a runoff triangle symbol in Fig. 9), failed after an additional 41,240 cycles when the strain amplitude was increased to 0.16%. Another test at 0.16% strain amplitude failed after an additional 50,700 cycles at 0.17% strain amplitude. The threshold strain most likely corresponds to rupture strain of the passive oxide film. These results are similar to those observed for carbon and low-alloy steels.16-20
3.2.3 Dissolved Oxygen
The results also indicate that environmental effects on the fatigue life of austenitic SSs differ from those on carbon and low-alloy steels; they are more pronounced in low-DO than in high-DO water.18,19 At a strain rate of0.004%/s, the reduction in fatigue life of Type 316NG (Fig. 10) is greater by a factor of z2 in a simulated PWR environment (<0.01 ppm DO) than in high-DO water (~0.2 ppm DO). For carbon and low-alloy steels, environmental effects on fatigue life increase with increasing DO content above a minimum threshold value of 0.05 ppm; only a modest decrease in life is observed at DO levels <0.05 ppm.11-13,16-20
Existing data are inadequate to establish the functional form for the dependence of fatigue life of austenitic SSs on DO level. Recent test results indicate that the fatigue lives of austenitic SSs may depend on the conductivity of the water rather than on the DO content, e.g., fatigue life is longer at lower conductivity (<0.1!15/cm). In the existing fatigue S-N data base, most of the tests in high-DO water have been performed at conductivities up to 0.2 11Sicm. Recent tests in high-DO water with conductivities <0.08 11Sicm show only a modest effect of environment on the fatigue lives of these steels. Tests are in progress to establish the effects of water chemistry on the fatigue lives of austenitic SSs.
OAGI0000629 00027
gr 1 o4 -
~ s
! I ! !
' • • . 6 ............ ·············:.··· L
Q) • • •
s ~ : !
~ . . .
I I
0
- 3 . . . ~ 1 0 - Aus enitic SSs ·i -
0
Ea = 0.3%, DO :0: 0.005 ppm •
Open Symbols: Type 304 Close? Symbol
1
s: Type ~16 I
0 L
0
0.4%/s 0.01%/s ,;0.004%/s
I I
50 1 00 150 200 250 300 350 0
Temperature (0 C)
I I I
Austenitic SSs Ea = 0.6%, DO :0: 0.005 ppm
Open Symbols: Type 304
I
0 !
0.4%/s 0.01%/s
··closed Symbols: Type 316 & 316NG. ·························
• :. ~
• 8 ........................... ~.
I I I
• • o e
50 1 00 150 200 250 300 350
Temperature (0 C)
Figure 12. Change in fatigue lives of austenitic SSs in low-DO water with temperature
3.2.4 Temperature
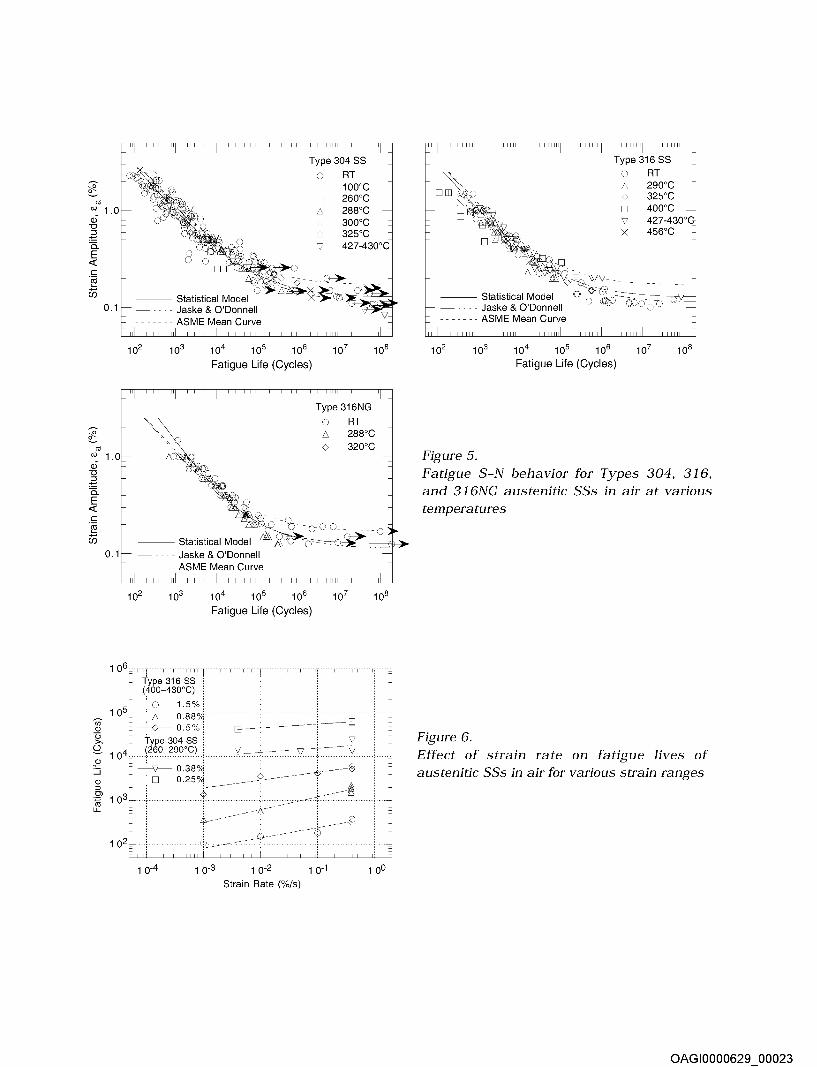
The existing fatigue S-N data are inadequate to establish the functional form for the dependence of life on temperature. Limited data indicate that environmental effects on the fatigue lives of austenitic SSs are significant at temperatures above 2500C and are minimal at temperatures ::o;2000C (Fig. 12). At 250-330°C, fatigue life appears to be relatively insensitive to changes in temperature.
As discussed in the previous section, actual loading histories encountered during service in nuclear power plants involve variable loading and environmental conditions, whereas the existing fatigue S-N data have been obtained under loading histories with constant strain rate, temperature, and strain amplitude. Fatigue tests have been conducted at MHI Japan on Type 316 SS under combined mechanical and thermal cycling. 24 Triangular waveforms were used for both strain and temperature cycling. Two sequences were selected for temperature cycling (Fig. 13): an in-phase sequence, in which temperature cycling was synchronized with mechanical strain cycling; and a sequence in which temperature and strain were out of phase, i.e., maximum temperature occurred at minimum strain level and vice-versa. Two temperature ranges, 100-325oC and 200-325°C, were selected for the tests.
0.6 High High
~ ~ :::J
,.-.. :::J
"§ -:!2. "§ ~ Q) c Q)
c.. "ffi c.. E OJ E Q) Q)
I- I-
Low Low -0.6 Out of Phase
Figure 13. Waveforms for change in temperature during exploratory fatigue tests
OAGI0000629 00028
en Q)
C3 >-~ 2 1 o3
:.::::i Q) :::J Ol
10 LL
1 o2
0
0 0
Temperature (Strain Rate, %/s) o Constant (0.01) "' In phase (0.002) _. Out of phase (0.002)
Type 316 SS 325°C
Ea = 0.6%
DO= <0.005 ppm Strain Rate 0.002%/s
o cr
50 100 150 200 250 300 350
Temperature (0 C}
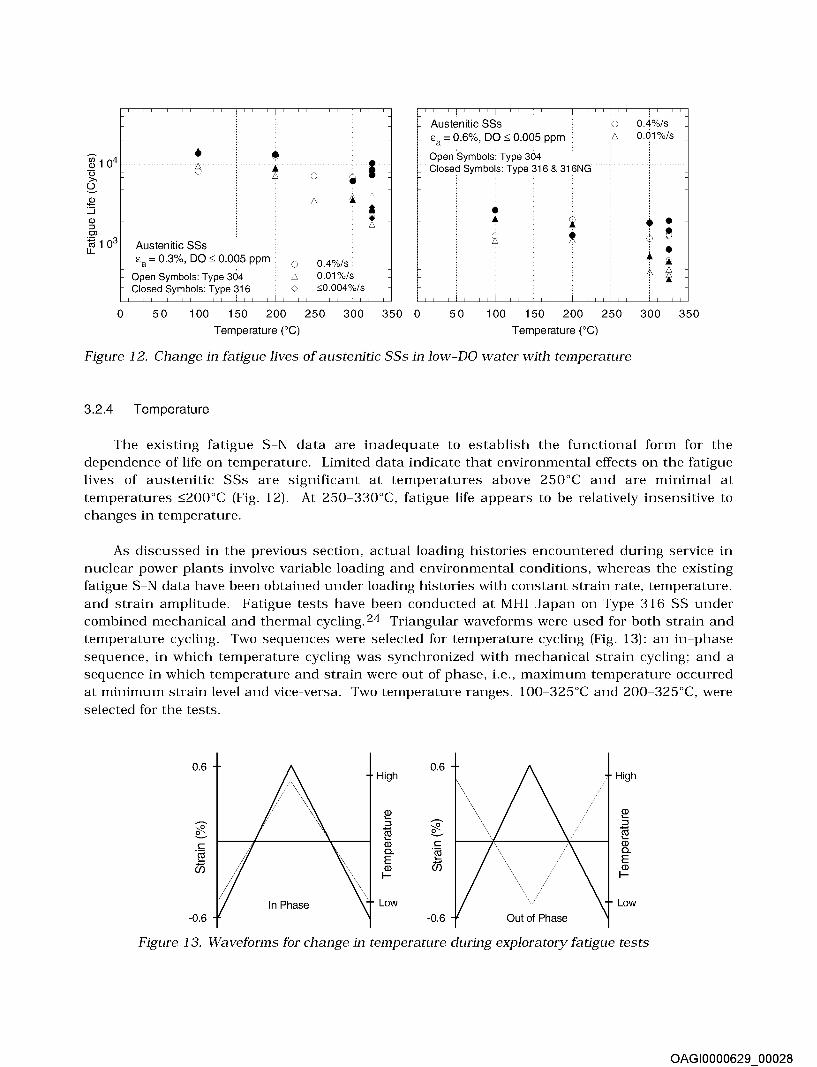
Figure 14. Fatigue life of Type 316 SS under varying temperature, indicated by horizontal bars
The results are shown in Fig. 14, with the data obtained from tests at constant temperature. If we consider that the tensile-load cycle is primarily responsible for environmentally assisted reduction in fatigue life and that the applied strain and temperature must be above a minimum threshold value for environmental effects to occur, then, life should be longer for out-of-phase tests than for in-phase tests, because applied strains above the threshold strain occur at temperatures above 200oC for in-phase tests, whereas they occur at temperatures below 200oC for out-of-phase tests. An average temperature is used in Fig. 14 for the thermal cycling tests, i.e., the average of the temperature at peak strain and the temperature at threshold strain or 200oC (whichever is higher). The results from thermal cycling tests agree well with those from constant-temperature tests. The data suggest a linear decrease in life at temperatures above 200°C. Fatigue tests are in progress at 200-3200C to establish the temperature dependence of fatigue life in LWR environments.
3.3 Cast Stainless Steels
Available fatigue S-N data23,31 indicate that in air, the fatigue lives of cast CF-8 and CF-SM SSs are similar to that of wrought austenitic SSs (Fig. 15). It is well known that the Charpy impact and fracture toughness properties of cast SSs are decreased significantly after thermal aging at temperatures between 300 and 450°C. 42,43 The cyclic-hardening behavior of cast SSs is also influenced by thermal aging (Fig. 16). At 288°C, cyclic stresses of steels aged for 10,000 hat 400oC are higher than those for unaged material or wrought SSs. Also, strain rate effects on cyclic stress are greater for aged than for unaged steel, i.e., cyclic stresses increase significantly with decreasing strain rate. However, existing data are inadequate to establish unequivocally the effect of thermal aging on the fatigue life of these steels. For example, thermal aging for 25,200 h at 465oC exerted no effect on the fatigue life of a CF-SM steel in air at 325°C,24 whereas, in the present study, aging for 10,000 h at 4000C decreased the fatigue life of Heat 7 4 at 288°C, particularly in water (discussed later in this section). These differences are most likely caused by microstructural differences that arise from thermal aging temperature. Aging at 400oC results in spinodal decomposition of the ferrite to form Cr-rich regions that very effectively increase tensile strength, whereas, aging at 465oC for extended periods results in the formation of Cr-rich a' particles and over-aging.
OAGI0000629 00029

Strain Rate: 0.4%/s (Kanasaki, MHI)
"' w Q) "0
Statistical Model Statistical Model
.€ 0.. E <( c -~
U3
(]A. RT Air
ib·. / o/1,· t·
ffi~· · •. L ·o··.
Fatigue Life (Cycles)
Strain Rate (%/s) Open Symbols: 0.4 Closed Symbols: 0.004
• Heat 74 Unaged _. Heat 74 Aged 10,000 hat 400°C + Heat 75 Aged 10,000 hat 400°C
Fatigue Life (Cycles)
Figure 15. Fatigue strain amplitude-vs.-life data for CF-SM cast SSs in air
~ 500 Ol c co a: (f) (f)
E: U3
200 0 10
o oo o o Oo
Number of Cycles Number of Cycles
RTAir
Figure 16. Effect of strain rate on cyclic-hardening behavior of wrought and cast SSs in air at 288oC
The existing fatigue S-N data23,31 for cast SSs in LWR environments indicate that the fatigue lives of cast SSs are approximately the same in both high- or low-DO water and are comparable to those observed for wrought SSs in low-DO water (Fig. 17). The results also indicate that thermal aging decreases the fatigue lives of these steels. The reduction in life in L WR environments depends on strain rate (Fig. 18). The effects of strain rate are the same in low- and high-DO water. Existing data are inadequate to establish the saturation strain rate for cast SSs. For unaged material, environmental effects on life do not appear to saturate at strain rates as low as 0.00001 %/s_23 Also, the fatigue lives of these steels are relatively insensitive to changes in ferrite content in the range of 12-28%.23
OAGI0000629 00030

Strain Rate (%/s) 0 0.4 /'; 0.04 v 0.01 0 0.004
Heat 74 Ferrite ~18% 288°C; DO <0.005 ppm
"' w Q) "0
RTAir
EE+O X... r:/4f~·~ • ./ D 0.001 Statistical Model
. .e 0.. E <(
c -~
U3 0. 1
tiJ •• •
,. ... 0 •. ,. ~ CF-8M Cast SS (FN 19.7) 325°C; DO <0.005 ppm (Kanasaki, MHI)
Fatigue Life (Cycles)
X 0.0004 0 0.0001 + 0.00004 EE 0.00001
• Strain Rate (%/s)
0 0.4 /'; 0.004
Open Symbols: Unaged Closed Symbols: Aged 10,000 hat 400°C
Fatigue Life (Cycles)
Figure 17. Fatigue strain amplitude-vs.-life data for CF-SM cast SSs in water
CF-8M Cast SS (FN 19.7) 325°C; DO 0.005 ppm ~ Strain Amplitude(%) ~::::::::: 2
0 0.6 /'; 0.3 /'; 0 0.25
Open Symbols: Aged 25,200 h at 465°C Closed Symbols: Unaged
• 0
1 o-4 1 o-2 1 o-1
Heat 74 Ferrite ~18%
Open Symbols: DO< 0.005 ppm Closed Symbols: DO~ 0.85 ppm
74 Unaged
1 o0 1 o-6
74 Aged 10,000 hat 400°C 75 Aged 10,000 hat 400°C
1 o-4 1 o-2
Strain Rate (%/s) Strain Rate (%/s)
RTAir
1 o-1
Figure 18. Dependence of fatigue lives of CF-SM cast SSs on strain rate in low-DO water at various strain amplitudes
4 Mechanism of Fatigue Crack Initiation
4.1 Formation of Engineering Cracks
The formation of surface cracks and their growth to an "engineering" size (3 mm deep) constitute the fatigue life of a material, which is represented by the fatigue S-N curves. Fatigue life has conventionally been divided into two stages: initiation, expressed as the cycles required to form microcracks on the surface; and propagation, expressed as cycles required to propagate the surface cracks to engineering size. During cyclic straining, microcracks form at surface irregularities/ discontinuities either already in existence or produced by slip bands, grain boundaries, second-phase particles, etc. Once a microcrack forms, it continues to grow along its slip plane as a Mode II (shear) crack in Stage I growth (orientation of the crack is usually at 45o to
the stress axis). At low strain amplitudes, a Stage I crack may extend across several grain diameters before the increasing stress intensity of the crack promotes slip on systems other than the primary slip. A dislocation cell structure normally forms at the crack
OAGI0000629 00031

A
0
Mechanically Small Crack (Stage II Tensile Crack)
~.--·-
/· .::-- B
Microstructurally Small Crack (MSC) (Stage I Shear Crack)
0.2 0.4 0.6
Life Fraction
0.8
Figure 19. Growth of cracks in smooth fatigue specimens
tip. Because slip is no longer confined to planes at 45o to the stress axis, the crack begins to propagate as a Mode I (tensile) crack, normal to the stress axis in Stage II growth. At high strain amplitudes, the stress intensity is quite large and the crack propagates entirely by the Stage II process. Stage II crack propagation continues until the crack reaches engineering size (z3 mm deep). In air or mildly corrosive environments, Stage II cracking is characterized by fatigue striations.
An alternative approach considers fatigue life to be entirely composed of the growth of short surface cracks. 44 In polycrystalline materials, the period for the formation of surface cracks is negligible, Fig. 19. However, the growth rates of short cracks cannot be predicted accurately from fracture mechanics methodology on the basis of the range of the stress intensity factor (AK). Under cyclic loading and the same AK, short fatigue cracks (i.e., with lengths comparable to the unit size of the microstructure) grow at a faster rate than long fatigue cracks. 45 Also, short cracks can grow at AK values below those predicted from linear elastic fracture mechanics (LEFM). The differences between the growth rates of short and long cracks have been attributed to interactions among microstructural features, contributions of crack closure with increasing crack length, effects of mixed-mode crack propagation, and an inadequate characterization of the crack tip stress/strain fields associated with short cracks.
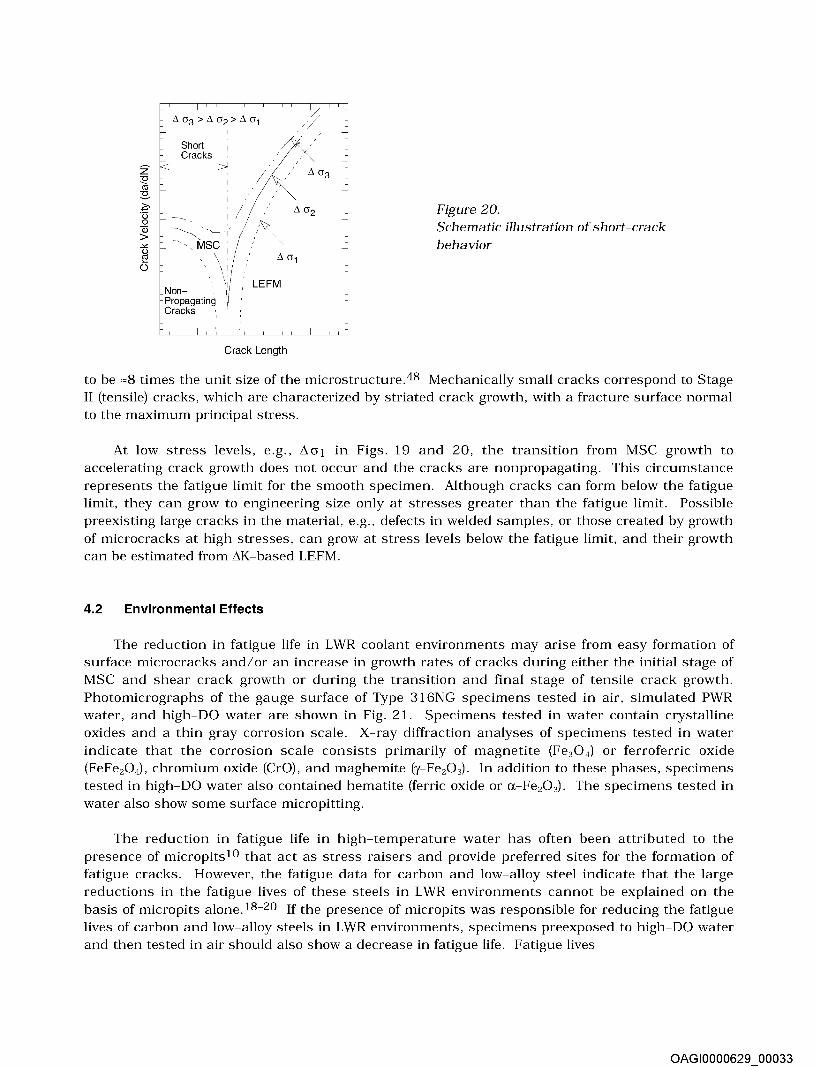
Recent studies indicate that during fatigue loading of smooth test specimens, surface cracks 10 11m or longer form quite early, i.e., < 10% of life, even at low strain amplitudes.46,47 Growth of these surface cracks may be divided into three regimes: (a) initial period that involves growth of microstructurally small cracks (MSCs) below a critical length, characterized by decelerating crack growth rate, seen in region AB of Fig. 19; (b) final period of growth, characterized by accelerating crack growth rate, region CD; and (c) a transition period controlled by a combination of the two regimes, region BC. The crack growth rates as a function of crack length during the three regimes of fatigue life are shown in Fig. 20.
The growth of MSCs is very sensitive to microstructure.46,48 The MSCs correspond to Stage I cracks and grow along slip planes as shear cracks in the early stage of growth. Microstructural effects on MSCs are strong because of Stage I growth, i.e., crystallographic growth. Fatigue cracks greater than the critical length of MSCs show little or no influence of microstructure and are termed mechanically small cracks. For a stress ratio of -1, the transition from an MSC to a mechanically small crack for several materials has been estimated
OAGI0000629 00032
z ~ 2-~ Ti 0 Qi > -" ()
~ ()
L1. (J3 > L1. (J2 > L1. (J1
Short /) Cracks
I L1. (J3
I L1. (J2
----- ,/, ~-"'----1
---, MSC
\ L1. (J 1 \I
Non-LEFM
Propagating Cracks
Crack Length
Figure 20. Schematic illustration of short-crack behavior
to be z8 times the unit size of the microstructure.48 Mechanically small cracks correspond to Stage II (tensile) cracks, which are characterized by striated crack growth, with a fracture surface normal to the maximum principal stress.
At low stress levels, e.g., Acr1 in Figs. 19 and 20, the transition from MSC growth to accelerating crack growth does not occur and the cracks are nonpropagating. This circumstance represents the fatigue limit for the smooth specimen. Although cracks can form below the fatigue limit, they can grow to engineering size only at stresses greater than the fatigue limit. Possible preexisting large cracks in the material, e.g., defects in welded samples, or those created by growth of microcracks at high stresses, can grow at stress levels below the fatigue limit, and their growth can be estimated from AK-based LEFM.
4.2 Environmental Effects
The reduction in fatigue life in LWR coolant environments may arise from easy formation of surface microcracks and/ or an increase in growth rates of cracks during either the initial stage of MSC and shear crack growth or during the transition and final stage of tensile crack growth. Photomicrographs of the gauge surface of Type 316NG specimens tested in air, simulated PWR water, and high-DO water are shown in Fig. 21. Specimens tested in water contain crystalline oxides and a thin gray corrosion scale. X-ray diffraction analyses of specimens tested in water indicate that the corrosion scale consists primarily of magnetite (Fe3 0 4 ) or ferroferric oxide (FeFe20 4), chromium oxide (CrO), and maghemite (y-Fe20 3). In addition to these phases, specimens tested in high-DO water also contained hematite (ferric oxide or a-Fe20 3). The specimens tested in
water also show some surface micropitting.
The reduction in fatigue life in high-temperature water has often been attributed to the presence of micropitslO that act as stress raisers and provide preferred sites for the formation of fatigue cracks. However, the fatigue data for carbon and low-alloy steel indicate that the large reductions in the fatigue lives of these steels in L WR environments cannot be explained on the basis of micropits alone.18-20 If the presence of micropits was responsible for reducing the fatigue lives of carbon and low-alloy steels in LWR environments, specimens preexposed to high-DO water and then tested in air should also show a decrease in fatigue life. Fatigue lives
OAGI0000629 00033
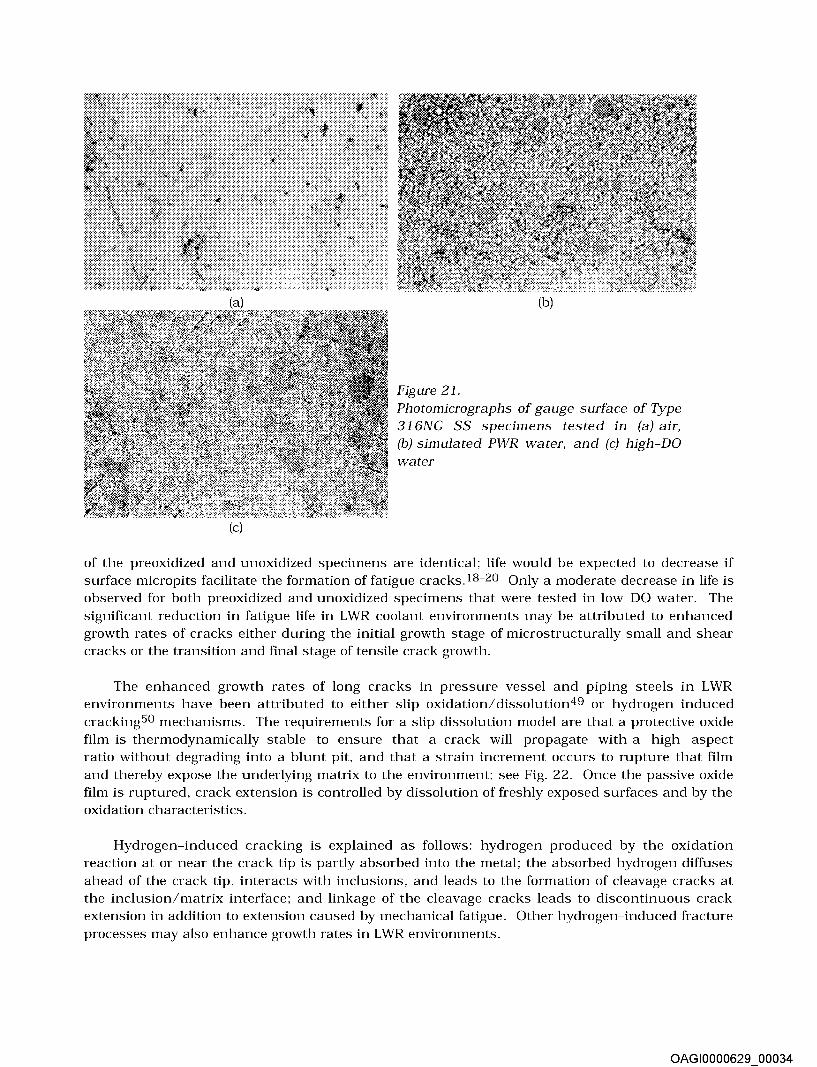
(c)
Figure 21. Photomicrographs of gauge surface of Type 316NG SS specimens tested in (a) air, (b) simulated PWR water, and (c) high-DO
of the preoxidized and unoxidized specimens are identical; life would be expected to decrease if surface micropits facilitate the formation of fatigue cracks.IS-20 Only a moderate decrease in life is observed for both preoxidized and unoxidized specimens that were tested in low-DO water. The significant reduction in fatigue life in LWR coolant environments may be attributed to enhanced growth rates of cracks either during the initial growth stage of microstructurally small and shear cracks or the transition and final stage of tensile crack growth.
The enhanced growth rates of long cracks in pressure vessel and p1pmg steels in L WR environments have been attributed to either slip oxidation/dissolution49 or hydrogen-induced crackingSO mechanisms. The requirements for a slip dissolution model are that a protective oxide film is thermodynamically stable to ensure that a crack will propagate with a high aspect ratio without degrading into a blunt pit, and that a strain increment occurs to rupture that film and thereby expose the underlying matrix to the environment; see Fig. 22. Once the passive oxide film is ruptured, crack extension is controlled by dissolution of freshly exposed surfaces and by the oxidation characteristics.
Hydrogen-induced cracking is explained as follows: hydrogen produced by the oxidation reaction at or near the crack tip is partly absorbed into the metal; the absorbed hydrogen diffuses ahead of the crack tip, interacts with inclusions, and leads to the formation of cleavage cracks at the inclusion/matrix interface; and linkage of the cleavage cracks leads to discontinuous crack extension in addition to extension caused by mechanical fatigue. Other hydrogen-induced fracture processes may also enhance growth rates in LWR environments.
OAGI0000629 00034

r Crack Tip Opening
Displacement
l
t Load
Crack Propagation Direction Direction
~
Cathodic R/action , Slip Step
Film Rupture
,,/
--/
MnS Inclusions
/
Figure 22. Schematic illustration of film rupture/ slip dissolution process
For example, significant accumulation of hydrogen at or near the crack tip decreases the cohesive interatomic strength of the lattice. Thus, hydrogen-induced bond rupture ahead of the crack tip links up with the main crack, producing discontinuous but enhanced crack growth. The hydrogen adsorption mechanism states that adsorbed hydrogen lowers the surface energy of the metal and thus facilitates crack growth at a lower fracture stress level. Also, hydrogen can cause localized crack tip plasticity by reducing the stress required for dislocation motion.
Both mechanisms depend on the rates of oxide rupture, passivation, and liquid diffusion. Therefore, it is often difficult to differentiate between the two processes or to establish their relative contribution to crack growth in LWR environments. Studies on crack initiation in smooth fatigue specimens indicate that the decrease in fatigue lives of carbon and low-alloy steels in L WR environments is caused primarily by the effects of environment on the growth of cracks that are < 100 11m deep.lS-20,4 7 For cracks < 100 11m deep, the growth rates are nearly two orders of magnitude higher in high-DO water than in air. For cracks > 100 11m deep. the growth rates are one order of magnitude higher in high-DO water than in air. In LWR environments, crack initiation in carbon and low-alloy steels may be explained as follows: (a) surface microcracks form quite early in fatigue life; (b) during cyclic loading, the protective oxide film is ruptured at strains greater than the fracture strain of surface oxides, and the microcracks grow by anodic dissolution of the freshly exposed surface to crack depths greater than the critical length of MSCs; and (c) a final period of growth that can be predicted from fracture mechanics methodology and is characterized by accelerating growth rates.
For austenitic SSs, lower fatigue lives in low-DO water than in high-DO water are difficult to reconcile in terms of the slip oxidation/ dissolution mechanism. In general, crack growth rates increase with increasing DO in the water. It may be argued that the lower lives in low-DO water are due to a lower rupture strain for surface oxides in low-DO than in high-DO water. As discussed above, oxide rupture strain in low-DO water may be in the range of 0.32-0.36%. The rupture strain in high-DO water must be significantly higher than this value to produce the observed difference of a factor of z2 in fatigue life. Metallographic examinations of the test specimens indicate that environmentally assisted reduction in fatigue lives of austenitic SSs is most likely caused by hydrogen-induced cracking.29-31 Figure 23 shows photomicrographs of fracture surfaces of Type 304 and 316NG, after chemical cleaning and at
Type 304 SS Type 316NG SS
OAGI0000629 00035
Air
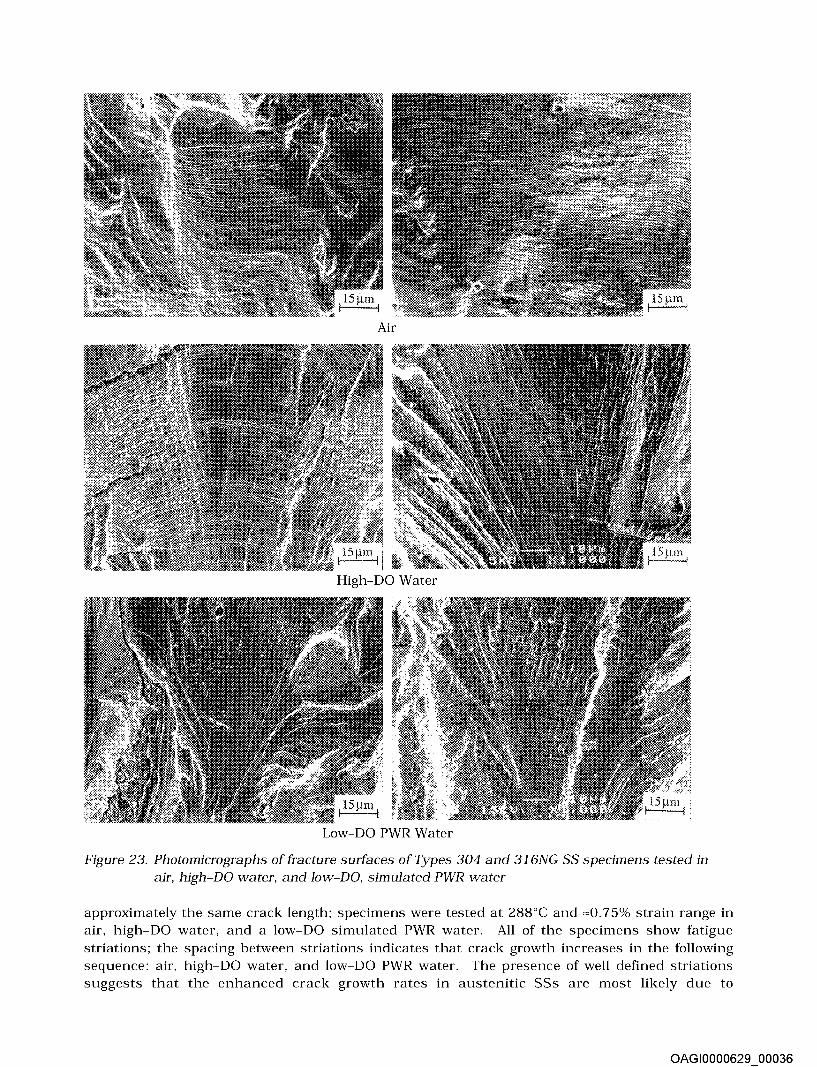
Figure 23. Photomicrographs of fracture surfaces of Types 304 and 316NG SS specimens tested in air, high-DO water, and low-DO, simulated PWR water
approximately the same crack length; specimens were tested at 288oC and zQ. 75% strain range in air, high-DO water, and a low-DO simulated PWR water. All of the specimens show fatigue striations; the spacing between striations indicates that crack growth increases in the following sequence: air, high-DO water, and low-DO PWR water. The presence of well defined striations suggests that the enhanced crack growth rates in austenitic SSs are most likely due to
OAGI0000629 00036
hydrogen-induced cracking. Fatigue striations should not be observed if enhancement of crack growth is caused by the slip oxidation/ dissolution process.
5 Statistical Model
The fatigue S-N curves are generally expressed in terms of the Langer equation, 6 which may be used to represent either strain amplitude in terms of life or life in terms of strain amplitude. The parameters of the equation are commonly established through least-squares curve-fitting of the data to minimize the sum of the square of the residual errors for either fatigue life or strain amplitude. A predictive model based on least-squares fit on life is biased for low strain amplitude. The model leads to probability curves that converge to a single value of strain, and fails to address the fact that at low strain values, most of the error in life is due to uncertainty associated with either measurement of strain or variation in fatigue limit caused by material variability. On the other hand, a least-squares fit on strain does not work well for higher strain amplitudes. Statistical models have been developed at ANL33,34 by combining the two approaches and minimizing the sum of the squared Cartesian distances from the data point to the predicted curve; the models were later updated with a larger fatigue S-N data base.31 The functional forms and transformation for the different variables were based on experimental observations and data trends.
In air, the model assumes that fatigue life is independent of temperature and that strain rate effects occur at temperatures >2500C. It is also assumed that the effect of strain rate on life depends on temperature. One data set, obtained on Type 316 SS in room-temperature air, was excluded from the analysis. The tests in this data set were conducted in load-control mode at stress levels in the range of 190-230 MPa. The strain amplitudes were calculated only as elastic strains, i.e., strain amplitudes of 0.1-0.12% (the data are shown as circles in Fig. 5, with fatigue lives of 4 x 1 os to 3 x 10 7). Based on cyclic stress vs. strain correlations for Type 316 SS (Eqs. 4a-4f), actual strain amplitudes for these tests should be 0.23-0.32%. In air, the fatigue life N of Types 304 and 316 SS is expressed as
ln(N) = 6.703- 2.030 ln(Ea- 0.126) + T* £* (Sa)
and that of Type 316NG, as
ln(N) = 7.422- 1.671ln(Ea- 0.126) + T* E*, (5b)
where Ea is the strain amplitude (%) and T* and £* are transformed temperature and strain rate, respectively, defined as follows:
T* = 0 T* = [(T- 250)/525]0.84
£* = 0 E* = ln(£/0.4) E* = ln(0.0004/0.4)
(T < 250°C) (250 :::; T < 400°C)
(£ > 0.4%/s) (0.0004:::; E:::; 0.4%/s) (£ < 0.0004%/s).
(6a)
(6b)
In LWR environments, the fatigue lives of austenitic SSs depends on strain rate, DO level, and temperature; the decrease in life is greater at low-DO levels and high temperatures. However, existing data are inadequate to establish the functional form for the dependence of fatigue life on DO level or temperature. Separate correlations have been developed for low- and high-DO levels (<
or ~ 0.05 ppm), and low and high temperatures (< or ~ 200°C). Also, a threshold strain rate of
OAGI0000629 00037
0.4%/s and saturation rate of 0.0004%/s is assumed in the model. Furthermore, for convenience in incorporating environmental effects into fatigue evaluations, the slope of the S-N curve in LWR environments was assumed to be the same as that in air although the best-fit of the experimental data in water yielded a slope for the S-N curve that differed from the slope of the curve that was obtained in air. In LWR environments, the fatigue life N of Types 304 and 316 SS is expressed as
ln(N) = 5. 768- 2.030 ln(Ea- 0.126) + T* £* 0* (7a)
and that of Type 316NG, as
ln(N) = 6.913- 1.671ln(Ea- 0.126) + T* £* 0*, (7b)
where the constants for transformed temperature, strain rate, and DO are defined as follows:
T* = 0 T* = 1
£* = 0 E* = ln(E/0.4) E* = ln(0.0004/0.4)
o* = o.26o o* = 0.112
(T < 200°C) (T ~ 200°C)
(£ > 0.4%/s) (0.0004:::; E:::; 0.4%/s) (£ < 0.0004%/s)
(DO < 0.05 ppm) (DO~ 0.05 ppm).
(Sa)
(Sb)
(Sc)
The model is recommended for predicted fatigue lives :::; 106 cycles. Recent test results indicate that for high-DO environments, conductivity of water is important for environmental effects on fatigue life of austenitic SSs. Therefore, the above correlations may be conservative for high-DO, i.e., ~0.05 ppm DO, environments. The experimental values of fatigue life in air and water and those predicted from Eqs. 5-8 are plotted in Fig. 24. The estimated fatigue S-N curves for Types 304, 316, and 316NG SSs in air and LWR environments are shown in Figs. 5 and 25, respectively. The predicted fatigue lives show good agreement with the experimental data. Note that the ASME mean curve is not consistent with the existing fatigue S-N data (Fig. 5). Also, although the best-fit of the S-N data in LWR environments (Fig. 25) yields a steeper slope, the slope of the S-N curve in water was assumed to be the same as in air.
Upon completion of the modeling phase, the residual errors (i.e., the Cartesian distance from the prediction curve) should not show significant patterns, such as heteroskedasticity (changing variance), or a nonzero slope. The residual errors for each variable, grouped by steel type and environment (air or water), are plotted in Figs. 26-30. Most data subsets and plots
OAGI0000629 00038

Ul Q)
~ 1 o6 ~ 2 1 os :.J "0
tl 1 o4
'0 Q)
D: 1 o3
101 LLu=LLu=LLWOO~WW~~~~~~~~
101 102 103104 105106 107 108109
Observed Life (Cycles)
1o2~~~~illL~~~~~~=-~~~Will
1~ 1~ 1~ 1~ 1~ 1~ 1~ 1~ Observed Life (Cycles)
Figure 24. Experimental and predicted values of fatigue lives of austenitic SSs in air and water environments
1.0 ~ !?.....
"' w Q) "0
.€ 0.. E <(
c -~
U3 0.1
'I
- 0- - - 0.004%/s -\} - ,;0.0004%/s
-
Open Symbols: 325°C Close
1
d Symbols: 300°C
Fatigue Life (Cycles)
Strain Rate (%/s)
---e-- 0.4%/s -- -A- -- 0.04%/s - 0- - 0.004%/s -\J - - ,;0.0004%/s
Type 304 SS 288°C, DO: 0.003 ppm
0
Fatigue Life (Cycles)
Type 316 SS DO: 0.005 ppm
~~.:;All Strain Rates
00 •. / ./
ell
Strain Rate (%/s) ~~ o 0.4%/s L, 0.01%/s
Open Symbols: 1 oooc Closed Symbols: 200°C
Fatigue Life (Cycles)
Strain Rate (%/s)
---e--- 0.5%/s -- - -"'- - 0.05%/s - - -{'; 0.005%/s
Fatigue Life (Cycles)
Figure 25. Experimental fatigue lives and those estimated from statistical models for austenitic SSs in water environments
OAGI0000629 00039

3 . 0 r··,:·-,--,_-.,. . .,. . .,. . .,.., . .,. . .,. . .,. . .,..r-r··r··r··r··r··r··r··r··r··r··r··r··r··r·-;--,--,--,--,1
2 o~- 0 --:
• ,of • , I ~ ~ i ~ 0.0~ () ~ ~ ~ () 8 ~j
-1 0 ~~- ~j . ~ i :. 0 Air Environment .:
-2.0 f o Type 304 -3 ~ ~ R~~ ~1~NG ~
·3. 0 LL'-'-'---'--'--'--'---'--'-....!.....!.--'--'--'---L-'---L...l....i...J...J....J...J...-'--'-.-'--'-'---'-'-'-l.....L..!
0 50 100 150 200 250 300 350 Temperature (0 C)
~-:"---:"--1--1--r-1--1--,--,--r-,--,--,--,--:-,--,---...--...-:--r--r--r--r--r--r--r--r--r--r--r--r--r--r
rr-t
1----------'"~L___________J~~i:~ j#----U---11
~ Water Environment
f-- 0 Type 304 r, __ . !', Type 316 ~ o Type 316NG
''''
0 50 100 150 200 250 300 350 Temperature (0 C)
Figure 26. Residual error for austenitic SSs as a function of test temperature
co ~
~ 2.0 r·
~ ()
1.0 ~ ro ~
()
()
()
~ 0.0!!!:~~~~
~ -1.o F-
t 0
-2.0 !.· ~~
~j _-j
!',
Air Environment
0 Type 304 ··j !', Type 316 ·j () Type 316NG
-3.0 >-.J.....L...J...~· _;_• ~·.....L...'--'-..c.....L....c.....L.....L...L....L...L...J......L...C__,__;'--'-...l......c....l......L....L..J....J
0 1 0 20 30 40 50 60 Heat Identification
f-
''~ ~@
0
r-t ~--~-f 0 1 0
Water Environment o Type 304 !', Type 316 0 Type 316NG
0 0 0
20 30 40 Heat Identification
50 60
Figure 27. Residual error for austenitic SSs as a function of material heat
3.0r·r•·r,·······r···r··r·•·•·r••rr-····-,····r··r·r·r·rrw······r··-,··•··r·ro·rrr·······r···r··r-~•-r•·e<
2.0
1.0 co ~
~ 0.0 Q)
a: -1.0
-2.0
Air Environment
o Type 304 !', Type 316 o Type 316NG
0
Strain Rate (%/s)
0
()
<>
f_?':-.-r:------,----r--r-':·':-r,-;-r------~----;---;·-r·r-.-r~r------r---~--~--;--;-':-.-rr-------;----r--r-':-':-r':
t. Water Environment
L o Type 304 t. !', Type 316 r. 0 Type 316NG 0
2
L.J..!.Jl ______ (. ___ .:. __ J_J..J..u.d ______ .,;,. ___ :. __ :._J_J_!.JJ..L ______ J ___ J.._J.._:._:.J..!.Jl ______ :. ___ .:. __ J_J..J..JJ..!.
Strain Rate (%/s)
Figure 28. Residual error for austenitic SSs as a function of loading strain rate
OAGI0000629 00040

Strain Amplitude (%)
0
0
'';
0 0 0
1 o0
Strain Amplitude (%)
Figure 29. Residual error for austenitic SSs as a function of applied strain amplitude
3.0.-,-,~~-r«>n.~.,,-,-,7norn--.,~~c-•.j
~ i 2.0 r· .-1
1.0 ~ 0
~ [ ~ O.Ot--~~------------~--~r-------a--
~ ~ -1.0 ~-
t Water Environment
-2.0 1.· o Type 304 ··j . 6 Type316 . F o Type 316NG .·j
-3.0 L.......L....l~LL''-"• "-L....l.....L.LLL' '-"' ,:_l.......J..~U.W.-c......l....l..' ~· ,_;__,• •J.l.'..........i·i
1 o·3 1 o·2 1 o·1 1 o0 1 o 1
Dissolved Oxygen (ppm)
Figure 30. Residual error for austenitic SSs as a function of dissolved oxygen in water
do not show patterns. In general, high variance tends to be associated with longer lives and lower strain amplitudes. Furthermore, biases seem to be traceable to heat-to-heat variation.
6 Design Fatigue Curves
The design fatigue curves in the current ASME Section III Code were based on experimental data on small polished test specimens. The curves were obtained by adjusting the best-fit curve for the effect of mean stress and then lowering the adjusted curve by a factor of 2 on stress or 20 on life, whichever was more conservative, at each point of the curve. The best-fit curve to the experimental data, 51 expressed in terms of strain amplitude Ea (%) and fatigue cycles N, for austenitic SSs is given by
ln[N] = 6.954 - 2.0 ln(Ea- 0.167). (9)
The mean curve, expressed in terms of stress amplitude Sa (MPa), which is the product of Ea and elastic modulus E, is given by
Sa= 58020/(N) 112 + 299.92. (10)
OAGI0000629 00041

The strain-vs.-life data were converted to stress-vs.-life curves by using the room-temperature value of 195.1 CPa (28300 ksi) for the elastic modulus. The best-fit curves were adjusted for the effect of mean stress by using the modified Goodman relationship46
(lOa)
and S~ = Sa (lOb)
where S~ is the adjusted value of stress amplitude, and cry and cru are yield and ultimate strengths of the material, respectively. The Goodman relationship assumes the maximum possible mean stress and typically gives a conservative adjustment for mean stress, at least when environmental effects are not significant. The design fatigue curves were then obtained by lowering the adjusted best-fit curve by a factor of 2 on stress or 20 on cycles, whichever was more conservative, to account for differences and uncertainties in fatigue life associated with material and loading conditions.
The same procedure has been used to develop design fatigue curves for LWR environments. However, because of the differences between the ASME mean curve and the best-fit curve to existing fatigue data (Fig. 5), the margin on strain for the current ASME Code design fatigue curve is closer to 1.5 than 2. Therefore, to be consistent with the current Code design curve, a factor of 1.5 rather than 2 was used in developing the design fatigue curves from the updated statistical models in air and LWR environments.
The design fatigue curves based on the statistical model for Types 304 and 316 SS in air and low- and high-DO water are shown in Figs. 31-33. A similar set of curves can be obtained for Type 316NG SS. Because the fatigue life of Type 316NG is superior to that of Types 304 or 316 SS, Figs. 31-33 may be used conservatively for Type 316NG SS. Also, as mentioned earlier, recent test results indicate that the conductivity of water is important for environmental effects on fatigue life of austenitic SSs in high-DO environments. Therefore, the design fatigue curves for Type 304 and 316 SS in water with ~0.05 ppm DO (Fig. 33) may be conservative.
Although, in air at low stress levels, the differences between the current ASME Code design curve and the design curve obtained from the updated statistical model at temperatures <250oC have been reduced or eliminated by reducing the margin on stress from 2 to 1.5, significant differences still exist between the two curves. For example, at stress amplitudes >300 MPa, estimates of life from the updated design curve are a factor of z2 lower than those from the ASME Code curve. Therefore, the actual margins on stress and life for the current ASME Code design fatigue curve are 1.5 and 10, respectively, instead of 2 and 20.
OAGI0000629 00042

O"u = 648.1 MPa
ASME Code Curve
-~-
-~-
(f) (f)
E? --- ,;250°C, All Strain Rates-..._ U3 or 250-350°C, 20.4%/s · .::..._~ .·
- - 290°C, ,;0.0004%/s 1 02 - 325°C, ,;0.0004%/s
Number of Cycles N
& • • ~ , <200°C, All Strain Rates
DO <0.05 ppm
"' '-~ or 2200°C, 0.4%/s
i 103
' . ,;~ ";;<. ASME Code
~ ~. ~~ '--- . . f Design Curve
<( -.....:::::: ·-~~: ~ 220ooc -.....:::::~ ~...:. .• E? Strain Rate (%/s) ..:....:.:: _.; ~
U3 - 0.04 -0.004
1 o2 - ,;0.0004 -------------L_LU~~LLUW~Llliil~~~ill_~~m_~~~
1 o1
Number of Cycles N
co • • ~ <200°C, All Strain Rate!>
~"' 1 03 '~~ ~· ... _ .... >.--~~/00°~,-0.:4o/o/S···························_ ....... ~ S•._: If''· ~ • ~ ......_:; , ' • , ~ ASME Code g. '-~.:_~ ·. -L. /Design Curve <( -...:.':::::~ : ';:; :
(f) 220ooc -"~: Cl) .-__ -.::. ~ :---~
E? Strain Rate (%/s) '---.:::: :~·=·--U3 - 0.04
-0.004
1 02 - ,;o.ooo4
Number of Cycles N
Figure 31. ASME and statistical-model design fatigue curves for Types 304 and 316 SS in air
Figure 32. ASME and statistical-model design fatigue curves for Types 304 and 316 SS in water with <0.05 ppm DO
Figure 33. ASME and statistical-model design fatigue curves for Types 304 and 316 SS in water with 20.05 ppm DO
As discussed above, the existing fatigue data indicate a threshold strain range of ""0.32%, below which environmental effects on the fatigue life of austenitic SSs either do not occur or are insignificant. This value must be adjusted for the effects of mean stress and uncertainties due to material and loading variability. Threshold strain amplitudes are decreased by ""1 0% to account for mean stress effects and by a factor of 1.5 to account for uncertainties in fatigue life associated with material and loading variability. Thus, a threshold strain amplitude of 0.097% (stress amplitude of 189 MPa) was selected, below which environmental effects on life are modest and are represented by the design curve for temperatures <200oC (shown by the solid line in Figs. 31 and 32).
OAGI0000629 00043

These curves can be used to perform ASME Code fatigue evaluations of components that are in service in LWR environments. For each set of load pairs, a partial usage factor is obtained from the appropriate design fatigue curve. Information about the service conditions, such as temperature, strain rate, and DO level, are required for the evaluations. The procedure for obtaining these parameters depends on whether the elapsed-time-vs.-temperature information for the transient is available. The maximum values of temperature and DO level and the slowest strain rate during the transient may be used for a conservative estimate of life. Note that the design curves in LWR environments not only account for environmental effects on life but also include the difference between the current Code design curve and the updated design curve in air, i.e., the difference between the solid and dashed curves in Fig. 31.
7 Fatigue Life Correction Factor
The effects of reactor coolant environments on fatigue life have also been expressed in terms of a fatigue life correction factor Fen, which is the ratio of the life in air at room temperature to that in water at the service temperature.ll ,52,53 To incorporate environmental effects into the ASME Code fatigue evaluation, a fatigue usage for a specific load pair, based on the current Code fatigue design curve, is multiplied by the correction factor. A fatigue life correction factor Fen can also be obtained from the statistical model, where
ln (Fen) = ln (Nair) - ln (N water) . (12)
From Eqs. Sa and 7a, the fatigue life correction factor relative to room-temperature air for Types 304 and 316 SSs is given by
Fen= exp(0.935- T* E* 0*), (13)
where the threshold and saturation values for T*, E*, and 0* are defined in Eqs. 8a-8c. At temperatures ~200oC and strain rates ::::;0.0004%/s, Eq. 13 yields an Fen of "d5 in low-DO PWR water (<0.05 ppm DO) and z8 in high-DO water (~0.05 ppm DO). At temperatures <200°C, Fen is ""2.5 in both low- and high-DO water at all strain rates.
8 Conservatism in Design Fatigue Curves
The overall conservatism in ASME Code fatigue evaluations has also been demonstrated in fatigue tests on piping welds and components. 54 In air, the margins on the number of cycles to failure for austenitic SS elbows and tees were 40-310 and 104-510, respectively. The margins for girth butt welds were significantly lower at 6-77. In these tests, fatigue life was expressed as the number of cycles for the crack to penetrate through the wall, which ranged in thickness from 6 to 18 mm (0.237 to 0.719 in). The fatigue design curves represent the number of cycles that are necessary to form a 3-mm-deep crack. Consequently, depending on wall thickness, the actual margins to failure may be lower by a factor of >2.
Deardorff and Smith55 have discussed the types and extent of conservatisms present in the ASME Section III fatigue evaluations and the effects of LWR environments on fatigue margins. The sources of conservatism include design transients considerably more severe than those experienced in service, grouping of transients, and simplified elastic-plastic analysis. Environmental effects on two components, the BWR feedwater nozzle/safe end and PWR steam generator feedwater nozzle/safe end, both constructed from LAS and known to be affected by severe thermal transients,
OAGI0000629 00044

were also investigated in the study. When environmental effects on fatigue life were not considered, Deardorff and Smith55 estimated that the ratio of the CUFs for the PWR and BWR nozzles (both constructed from LAS), computed with the mean experimental curve for test specimen data, to CUFs computed with the Code fatigue design curve were z60 and 90, respectively. To maintain the factor of 20 on life that was used in the present Code fatigue design curves to account for the uncertainties due to material and loading variability, the margins for the PWR and BWR nozzles are reduced to 3 and 4.5, respectively. These results suggest that, for carbon and low-alloy steels, the Code Design procedures provide some margin in life that can be used to account for environmental effects on life. However, as noted previously in Section 6, the Code fatigue design curve for austenitic SSs is not consistent with the existing fatigue S-N data; the actual margins on stress and life are 1.5 and 10, respectively, instead of 2 and 20. Consequently, the Code fatigue design curve for austenitic SSs provides little or no margin in life to account for environmental effects.
Data available in the literature have been reviewed to evaluate the effects of various material, loading, and environmental variables on the fatigue life of structural materials in air and LWR environments.33 The subfactors that may be used to account for the effects of these variables on fatigue life are summarized in Table 5. The factors on strain primarily account for variation in the fatigue limit of a material caused by material variability, component size and surface finish, and loading history. Because the reduction in fatigue life is associated with the growth of short cracks (<100 11m), the effects of these variables on threshold strain are typically not cumulative but rather are controlled by the variable that has the largest effect. The values in Table 5 suggest that a factor of at least 1. 5 on strain and 1 0 on cycles is needed to account for the differences and uncertainties of relating the fatigue lives of laboratory test specimens to those of large components. Beacuse SSs develop a corrosion scale in L WR environments, the effect of surface finish may not be significant; the subfactor on life to account for surface finish effects may be as low as 1.5 or may be eliminated completely. Therefore, a factor of 1.5 or 2 on life may be able to account for the effects of environment on the fatigue lives of austenitic SSs.
Table 5. Subfactors that may be used to account for effects of various variables on fatigue life
Variable
Material variability and experimental scatter
Size
Surface finish
Loading history
Total adjustment
Factor on Life
2.5
1.4
2.0-3.0
1.5-2.5
10.0-26.0
9 Fatigue Evaluations in LWR Environments
Factor on Strain
1.4-1. 7
1.25
1.3
1.5
1.5-1.7
Section III of the ASME Boiler and Pressure Vessel Code contains rules for the construction of nuclear power plant Class 1 components. 5 It provides requirements for designs that will withstand cyclic loadings on a structural component that occur because of changes in mechanical and thermal loadings as the system goes from one load set (pressure, temperature, moment, and force) to any other load set. ASME Section III, NB-3600 (piping design) methodology is used exclusively for piping and sometimes for branch nozzles. ASME Section III, NB-3200 (design by analysis) methodology is generally used for vessels and frequently for nozzles. In both cases, the various sets of load states at the most highly stressed locations in the component are defined first. The load states are defined in terms of the three principal stresses in NB-3200 methodology, and in terms of
OAGI0000629 00045
internal pressure, moments, average temperature, and temperature gradients in NB-3600 methodology. A peak stress-intensity range and an alternating stress-intensity amplitude Sa is then calculated for each load state. The value of Sa is used to first obtain the allowable number of cycles from the design fatigue curve and then to calculate the fatigue usage associated with that load state. The CUF is the sum of the partial usage factors. The Section III, NB-3200- or NB-3600-type analyses of components for service in LWR environments can be performed with the design fatigue curves presented in Figs. 32 and 33. Note that fatigue evaluations performed with these updated curves not only account for the environmental effects but they also include the difference between the current ASME mean air curve and the statistical-model air curve.
An alternative approach to fatigue evaluations in LWR environments has been proposed by Electric Power Research Institute (EPRI)52,53 and by the Environmental Fatigue Data (EFD) committee of Thermal and Nuclear Power Engineering Society (TENPES) of Japan.* As discussed in Section 7, the effects of L WR coolant environments on the fatigue S-N curves are expressed in terms of fatigue life correction factor Fen, defined as the ratio of the life in air at room temperature to that in water at service temperature. The effects of environment are incorporated into the ASME fatigue evaluation by obtaining a fatigue usage for a specific load pair based on the current Code design curves and multiplying it by the correction factor. Fatigue evaluations performed with the Fen incorporate only the effect of environment.
Both of these approaches require additional information about the service conditions, e.g., temperature, strain rate, and DO level. The procedure for obtaining these parameters depends on whether the elapsed-time-vs.-temperature information for the transient is available. The values of temperature and DO may be conservatively taken as the maximum values for the transient. An average strain rate is generally used for each load state; it is obtained from the peak strain and elapsed time for the transient. However, fatigue-monitoring data indicate that actual strain rates may vary significantly during the transient. The slowest strain rate can be used for a conservative estimate of life.
10 Summary
The work performed at ANL on fatigue of wrought and cast austenitic SSs in LWR environments is summarized. The existing fatigue S-N data have been evaluated to establish the effects of various material and loading variables, such as steel type, strain range, strain rate, temperature,and DO level in water on the fatigue lives of these steels. Current understanding of the fatigue S-N behavior of austenite SSs may be summarized as follows.
10.1
•
•
•
Air Environment
Steel Type: The fatigue lives of Types 304 and 316 SS are comparable; those of Type 316NG are superior. The fatigue S-N behavior of cast CF-8 and CF-SM SSs is similar to that of wrought austenitic SSs.
Temperature: For all steels, life is independent of temperature in the range from room temperature to 427"C.
Strain Rate: At temperatures above 260°C, the fatigue lives of austenitic SSs may decrease with decreasing strain rate.
*Presented at the Pressure Vessel Research Council Meeting, April 1996, Orlando, FL.
OAGI0000629 00046
•
10.2
•
•
•
•
•
•
•
ASME Code Mean Curve: The ASME mean curve for austenitic SSs is nonconservative with respect to existing fatigue S-N data; at strain amplitudes <0.5%, it predicts fatigue lives that are significantly longer than those observed experimentally.
LWR Environments
Environmental Effects: The fatigue lives of cast and wrought austenite SSs are decreased in LWR environments; the decrease depends on strain rate, DO level in water, and temperature.
Steel Type: The effects of LWR environments on fatigue life are comparable for all steels .
Strain Amplitude: A minimum threshold strain is required for environmentally assisted decrease in fatigue lives of the tested steels. The threshold value most likely corresponds to the rupture strain of the surface oxide film. Limited data suggest that the threshold strain is between 0.32 and 0.36%.
Loading Cycle: Environmental effects on fatigue life occur primarily during the tensile-loading cycle, and at strain levels greater than the threshold value required to rupture the surface oxide film. Consequently, loading and environmental conditions, e.g., strain rate, temperature, and DO level, during the tensile-loading cycle in excess of the oxide rupture strain, are important parameters for environmentally assisted reduction in fatigue lives of the tested steels.
Dissolved Oxygen in Water: Environmental effects on fatigue life are more pronounced in low-DO, i.e., <0.01 ppm DO, than in high-DO water, i.e., ~0.1 ppm DO. The reduction in life is greater by a factor of z2 in a simulated PWR environment than in high-DO water. The fatigue lives of cast SSs are approximately the same in both high- or low-DO water and are comparable to those observed for wrought SSs in low-DO water. Recent data suggest that the fatigue lives of austenitic SSs may depend on parameters other than DO level in water, e.g., conductivity of water may be important.
Strain Rate: Fatigue lives decrease with decreasing strain rate; the effect is greater in a low-DO PWR environment than in high-DO water. The results indicate that the strain rate below which effects of strain rate on fatigue life saturate may depend both on steel type and DO level. In low-DO PWR environments, saturation strain rate appears to be ""0.0004%/s for Type 304 SS and somewhat higher for Type 316 SS.
Temperature: Existing data are inadequate to establish the functional form for the dependence of life on temperature. Limited data indicate that environmental effects on fatigue life are significant at 2500C and minimal below 200°C. At 250-3300C, fatigue life appears to be relatively insensitive to changes in temperature.
10.3 Fatigue Design Curves in LWR Environments
Statistical models have been developed to predict fatigue life of small smooth specimens of austenitic SSs as a function of material, loading, and environmental parameters. Functional form and bounding values of these parameters were based on experimental observations and data trends. Statistical models were obtained by minimizing the squared Cartesian distances from the data point to the predicted curve instead of minimizing the sum of the square of the residual errors for either strain amplitude or fatigue life. The models are recommended for predicted fatigue lives of ::::;106 cycles. The results indicate that the ASME mean curve for SSs is not consistent with the
OAGI0000629 00047

experimental data at strain amplitudes <0.5% or stress amplitudes <975 MPa (<141 ksi); the ASME mean curve is nonconservative.
The design fatigue curves for austenitic SSs in LWR environments were obtained by the procedure that was used to develop the current ASME Code design fatigue curves, i.e., by adjusting the best-fit experimental curve for the effect of mean stress and by setting margins of 20 on cycles and 2 on strain to account for the uncertainties in life associated with material and loading conditions. However, because the margin on strain for the current ASME Code design fatigue curve is closer to 1.5 than 2, a factor of 1.5 was used when the design fatigue curves in LWR environments were developed. Data available in the literature were reviewed to evaluate the conservatism in the existing Code fatigue design curves. The use of a fatigue life correction factor to incorporate the effects of environment into the ASME Code fatigue evaluations is also discussed.
OAGI0000629 00048

References
1. K. lida, A Review of Fatigue Failures in LWR Plants in Japan, Nucl. Eng. Des. 138, 297-312 (1992).
2. K. Kussmaul, R. Rintamaa, J. Jansky, M. Kemppainen, and K. Torronen, On the Mechanism of Environmental Cracking Introduced by Cyclic Thermal Loading, in IAEA Specialists Meeting Corrosion and Stress Corrosion of Steel Pressure Boundary Components and Steam Turbines, VTT Symp. 43, Espoo, Finland, pp. 195-243 (1983).
3. K. Kussmaul, D. Blind, and J. Jansky, Formation and Growth of Cracking in Feed Water Pipes and RPV Nozzles, Nucl. Eng. Des. 81, 105-119 (1984).
4. E. Lenz, B. Stellwag, and N. Wieling, The Influence of Strain Induced Corrosion Cracking on the Crack Initiation in Low Alloy Steels in HT-Water- A Relation Between Monotonic and Cyclic Crack Initiation Behavior, in IAEA Specialists Meeting Corrosion and Stress Corrosion of Steel Pressure Boundary Components and Steam Turbines, VTT Symp. 43, Espoo, Finland, pp. 243-267 (1983).
5. ASME Boiler and Pressure Vessel Code Section III- Rules for Construction of Nuclear Power Plant Components, The American Society of Mechanical Engineers, New York (1992).
6. B. F. Langer, Design of Pressure Vessels for Low-Cycle Fatigue, ASME J. Basic Eng. 84, 389-402 (1962) .
7. Tentative Structural Design Basis for Reactor Pressure Vessels and Directly Associated Components (Pressurized, Water Cooled Systems), PB 151987, U.S. Dept. of Commerce, Office of Technical Service, 1 Dec. 1958 Revision.
8. S. Ranganath, J. N. Kass, and J. D. Heald, Fatigue Behavior of Carbon Steel Components in High-Temperature Water Environments, in BWR Environmental Cracking Margins for Carbon Steel Piping, EPRI NP-2406, Electric Power Research Institute, Palo Alto, CA, Appendix 3 (May 1982).
9. W. A. Van Der Sluys, Evaluation of the Available Data on the Effect of the Environment on the Low Cycle Fatigue Properties in Light Water Reactor Environments, in Proc. 6th Int. Symp. on Environmental Degradation of Materials in Nuclear Power Systems - Water Reactors, R. E. Gold and E. P. Simonen, eds., The Metallurgical Society, Warrendale, PA, pp. 1-4 (1993).
10. N. Nagata, S. Sato, and Y. Katada, Low-Cycle Fatigue Behavior of Pressure Vessel Steels in High-Temperature Pressurized Water, ISIJ Int. 31 (1), 106-114 (1991).
11. M. Higuchi and K. lida, Fatigue Strength Correction Factors for Carbon and Low-Alloy Steels in Oxygen-Containing High-Temperature Water, Nucl. Eng. Des. 129, 293-306 (1991).
OAGI0000629 00049

12. M. Higuchi, K. lida, and Y. Asada, Effects of Strain Rate Change on Fatigue Life of Carbon Steel in High-Temperature Water, in Fatigue and Crack Growth: Environmental Effects, Modeling Studies, and Design Considerations, PVP Vol. 306, S. Yukawa, ed., American Society of Mechanical Engineers, New York, pp. 111-116 (1995); also in Proc. of Symp. on Effects of the Environment on the Initiation of Crack Growth, ASTM STP 1298, American Society for Testing and Materials, Philadelphia (1997).
13. H. Kanasaki, M. Hayashi, K. lida, and Y. Asada, Effects of Temperature Change on Fatigue Life of Carbon Steel in High Temperature Water, in Fatigue and Crack Growth: Environmental Effects, Modeling Studies, and Design Considerations, PVP Vol. 306, S. Yukawa, ed., American Society of Mechanical Engineers, New York, pp. 117-122 (1995).
14. G. Nakao, H. Kanasaki, M. Higuchi, K. lida, and Y. Asada, Effects of Temperature and Dissolved Oxygen Content on Fatigue Life of Carbon and Low-Alloy Steels in L WR Water Environment, in Fatigue and Crack Growth: Environmental Effects, Modeling Studies, and Design Considerations, PVP Vol. 306, S. Yukawa, ed., American Society of Mechanical Engineers, New York, pp. 123-128 (1995).
15. 0. K. Chopra and W. J. Shack, Effects of LWR Environments on Fatigue Life of Carbon and Low-Alloy Steels, in Fatigue and Crack Growth: Environmental Effects, Modeling Studies, and Design Considerations, PVP Vol. 306, S. Yukawa, ed., American Society of Mechanical Engineers, New York, pp. 95-109 (1995).
16. 0. K. Chopra and W. J. Shack, Evaluation of Effects of LWR Coolant Environments on Fatigue Life of Carbon and Low-Alloy Steels, in Effects of the Environment on the Initiation of Crack Growth, ASTM STP 1298, W. A. Van Der Sluys, R. S. Piascik, and R. Zawierucha, eds., American Society for Testing and Materials, Philadelphia, pp. 24 7-266 (1997).
17. 0. K. Chopra and W. J. Shack, Low-Cycle Fatigue of Piping and Pressure Vessel Steels in LWR Environments, Nucl. Eng. Des. 184, 49-76 (1998).
18. 0. K. Chopra and W. J. Shack, Effects of LWR Coolant Environments on Fatigue Design Curves of Carbon and Low-Alloy Steels, NUREG/CR-6583, ANL-97 /18 (March 1998).
19. 0. K. Chopra and W. J. Shack, Fatigue Crack Initiation in Carbon and Low-Alloy Steels in Light Water Reactor Environments -Mechanism and Prediction, in Fatigue, Environmental Factors, and New Materials, PVP Vol. 374, H. S. Mehta, R. W. Swindeman, J. A. Todd, S. Yukawa, M. Zako, W. H. Bamford, M. Higuchi, E. Jones, H. Nickel, and S. Rahman, eds., American Society of Mechanical Engineers, New York, pp. 155-168 (1998).
20. 0. K. Chopra and W. J. Shack, Overview of Fatigue Crack Initiation in Carbon and Low-Alloy Steels in Light Water Reactor Environments, J. Pressure Vessel Technol. 121, 49-60 (1999).
21. M. Fujiwara, T. Endo, and H. Kanasaki, Strain Rate Effects on the Low Cycle Fatigue Strength of 304 Stainless Steel in High Temperature Water Environment, Fatigue Life: Analysis and Prediction, in Proc. of the Int. Conf. and Exposition on Fatigue, Corrosion Cracking, Fracture Mechanics, and Failure Analysis, ASM, Metals Park, OH, pp. 309-313 (1986).
OAGI0000629 00050

22. H. Mimaki, H. Kanasaki, I. Suzuki, M. Koyama, M. Akiyama, T. Okubo, and Y. Mishima, Material Aging Research Program for PWR Plants, in Aging Management Through Maintenance Management, PVP Vol. 332, I. T. Kisisel, ed., American Society of Mechanical Engineers, New York, pp. 97-105 (1996).
23. H. Kanasaki, R. Umehara, H. Mizuta, and T. Suyama, Fatigue Lives of Stainless Steels in PWR Primary Water, Trans. 14th Int. Conf. on Structural Mechanics in Reactor Technology (SMiRT 14), Lyon, France, pp. 473-483 (1997).
24. H. Kanasaki, R. Umehara, H. Mizuta, and T. Suyama, Effects of Strain Rate and Temperature Change on the Fatigue Life of Stainless Steel in PWR Primary Water, Trans. 14th Intl. Conf. on Structural Mechanics in Reactor Technology (SMiRT 14), Lyon, France, pp. 485-493 (1997).
25. M. Higuchi and K. lida, Reduction in Low-Cycle Fatigue Life of Austenitic Stainless Steels in High-Temperature Water, in Pressure Vessel and Piping Codes and Standards, PVP Vol. 353, D. P. Jones, B. R. Newton, W. J. O'Donnell, R. Vecchio, G. A. Antaki, D. Bhavani, N. G. Cofie, and G. L. Hollinger, eds., American Society of Mechanical Engineers, New York, pp. 79-86 (1997).
26. M. Hayashi, Thermal Fatigue Strength of Type 304 Stainless Steel in Simulated BWR Environment, Nucl. Eng. Des. 184, 135-144 (1998).
27. M. Hayashi, K. Enomoto, T. Saito, and T. Miyagawa, Development of Thermal Fatigue Testing with BWR Water Environment and Thermal Fatigue Strength of Austenitic Stainless Steels, Nucl. Eng. Des. 184, 113-122 (1998).
28. W. J. Shack and W. F. Burke, Fatigue of Type 316NG SS, in Environmentally Assisted Cracking in Light Water Reactors, Semiannual Report, October 1989-March 1990, NUREG/CR-4667 Vol. 10, ANL-9115, pp. 3-19 (March 1991).
29. 0. K. Chopra and D. J. Gavenda, Effects of LWR Coolant Environments on Fatigue Lives of Austenitic Stainless Steels, in Pressure Vessel and Piping Codes and Standards, PVP Vol. 353, D. P. Jones, B. R. Newton, W. J. O'Donnell, R. Vecchio, G. A. Antaki, D. Bhavani, N. G. Cofie, and G. L. Hollinger, eds., American Society of Mechanical Engineers, New York, pp. 87-97 (1997).
30. 0. K. Chopra and D. J. Gavenda, Effects of LWR Coolant Environments on Fatigue Lives of Austenitic Stainless Steels, J. Pressure Vessel Technol. 120, 116-121 (1998).
31. 0. K. Chopra and J. L. Smith, Estimation of Fatigue Strain-Life Curves for Austenitic Stainless Steels in Light Water Reactor Environments, in Fatigue, Environmental Factors, and New Materials, PVP Vol. 374, H. S. Mehta, R. W. Swindeman, J. A. Todd, S. Yukawa, M. Zako, W. H. Bamford, M. Higuchi, E. Jones, H. Nickel, and S. Rahman, eds., American Society of Mechanical Engineers, New York, pp. 249-259 (1998).
32. S. Majumdar, 0. K. Chopra, and W. J. Shack, Interim Fatigue Design Curves for Carbon, Low-Alloy, and Austenitic Stainless Steels in LWR Environments, NUREG/CR-5999, ANL-93/3 (April 1993).
OAGI0000629 00051

33. J. Keisler, 0. K. Chopra, and W. J. Shack, Fatigue Strain-Life Behavior of Carbon and Low-Alloy Steels, Austenitic Stainless Steels, and Alloy 600 in LWR Environments, NUREG/CR-6335, ANL-95/15 (Aug. 1995).
34. J. Keisler, 0. K. Chopra, and W. J. Shack, Statistical Models for Estimating Fatigue Strain-Life Behavior of Pressure Boundary Materials in Light Water Reactor Environments, Nucl. Eng. Des. 167, 129-154 (1996).
35. D. D. Macdonald, A. C. Scott, and P. Wentrcek, External Reference Electrodes for Use in High Temperature Aqueous Systems, J. Electrochem. Soc. 126, 908-911 (1979).
36. C. E. Jaske, and W. J. O'Donnell, Fatigue Design Criteria for Pressure Vessel Alloys, Trans. ASME J. Pressure Vessel Technol. 99, 584-592 (1977).
37. J. B. Conway, R. H. Stentz, and J. T. Berling, Fatigue, Tensile, and Relaxation Behavior of Stainless Steels, TID-26135, U.S. Atomic Energy Commission, Washington, DC (1975).
38. D. L. Keller, Progress on LMFBR Cladding, Structural, and Component Materials Studies During July, 1971 through June, 1972, Final Report, Task 32, Battelle-Columbus Laboratories, BMI-1928 (1977).
39. D. A. Hale, S. A. Wilson, E. Kiss, and A. J. Gianuzzi, Low Cycle Fatigue Evaluation of Primary Piping Materials in a BWR Environment, GEAP-20244, U.S. Nuclear Regulatory Commission (Sept. 1977).
40. C. Amzallag, P. Rabbe, G. Gallet, H. -P. Lieurade, Influence des Conditions de Sollicitation Sur le Comportement en Fatigue Oligocyclique D'aciers Inoxydables Austenitiques, Memoires Scientifiques Revue Metallurgie Mars 1978, pp. 161-173
41. A. Pellissier-Tanon, J. L. Bernard, C. Amzallag, and P. Rabbe, Evaluation of the Resistance of Type 316 Stainless Steel Against Progressive Deformation, in Low-Cycle Fatigue and Life Prediction, ASTM STP 770, C. Amzallag, B. N. Leis, and P. Rabbe, eds., American Society for Testing and Materials, Philadelphia, pp. 69-80 (1982).
42. Slama, G., Petrequin, P., and Mager, T., Effect of Aging on Mechanical Properties of Austenitic Stainless Steel Castings and Welds, in Assuring Structural Integrity of Steel Reactor Pressure Boundary Components, SMiRT Post Conference Seminar 6, Monterey, CA, 1983.
43. 0. K. Chopra, Effect of Thermal Aging on Mechanical Properties of Cast Stainless Steels, in Proc. of the 2nd Int. Conf. on Heat-Resistant Materials, K. Natesan, P. Ganesan, and G. Lai, eds., ASM International, Materials Park, OH, pp. 479-485 (1995).
44. K. J. Miller, Damage in Fatigue: A New Outlook, in Pressure Vessels and Piping Codes and Standard: Volume 1 -Current Applications, PVP Vol. 313-1, K. R. Rao andY. Asada, eds., American Society of Mechanical Engineers, New York, pp. 191-192 (1995).
45. S. Suresh and R. 0. Ritchie, Propagation of Short Fatigue Cracks, Int. Metals Reviews 29, 445-476 (1984).
46. K. Tokaji, T. Ogawa, and S. Osaka, The Growth of Microstructurally Small Fatigue Cracks in a Ferritic-Pearlitic Steel, Fatigue Fract. Eng. Mater. Struct. 11, 331-342 (1988).
OAGI0000629 00052
47. D. J. Gavenda, P.R. Luebbers, and 0. K. Chopra, Crack Initiation and Crack Growth Behavior of Carbon and Low-Alloy Steels, in Fatigue and Fracture 1, PVP Vol. 350, S. Rahman, K. K. Yoon, S. Bhandari, R. Warke, and J. M. Bloom, eds., American Society of Mechanical Engineers, New York, pp. 243-255 (1997).
48. K. Tokaji and T. Ogawa, The Growth of Microstructurally Small Fatigue Cracks in Metals, in Short Fatigue Cracks, ESIS 13, M. J. Miller and E. R. de los Rios, eds., Mechanical Engineering Publication, London, pp. 85-99 (1992).
49. F. P. Ford, Overview of Collaborative Research into the Mechanisms of Environmentally Controlled Cracking in the Low Alloy Pressure Vessel Steel/Water System, in Proc. 2nd Int. Atomic Energy Agency Specialists' Meeting on Subcritical Crack Growth, NUREG/CP-0067, MEA-2090, Vol. 2, pp. 3-71 (1986).
50. H. Hanninen, K. Torronen, and W. H. Cullen, Comparison of Proposed Cyclic Crack Growth Mechanisms of Low Alloy Steels in LWR Environments, in Proc. 2nd Int. Atomic Energy Agency Specialists' Meeting on Subcritical Crack Growth, NUREG/CP-0067, MEA-2090, Vol. 2, pp. 73-97 (1986).
51. American Society of Mechanical Engineers, Criteria of the ASME Boiler and Pressure Vessel Code for Design by Analysis in Sections III and VIII, Division 2, ASME, New York (1969).
52. H. S. Mehta and S. R. Gosselin, An Environmental Factor Approach to Account for Reactor Water Effects in Light Water Reactor Pressure Vessel and Piping Fatigue Evaluations, EPRI Report TR-105759 (Dec. 1995).
53. H. S. Mehta and S. R. Gosselin, An Environmental Factor Approach to Account for Reactor Water Effects in Light Water Reactor Pressure Vessel and Piping Fatigue Evaluations, in Fatigue and Fracture Vol. 1, PVP 323, H. S. Mehta, ed., American Society of Mechanical Engineers, New York, pp. 171-185 (1996).
54. M. E. Mayfield, E. C. Rodabaugh, and R. J. Eiber, A Comparison of Fatigue Test Data on Piping with the ASME Code Fatigue Evaluation Procedure, ASME paper 79-PVP-92, American Society of Mechanical Engineers, New York (1979).
55. A. F. Deardorff and J. K. Smith, Evaluation of Conservatisms and Environmental Effects in ASME Code, Section III, Class 1 Fatigue Analysis, SAND94-0187, prepared by Structural Integrity Associates, San Jose, CA, under contract to Sandia National Laboratories (Aug. 1994).
OAGI0000629 00053

NRC FORM 335 (2--89)
U.S. NUCLEAR REGULATORY COMMISSION 1. REPORT NUMBER
NRCM 1102, 3201,3202 BIBLIOGRAPHIC DATA SHEET
(See instructions on the reverse)
~----------------------------------------------------------------~ 2. TITLE AND SUBTITLE
Effects of LWR Coolant Environments on Fatigue Design Curves of Austenitic
Stainless Steels
5. AUTHOR(S)
0. K. Chopra
(Assigned by NRC. Add Vol., Supp., Rev., and Addendum Numbers, if any.)
NUREG/CR-5704 ANL-98/31
3. DATE REPORT PUBLISHED
MONTH
March I
4. FIN OR GRANT NUMBER
W6610 6. TYPE OF REPORT
Technical
YEAR
1999
7. PERIOD COVERED (Inclusive Dates)
8. PERFORMING ORGANIZATION- NAME AND ADDRESS (If NRC, provide Division, Office or Region, U.S. Nuclear Regulatory Commission, and mailing address; if contractor, provide name and mailing address.)
Argonne National Laboratory 9700 South Cass Avenue Argonne, IL 60439
9. SPONSORING ORGANIZATION- NAME AND ADDRESS (If NRC, type "Same as above": if contractor, provide NRC Division, Office or Region, U.S. Nuclear Regulatory Commission, and mailing address.)
Engineering Issues Branch Office of Nuclear Regulatory Research U.S. Nuclear Regulatory Commission Washington, DC 20555
10. SUPPLEMENTARY NOTES
M. McNeil, NRC Project Manager
11. ABSTRACT (200 words or less)
The ASME Boiler and Pressure Vessel Code provides rules for the construction of nuclear power plant components. Figures I-9.1 through I-9.6 of Appendix I to Section III of the Code specify fatigue design curves for structural materials. Although effects of reactor coolant environments are not explicitly addressed by the design curves, test data indicate that the Code fatigue curves may not always be adequate for coolant environments. This report summarizes work performed by Argonne National Laboratory on the fatigue of austenitic stainless steels in light water reactor (LWR) environments. Existing fatigue S-N data have been evaluated to establish the effects of various material and loading variables, such as steel type, dissolved oxygen level, strain range, strain rate, and temperature, on the fatigue lives of these steels. Statistical models are presented for estimating the fatigue S-N curves as a function of material, loading, and environmental variables. Design fatigue curves have been developed for austenitic stainless steel components in LWR environments. The extent of conservatism in the design fatigue curves and alternative methods for incorporating the effects of LWR coolant environments into the ASME Code fatigue evaluations are discussed.
12. KEY WORDS/DESCRIPTORS (List words or phrases that will assist researchers in locating this report.)
Fatigue Strain-Life Curves
Fatigue Design Curves
LWR Environments
Austenitic Stainless Steels
Cast Austenitic Stainless Steels
Fatigue Crack Initiation
NRC FORM 335 (2--89)
13. AVAILABILITY STATEMENT
Unlimited
14. SECURITY CLASSIFICATION
(This Page)
Unclassified
(This Report)
Unclassified 15. NUMBER OF PAGES
16. PRICE
OAGI0000629 00054