Effects of individual trees on the solar radiation climate of small ...
23
Urban Ecology. 9 (1986) 337-359 Elsevier Science Publishers B.V., Amsterdam - Printed in The Netherlands EFFECTS OF INDIVIDUAL TREES ON THE SOLAR RADIATION CLIMATE OF SMALL BUILDINGS GORDON M. HEISLER 337 NorthetUtern Forest Experiment Station, USDA Forelt Service. The Pennsylvania State University, 104 Academic Projects Building, University Park. PA 16802 (U.S.A.) (Accepted 10 September 1985) ABSTRACT Heisler, O.M., 1986. Effects of individual trees on the solar radiation climate of small buildings. Urban Ecol., 9: 337-359. Under clear skies, a mid-sized sugar maple tree (Acer saccharum Marsh.) reduced irra- diance in its shade on a south-facing wall by about 80% when in leaf, and by nearly 40% when leafless. Reductions by a similar-sized London plane (Platanus acerifolia W.) were generally slightly smaller. The percentage reductions varied with the fraction (DR) of diffuse radiation, and could be approximated by regressions with DR' as the independent variable. The significance of the irradiance reductions (or building radiation climate was tested by using physical models of representative tree crowns (similar to sugar maple) and a representative house to evaluate shadow patterns, along with a mathematical model of average hourly solar radiation for an average day of each month. For a mid-sized tree with a 2-m clear bole located south of the house in a cloudy climate , the ratio of desirable in- solation reductions during the cooling season to undesirable insolation reductions during the heating season was a low 0.74; whereas, with the same tree on the west, the ratio was a much more beneficial 4.6. In a surmy climate, the ratios were 0.55 and 3.3 for the tree on the south and west, respectively. A tai1er tree with a longer clear bole on the south produced more favorable ratios of cooling season to heating season insolation reductions than the tree with the short clear bole on the south. INTRODUCTION Trees can have a large impact on urban microclimate and on fuel or elec- tricity used for heating and cooling buildings. In one study. a forested home - site reduced electricity for air conditioning a mobile home in Pennsylvania by a seasonally-averaged estimate of 75% (DeWalle et al_. 1983). In a hot, humid climate, landscape trees and shrubs reduced cooling energy for a mobile home by more than 50% (Parker, 1983). However, in temperate and cool climates, tree shade in winter may significantly increase fuel energy needed for heating (DeWalle et al., 1983; Thayer et al., 1983, Thayer and Maeda, 1985), because even buildings not designed for optimum use of solar Mention of a commercial or proprietary product does not constitute endorsement by the USDA or the Forest Service.
Transcript of Effects of individual trees on the solar radiation climate of small ...

Urban Ecology. 9 (1986) 337-359 Elsevier Science Publishers B.V., Amsterdam - Printed in The Netherlands
EFFECTS OF INDIVIDUAL TREES ON THE SOLAR RADIATION CLIMATE OF SMALL BUILDINGS
GORDON M. HEISLER
337
NorthetUtern Forest Experiment Station, USDA Forelt Service. The Pennsylvania State University, 104 Academic Projects Building, University Park. PA 16802 (U.S.A.)
(Accepted 10 September 1985)
ABSTRACT
Heisler, O.M., 1986. Effects of individual trees on the solar radiation climate of small buildings. Urban Ecol., 9 : 337-359.
Under clear skies, a mid-sized sugar maple tree (Acer saccharum Marsh.) reduced irradiance in its shade on a south-facing wall by about 80% when in leaf, and by nearly 40% when leafless. Reductions by a similar-sized London plane (Platanus acerifolia W.) were generally slightly smaller. The percentage reductions varied with the fraction (DR) of diffuse radiation, and could be approximated by regressions with DR' as the independent variable.
The significance of the irradiance reductions (or building radiation climate was tested by using physical models of representative tree crowns (similar to sugar maple) and a representative house to evaluate shadow patterns, along with a mathematical model of average hourly solar radiation for an average day of each month. For a mid-sized tree with a 2-m clear bole located south of the house in a cloudy climate, the ratio of desirable insolation reductions during the cooling season to undesirable insolation reductions during the heating season was a low 0.74; whereas, with the same tree on the west, the ratio was a much more beneficial 4.6. In a surmy climate, the ratios were 0.55 and 3.3 for the tree on the south and west, respectively. A tai1er tree with a longer clear bole on the south produced more favorable ratios of cooling season to heating season insolation reductions than the tree with the short clear bole on the south.
INTRODUCTION
Trees can have a large impact on urban microclimate and on fuel or electricity used for heating and cooling buildings. In one study . a forested homesite reduced electricity for air conditioning a mobile home in Pennsylvania by a seasonally-averaged estimate of 75% (DeWalle et al_. 1983). In a hot, humid climate, landscape trees and shrubs reduced cooling energy for a mobile home by more than 50% (Parker, 1983). However, in temperate and cool climates, tree shade in winter may significantly increase fuel energy needed for heating (DeWalle et al., 1983; Thayer et al., 1983, Thayer and Maeda, 1985), because even buildings not designed for optimum use of solar
Mention of a commercial or proprietary product does not constitute endorsement by the USDA or the Forest Service.
338
energy derive significant portions of their heat energy from solar radiation. Even though deciduous trees provide less shade in winter than in summer. winter shade is significant. Fortunately, the differing paths of the sun during the year provide an opportunity to maximize shade in summer and minimize it in winter by careful landscape design and management of trees and other vegetation.
In previous studies (e.g. Olgyay, 1963; Neubaurer and Cramer, 1966) the advantage of shade for west·facing building walls was recognized, and Neubaurer and Cramer suggested pruning lower branches from trees close to a south wall to prevent blocking winter sun from south-facing windows. However, radiation reductions by trees were not measured. Olgyay (1963) assumed that leafless trees would reduce radiation on buildings by 10-30% of the reductions by the trees with leaves, but the basis for this assumption was not specified. Many articles tell do-it-yourself homeowners to plant deciduous shade trees with no mention of possible deleterious effects (e.g. Foster, 1978; Morrison, 1981); they simply indicate that deciduous trees drop their leaves in winter to "let the sun through".
In this study, radiation reductions by individual deciduous trees were measured and the significance of the reductions for the average solar radiation input to small buildings was explored by modeling techniques. These consisted of deriving tree shade patterns from physical models of a 'typical' representative tree and house in a heliodon, combined with a mathematical model of solar radiation climate at the house surfaces. Three different tree crown positions were tested to contrast the effect on building radiation climate of a tree with a short clear bole on the south and on the west and a taller tree with a long clear bole on the south, in both a cloudy and a sunny climate at about 40'N latitude.
Although the effect of tree shade on fuel or electricity use was not calculated, the effect of tree shade on the solar radiation climate of exterior surfaces was derived, because it is useful generalized design information. The effect of tree shade on space conditioning energy requirements would depend upon window area and placement, insulation in the house envelope, and temperature regime of the locale, among other factors. Generally, solar radiation through windows is much more important to space conditioning energy use than solar radiation on opaque surfaces such as walls, but radiation on opaque surfaces may also be significant.
METHODS
The complete study had four components: (a) sample trees were selected, and crown size and visual density were measured; (b) patterns of the shadow of representative tree crowns on a small house throughout a year were evaluated with a heliodon model for the three selected tree crown positions; (c) irradiance reductions by the sample trees were measured with pyranom-

339
eters and average reduction factors for the representative tree crowns were derived; and (d) the effects of shade of a tree crown in the three positions on the yearly radiation climate of the house were calculated. The heliodon in. dicated the location of tree shade; the pyranometer measurements in the field quantified the irradiance reductions. Comparisons of the different tree positions are made on the basis of the ratio of insolation reductions in the cooling season to reductions in the heating season.
Sample trees
To evaluate radiation reductions by deciduous trees, four different trees in State College, PA (latitude 40'48'N, longitude 77'51'W, and elevation 350 m) were sampled: a Norway maple (Acer platanoides L.), a London plane (Platanus acerifolia W.), and two sugar maples (Acer saccharum Marsh.). These trees represented medium·sized trees of three different species commonly found in urban areas in northeastern U.S., along with a large tree of one species, sugar maple. Dimensions are indicated in Table I and Fig. 1.
TABLE I
Dimensions and crown density of sample trees
Species
London plane Norway maple Sugar maple Lar.ge sugar maple
Tree height (m)
11 6.7
10.4 15
-By photographic technique .
• • ,
Height of crown (m)
2.0 2.0 1.8 2.5
Crown width (m)
8.4 6.4 8.2
14
Visual density of crowns·
Leaf-less center ledge/entire (%)
65/27/37 66/22/34 57/23/40 64/41/44
In-leaf entire (%)
70 77 87 86
LONDON PLANE NORWAY MAPLE SUGAR MAPLE SUGAR MAPLE
Fig. 1. General branching pattern and crown shape of sample trees, Rectangles on crowns indicate areas sampled in 'center' and 'edge' visual density estimates. The outline of the imaginary wall and the locations of south-facing pyranometers on the wall are indicated.
340
For descriptive purposes and to compare the sample trees to other trees, a measure of crown density was obtained by a simple photographic technique. Photographs of the crowns or portions of the crowns were projected onto a grid of fine lines with 250 intersections. The number of intersections on twigs, branches, or leaves provided an estimate of visual density - the percent of sky obscured within the outlines of the tree crowns. Photos of portions of the defoliated tree crowns were taken with a zoom telephoto lens and included either the central 1/3 of the total crown or a section 1.4 m wide along the edge of the crowns (Fig. 1). Photos of the entire crowns were taken with a 35-mm focal-length lens.
Heliodon modeling of shadow patterns
Scale models of the representative house and trees in a simple heliodon were used to evaluate shaded areas. The heliodon consisted of a light source ('sun ') and a base on which a house and tree model were located together with a sundial. The base could be tilted relative to the fixed light source to find shadow patterns throughout the year for representative times. In this study , the times were each hour from sunrise to sunset on the 21st of each month. The sundial in the heliodon was a 'Sun Path Indicator' (Smay, 1979). A lamp with a collimating reflector or actual sunlight makes the best light source; however, our 'sun' was a 300-W photo flood lamp about 4 m from the model. At this distance, the light rays on the model were sufficiently parallel to produce reasonably accurate sbadow patterns. We mounted our base on a sturdy camera tripod with a two-way tilting head. Other simple shadow modeling techniques have been described (e.g. Kern, 1975; Novell, 1981), but this heliodon seems to be the simplest to construct and should be as easy as any to use.
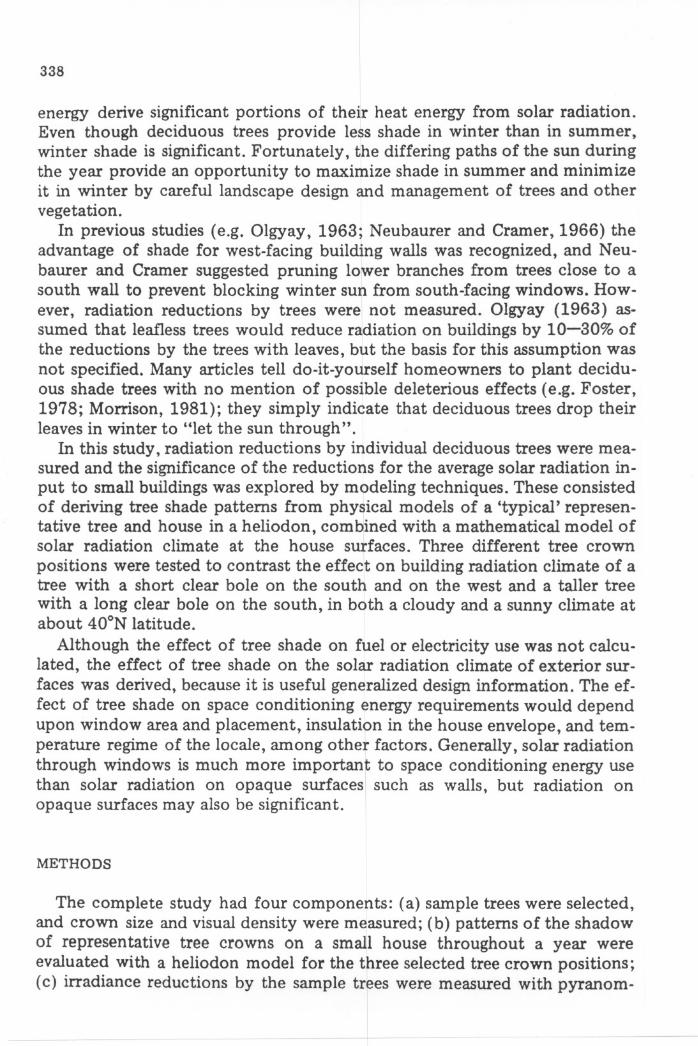
A model of a representative one-story (8.69 m X 12.50 m, 102 m') house was constructed at a scale of 1 : 48 (Fig. 2). The roof had an overhang of 0.61 m on the front and back and 0.30 m on each end. A 0.93-model-m' (10-model-ft') grid was drawn on the roof and walls to facilitate estimation of shaded area.
Although density and irradiance reductions were measured for four sample trees, shadow patterns and radiation climate were derived for only two composite tree models. One tree model represented an 11-m tree with a crown shape typical of many mid-sized open-grown deciduous trees but most closely resembling a sugar maple with the crown base at 2.4 m. Another model represented a 15-m tree with the bole pruned to 6 m (Fig. 2). The tree models were constructed of yam wrapped around a wire mesh frame to create symmetrical crown shapes.
With the house oriented with the long axis east to west, the smaller model tree was positioned at several distances from the house to locate the position providing the most area shaded in winter, as one goal was to determine how deleterious winter shade might be. When the tree was located with the edge

Noon July 21
Noon July 21
4:00 pm July 21
Unpruned Tree on South
Noon January 21
Noon
4:00 pm
January 21
Pruned Tree on South
Unpruned Tree on West
January 21
34]
Fig. 2. The representative house with tree croWDS in three different positions and patterns of .hade by eavell (dark ltiple) or tree (light ltiple) at .... r near the time of maximum .hade on day. near the middle of the heating and cooling seasons.
PYRANOMETERS
HORIZONTAL. III
VERTICAL '0"
INVERTED II
Rg Rd
t!l ~ SHADOWBAND
IMAGINARY WALL
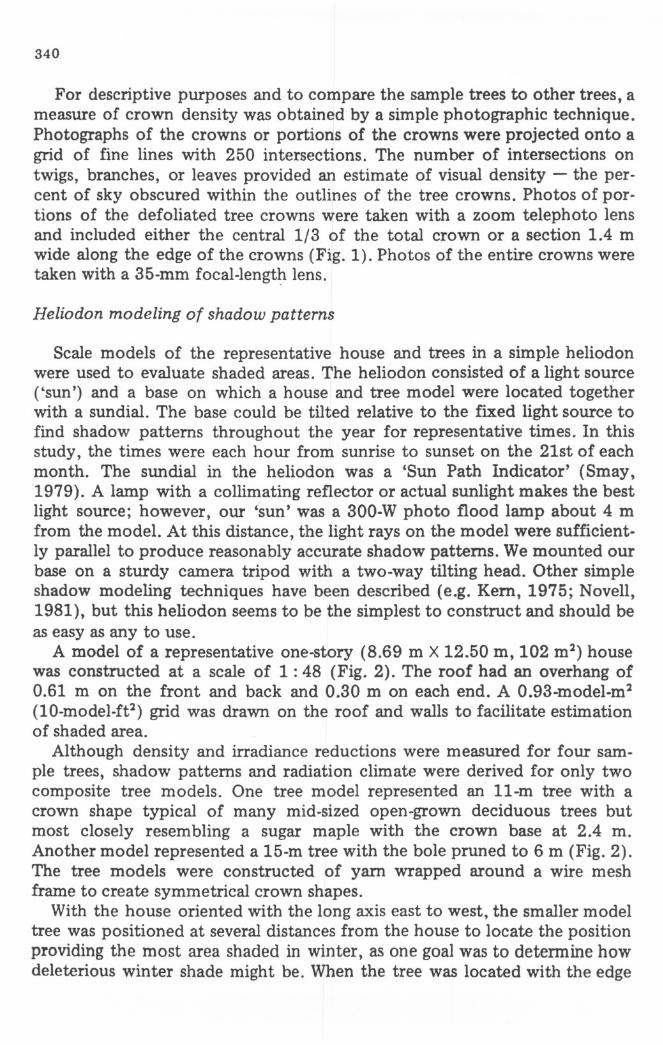
Fig, 3. Plan view of sample tree and instrument locations ,
.,

342
of the crown tangent to the edge of the south wall, shaded area through the heating season was maximum. Hence, this position was selected for further analysis and comparison with the tall pruned tree in the same location and with the smaller tree on the west.
Radiation measurements
To evaluate solar irradiance reductions on vertical surfaces by typical urban trees, irradiance measurements were made with ten thermopile pyra· nometers that were set up at the four sample trees in turn on 22 different sampling days. Six of the pyranometers were distributed over a south-facing
NOMENCLATURE
Symbols a albedo A coefficient of direct normal radiation B atmospheric extinction coefficient D average monthly daily diffuse radiation on a horizontal surface DR diffuse ratio - KdlKT for monthly average radiation or Rd/R, for instantaneous
irradiance f A/(KT- Kd) H average daily global insolation on a horizontal surface Ho average daily extraterrestial insolation on a horizontal surface J average hourly radiation Kd DIH. KT H/H. L latitude rd long-term average Idll/D r irradiance reduction (fraction of irradiance without tree) R instantaneous irradiance S solar declination t tilt of sloping roof W hour angle
(J incidence angle
Subscripts d diffuse D direct beam E East g global h horizontal surface n normal to sun's rays o on vertical surface in the open, extraterrestial r roof surface s in tree shade, at sunrise T total u reflected from ground v vertical surface w wall W West

343
'house wall', i.e., an imaginary wall, with dimensions proportional to the south wall of the model house as shown in Figs . 1 and 3. The 'wall' was on an east·west line below the northern edge of the crowns. The pyranometers on the wall were 4.3 m apart horizontally and at 0.76 and 2 m above ground . Additional pyranometers (Fig. 3) measured: (a) irradiance Ro on a south· facing vertical in the open; (b) global irradiance Rg in the open; (c) diffuse sky irradiance Rd on the horizontal in the open; and (d) radiation Ru reo flected from the ground. During measurements, an observer recorded cloud conditions and noted which of the six pyranometers on the 'wall' were in the tree shadow. - In this paper, 'solar radiation' is used in the general sense and may be solar radiance from a source; 'solar irradiance', i.e ., flux density of radiation on a surface in W m""l; or 'solar insolation" i.e. the daily integral of irradiance in MJ m"'. These definitions follow Monteith (1973).
Pyranometer signals were usually read with a data logger that scanned all input signals at 2·s intervals and averaged over 10 min. Diffuse radiation was measured with a pyranometer shielded from solar beam radiation by a shadow band. Radiation reflected from the ground surface was measured with an inverted pyranometer at a height of 1.2 m. The instrumentation and radiation measurements are described in more detail in Heisler (1985).
The use of an imaginary wall to represent an actual one assumes that some radiation fluxes are negligible or that they are canceling. These fluxes are (a) the radiation from the northern half of the sky that impinges upon the ground in front of an imaginary wall and is reflected back to the pyranom· eters; and (b) radiation that would be reflected from an actual wall to the ground or tree and then back to the pyranometers.
Model of house radiation climate
Average hourly irradiances on the house surfaces for an average day at the midpoint of each month were calculated by adaptation of the method of Liu and Jordan (1963) as modified by Kusuda and Ishii (1977). For each of 80 locations in the U.S.A. and Canada, Liu and Jordan (1963) compiled the average dally total radiation H on a horizontal surface and the ratio KT = H/H., where H. is dally total extraterrestial radiation on a horizontal surface at the midpoint of the month. They also evaluated the relationship between KT and Kd where Kd ~ D/H., and D is the 'average' dally diffuse radiation on a horizontal surface for each month. From these basic data may be calculated [Th, average hourly total irradiance on a horizontal surface for the midpoint day. Average hourly diffuse irradiance [dh on a horizontal surface may be calculated as:
(1) where the factor r d is a function of the given hour angle W and the sunrise hour angle W, (obtained from cos W, = -tan L tan S) is given by:

344
cos w- cos Ws sin Ws - Ws cos W,
Liu and Jordan derived direct irradiance on a horizontal surface as:
IDh = ITh - Idh
(2)
Kusuda and Ishii (1977) noted anomolous high values of predicted ITh near sunrise and sunset with the Liu and Jordan method. Therefore, they modified the Liu and Jordan method by first modeling direct normal radiation as:
IDn = A exp [-(B/cos 8 h) 1 where A = (KrKd)f, and f is a coefficient tabulated in Kusuda and Ishii by month and latitude. The term 8 h is solar zenith angle, and B is an atmospheric extinction coefficient, also tabulated in Kusuda and Ishii. Values of direct irradiance IDh on a horizontal surface were then evaluated as:
IDh = IDn cos 8h
and
ITh = IDh + Idh
where Idh was calculated by equations (1) and (2) .
Unshaded house. I used the general method of Kusuda and Ishii (1977) to model average hourly irradiance on the representative house for each month of the year. Values of average solar declination S, B, f, KT, Kd and H. were obtained from Kusuda and Ishii. For vertical surfaces, the values of hourly irradianee lTv were derived following ASHRAE (1977) by assuming a uniform distribution of radiance from the sky and that radiation Iu reflected from the ground is perfectly diffused in all directions:
lTv = IDn cos 8. + Idh/2 + " ITh/ 2
where 8 v is the angle of incidence between incoming direct beam rays and a normal to the particular vertical surface. (Kaufmann and Wheatherred, 1982, provide a good discussion of solar geometry for calculating incidence angles.) In January and February, I assumed an increase in average ground albedo" to 0.4 because of snow cover, whereas Kusuda and Ishii assumed an a of 0.2 throughout the year. For areas of the south and east and west walls which the scale model showed to be shaded by architectural elements (the roof overhang), the term for direct irradiance on the vertical, IDv = IDn cos 8., was omitted. Throughout the day, diffuse irradiance on the walls would also be diminished slightly by the overhangs, but this was not taken into account.
For the roof surfaces with tilt t of 26', Id and Iu must be modified by the view factor of the roof for the sky and ground to evaluate average hourly sky diffuse irradiance Idr and reflected irradiance Iur on the roof (ASHRAE, 1977) as:

/d, C /dh(l + cos t) /., = " /Th(l - cos t)
345
Another assumption in this model is that solar radiation inputs to hori· zontal and south-facing surfaces are symmetrical around solar noon. Typically, an asymmetrical pattern fonns due to the tendency for cumulus cloud development during afternoons.
Insolation reductions by trees. Reductions in insolation on the house throughout the year by the trees in the different positions were modeled by assuming a constant reduction across the area shaded by the trees as evaluated by the shadow pattern model. Functions to express average fractional irradiance reductions r by the trees were derived from the results of the radiation measurements. The reduction, r, was assumed constant with solar altitude but variable with diffuse ratio, DR, and separate functions of r were used for trees in leaf and leafless and for walls and roof surfaces. The house radiation climate model was run for the shaded and unshaded house for a relatively cloudy location, State College, PA, and a relatively clear location, Grand Lake, CO (latitude 40 0 15'N,longitude 106°W, and elevation 2646 m), as well as several other locations near 40· latitude.
RESULTS
Sample tree density
The photographic method indicated that the sugar maples were visually more dense than the other two trees in both the leafless and in-leaf condition (Table I). However, because visual density does vary with tree size (Wagar et al., 1986). Norway maple equal in size to the smaller sugar maple most likely would have had about the same density. Average density of the crowns ('entire' in Table I) without leaves ranged from 44% to 53% of the in-leaf density.
The sample trees seem to be representative of their species. For leafless trees, Westergard (1982) found average visual density percentages of 44% of sky blocked for sugar maple and 39% for Norway maple, and Wagar et al. (1986) found average density of London planes equal in size to the sample tree in this study to be about 37%. These values are all similar to those of the sample trees in this study (Table I). Hence, the radiation reductions as measured for these sample trees should be characteristic of mid-size trees of these species.
The densities of the sample trees are in the mid- to high-denisty range when compared with other species. Westergard found leafless European birch (Betula pendula), with an average density of 48%, to be the most dense tree he found along the east coast; and the most dense of three species studied by Wagar et al. was Modesto ash (Fraxinus velutina 'Modesto') with an average density of about 50% for trees equal in size to the sample trees. At the other

346
extreme, density of leafless Kentucky coffeetrees (Gymnoc/adus dioicus) was about 27% (Wagar et al., 1986) and density of black walnut (Juglans nigra) was about 28% (Westergard, 1982).
Shadow patterns
A general impression of shade patterns in the cooling and heating seasons is obtained from shadow patterns on the model house on two design dates, 21 January and 21 July, for the three model trees (Fig. 2). The tree on the west shades considerably on 21 July and little on 21 January. The opposite pattern is seen for the shorter tree on the south. The taller tree provides a bit more shade in July; shade in January is only on the roof, which is minimally detrimental.
The patterns of shade throughout the year are better quantified by plots of area shaded throughout the day on the 21st of each month (Fig. 4). These plots show that the tree on the west maintains its advantage throughout June, July, August and September, which usually are cooling season months at 40' latitude .
M' OF UNPRl/NED SHORTER TREE '~:..rmiS HOUS£
SHADED TREE ON W£ST TREE ON Sot1TH .. DECEMBER 20
=: ~~:.acr . ... $OUTHWALl
-- WEST Arug .( .. ~ --- HORTli R F ."",.--
JANUARY 20 NOVEMBER .'-.- //,,~ ......., \ .. ..
FEBRUARY ..
OCTOBER 20 --,,"'_. ~:::::::::::.:~ "-'-' .: eo
MARCH .. SEPTEMBER
20
-, , I , I
" I -7!..~"'" : 1/" ......,
APRil .. AUOUST 20
/x I ,
:) , • . y". -.. eo
MAY .. JULY
20 .,[ ." ", Ito.
.~!. . -.."),. ...
eo JUHE ..
20 .f: " ~_.
TAU PfNNED TREE ON SOUTH
~ I? \\ ~
~
/ .~
........ ..
. ... ... ... 12 ,. ,. " 20 • 10 12 14 " I 10 12 14 "
Fig. 4. Area oC house shaded during the 21st day of each month.

347
Radiation measurements
Dates and times of radiation measurements, ground surface and sky condi-tions, and whether the trees were in leaf are indicated in Table II. Data for a measurement period as short as 1 \h h are included because they show con-
TABLE II
Percentage reductions of average irradiance on the south facing 'wall' by the four sample trees along with tree, sky. and ground conditions; the same information for 1 day with the 'wall' facing west is also included (#)
Date Time of Ground Diffuse Surface, Percentage reduction measurements albedo ratio phenology. (Solar time) mean mean sky Average for 'waU' Center of
All points Shade only 'wallt-noon
Norway maple 1/ 29 10.20-12.40 0.80 0.24 • ,0 16 34 40 4 /02 08.40-16.00 0.18 0.13 G, o 15 30 37 7 /2 1 09.57-16.40 0.14 G • , 31 75 82
1/29 12.50-14.20 0.68 0.86 • ,0, PC 12 18 19 7/07 10.19-16.19 0.20 0.54 G, . , PC 30 67 74 7/15 08.28-15.18 0.21 0.61 0, . , PC 32 63 72
London plane 3/03 09.51-15.34 0.73 0.19 • , 0 20 31 47 4/01 09.30-16.48 0.20 0.14 G, o 19 31 52 6/23 07.54-15.42 0.24 0.26 G, . 38 65 72 6/25 08.01-14.21 0.15 0.21 G, • 32 67 80 7 /14 08.00-12.00 0.23 0.18 G, . 47 68 82 7/13# 11.00-18.16 0.23 0.21 G, . 56 72
1/20 09.60-14.40 0.42 0.46 • ,0, PC 16 26 40 6/16 08.34-12.04 0.24 0.52 G, . , PC 40 64 74 9/24 10.11-15.01 0.19 0.56 G, . , PC 50 67 79
Smaller sugar maple 4/26 07.54-15.06 0.23 0.22 G, o 14 33 44 6/09 07.44-13.24 0.23 0.21 G, • 34 69 80
10/19 08.43-15.33 0.22 0.15 G, . 50 85 90
3/30 09.09-16.49 0.24 0.53 G, O, PC 17 37 4/13 11.33-15.33 0.23 0.93 G, O, PC 12 17 29 7/16 08.48-13.29 0.19 0.60 G, . , PC 37 64 70
Larger sugar maple · 2/02 10.20-16.20 0.77 0.34 • , 0, PC 35 44 66 3/31 12.09-16.09 0.17 0.24 G, o, PC 30 46
-,snow cover; G, grass surface; 0, no leaves on tree; . , tree in leaf; PC, partly cldoudy, -, not sufficient data

,
34"
trasts between different sky conditions, but for other days, analyzed data were measured over periods from 4 to 8 h long. The shorter periods occurred because portions of some days were excluded to derive measurement sets for relatively uniform cloud conditions.
lrradiance reductions. Plots of irradiance measured on 26 April 1983 before leaves had appeared and on 19 October 1982 while leaves were still on the smaller sugar maple tree illustrate patterns of irradiance during measure· ments (Fig. 5) . Values of irradiance Rvw on the six pyranometers on the 'wall', averaged over several hours as the shadow moved across them, approximate irradiance on an actual wall. Reductions of irradiance within shade (1 - RvsfRo in Fig. 6) must be averaged over at least half a day to obtain valid averages.
At most times, the upper and lower pyranometers at the three horizontal distances on the 'wall' were similarly irradiated. Upper and lower pyranom· eter measurements were averaged to evaluate relative irradiance on different parts of the 'wall' during the day (Fig. 7). On 26 April and 19 October and on most other measurement days, irradiance on pyranometers that were outside the shadow and on the sun side of the tree (the pyranometers on the east end of the 'wall' in the morning and on the west in the afternoon) was
" , E ~
900 APRIL 26, 1983 . Rg OCTOBER 19, 1982
0" 00
• -' . . ' 800 '-
700
600
500
400
300
200
100
.' . -' ... .••• . R .... .. · ···· .. . :·· . . 0
.'
R~· ... · ..
, :i Rys
. ' ! R :::: ::::::; ~ l:IJ :~::::~::.':X: :~Rd o L-~~--~~~--~~--~--~~~--~~~~~
9 10 11 12 13 14 15 9 10 11 12 13 14 15
SOLAR TIME SOLAR TIME
Fig. 6. Irradiances during measurements on a day without leaves on the tree (26 April) and with leaves (19 October), Ten-minute averages of global radiation (R,), irradiance on the south-facing vertical in the open (Ro ), average irradiance on the six pyranometers on the 'wall' (Rvw ), average irradiance on points in shade (RvJ. radiaton reflected from the ground (Ru), and diffuse sky radiation on the horizontal (Rd).

1.0
0.9
0.8
0.7
0 0.6 ;:: 00( a: 0.5
0.4
0.3
0.2
0.1
0
-----,--OCTOBER 19, 1982
t:l. ex: .. : , .... . ................. . ........• : . .•.•...•...............•.
OR
9 10 11 12 13 14 15
~ RvwlRo ;-
. \ I ~-j L .... )
~• RYSIRO
: :::~: .. ····~·f · ........ /..\ .... .. o"·'rl. ••••
-_ \ 1" .-u::::::':. . _ . --
9 10 11 12 13 14 15
SOLAR TIME SOLAR TIME
• 349
Fig. 6. Ratios of irradiance, (RvwIRo. Rva/Ro), diffuse ratio (DRKRd /R,) . and albedo (a-RuIR,) on 26 April and 19 October.
1.1
1.0
0.9
0.8 w 0
0.7 z :5 c 00( 0.6 a: 5 w 0.5 > ;:: :I 0.4 w a:
0.3
0.2
0.1
0
EAST WEST
?-~-\, (0 ! ! \/ ~
I, ,1, r' . \;" ~ J lEAST •. ! WEST'! \ ~ \ it · .. · .. , · . . .
VCENTE~
. \~ST_ •• __ .,. __ W~~_'" ~\. _..... -,-,
)\ J i \ EAST / '.
j : I
WESTI
I
; OCTOBER 18, 1982
CENTER
APRIL :!S, 1983 ---'-- -'------I _ _ ...J _ _ I _ _ 1_ ...L-L._. I I . L - .1.,- 7;;- ::-:--.,.;--'
15 9 10 11 12 13 14 15 8 10 11 12 13 14
SOLAR TIME SOLAR TIME Fie. 7. Ratios of average irradiance on two pyranometers at the east end, center, and west end of the 'wall' to Ro on 26 April and 19 October.

350
slightly higher than irradiance Ro in the open (up to about 5% higher with trees in leaf) . While these pyranometers received less diffuse sky radiation because of the tree, beam radiation was reflected from the tree crown to more than make up for the blocked sky radiation .
On clear days (DR ';0.25), the average reduction on the wall in the shade of leafless trees ranged from 30% to 34% while the average reduction in the shade of the trees in leaf ranged from 65% to 85% (Table II, Fig. 8) .
Irradiance reductions in the center of the shade at noon represent maximum reductions by the trees. The average reductions of irradiance on the center pyranometers for the time period one-half hour before to one-half hour after solar noon are shown in Table II. Reductions in the center of the shade of the leafless trees ranged from 37% to 52% on clear days - 6-21 percentage points higher than reductions averaged over the entire shade patterns. (The leafless larger sugar maple had an even larger reduction, 56%, in the center of its shade on a very hazy day.) Reductions in the center of the shade of the trees in leaf ranged from 72% to 90% on clear days - 5-14 percentage points higher than reductions averaged over the shade patterns.
In general, percentage reductions of irradiance during quite cloudy days were less than on clear days (Fig. 8), because beam radiation was a smaller proportion of total irradiance, and the trees blocked less sky radiation than beam radiation. However, with thin cirrus clouds or haze (DR up to about 0.55 in this study), the distribution of sky radiance is changed little from the clear sky distribution (Norman, 1975), and reductions were similar to reduc-
w () Z 1 •• S 0 < .9 0: 0: s
.8 LL 0 Z .7 0 ;:: ()
.S
" 0 •• W 0: • • -'~ " I--::;®---~J' s r •. ~9- .2.4 · DR2
, rys® 0.3 N'"
t; < .2 0: LL W .1
N
" . ~ L-~~~~~_~~_~~_~~
w 0 .1 .2 .3 .4 .5 .8 .7 .8 .9 1.0
~ DIFFUSE RA no Fig. 8. Average reduction of irradiance in tree shade on the south-facing 'wall ' on 11 days of meuurements with bare-branch trees and 12 days with trees in leal. Curves indieate regre&8ions for mid-sized sugar maple (S), Other trees are a large lugar maple (B), 8 London plane (L), and a Norway maple (N), Circles indicate days with snow on the ground.

351
tions on the clear days. The leafless smaller sugar maple actually showed a larger reduction with a partly cloudy sky than with a clear sky.
A snow cover and resulting high albedo (" = RulRg) might be expected to cause percentage reductions of irradiance by the trees to be small, because the radiation reflected from the ground might be less affected by the tree than other radiation fluxes to the wall. On days without snow, " averaged between 0.15 and 0.24, while on days with snow cover, average" was as high as 0.80 (Table II). However, when clear days with snow on the grouna are compared to days without snow (Table II), reductions in average irradiance in shade are about the same. Comparisons of reductions with and without snow cover are somewhat confounded by different solar geometry and resulting different transmission paths for beam radiation on days with snow and days without snow. The days with snow occurred early in the year when solar azimuths varied over a small range and solar elevation angles were small. Nevertheless, the results suggest that the tree crowns reduced the reflected component of radiation flux to the 'wall' by nearly the same percentage with or without snow. Had the wall been farther from the tree, there might have been significantly smaller reductions with snow on the ground.
Reduction factors. Average reduction in irradiance across the shade pattern was required for modeling radiation reductions by the representative tree crowns through the year. The measured values of average reduction in irradiance (Fig. 8) are somewhat bunched around a few values of DR. A number of factors, previously discussed, account for the variation within trees at similar values of DR. Although there are only three days of measurements and a fair amount of scatter in the data for the smaller sugar maple in each of the conditions in-leaf and leafless, by using just these three points (justification follows) in regression equations, I derived reasonable relationships between irradiance reduction r and DR for the mid-size sugar maple. For the in-leaf condition, the curve plotted in Fig. 8 is given by:
r = 0.79 - 0.42 DR'
and for the leafless trees:
r = 0.39 - 0.24 DR'
These relationships for r were assumed for modeling radiation reductions by the representative tree crowns on both south- and west-facing vertical surfaces. A more precise model would account for somewhat higher average r for the west-facing wall because it is shorter than the south-facing 'wall' on which the irradiance measurements were made. Reductions become smaller with distance from the tree (Fig. 7).
The roof surfaces are more nearly horizontal than vertical, and for both north- and south.facing surfaces, the same reduction factors were used. Previous measurements (Heisler, 1982) on both horizontal and vertical surfaces in the shade of the Norway maple tree showed reductions on horizontal sur-

352
faces to be somewhat higher than those on vertical surfaces because vertical ' surfaces receive radiation reflected from the ground. Hence, r values were derived by assuming a constant 0.05 greater reduction by the in-leaf trees on the roof than on walls and 0.02 greater reduction by the leafless trees on the roof than on walls. Again, a more precise model would vary r with distance from the tree, and r for the north roof should quite likely be less than r for the south roof.
The above functions for r for a 'representative' tree seem reasonable in light of other measurements. Although in Fig. 8 the measured irradiance reduction in tree shade is not clearly a function of DR', previous measurements of radiation reductions on horizontal surfaces in the center of tree shadows (Heisler, 1982) generally showed a significant relationship to DR'. The reductions in the leafless condition are about half of the reductions by the trees in leaf, and this also conforms to results of other measurements (Heisler et al., 1981; Heisler, 1982; Youngberg, 1983).
Although there were no measurements at high values of DR for the in-leaf condition, consideration of the shape factor F (Monteith, 1973) of the tree from points on the wall suggests that the equations for r are reasonable at high DR. When the sky is overclSt, DR is essentially equal to 1.0, and radiation from the sky approaches a uniform distribution. The average reduction in radiation at points on the wall would then be about equal to 2F times density of the crown. The average F of the crown at the six pyranometer locations on the wall was about 0.235 as derived from photos with a fisheye lens with orthographic projection. For the sugar maple crown in leaf, density X 2F = 0.87 X 0.47 = 0.41, for a predicted r at DR = 1 that is just slightly higher than the value of 0.37 predicted by the regression equation. Likewise for the leafless sugar maple, 0.40 X 0.47 = 0.19, just slightly higher than r predicted by the regression for the leafless condition.
For the wall areas near the tree that are shaded by the roof overhang, irradiance from the sky would be reduced by the tree to some extent. This reduction would be approximately proportional to the average view factor of the tree from points on the wall, and could be so modeled. However, par· ticularly with trees in leaf, radiation reflected from the tree crown into the area shaded by the overhang would augment irradiance there. Since these two effects would tend to cancel each other, the sky irradiance in shade of the overhang was assumed to be unaffected by the trees.
Solar radiation climate of representative house
The quantities of insolation on different house surfaces through the year (Fig. 9) suggest where it is important to provide shade in summer and solar access in winter. More insolation is predicted for the unshaded house in the more sunny Grand Lake than in State College throughout the year, but during winter months the difference in insolation is greater. Insolation on the south·facing wall does not change much throughout the year in State

•
353
MONTH MONTH
Fig. 9. Total monthly insolation on surfaces oC representative house in State Collage, PA and Grand Lake, CO.
College, while in Grand Lake, winter skies are relatively clear and insolation on the south wall is double that in summer. It is of interest to note that in May, June and July the model predicts that the north wall receives about the same quantity of insolation as the south wall. The insolation values for houses of other architectural designs would vary from these values. For example, particularly in summer, the width of the roof overhang would influence insolation on the south wall.
Although insolation on roof surfaces is greater than on walls, the wall surfaces are generally more important for heat input to a house because of the presence of windows and because walls generally do not provide as much insulation as the combination of roof I attic space, and insulation between attic and living space. In addition, insulation can usually be added as a retrofit between attic and living space easier than in walls. In summer I it is more important to shade the west wall than the south wall because of the greater insolation on the west wall. The difference between west and south walls would be even greater, of course, if the house had been oriented north/south rather than east/west. The east/west orientation was modeled because it is closer to optimum in utilizing solar radiation (Olgyay, 1963).
When shade on all house surfaces is considered, the tree on the west reduces insolation much more in June and July and much less from November through March than either of the trees on the south (Fig. 10). The trees on the south do reduce insolation considerably in August, September and October. (Leaves were retained on the sugar maple through most of October, and the in-leaf reduction factor was used without modification. Some leaves were also retained into early November, but the reduction factor for leafless
•

354
Mr-----~~~----_r----~----------~---------------r ... on _., T,.. on South '"""""' T ...
. ."" COU"' . " / ~ ...... ! " " •
i : /;.:., \. =C'-c f/r "':: ~/ i ~, J)- -=,\ \,~-c 1/./ \L.." '\/¥ / ."'. " /?/_.- .' . . ~;\ '-'-"~~'/ .-. ./ "-~ 0 .-- . -..¥EsT.lT'nC w~.,~_w .-0_,,_" • ..-/-----...... , _
~ g " • • M
g " • ~ " ~ ~ .
GRANO LAI(E. CO /
~ : ~ ~/"t ~/I :4,~,~,~.~ .•. ~,=;.~.~"~n~--~u~~",-,~~:;.~.~,~~~~ •• ~"~n.~);,/~:~/~,'~~~.:;~~,;~~.~ ... "~n--~~
"""'" Fig. 10. Sum of reductions of insolation on surfaces of the representative house by tree crowns in three different positions in State College, PA and Grand Lake, CO.
trees was used for November.) Throughout the year the taller pruned tree reduces insolation on the roof much more than on the south walL
To better quantify the relative value of the representative tree crowns in the different positions in providing shade on the house, the year was divided into an assumed heating season from November through April, and an assumed cooling season from June through September. At most locations in the U.S.A. near 400 N latitude, the months of June, July and August are distinctly within a cooling season, on the basis of relative numbers of heating and cooling degree days (base lS.3°C), while November through April are distinctly heating season months. In most locations, September has about the same number of heating and cooling degree days, but normal high temperatures are 24-27°C and daytime shade is often desirable. Hence, September was included in the cooling season . May and October were considered transition months and not included in either season. Although May averages more heating than cooling degree days, normal high temperatures at most locations at this latitude are a mild 21-23°C. October might well have been included in the assumed heating season on the basis of relative heating and cooling degree days but even in this month, normal high temperatures are

355
TABLE III
Predicted insolation on a rerepresenlative house in assumed heating (November through April) and cooling (June through September) seasons at two locations near 40 0 N latitude with different radiation climates (units : GJ)
Season State College, PA Grand Lake, CO
Living Roof West Total Living Roof West Total space attic house lipace attic house walls wall walls wall
West South West South
Heating 27 51 191 10 333 38 78 268 13 448 Cooling 33 33 266 12 413 37 36 298 13 459 Entire
year 73 103 566 27 922 90 135 690 32 1125
TABLE IV
Predicted insolation reductions by trees on a representative house in assumed heating (November through April) and cooling (June through September) seasons at two loca-tions near 400N latitude with different solar radiation climates
Season State College, PA Grand Lake, CO
Unpruned tree Pruned Unpruned tree Pruned tree on tree on
On "south On west south On south On west south
Total house Heating (OJ) 22.2 6.3 20.6 36.2 9.8 32.4 Cooling (GJ) 16.6 2B.7 25.1 20.0 32.7 30.1 Cooling/Heating 0.74 4.56 1.22 0.55 3.34 0.93
Living space walls Heating (GJ) 7.1 2.6 2.3 11.9 4.2 3.8 Cooling (GJ) 5.9 10.6 4.9 7.2 12.4 5.8 Cooling/Heating 0.83 4.08 2.13 0.60 2.96 1.53
generally in the range of 16-20°C in most locations at 40oN, and daytime shade would not be especially detrimental. Grand Lake with Its high elevation has an atypical temperature regime with no cooling degree days, though its radiation regime may be typical of some lower elevations. Methods are available for more precise definition of heating and cooling seasons (Olgyay, 1963; McPherson, 1981; Loftness, 1982); and for managing trees for optimum shade at a particular location, such methods should be used.
Table III summarizes the sums of insolation on walls, attic space, and entire house in the assumed heating and cooling seasons. An efficient tree

356
TABLE V
Reduction in insolation by trees on a representative house in assumed heating (November to April) and cooling (June through September) seasons as 8 percentage of total insolation on the entire house and on walls
Season State College, PA Grand Lake, CO
Unpruned tree Pruned Unpruned tree Pruned tree on tree on
On south On west south On south On west south
Total house Heating (%) 6.7 1.9 6.2 7.7 2.1 6.9 Cooling(%) 4.0 6.9 6.1 4.4 7.1 6.6 Cooling/Heating 0.60 3.6 1.0 0.67 3.4 0.96
Reductions on walls as percentage of total insolation on all walls Heating (%) 5.8 2.1 1.9 6.9 2.6 2.2 Cooling(%) 4.8 8.6 3.9 5.3 9.2 4.3 Cooling/Heating 0.83 4.1 2.1 0.77 3.7 2.0
arrangement would yield a high ratio of cooling season to heating season insolation reductions. These ratios for the unpruned tree on the west in State College are greater than 4 when both the total house and only the living space walls are included (Table IV)_ The ratios are less than 1 for the unpruned tree on the south. The pruned tree is somewhat better than the unpruned tree on the south and produces ratios greater than 1 except when the whole house is considered in Grand Lake (Table IV). Cooling-to-heatingseason ratios are greater in State College than in Grand Lake because of the lesser winter insolation in State College. Cooling-to-heating-season ratios calculated in the same way for some other locations at 40' latitude were generally intermediate between State College and Grand Lake. For example, Ely, NV and Lincoln, NE had ratios just slightly higher than Grand Lake, while ratios for Columbus, OH, and New York City were similar to ratios for State College.
Table V indicates the relative magnitude of the effect of the single trees in different positions on total insolation on the house. The tree on the west reduced total insolation on the house by about "'/% and insolation on walls by about 9% during the cooling season.
CONCLUSIONS AND APPLICATION
Several conclusions can be drawn from the irradiance measurements on vertical surfaces. The measurements confirm that reductions by leafless deciduous trees are substantial on vertical as well as horizontal surfaces. In the shade of trees without leaves, the average reduction of irradiance on the south-facing wall beside three sample trees of three different species was

.357
about one-half of the reduction when the trees had· leaves. Previous measure· ments indicate that reductions of inadiance on horizontal surfaces are generally a few percentage points higher than on vertical surfaces. For vertical surfaces close to the tree, changes in ground albedo due to snow do not seem to greatly affect the percentage of irradiance reduction by trees with 2-m clear boles.
The method of determining tree crown density by projecting slide photographs onto a grid of fine lines seems to provide a useful index of average irradiance reductions under clear skies . Irradiance reductions on vertical surfaces in tree shade were generally less than the density estimates, but usually only about 5 percentage points less. In both determination of tree crown density and in measuring average irradiance reductions, the whole crown must be considered and care must be exercised in defining the edge of the crown because of the difference in density from center to edge.
,
The measurements and radiation climate model quantify the relative shade value of mid-sized trees close to the south and west walls of a typical small house at 40'N latitude, and indicate that a deciduous tree can provide greater insolation reductions in the heating season (winter) than in the cooling season (summer) of temperate climates. While sugar maple tree crowns were modeled as 'representative' I ratios of total heating to cooling season reductions would have been similar for the other species for which inadiance reductions were measured: London plane and Norway maple . The position of the unpruned tree on the south was selected to provide a large amount of winter shade, but an even worse position would be about 6 m farther towards the south, where the tree would provide no shade during June, July or August, while still providing much shade in winter.
The potential negative effects of trees on the south may be somewhat smaller than this analysis indicates because costs per energy unit for cooling are greater than for heating and because solar input to walls is somewhat less effective in winter than in summer owing to higher wind speeds in winter. Further, the caution against trees on the south pertains primarily to airconditioned buildings. For buildings that are not air conditioned, maximization of summer shade without regard for winter insolation reductions may be the best design. Cooler interior temperatures in summer may be well worth extra heating costs in winter, and the maximization of summer shade may obviate the need to install air conditioning.
Trees on the south are particular problems for owners of bulldings with solar collectors. Research coordinated by Thayer (Thayer, 1983; Thayer et aI., 1983; Thayer and Maeda, 1985) has documented potential costs of blocking solar access and has suggested plans for street tree planting to minimize blockage. The potential negative effects of trees on the south are greater in less cloudy climates.
Magnitude of radiation reductions would vary with tree density. Average density increases with tree size until trees become mature. Sugar maple is one of the most dense species both in leaf and leafless. Norway maple pro-

358
vides about the same amount of shade as sugar maple, while London plane provides somewhat less shade. It has been suggested that some species may provide large amounts of summer shade, but little shade after leaves have fallen. However, most species with sparse branching patterns probably also will have sparse amounts of foliage. Species may be selected for optimum leaf-out and leaf-faIl dates (McPherson, 1981; Halverson et al. , 1986, this issue) to correspond to the cooling season.
In future research, methods could be devised to more easily model shade patterns. Models of mUltiple crowns and long-wave energy exchange (Norman and Welles, 1983) could be incorporated with building heat load models (Schiler and Greenberg, 1979), and the effects of landscape vegetation over the life cycle of the buildings and vegetation in different climates could be considered. The vast number of residential building units that might benefit from "precision landscaping" (Parker, 1983) justify such efforts.
ACKNOWLEDGEMENTS
S.B. Gleason, R.E. Lloyd and S.L. Keown assisted with data collection and analysis. Support for S.L_ Keown was arranged by D.A. Montgomery through the Laboratory for Environmental Design and Planning at The Pennsylvania State University. Helpful review comments on the manuscript were provided by E.G. McPherson and R . Thayer.
REFERENCES
ASHRAE, 1977. ASHRAE Handbook 1977, Fundamentals. American Society of Heating, Refrigerating, and Air Conditioning Engineers, New York, NY, 746 pp.
DeWalle, n.R., Heisler, a.M. and Jacobs, R.E., 1983 , Forest home sites influence heating and cooling energy. J, For., 81: 84-88.
Foster, RB., 1978. Homeowner's Guide to Landscaping that Saves Energy Dollars. David McKay. New York, NY. 184 pp.
Halverson, RG., Gleason, S.B. and Heisler, a.M., 1986. Leaf duration and the sequence of leaf development and abscission in northeastern urban hardwood trees . Urban Ecol., 9: 323-335.
Heisler , O.M., 1982. Reductions of solar radiation by tree crowns. In : B.H. Glenn and W.A . Kolar (Editors), The Renewable Challenge. Proc. 1982 Annu. Meet. American Section of International Solar Energy Society, 1-15 June 1985 , Houston , TX. American Solar Energy Society, New York, NY, pp. 133-138.
Heisler, a.M., 1985. Measurements of solar radiation on vertical surfaces in the shade of individual trees. In : B.A. Hutchinson and B.B. Hicks (Editors), The Forest-Atmo· sphere Interaction: Proc. Forest Environmental Measurements Con!., 23-28 October 1983, Oak Ridge, TN. Reidel, Dordrecht. The Netherlands, pp. 319-335 .
Heisler, C.M., Halverson, H.G. and Zisa, R.P., 1981. Solar radiation measurements beneath crowns of open-grown trees. In: Ext. Abstr. , 15th Con!. Agriculture and Forest Meteorology and 5th Conference on Biometeorology. 1-3 April 1981, Anaheim, CA. American Meteorology Society, Boston, MA, pp. 162-165.
Kaufmann, M.R. and Weatherred, J.D., 1982. Determination of potential direct beam solar irradiance . U.S . For . Servo Res. Pap. RM-242, 23 pp.

359
Kern, K., 1975. The Owner Built Home, Scribner's New York, NY. 374 pp. Kusuda, T. and Ishii, K.. 1977. Hourly solar radiation data for vertical and horizontal
surfaces on average days in the United States and Canada . Building Science Series. 96. National Bureau of Standards, Washington, DC, 405 pp.
Liu, B.Y.H. and Jordan, R.D., 1963. A rational procedure for predicting the long·term average performance of flat-plate solar energy collectors. Sol. Energy. 7: 53-74.
Loftness, V.E., 1982. Using climate /energy graphics to establish energy~onscious design priorities. In: J. Hayes and C.B. Wino (Editors), Proc. 7th National Passive Solar Conf., 30 August-l September 1982, Knoxville, TN. American Solar Energy Society, New York, NY, pp. 171-176.
McPherson, E.G., 1981. A methodology for locating and selecting trees for solar control in Utah. In: B.H. Glenn and G.E. Franta (Editors), Proc. 1981 Annu. Meet. American Section of International Solar Energy Society, Newark, DE. American Solar Energy Society, New York, NY, pp. 72-76.
Monteith, J.L., 1973. Principles of Environmental Physics. Edward Arnold. London, 241 pp.
Morrison, J.W. (Editor), 1981. Home Energy Cost-Cutting Guide for Pennsylvania (1982 Edition). Pennsylvania Governor's Energy Council, Harrisburg, PA, 144 pp.
Neubaurer, L.W. and Oamer, R.D., 1966. Solar radiation control for small exposed houses. Trans. ASAE, 9: 194-197.
Norman, J.M., 1975. Radiative transfer in vegetation. In: D.A. de Vries and N.H. Afgan (Editors), Energy Exchange in the Biosphere. Scripta Book Company, Washington, DC, pp. 187-205.
Norman, J.M. and Welles, J.M., 1983. Radiative transfer in an array of canopies. Agron. J., 75: 481-488.
Novell, B., 1981. Low cost model stand and sunpath simulator. In: Proc. International Passive and Hybrid Cooling Conf., Miami Beach, FL. American Section of International Solar Energy Society. New York, NY, pp. 387-391.
Olgyay, V., 1963.:Design with Climate. Princeton University Press, Princeton, NJ, 190 pp. Parker, J.H., 1983. Landscaping to reduce the energy used in cooling buildings. J. For.,
81: 82-84, 105. Schiler, M. and Greenberg, D.P., 1979. Computer simulation of foliage in building energy
loads. In: Proc. 16th Annu. Design Automation Conf., Institute of Electrical and Electronics Engineers, New York, NY, pp. 142-148.
Smay, V.E., 1979. For solar designers: an inexpensive cut-and-paste shadow plotter. Pop. Sci .. 215(5): 144.
Thayer, R.L., 1983. Solar access and the urban forest. Arboric. J., 7: 179-190. Thayer, R.L., Jr. and Maeda, B.T., 1985. Measuring street tree impact on solar per
formance: a five-climate computer modeling study. J. Arboric., 11: 1-12. Thayer, R.L., Jr., Zanetto, J. and Maeda, B.T., 1983. Modeling the effects of street trees
on the performance of solar and conventional houses in Sacramento, California. Landscape J., 2: 165-166.
Wagar, J.A., Heisler, G.M. and Atkinson-Adams, D., 1986. A photographic procedure for rating winter shade of deciduous trees. Landscape J., 5: 9-18.
Westergard, C.J., 1982. The relative ability of various shade trees to block or filter direct solar radiation in the winter. Unpublished Master of Landscape Architecture Thesis, Cornell University, Ithaca, NY, 62 pp.
Youngberg, RJ .• 1983. Shading effects of deciduous trees. J. Arboric., 9: 295-297.