EFFECTS OF HURRICANE FLOYD ON WATER LEVELS … · EFFECTS OF HURRICANE FLOYD ON WATER LEVELS DATA...
121
NOAA Technical Report NOS CO-OPS 027 EFFECTS OF HURRICANE FLOYD ON WATER LEVELS DATA REPORT Silver Spring, Maryland January, 2000 noaa National Oceanic and Atmospheric Administration U.S. DEPARTMENT OF COMMERCE National Ocean Service Center for Operational Oceanographic Products and Services Products and Services Division
Transcript of EFFECTS OF HURRICANE FLOYD ON WATER LEVELS … · EFFECTS OF HURRICANE FLOYD ON WATER LEVELS DATA...
NOAA Technical Report NOS CO-OPS 027
EFFECTS OF HURRICANE FLOYD ON WATER LEVELSDATA REPORT
Silver Spring, MarylandJanuary, 2000
noaa National Oceanic and Atmospheric Administration
U.S. DEPARTMENT OF COMMERCENational Ocean ServiceCenter for Operational Oceanographic Products and ServicesProducts and Services Division
Center for Operational Oceanographic Products and ServicesNational Ocean Service
National Oceanic and Atmospheric AdministrationU.S. Department of Commerce
The National Ocean Service (NOS) Center for Operational Oceanographic Products and Services(CO-OPS) collects and distributes observations and predictions of water levels and currents to ensuresafe, efficient and environmentally sound maritime commerce. The Center provides the set of waterlevel and coastal current products required to support NOS' Strategic Plan mission requirements, andto assist in providing operational oceanographic data/products required by NOAA's other StrategicPlan themes. For example, CO-OPS provides data and products required by the National WeatherService to meet its flood and tsunami warning responsibilities. The Center manages the NationalWater Level Observation Network (NWLON), and a national network of Physical OceanographicReal-Time Systems (PORTS) in major U.S. harbors. The Center: establishes standards for thecollection and processing of water level and current data; collects and documents user requirementswhich serve as the foundation for all resulting program activities; designs new and/or improvedoceanographic observing systems; designs software to improve CO-OPS' data processingcapabilities; maintains and operates oceanographic observing systems; performs operational dataanalysis/quality control; and produces/disseminates oceanographic products.
NOAA Technical Report NOS CO-OPS 027
EFFECTS OF HURRICANE FLOYD ON WATER LEVELSDATA REPORT
Chris Zervas, Scott Duncan, Dale Deitemyer, James Hubbard, Janet Culp, Thomas Landon, Michael Connolly, Darren Wright, Richard BourgerieJanuary, 2000
noaa National Oceanic and Atmospheric Administration
U.S. DEPARTMENT National Oceanic and National Ocean ServiceOF COMMERCE Atmospheric Administration Nancy M. FosterWilliam Daley, Secretary D. James Baker, Under Secretary Assistant Administrator
Center for Operational Oceanographic Products and ServicesDirector, Richard M. Barazotto

ii
NOTICE
Mention of a commercial company or product does not constitute anendorsement by NOAA. Use for publicity or advertising purposes ofinformation from this publication concerning proprietary products or thetests of such products is not authorized.

iii
TABLE OF CONTENTS
List of Tables . . . . . . . . . . . . . . . . . . . . . . . . . . . . . . . . . . . . . . . . . . . . . . . . . . . . . . . . . . . . . . . . iv
List of Figures . . . . . . . . . . . . . . . . . . . . . . . . . . . . . . . . . . . . . . . . . . . . . . . . . . . . . . . . . . . . . . . . v
List of Acronyms and Abbreviations . . . . . . . . . . . . . . . . . . . . . . . . . . . . . . . . . . . . . . . . . . . . . . ix
I. Introduction . . . . . . . . . . . . . . . . . . . . . . . . . . . . . . . . . . . . . . . . . . . . . . . . . . . . . . . . . . . . . . . . . 1
II. Description of Hurricane Floyd . . . . . . . . . . . . . . . . . . . . . . . . . . . . . . . . . . . . . . . . . . . . . . . . . 3
III. The National Water Level Observation Network . . . . . . . . . . . . . . . . . . . . . . . . . . . . . . . . . . . 9
IV. Maximum Observed Elevations . . . . . . . . . . . . . . . . . . . . . . . . . . . . . . . . . . . . . . . . . . . . . . . 13
V. Storm Surge . . . . . . . . . . . . . . . . . . . . . . . . . . . . . . . . . . . . . . . . . . . . . . . . . . . . . . . . . . . . . . . 19
VI. Meteorological Data . . . . . . . . . . . . . . . . . . . . . . . . . . . . . . . . . . . . . . . . . . . . . . . . . . . . . . . . 31
VII. Currents near Hampton Roads, VA . . . . . . . . . . . . . . . . . . . . . . . . . . . . . . . . . . . . . . . . . . . 41
VIII. Operation of the Real-Time Monitoring System . . . . . . . . . . . . . . . . . . . . . . . . . . . . . . . . . 47
IX. Internet Dissemination of Storm Surge Data . . . . . . . . . . . . . . . . . . . . . . . . . . . . . . . . . . . . . 49
X. Coordination with Federal and State Agencies . . . . . . . . . . . . . . . . . . . . . . . . . . . . . . . . . . . . 53
XI. Summary . . . . . . . . . . . . . . . . . . . . . . . . . . . . . . . . . . . . . . . . . . . . . . . . . . . . . . . . . . . . . . . . 55
Acknowledgments . . . . . . . . . . . . . . . . . . . . . . . . . . . . . . . . . . . . . . . . . . . . . . . . . . . . . . . . . . . . 57
References . . . . . . . . . . . . . . . . . . . . . . . . . . . . . . . . . . . . . . . . . . . . . . . . . . . . . . . . . . . . . . . . . . 59
Appendix I. Data Tables . . . . . . . . . . . . . . . . . . . . . . . . . . . . . . . . . . . . . . . . . . . . . . . . . . . . . . . 61
Appendix II. Time series of observed water level and predicted tide . . . . . . . . . . . . . . . . . . . . . 67
Appendix III. Time series of storm surge . . . . . . . . . . . . . . . . . . . . . . . . . . . . . . . . . . . . . . . . . . 85
Appendix IV. Time series of wind speed and barometric pressure . . . . . . . . . . . . . . . . . . . . . 103

iv
List of Tables
Table 1. Hurricane Floyd weather advisories from the NOAA National Hurricane Center . . . . . 3Table 2. Maximum observed water level . . . . . . . . . . . . . . . . . . . . . . . . . . . . . . . . . . . . . . . . . . 14Table 3. NWLON stations with new maximum observed water levels . . . . . . . . . . . . . . . . . . . 15Table 4. Greatest timing differences of the maximum observed water levels relative to
predicted high tide . . . . . . . . . . . . . . . . . . . . . . . . . . . . . . . . . . . . . . . . . . . . . . . . . . . . . 16Table 5. Maximum storm surge . . . . . . . . . . . . . . . . . . . . . . . . . . . . . . . . . . . . . . . . . . . . . . . . . 21Table A. Hurricane Floyd weather advisories from the NOAA National Hurricane Center . . . 62Table B. Location and period of record for NWLON stations . . . . . . . . . . . . . . . . . . . . . . . . . . 65

v
List of Figures
Figure 1. Track of Floyd from September 7 to September 17,1999 . . . . . . . . . . . . . . . . . . . . . 5Figure 2. Hurricane Floyd maximum wind speed and minimum pressure . . . . . . . . . . . . . . . . 5Figure 3. NOAA-15 AVHRR multi-spectral false color image of Hurricane Floyd at peak
strength . . . . . . . . . . . . . . . . . . . . . . . . . . . . . . . . . . . . . . . . . . . . . . . . . . . . . . . . . . . . 6Figure 4. GOES-8 colorized IR image of Hurricane Floyd making landfall near Cape
Fear, NC . . . . . . . . . . . . . . . . . . . . . . . . . . . . . . . . . . . . . . . . . . . . . . . . . . . . . . . . . . . 6Figure 5. Total rainfall for September 14-17, 1999 . . . . . . . . . . . . . . . . . . . . . . . . . . . . . . . . . . 7Figure 6. SeaWiFS image showing flooded rivers of eastern North Carolina . . . . . . . . . . . . . . 7Figure 7. Northern U.S. Atlantic coast NWLON stations with the track of Hurricane Floyd . 11Figure 8. Southern U.S. Atlantic coast NWLON stations with the track of Hurricane Floyd . 11Figure 9. Comparison of historical maximum observed elevations to the maximum
observed elevations during Hurricane Floyd . . . . . . . . . . . . . . . . . . . . . . . . . . . . . . 17Figure 10. Landfall location map of the U.S. for all hurricanes during 1899-1996 . . . . . . . . . . 18Figure 11. Maximum storm surge at water level stations during Hurricane Floyd . . . . . . . . . . 22Figure 12. Hurricane Floyd storm surge at selected US Atlantic coast NWLON stations on
or close to the ocean . . . . . . . . . . . . . . . . . . . . . . . . . . . . . . . . . . . . . . . . . . . . . . . . . 23Figure 13. Hurricane Floyd storm surge at NWLON stations in Florida, Georgia, and the
Bahamas . . . . . . . . . . . . . . . . . . . . . . . . . . . . . . . . . . . . . . . . . . . . . . . . . . . . . . . . . . 24Figure 14. Hurricane Floyd storm surge at NWLON stations in North Carolina and South
Carolina . . . . . . . . . . . . . . . . . . . . . . . . . . . . . . . . . . . . . . . . . . . . . . . . . . . . . . . . . . 25Figure 15. Hurricane Floyd storm surge at NWLON stations in southern Virginia . . . . . . . . . 26Figure 16. Hurricane Floyd storm surge at NWLON stations in northern Virginia, Maryland,
and Washington, DC . . . . . . . . . . . . . . . . . . . . . . . . . . . . . . . . . . . . . . . . . . . . . . . . 27Figure 17. Hurricane Floyd storm surge at NWLON stations in Delaware, Pennsylvania, New
Jersey, and New York City, NY . . . . . . . . . . . . . . . . . . . . . . . . . . . . . . . . . . . . . . . 28Figure 18. Hurricane Floyd storm surge at NWLON stations in New York, Connecticut,
Rhode Island, and Massachusetts . . . . . . . . . . . . . . . . . . . . . . . . . . . . . . . . . . . . . . . 29Figure 19. Barometric pressure at Virginia Key, FL, Mayport, FL, Cape Hatteras, NC, and
Duck, NC . . . . . . . . . . . . . . . . . . . . . . . . . . . . . . . . . . . . . . . . . . . . . . . . . . . . . . . . . 33Figure 20. Barometric pressure at Chesapeake Bay Bridge Tunnel, VA, Solomons Island,
MD, Cambridge, MD, and Tolchester Beach, MD . . . . . . . . . . . . . . . . . . . . . . . . . 33Figure 21. Barometric pressure at Sandy Hook, NJ, Newport, RI, and Eastport, ME . . . . . . . . 33Figure 22. Hourly wind vectors and storm surge at Cape Hatteras, NC. . . . . . . . . . . . . . . . . . . 34Figure 23. Hourly wind vectors at Cape Hatteras, NC and storm surge at Oregon Inlet, NC. . 34Figure 24. Hourly wind vectors and storm surge at Duck, NC. . . . . . . . . . . . . . . . . . . . . . . . . . 35Figure 25. Hourly wind vectors and storm surge at Chesapeake Bay Bridge Tunnel, VA. . . . . 35Figure 26. Hourly wind vectors and storm surge at Hampton Roads, VA. . . . . . . . . . . . . . . . . 36Figure 27. Hourly wind vectors and storm surge at Lewisetta, VA. . . . . . . . . . . . . . . . . . . . . . 36Figure 28. Hourly wind vectors and storm surge at Solomons Island, MD. . . . . . . . . . . . . . . . 37Figure 29. Hourly wind vectors and storm surge at Cambridge, MD. . . . . . . . . . . . . . . . . . . . . 37Figure 30. Hourly wind vectors and storm surge at Tolchester Beach, MD. . . . . . . . . . . . . . . . 38Figure 31. Hourly wind vectors and storm surge at Sandy Hook, NJ. . . . . . . . . . . . . . . . . . . . . 38
vi
Figure 32. Hourly wind vectors and storm surge at Bergen Point, NY. . . . . . . . . . . . . . . . . . . 39Figure 33. Hourly wind vectors and storm surge at Kings Point, NY. . . . . . . . . . . . . . . . . . . . 39Figure 34. Station location map for the lower Chesapeake Bay area . . . . . . . . . . . . . . . . . . . . 43Figure 35. Observed current and tidal current prediction at Craney Island . . . . . . . . . . . . . . . . 44Figure 36. Nontidal (residual) current at Craney Island . . . . . . . . . . . . . . . . . . . . . . . . . . . . . . . 44Figure 37. Observed current and tidal current prediction at Newport News . . . . . . . . . . . . . . . 45Figure 38. Nontidal (residual) current at Newport News . . . . . . . . . . . . . . . . . . . . . . . . . . . . . . 45Figure 39. Sample Tides Online web page for Lewisetta, VA . . . . . . . . . . . . . . . . . . . . . . . . . 50Figure 40. Number of hits on the Tides Online web site . . . . . . . . . . . . . . . . . . . . . . . . . . . . . . 51Figure 41. Settlement Point, BA observed and predicted water levels . . . . . . . . . . . . . . . . . . . 68Figure 42. Virginia Key, FL observed and predicted water levels . . . . . . . . . . . . . . . . . . . . . . . 68Figure 43. Trident Pier, FL observed and predicted water levels . . . . . . . . . . . . . . . . . . . . . . . 68Figure 44. St. Augustine Beach, FL observed and predicted water levels . . . . . . . . . . . . . . . . . 69Figure 45. Mayport, FL observed and predicted water levels . . . . . . . . . . . . . . . . . . . . . . . . . . 69Figure 46. Fernandina Beach, FL observed and predicted water levels . . . . . . . . . . . . . . . . . . 69Figure 47. Fort Pulaski, GA observed and predicted water levels . . . . . . . . . . . . . . . . . . . . . . . 70Figure 48. Charleston, SC observed and predicted water levels . . . . . . . . . . . . . . . . . . . . . . . . 70Figure 49. Springmaid Pier, SC observed and predicted water levels . . . . . . . . . . . . . . . . . . . . 70Figure 50. Wilmington, NC observed and predicted water levels . . . . . . . . . . . . . . . . . . . . . . . 71Figure 51. Duke Marine Lab, NC observed and predicted water levels . . . . . . . . . . . . . . . . . . 71Figure 52. Cape Hatteras, NC observed and predicted water levels . . . . . . . . . . . . . . . . . . . . . 71Figure 53. Oregon Inlet Marina, NC observed and predicted water levels . . . . . . . . . . . . . . . . 72Figure 54. Duck Pier, NC observed and predicted water levels . . . . . . . . . . . . . . . . . . . . . . . . 72Figure 55. Chesapeake Bay Bridge Tunnel, VA observed and predicted water levels . . . . . . . 72Figure 56. Money Point, VA observed and predicted water levels . . . . . . . . . . . . . . . . . . . . . . 73Figure 57. Hampton Roads, VA observed and predicted water levels . . . . . . . . . . . . . . . . . . . 73Figure 58. Gloucester Point, VA observed and predicted water levels . . . . . . . . . . . . . . . . . . . 73Figure 59. Windmill Point, VA observed and predicted water levels . . . . . . . . . . . . . . . . . . . . 74Figure 60. Lewisetta, VA observed and predicted water levels . . . . . . . . . . . . . . . . . . . . . . . . . 74Figure 61. Colonial Beach, VA observed and predicted water levels . . . . . . . . . . . . . . . . . . . . 74Figure 62. Washington, DC observed and predicted water levels . . . . . . . . . . . . . . . . . . . . . . . 75Figure 63. Solomons, MD observed and predicted water levels . . . . . . . . . . . . . . . . . . . . . . . . 75Figure 64. Annapolis, MD observed and predicted water levels . . . . . . . . . . . . . . . . . . . . . . . . 75Figure 65. Baltimore, MD observed and predicted water levels . . . . . . . . . . . . . . . . . . . . . . . . 76Figure 66. Tolchester Beach, MD observed and predicted water levels . . . . . . . . . . . . . . . . . . 76Figure 67. Cambridge, MD observed and predicted water levels . . . . . . . . . . . . . . . . . . . . . . . 76Figure 68. Kiptopeke Beach, VA observed and predicted water levels . . . . . . . . . . . . . . . . . . . 77Figure 69. Wachapreague, VA observed and predicted water levels . . . . . . . . . . . . . . . . . . . . 77Figure 70. Lewes, DE observed and predicted water levels . . . . . . . . . . . . . . . . . . . . . . . . . . . 77Figure 71. Reedy Point, DE observed and predicted water levels . . . . . . . . . . . . . . . . . . . . . . . 78Figure 72. Philadelphia, PA observed and predicted water levels . . . . . . . . . . . . . . . . . . . . . . . 78Figure 73. Cape May, NJ observed and predicted water levels . . . . . . . . . . . . . . . . . . . . . . . . . 78Figure 74. Atlantic City, NJ observed and predicted water levels . . . . . . . . . . . . . . . . . . . . . . . 79Figure 75. Sandy Hook, NJ observed and predicted water levels . . . . . . . . . . . . . . . . . . . . . . . 79
vii
Figure 76. Bergen Point, NY observed and predicted water levels . . . . . . . . . . . . . . . . . . . . . . 79Figure 77. The Battery, NY observed and predicted water levels . . . . . . . . . . . . . . . . . . . . . . . 80Figure 78. Montauk, NY observed and predicted water levels . . . . . . . . . . . . . . . . . . . . . . . . . 80Figure 79. Willets Point, NY observed and predicted water levels . . . . . . . . . . . . . . . . . . . . . . 80Figure 80. Kings Point, NY observed and predicted water levels . . . . . . . . . . . . . . . . . . . . . . . 81Figure 81. Bridgeport, CT observed and predicted water levels . . . . . . . . . . . . . . . . . . . . . . . . 81Figure 82. New London, CT observed and predicted water levels . . . . . . . . . . . . . . . . . . . . . . 81Figure 83. Providence, RI observed and predicted water levels . . . . . . . . . . . . . . . . . . . . . . . . 82Figure 84. Newport, RI observed and predicted water levels . . . . . . . . . . . . . . . . . . . . . . . . . . 82Figure 85. Woods Hole, MA observed and predicted water levels . . . . . . . . . . . . . . . . . . . . . . 82Figure 86. Nantucket, MA observed and predicted water levels . . . . . . . . . . . . . . . . . . . . . . . . 83Figure 87. Boston, MA observed and predicted water levels . . . . . . . . . . . . . . . . . . . . . . . . . . 83Figure 88. Settlement Point, BA storm surge . . . . . . . . . . . . . . . . . . . . . . . . . . . . . . . . . . . . . . 86Figure 89. Virginia Key, FL storm surge . . . . . . . . . . . . . . . . . . . . . . . . . . . . . . . . . . . . . . . . . . 86Figure 90. Trident Pier, FL storm surge . . . . . . . . . . . . . . . . . . . . . . . . . . . . . . . . . . . . . . . . . . . 86Figure 91. St. Augustine Beach, FL storm surge . . . . . . . . . . . . . . . . . . . . . . . . . . . . . . . . . . . . 87Figure 92. Mayport, FL storm surge . . . . . . . . . . . . . . . . . . . . . . . . . . . . . . . . . . . . . . . . . . . . . 87Figure 93. Fernandina Beach, FL storm surge . . . . . . . . . . . . . . . . . . . . . . . . . . . . . . . . . . . . . . 87Figure 94. Fort Pulaski, GA storm surge . . . . . . . . . . . . . . . . . . . . . . . . . . . . . . . . . . . . . . . . . . 88Figure 95. Charleston, SC storm surge . . . . . . . . . . . . . . . . . . . . . . . . . . . . . . . . . . . . . . . . . . . 88Figure 96. Springmaid Pier, SC storm surge . . . . . . . . . . . . . . . . . . . . . . . . . . . . . . . . . . . . . . . 88Figure 97. Wilmington, NC storm surge . . . . . . . . . . . . . . . . . . . . . . . . . . . . . . . . . . . . . . . . . . 89Figure 98. Duke Marine Lab, NC storm surge . . . . . . . . . . . . . . . . . . . . . . . . . . . . . . . . . . . . . 89Figure 99. Cape Hatteras, NC storm surge . . . . . . . . . . . . . . . . . . . . . . . . . . . . . . . . . . . . . . . . 89Figure 100. Oregon Inlet Marina, NC storm surge . . . . . . . . . . . . . . . . . . . . . . . . . . . . . . . . . . . 90Figure 101. Duck Pier, NC storm surge . . . . . . . . . . . . . . . . . . . . . . . . . . . . . . . . . . . . . . . . . . . 90Figure 102. Chesapeake Bay Bridge Tunnel, VA storm surge . . . . . . . . . . . . . . . . . . . . . . . . . . 90Figure 103. Money Point, VA storm surge . . . . . . . . . . . . . . . . . . . . . . . . . . . . . . . . . . . . . . . . 91Figure 104. Hampton Roads, VA storm surge . . . . . . . . . . . . . . . . . . . . . . . . . . . . . . . . . . . . . . 91Figure 105. Gloucester Point, VA storm surge . . . . . . . . . . . . . . . . . . . . . . . . . . . . . . . . . . . . . 91Figure 106. Windmill Point, VA storm surge . . . . . . . . . . . . . . . . . . . . . . . . . . . . . . . . . . . . . . 92Figure 107. Lewisetta, VA storm surge . . . . . . . . . . . . . . . . . . . . . . . . . . . . . . . . . . . . . . . . . . . 92Figure 108. Colonial Beach, VA storm surge . . . . . . . . . . . . . . . . . . . . . . . . . . . . . . . . . . . . . . 92Figure 109. Washington, DC storm surge . . . . . . . . . . . . . . . . . . . . . . . . . . . . . . . . . . . . . . . . . 93Figure 110. Solomons, MD storm surge . . . . . . . . . . . . . . . . . . . . . . . . . . . . . . . . . . . . . . . . . . 93Figure 111. Annapolis, MD storm surge . . . . . . . . . . . . . . . . . . . . . . . . . . . . . . . . . . . . . . . . . . 93Figure 112. Baltimore, MD storm surge . . . . . . . . . . . . . . . . . . . . . . . . . . . . . . . . . . . . . . . . . . 94Figure 113. Tolchester Beach, MD storm surge . . . . . . . . . . . . . . . . . . . . . . . . . . . . . . . . . . . . . 94Figure 114. Cambridge, MD storm surge . . . . . . . . . . . . . . . . . . . . . . . . . . . . . . . . . . . . . . . . . . 94Figure 115. Kiptopeke Beach, VA storm surge . . . . . . . . . . . . . . . . . . . . . . . . . . . . . . . . . . . . . 95Figure 116. Wachapreague, VA storm surge . . . . . . . . . . . . . . . . . . . . . . . . . . . . . . . . . . . . . . . 95Figure 117. Lewes, DE storm surge . . . . . . . . . . . . . . . . . . . . . . . . . . . . . . . . . . . . . . . . . . . . . . 95Figure 118. Reedy Point, DE storm surge . . . . . . . . . . . . . . . . . . . . . . . . . . . . . . . . . . . . . . . . . 96Figure 119. Philadelphia, PA storm surge . . . . . . . . . . . . . . . . . . . . . . . . . . . . . . . . . . . . . . . . . 96

viii
Figure 120. Cape May, NJ storm surge . . . . . . . . . . . . . . . . . . . . . . . . . . . . . . . . . . . . . . . . . . . 96Figure 121. Atlantic City, NJ storm surge . . . . . . . . . . . . . . . . . . . . . . . . . . . . . . . . . . . . . . . . . 97Figure 122. Sandy Hook, NJ storm surge . . . . . . . . . . . . . . . . . . . . . . . . . . . . . . . . . . . . . . . . . . 97Figure 123. Bergen Point, NY storm surge . . . . . . . . . . . . . . . . . . . . . . . . . . . . . . . . . . . . . . . . 97Figure 124. The Battery, NY storm surge . . . . . . . . . . . . . . . . . . . . . . . . . . . . . . . . . . . . . . . . . 98Figure 125. Montauk, NY storm surge . . . . . . . . . . . . . . . . . . . . . . . . . . . . . . . . . . . . . . . . . . . . 98Figure 126. Willets Point, NY storm surge . . . . . . . . . . . . . . . . . . . . . . . . . . . . . . . . . . . . . . . . 98Figure 127. Kings Point, NY storm surge . . . . . . . . . . . . . . . . . . . . . . . . . . . . . . . . . . . . . . . . . 99Figure 128. Bridgeport, CT storm surge . . . . . . . . . . . . . . . . . . . . . . . . . . . . . . . . . . . . . . . . . . 99Figure 129. New London, CT storm surge . . . . . . . . . . . . . . . . . . . . . . . . . . . . . . . . . . . . . . . . . 99Figure 130. Providence, RI storm surge . . . . . . . . . . . . . . . . . . . . . . . . . . . . . . . . . . . . . . . . . . 100Figure 131. Newport, RI storm surge . . . . . . . . . . . . . . . . . . . . . . . . . . . . . . . . . . . . . . . . . . . . 100Figure 132. Woods Hole, MA storm surge . . . . . . . . . . . . . . . . . . . . . . . . . . . . . . . . . . . . . . . 100Figure 133. Nantucket, MA storm surge . . . . . . . . . . . . . . . . . . . . . . . . . . . . . . . . . . . . . . . . . 101Figure 134. Boston, MA storm surge . . . . . . . . . . . . . . . . . . . . . . . . . . . . . . . . . . . . . . . . . . . . 101Figure 135. Virginia Key, FL wind speed and barometric pressure . . . . . . . . . . . . . . . . . . . . . 104Figure 136. Mayport, FL wind speed and barometric pressure . . . . . . . . . . . . . . . . . . . . . . . . 104Figure 137. Cape Hatteras, NC wind speed and barometric pressure . . . . . . . . . . . . . . . . . . . 104Figure 138. Duck Pier, NC wind speed and barometric pressure . . . . . . . . . . . . . . . . . . . . . . 105Figure 139. Chesapeake Bay Bridge Tunnel, VA wind speed and barometric pressure . . . . . 105Figure 140. Hampton Roads, VA wind speed and barometric pressure . . . . . . . . . . . . . . . . . 105Figure 141. Lewisetta, VA wind speed and barometric pressure . . . . . . . . . . . . . . . . . . . . . . . 106Figure 142. Solomons Island, MD wind speed and barometric pressure . . . . . . . . . . . . . . . . . 106Figure 143. Tolchester Beach, MD wind speed and barometric pressure . . . . . . . . . . . . . . . . 106Figure 144. Cambridge, MD wind speed and barometric pressure . . . . . . . . . . . . . . . . . . . . . 107Figure 145. Sandy Hook, NJ wind speed and barometric pressure . . . . . . . . . . . . . . . . . . . . . 107Figure 146. Bergen Point, NY wind speed and barometric pressure . . . . . . . . . . . . . . . . . . . . 107Figure 147. Kings Point, NY wind speed and barometric pressure . . . . . . . . . . . . . . . . . . . . . 108Figure 148. Providence, RI barometric pressure . . . . . . . . . . . . . . . . . . . . . . . . . . . . . . . . . . . 108Figure 149. Newport, RI barometric pressure . . . . . . . . . . . . . . . . . . . . . . . . . . . . . . . . . . . . . 108Figure 150. Eastport,ME wind speed and barometric pressure . . . . . . . . . . . . . . . . . . . . . . . . 109

ix
List of Acronyms and Abbreviations
ADCP Acoustic Doppler Current ProfilerAFOS Automation of Field Operations and ServicesARO Atlantic Regional OfficeAVHRR Advanced Very High Resolution RadiometerBA BahamasCO-OPS Center for Operational Oceanographic Products and ServicesCORMS Continuous Operational Real-Time Monitoring SystemDCP Data Collection PlatformEDT Eastern Daylight TimeEST Eastern Standard TimeFEMA Federal Emergency Management AgencyFOD Field Operations DivisionGOES Geostationary Operational Environmental SatelliteGMT Greenwich Mean TimeGT Great Diurnal RangeHAZMAT Hazardous Materials Response DivisionMHHW Mean Higher High WaterMLLW Mean Lower Low WaterNASA National Aeronautics and Space AdministrationNCDC National Climatic Data CenterNGWLMS Next Generation Water Level Measurement SystemNHC National Hurricane CenterNOAA National Oceanic and Atmospheric AdministrationNOS National Ocean ServiceNWLON National Water Level Observation NetworkNWLP National Water Level ProgramNWS National Weather ServicePORTS Physical Oceanographic Real-Time SystemPSD Products and Services DivisionSeaWiFS Sea-viewing Wide Field-of-View Sensor

x

1
I. Introduction
Hurricane Floyd was the strongest and most damaging hurricane of the 1999 Atlantic season. At itspeak strength it was classified as a Category 4 hurricane on the Saffir/Simpson Hurricane Scale. Bythe time it made landfall near Wilmington, NC it had weakened to a Category 2 hurricane. Most ofthe damage and casualties attributed to the storm were due to the heavy rainfall and flooding causedby the passage of the storm along the U.S. Atlantic coastline. The hardest hit area was eastern NorthCarolina.
This report presents the data collected by the Center for Operational Oceanographic Products andServices (CO-OPS) during the passage of Floyd in the week of September 13-19, 1999. The stormtrack resulted in significant storm surges at almost all of CO-OPS’ National Water LevelObservation Network (NWLON) stations along the Atlantic Coast. At three stations, observed waterlevels exceeded their historical records. Previous major storm event data reports are listed in thereference section at the end of this report.
The report begins with a description of the evolution of Hurricane Floyd from inception todissipation, followed by a section indicating the NWLON stations affected by the hurricane atdifferent times. The maximum observed water levels at the NWLON stations are then presented andcompared with historical maximum elevations. Next, the maximum storm surges at the NWLONstations are discussed and compared, followed by a presentation and discussion of the ancillarymeteorological data collected by some NWLON stations during this period. An example of currentsdriven by the hurricane’s winds is presented using measurements obtained by two CO-OPS currentmeters. Finally, there is a discussion of operational problems and damage to NWLON stations, theoperation of the real-time monitoring system, the newly-introduced Tides Online web site, and theinteraction of CO-OPS with federal and state emergency management centers.

2
3
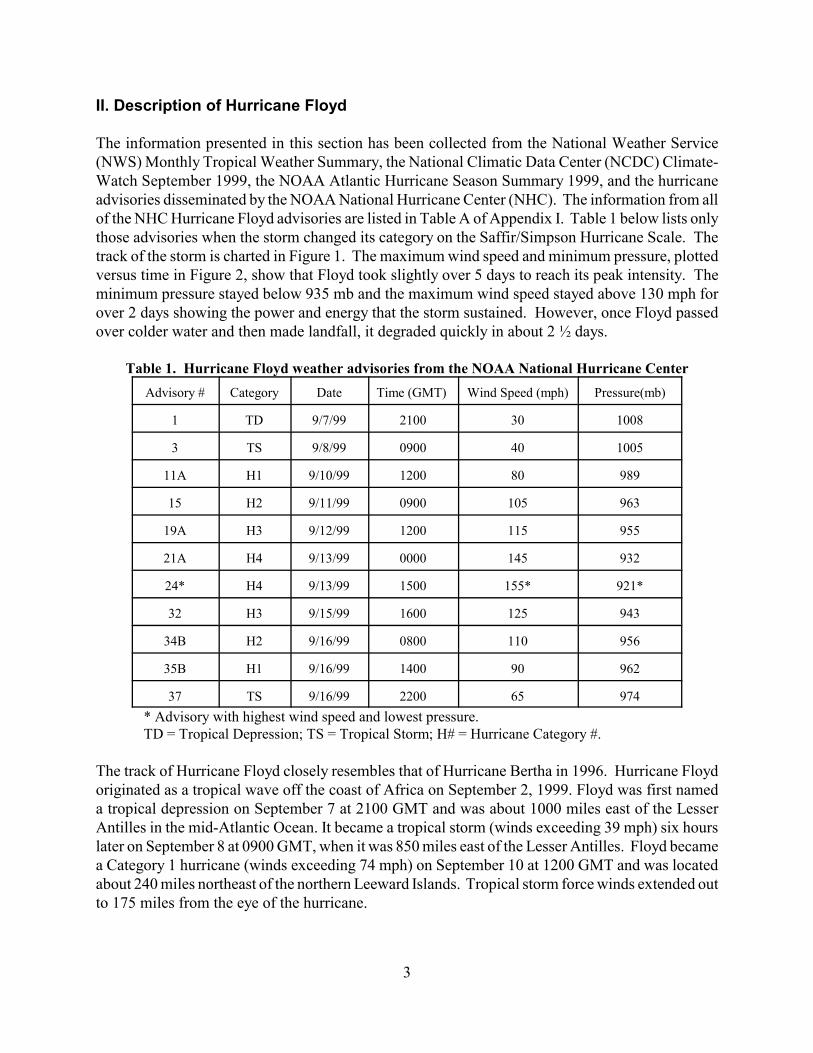
II. Description of Hurricane Floyd
The information presented in this section has been collected from the National Weather Service(NWS) Monthly Tropical Weather Summary, the National Climatic Data Center (NCDC) Climate-Watch September 1999, the NOAA Atlantic Hurricane Season Summary 1999, and the hurricaneadvisories disseminated by the NOAA National Hurricane Center (NHC). The information from allof the NHC Hurricane Floyd advisories are listed in Table A of Appendix I. Table 1 below lists onlythose advisories when the storm changed its category on the Saffir/Simpson Hurricane Scale. Thetrack of the storm is charted in Figure 1. The maximum wind speed and minimum pressure, plottedversus time in Figure 2, show that Floyd took slightly over 5 days to reach its peak intensity. Theminimum pressure stayed below 935 mb and the maximum wind speed stayed above 130 mph forover 2 days showing the power and energy that the storm sustained. However, once Floyd passedover colder water and then made landfall, it degraded quickly in about 2 ½ days.
Table 1. Hurricane Floyd weather advisories from the NOAA National Hurricane CenterAdvisory # Category Date Time (GMT) Wind Speed (mph) Pressure(mb)
1 TD 9/7/99 2100 30 1008
3 TS 9/8/99 0900 40 1005
11A H1 9/10/99 1200 80 989
15 H2 9/11/99 0900 105 963
19A H3 9/12/99 1200 115 955
21A H4 9/13/99 0000 145 932
24* H4 9/13/99 1500 155* 921*
32 H3 9/15/99 1600 125 943
34B H2 9/16/99 0800 110 956
35B H1 9/16/99 1400 90 962
37 TS 9/16/99 2200 65 974* Advisory with highest wind speed and lowest pressure.TD = Tropical Depression; TS = Tropical Storm; H# = Hurricane Category #.
The track of Hurricane Floyd closely resembles that of Hurricane Bertha in 1996. Hurricane Floydoriginated as a tropical wave off the coast of Africa on September 2, 1999. Floyd was first nameda tropical depression on September 7 at 2100 GMT and was about 1000 miles east of the LesserAntilles in the mid-Atlantic Ocean. It became a tropical storm (winds exceeding 39 mph) six hourslater on September 8 at 0900 GMT, when it was 850 miles east of the Lesser Antilles. Floyd becamea Category 1 hurricane (winds exceeding 74 mph) on September 10 at 1200 GMT and was locatedabout 240 miles northeast of the northern Leeward Islands. Tropical storm force winds extended outto 175 miles from the eye of the hurricane.

4
One day later, Floyd became a Category 2 hurricane and the following day, it was upgraded to aCategory 3. Floyd became a Category 4 hurricane only 12 hours later. Maximum wind speedscontinued to increase and minimum air pressure continued to decrease until Floyd reached its peakstrength as a Category 4 hurricane on September 13 at about 1330 GMT. The maximum wind speedwas 155 mph and the minimum pressure was 921 mb. If the wind speed had reached 156 mph, itwould have been classified as a Category 5 hurricane. A NOAA-15 Advanced Very High ResolutionRadiometer (AVHRR) multispectral false color image of Hurricane Floyd at its strongest point isshown in Figure 3.
Floyd remained a Category 4 hurricane for over 2 ½ days with peak sustained winds of 155 mph formore than 1 day. During this period, Floyd’s eye passed over the islands of Eleuthera and Abaco inthe Bahamas. Floyd then turned north-northwest and gradually weakened to become a Category 3hurricane on September 15 at 1600 GMT. At this point, the eye was about 110 miles east-northeastof Cape Canaveral, FL with hurricane force winds extending out 125 miles and tropical storm forcewinds extending out 290 miles. As Floyd encountered cooler northern waters, its intensitydecreased. On September 16 at approximately 0630 GMT (0230 EDT), Floyd made landfall nearCape Fear, NC. Moving north-northeast at 20 mph, it had become a Category 2 hurricane withsustained winds of 110 mph. Maximum storm surge was reported by NCDC to be 10.3 feet onMasonborough Island in New Hanover County, NC. A Geostationary Operational EnvironmentalSatellite (GOES)-8 colorized IR image of Hurricane Floyd as it came ashore is shown in Figure 4.Several powerful hurricanes have made landfall near Cape Fear, including both Bertha (as a Category2 hurricane) and Fran (as a Category 3 hurricane) in 1996. Hazel made landfall as a Category 4hurricane in 1954 at the border between North and South Carolina.
Floyd rapidly weakened over land becoming a Category 1 hurricane at 1400 GMT just beforecrossing into Virginia. Thereafter, Floyd generally followed the Atlantic coastline towardConnecticut, becoming a tropical storm on September 16 at 2200 GMT when it reached southernNew Jersey. Over the open ocean, Floyd had been traveling at a speed of roughly 14 mph. Afterlandfall, the storm accelerated up to a maximum speed of 35 mph as it passed through New Englandand into Maine.
Hurricane or tropical storm warnings were in effect at some point for all of the U.S. Atlantic coastfrom south Florida to Massachusetts. The largest peacetime evacuation in U.S. history took placewith 2.6 million people evacuating their homes in Florida, Georgia, South Carolina, and NorthCarolina. Due to Hurricane Floyd’s size, rainfall covered a large inland area and was responsiblefor flooding over many parts of the eastern United States, with the greatest totals in North Carolina.Wilmington, NC set a new 24-hour station rainfall record with 13.38 inches, breaking a 128-year oldrecord, and over 19 inches was recorded for the entire storm (Figure 5). The death toll estimate is75, making Floyd the deadliest United States hurricane since Agnes in 1972, with 122 deaths. Thedamage total is incomplete but could exceed the $6 billion in damage caused by Hurricane Fran in1996. A week after the passage of Floyd, flooded rivers which were causing severe environmentaldamage could be seen in a Sea-viewing Wide Field-of-View Sensor (SeaWiFS) image of easternNorth Carolina (Figure 6).
5
37 TS37 TS37 TS37 TS37 TS37 TS37 TS37 TS37 TS
*24 H4*24 H4*24 H4*24 H4*24 H4*24 H4*24 H4*24 H4*24 H421A H421A H421A H421A H421A H421A H421A H421A H421A H4
32 H332 H332 H332 H332 H332 H332 H332 H332 H3
19A H319A H319A H319A H319A H319A H319A H319A H319A H3
15 H215 H215 H215 H215 H215 H215 H215 H215 H2
11A H111A H111A H111A H111A H111A H111A H111A H111A H1
3 TS3 TS3 TS3 TS3 TS3 TS3 TS3 TS3 TS
1 TD1 TD1 TD1 TD1 TD1 TD1 TD1 TD1 TD
35B H135B H135B H135B H135B H135B H135B H135B H135B H1
34B H234B H234B H234B H234B H234B H234B H234B H234B H2
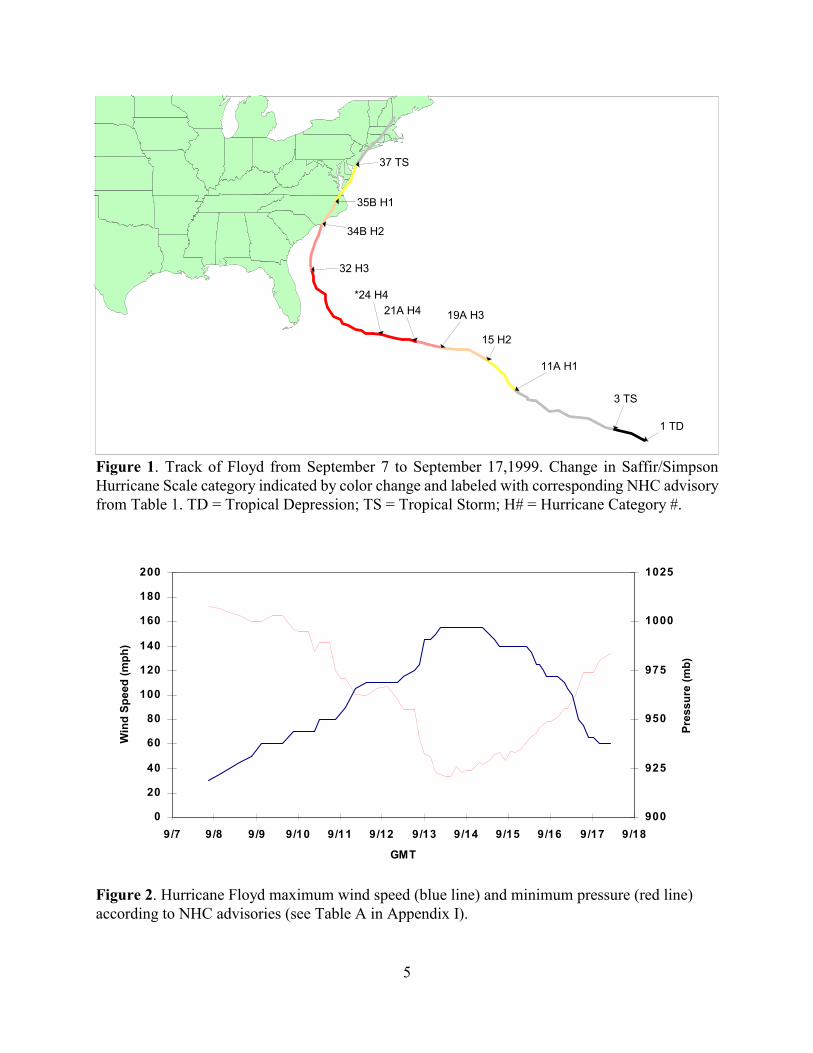
Figure 1. Track of Floyd from September 7 to September 17,1999. Change in Saffir/SimpsonHurricane Scale category indicated by color change and labeled with corresponding NHC advisoryfrom Table 1. TD = Tropical Depression; TS = Tropical Storm; H# = Hurricane Category #.
0
20
40
60
80
100
120
140
160
180
200
9/7 9/8 9/9 9/10 9/11 9/12 9/13 9/14 9/15 9/16 9/17 9/18
GMT
Win
d Sp
eed
(mph
)
900
925
950
975
1000
1025
Pres
sure
(mb)
Figure 2. Hurricane Floyd maximum wind speed (blue line) and minimum pressure (red line)according to NHC advisories (see Table A in Appendix I).

6
Figure 3. NOAA-15 AVHRR multi-spectral false color imageof Hurricane Floyd at peak strength on September 13 at 1306GMT [NCDC].
Figure 4. GOES-8 colorized IR image of Hurricane Floydmaking landfall near Cape Fear, NC on September 16, 1999 at0645 GMT [NCDC].

7
Figure 5. Total rainfall for September 14-17, 1999[NWS Forecast Office, Wilmington, NC].
Figure 6. SeaWiFS image showing flooded rivers ofeastern North Carolina on September 23, one week afterpassage of Floyd [NASA/Goddard Space Flight Center].

8

9
III. The National Water Level Observation Network
CO-OPS, a component of the National Ocean Service (NOS), operates the NWLON which iscomposed of approximately 189 long term, continuously-operating stations distributed along the U.S.coast (including the Great Lakes) and on islands in the Atlantic and Pacific Oceans. As part of itsNational Water Level Program (NWLP), CO-OPS also installs, operates, and maintains additionalshort term water level stations in support of NOS hydrographic surveys and other federal and stateprojects.
Data from NWLON stations are used in a wide variety of applications, including navigational safety,coastal forecasting, surveying and mapping, coastal engineering, marine boundary determination,and monitoring of seasonal and climatological sea levels. These data are increasingly being requiredby users in real time. Coastal forecast applications include dissemination of data to the NWSAutomation of Field Operations and Services (AFOS) network and for the development of coastalforecast models. Physical Oceanographic Real-Time Systems (PORTS), currently active in four U.S.ports, specifically provide data to users to ensure safe navigation.
The Next Generation Water Level Measurement System (NGWLMS) installed at most NWLONstations is a stand-alone system that acquires, stores, and transmits water level, meteorological, andother environmental data. The main requirement for the unit is to accurately measure water levelinformation with low power consumption, high reliability, and defined accuracy. The NGWLMSwater level sensors have an accuracy of about one centimeter.
The NGWLMS field unit is a fully automated data acquisition and transmission system. The datacollection platform (DCP) consists of a power supply, communications controller, GOES satellitetransmitter, central processing unit, memory expansion module, telephone modem, general purposeI/O module, and controller. The unit’s telemetry capability includes satellite, radio, telephone, anddirect access for the dissemination of near-real time data.
The instruments typically installed at NWLON stations are the primary acoustic water level sensorand a pressure transducer for back-up water level measurements. The primary acoustic instrumentis a non-contact device that returns water level data that can be directly referenced to the stationdatum at the site as an arbitrary zero. Ancillary sensors may include an anemometer for measuringwind speed, direction, and maximum hourly gusts, air and water temperature thermistors, and abarometer for measuring atmospheric pressure.
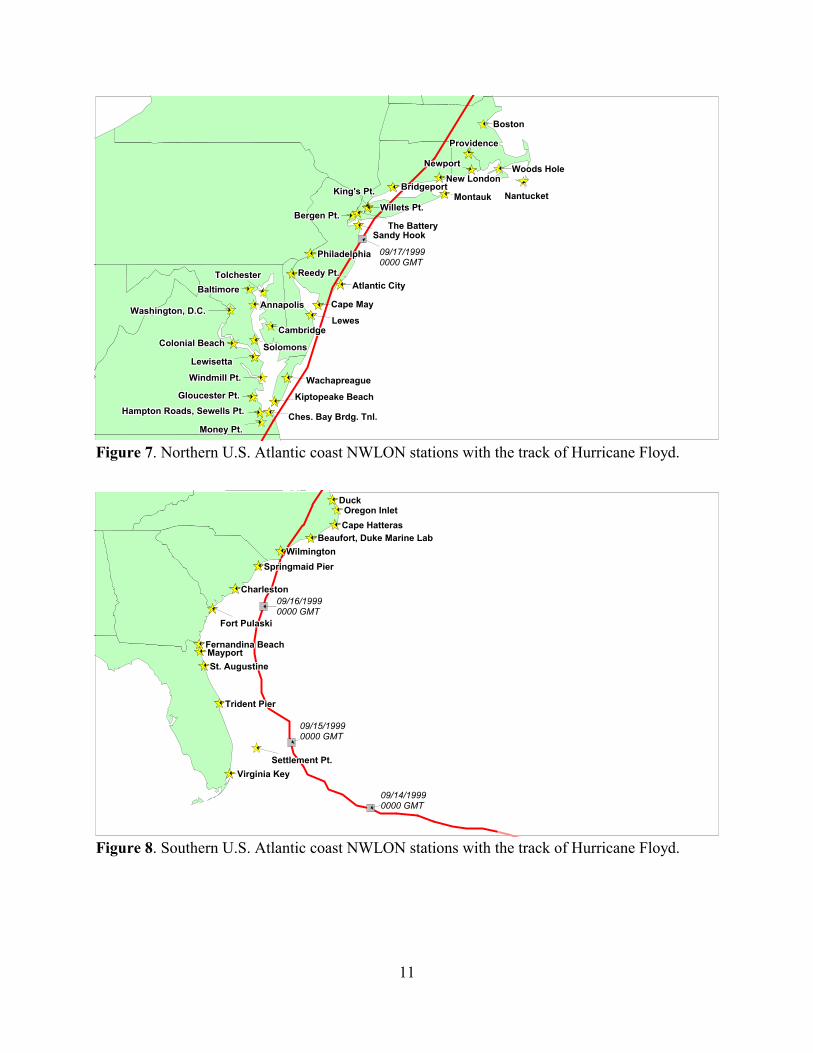
Observed water levels at many NWLON stations recorded the effect of Hurricane Floyd as it movednorth along the U.S. Atlantic coastline. In this report, NWLON stations between Virginia Key, FLand Boston, MA will be discussed including the station at Settlement Point in the Bahamas. Thestation numbers, names, latitudes, longitudes, and their periods of record are given in Table B ofAppendix I. The locations of the stations and Hurricane Floyd’s storm track are shown on the mapsin Figures 7 and 8.
The data used in this report was preliminary 6-minute water level observations and hourlymeteorological measurements. Some of the data may be adjusted after careful examination by

10
CO-OPS staff according to standard operating procedures, before an accepted data set is obtained.However, major changes to the results presented in this report are considered unlikely.
Since the hurricane made landfall and came closest to most of the stations on September 16, theperiod of interest was September 13 to September 19. The nearest NWLON station to the pointwhere Floyd came ashore was Wilmington, NC which is on the Cape Fear River about 25 milesupriver from the coast. The NWLON stations closest to the storm track were Wilmington, NC,Chesapeake Bay Bridge Tunnel, VA, Kiptopeke Beach, VA, Cape May, NJ, Atlantic City, NJ, SandyHook, NJ, and Bridgeport, CT.
11
Settlement Pt.Settlement Pt.Settlement Pt.Settlement Pt.Settlement Pt.Settlement Pt.Settlement Pt.Settlement Pt.Settlement Pt.
Oregon InletOregon InletOregon InletOregon InletOregon InletOregon InletOregon InletOregon InletOregon Inlet
Fort PulaskiFort PulaskiFort PulaskiFort PulaskiFort PulaskiFort PulaskiFort PulaskiFort PulaskiFort Pulaski
CharlestonCharlestonCharlestonCharlestonCharlestonCharlestonCharlestonCharlestonCharleston
Trident PierTrident PierTrident PierTrident PierTrident PierTrident PierTrident PierTrident PierTrident Pier
Fernandina BeachFernandina BeachFernandina BeachFernandina BeachFernandina BeachFernandina BeachFernandina BeachFernandina BeachFernandina BeachMayportMayportMayportMayportMayportMayportMayportMayportMayport
Virginia KeyVirginia KeyVirginia KeyVirginia KeyVirginia KeyVirginia KeyVirginia KeyVirginia KeyVirginia Key
DuckDuckDuckDuckDuckDuckDuckDuckDuck
Cape HatterasCape HatterasCape HatterasCape HatterasCape HatterasCape HatterasCape HatterasCape HatterasCape HatterasBeaufort, Duke Marine LabBeaufort, Duke Marine LabBeaufort, Duke Marine LabBeaufort, Duke Marine LabBeaufort, Duke Marine LabBeaufort, Duke Marine LabBeaufort, Duke Marine LabBeaufort, Duke Marine LabBeaufort, Duke Marine Lab
WilmingtonWilmingtonWilmingtonWilmingtonWilmingtonWilmingtonWilmingtonWilmingtonWilmingtonSpringmaid PierSpringmaid PierSpringmaid PierSpringmaid PierSpringmaid PierSpringmaid PierSpringmaid PierSpringmaid PierSpringmaid Pier
St. AugustineSt. AugustineSt. AugustineSt. AugustineSt. AugustineSt. AugustineSt. AugustineSt. AugustineSt. Augustine
09/14/19990000 GMT
09/15/19990000 GMT
09/16/19990000 GMT
Figure 8. Southern U.S. Atlantic coast NWLON stations with the track of Hurricane Floyd.
New LondonNew LondonNew LondonNew LondonNew LondonNew LondonNew LondonNew LondonNew London
MontaukMontaukMontaukMontaukMontaukMontaukMontaukMontaukMontauk
ProvidenceProvidenceProvidenceProvidenceProvidenceProvidenceProvidenceProvidenceProvidence
NewportNewportNewportNewportNewportNewportNewportNewportNewport
BridgeportBridgeportBridgeportBridgeportBridgeportBridgeportBridgeportBridgeportBridgeport
SolomonsSolomonsSolomonsSolomonsSolomonsSolomonsSolomonsSolomonsSolomons
LewesLewesLewesLewesLewesLewesLewesLewesLewes
Cape MayCape MayCape MayCape MayCape MayCape MayCape MayCape MayCape May
Colonial BeachColonial BeachColonial BeachColonial BeachColonial BeachColonial BeachColonial BeachColonial BeachColonial Beach
Sandy HookSandy HookSandy HookSandy HookSandy HookSandy HookSandy HookSandy HookSandy HookThe BatteryThe BatteryThe BatteryThe BatteryThe BatteryThe BatteryThe BatteryThe BatteryThe Battery
PhiladelphiaPhiladelphiaPhiladelphiaPhiladelphiaPhiladelphiaPhiladelphiaPhiladelphiaPhiladelphiaPhiladelphia
Atlantic CityAtlantic CityAtlantic CityAtlantic CityAtlantic CityAtlantic CityAtlantic CityAtlantic CityAtlantic CityReedy Pt.Reedy Pt.Reedy Pt.Reedy Pt.Reedy Pt.Reedy Pt.Reedy Pt.Reedy Pt.Reedy Pt.
WachapreagueWachapreagueWachapreagueWachapreagueWachapreagueWachapreagueWachapreagueWachapreagueWachapreagueGloucester Pt.Gloucester Pt.Gloucester Pt.Gloucester Pt.Gloucester Pt.Gloucester Pt.Gloucester Pt.Gloucester Pt.Gloucester Pt.
Bergen Pt.Bergen Pt.Bergen Pt.Bergen Pt.Bergen Pt.Bergen Pt.Bergen Pt.Bergen Pt.Bergen Pt.
King's Pt.King's Pt.King's Pt.King's Pt.King's Pt.King's Pt.King's Pt.King's Pt.King's Pt.Willets Pt.Willets Pt.Willets Pt.Willets Pt.Willets Pt.Willets Pt.Willets Pt.Willets Pt.Willets Pt.
TolchesterTolchesterTolchesterTolchesterTolchesterTolchesterTolchesterTolchesterTolchester
Windmill Pt.Windmill Pt.Windmill Pt.Windmill Pt.Windmill Pt.Windmill Pt.Windmill Pt.Windmill Pt.Windmill Pt.
Money Pt.Money Pt.Money Pt.Money Pt.Money Pt.Money Pt.Money Pt.Money Pt.Money Pt.
Woods HoleWoods HoleWoods HoleWoods HoleWoods HoleWoods HoleWoods HoleWoods HoleWoods Hole
NantucketNantucketNantucketNantucketNantucketNantucketNantucketNantucketNantucket
CambridgeCambridgeCambridgeCambridgeCambridgeCambridgeCambridgeCambridgeCambridge
AnnapolisAnnapolisAnnapolisAnnapolisAnnapolisAnnapolisAnnapolisAnnapolisAnnapolisWashington, D.C.Washington, D.C.Washington, D.C.Washington, D.C.Washington, D.C.Washington, D.C.Washington, D.C.Washington, D.C.Washington, D.C.
LewisettaLewisettaLewisettaLewisettaLewisettaLewisettaLewisettaLewisettaLewisetta
BaltimoreBaltimoreBaltimoreBaltimoreBaltimoreBaltimoreBaltimoreBaltimoreBaltimore
Kiptopeake BeachKiptopeake BeachKiptopeake BeachKiptopeake BeachKiptopeake BeachKiptopeake BeachKiptopeake BeachKiptopeake BeachKiptopeake BeachHampton Roads, Sewells Pt.Hampton Roads, Sewells Pt.Hampton Roads, Sewells Pt.Hampton Roads, Sewells Pt.Hampton Roads, Sewells Pt.Hampton Roads, Sewells Pt.Hampton Roads, Sewells Pt.Hampton Roads, Sewells Pt.Hampton Roads, Sewells Pt. Ches. Bay Brdg. Tnl.Ches. Bay Brdg. Tnl.Ches. Bay Brdg. Tnl.Ches. Bay Brdg. Tnl.Ches. Bay Brdg. Tnl.Ches. Bay Brdg. Tnl.Ches. Bay Brdg. Tnl.Ches. Bay Brdg. Tnl.Ches. Bay Brdg. Tnl.
BostonBostonBostonBostonBostonBostonBostonBostonBoston
09/17/19990000 GMT
Figure 7. Northern U.S. Atlantic coast NWLON stations with the track of Hurricane Floyd.

12
13
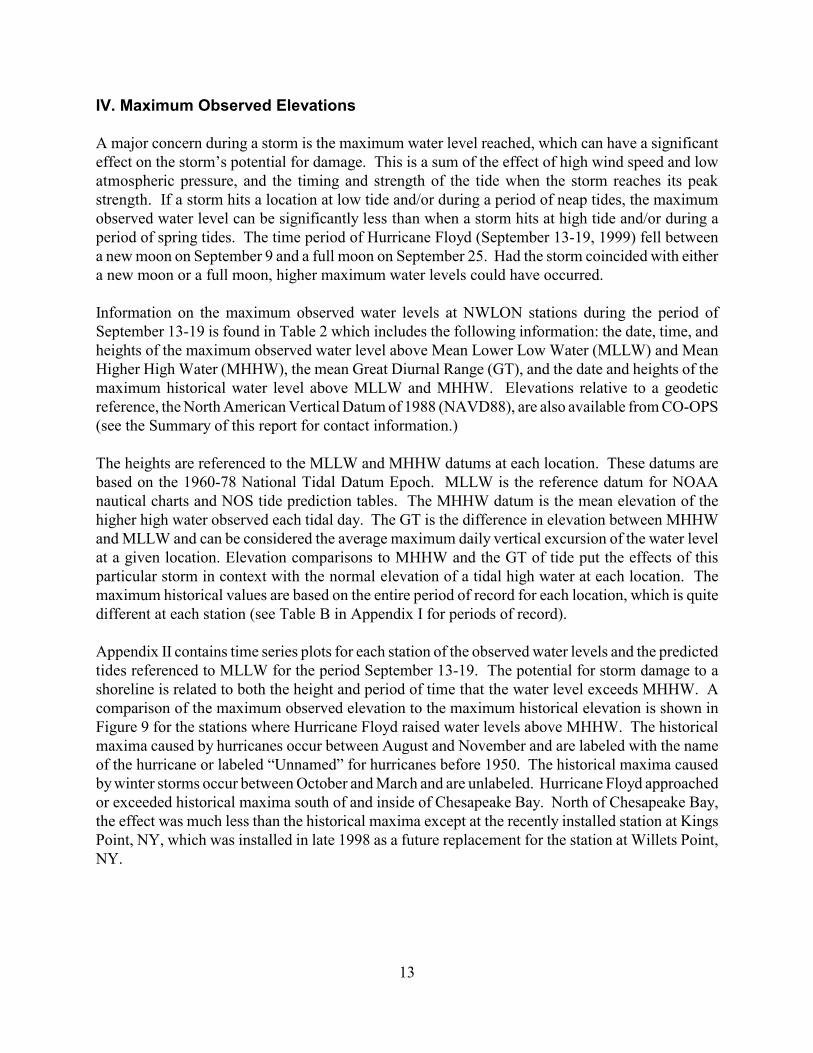
IV. Maximum Observed Elevations
A major concern during a storm is the maximum water level reached, which can have a significanteffect on the storm’s potential for damage. This is a sum of the effect of high wind speed and lowatmospheric pressure, and the timing and strength of the tide when the storm reaches its peakstrength. If a storm hits a location at low tide and/or during a period of neap tides, the maximumobserved water level can be significantly less than when a storm hits at high tide and/or during aperiod of spring tides. The time period of Hurricane Floyd (September 13-19, 1999) fell betweena new moon on September 9 and a full moon on September 25. Had the storm coincided with eithera new moon or a full moon, higher maximum water levels could have occurred.
Information on the maximum observed water levels at NWLON stations during the period ofSeptember 13-19 is found in Table 2 which includes the following information: the date, time, andheights of the maximum observed water level above Mean Lower Low Water (MLLW) and MeanHigher High Water (MHHW), the mean Great Diurnal Range (GT), and the date and heights of themaximum historical water level above MLLW and MHHW. Elevations relative to a geodeticreference, the North American Vertical Datum of 1988 (NAVD88), are also available from CO-OPS(see the Summary of this report for contact information.)
The heights are referenced to the MLLW and MHHW datums at each location. These datums arebased on the 1960-78 National Tidal Datum Epoch. MLLW is the reference datum for NOAAnautical charts and NOS tide prediction tables. The MHHW datum is the mean elevation of thehigher high water observed each tidal day. The GT is the difference in elevation between MHHWand MLLW and can be considered the average maximum daily vertical excursion of the water levelat a given location. Elevation comparisons to MHHW and the GT of tide put the effects of thisparticular storm in context with the normal elevation of a tidal high water at each location. Themaximum historical values are based on the entire period of record for each location, which is quitedifferent at each station (see Table B in Appendix I for periods of record).
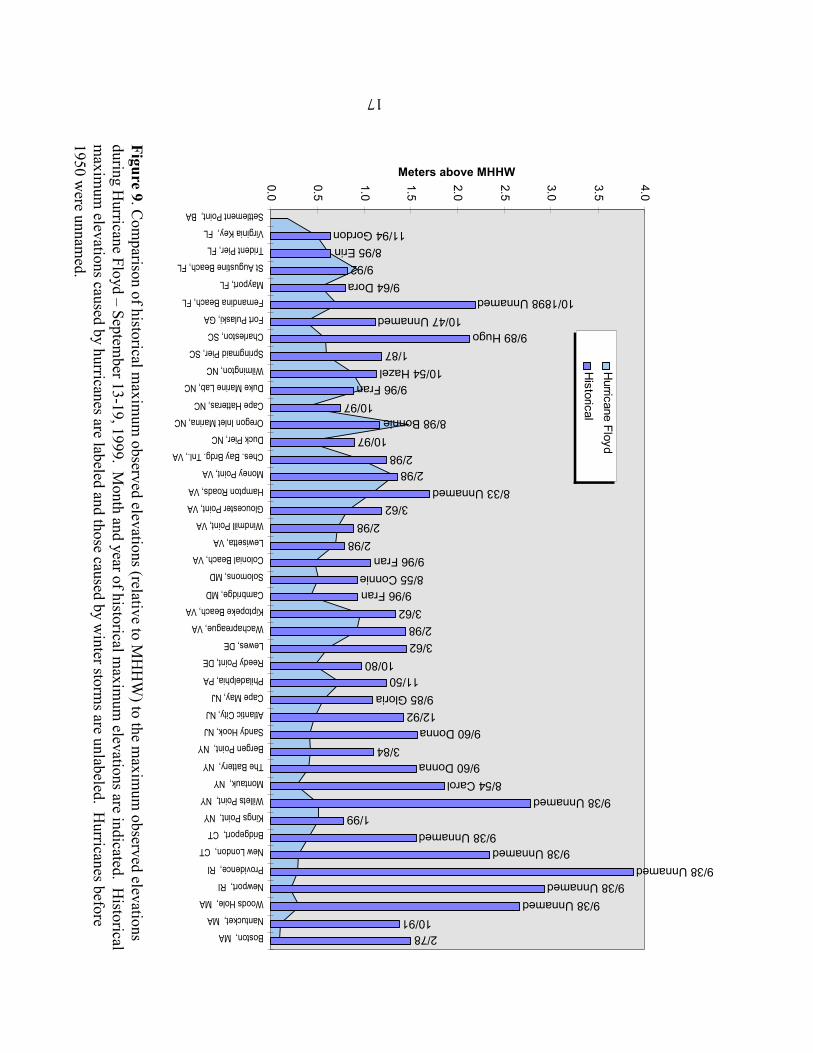
Appendix II contains time series plots for each station of the observed water levels and the predictedtides referenced to MLLW for the period September 13-19. The potential for storm damage to ashoreline is related to both the height and period of time that the water level exceeds MHHW. Acomparison of the maximum observed elevation to the maximum historical elevation is shown inFigure 9 for the stations where Hurricane Floyd raised water levels above MHHW. The historicalmaxima caused by hurricanes occur between August and November and are labeled with the nameof the hurricane or labeled “Unnamed” for hurricanes before 1950. The historical maxima causedby winter storms occur between October and March and are unlabeled. Hurricane Floyd approachedor exceeded historical maxima south of and inside of Chesapeake Bay. North of Chesapeake Bay,the effect was much less than the historical maxima except at the recently installed station at KingsPoint, NY, which was installed in late 1998 as a future replacement for the station at Willets Point,NY.

14
Table 2. Maximum observed water level (meters)
Station Hurricane Floyd 1999 Great Historical MaximumDiurnal
Date/Time (GMT) Above Range Date Above(mo/day, hr.min.) MLLW MHHW (GT) (mo/yr) MLLW MHHW
Settlement Point, BA 9/14 1548 1.106 0.177 0.929Virginia Key, FL 9/15 0518 1.175 0.484 0.692 11/1994 1.335 0.643Trident Pier, FL 9/15 0418 1.858 0.620 1.238 8/1995 1.881 0.643St Augustine Beach, FL 9/15 1636 2.517 0.938 1.579 9/1992 2.395 0.816Mayport, FL 9/15 1824 2.040 0.540 1.500 9/1964 2.299 0.799Fernandina Beach, FL 9/15 1724 2.719 0.707 2.012 10/1898 4.197 2.185Fort Pulaski, GA 9/15 1742 2.648 0.372 2.276 10/1947 3.398 1.122Charleston, SC 9/15 1718 2.349 0.581 1.768 9/1989 3.901 2.133Springmaid Pier, SC 9/16 0348 2.305 0.591 1.714 1/1987 2.903 1.189Wilmington, NC 9/16 0754 2.254 0.876 1.378 10/1954 2.509 1.131Duke Marine Lab, NC 9/16 0912 2.040 0.985 1.055 9/1996 1.941 0.886Cape Hatteras, NC 9/16 0548 1.429 0.353 1.076 10/1997 1.822 0.746Oregon Inlet Marina, NC 9/16 1454 1.847 1.480 0.367 8/1998 1.538 1.171Duck Pier, NC 9/16 0400 1.517 0.374 1.143 10/1997 2.043 0.900Ches. Bay Brdg. Tnl., VA 9/16 1636 1.846 0.946 0.900 2/1998 2.138 1.238Money Point, VA 9/16 1718 2.275 1.326 0.949 2/1998 2.297 1.348Hampton Roads, VA 9/16 1642 1.938 1.084 0.854 8/1933 2.558 1.704Gloucester Point, VA 9/16 1542 1.654 0.822 0.832 3/1962 2.021 1.189Windmill Point, VA 9/16 1818 1.146 0.710 0.436 2/1998 1.320 0.884Lewisetta, VA 9/16 1800 1.158 0.692 0.466 2/1998 1.252 0.786Colonial Beach, VA 9/16 1218 1.064 0.463 0.601 9/1996 1.667 1.066Solomons, MD 9/16 1418 0.962 0.502 0.460 8/1955 1.380 0.920Cambridge, MD 9/17 0006 1.051 0.427 0.624 9/1996 1.554 0.930Kiptopeke Beach, VA 9/16 1706 1.884 0.961 0.923 3/1962 2.258 1.335Wachapreague, VA 9/16 1754 2.314 0.912 1.402 2/1998 2.843 1.441Lewes, DE 9/16 1900 2.062 0.620 1.442 3/1962 2.893 1.451Reedy Point, DE 9/16 2006 2.291 0.468 1.823 10/1980 2.801 0.978Philadelphia, PA 9/16 2242 2.848 0.748 2.100 11/1950 3.340 1.240Cape May, NJ 9/16 1848 2.243 0.563 1.680 9/1985 2.771 1.091Atlantic City, NJ 9/16 1612 1.896 0.469 1.427 12/1992 2.847 1.420Sandy Hook, NJ 9/16 1748 2.003 0.418 1.585 9/1960 3.148 1.563Bergen Point, NY 9/16 1718 2.123 0.428 1.695 3/1984 2.792 1.097The Battery, NY 9/16 1800 1.972 0.412 1.560 9/1960 3.118 1.558Montauk, NY 9/16 1924 1.061 0.271 0.790 8/1954 2.646 1.856Willets Point, NY 9/16 2136 2.883 0.512 2.371 9/1938 5.151 2.780Kings Point, NY 9/16 2136 2.876 0.506 2.370 1/1999 3.146 0.776Bridgeport, CT 9/16 2048 2.640 0.406 2.234 9/1938 3.791 1.557New London, CT 9/16 1942 1.242 0.303 0.939 9/1938 3.280 2.341Providence, RI 9/17 0512 1.796 0.284 1.512 9/1938 5.398 3.886Newport, RI 9/17 0500 1.412 0.217 1.195 9/1938 4.124 2.929Woods Hole, MA 9/17 0542 0.997 0.312 0.685 9/1938 3.349 2.664Nantucket, MA 9/16 2224 1.201 0.103 1.098 10/1991 2.472 1.374Boston, MA 9/16 2042 3.251 0.102 3.149 2/1978 4.648 1.499

15
The highest maximum observed elevation above MHHW due to Hurricane Floyd was 1.480 metersoccurring at Oregon Inlet Marina, NC on September 16 at 1454 GMT. Money Point and HamptonRoads, VA also had maximum observed elevations more than 1 meter above MHHW. Althoughsome of the NWLON stations dropped below MLLW during the period under consideration, nonewent more than 0.5 meters below MLLW. The NWLON stations in Virginia and North Carolina,with the exceptions of Duck and Cape Hatteras, NC, tended to have the highest maximum observedelevations relative to MHHW (Figure 9). Note that the Duck and Cape Hatteras stations are bothon the ocean, adjacent to the narrowest part of the continental shelf on the U.S. Atlantic coast, andalso that the storm track was over land to the west of that section of the North Carolina coastline(Figure 8).
At the three NWLON stations listed in Table 3, Floyd produced a maximum observed elevationgreater than the historical record at the station. At Oregon Inlet Marina, the historical record fromHurricane Bonnie in August 1998 was exceeded by 0.309 meters. At Duke Marine Lab in Beaufort,NC , the previous record from Hurricane Fran in September 1996 was exceeded by 0.099 meters.The previous record at St. Augustine Beach was not associated with a hurricane.
Table 3. NWLON stations with new maximum observed water levels
Station Date of historicalmaximum
Yearsof data
Period ofdata
Increase inmaximum
St. AugustineBeach, FL
9/92 7+ 5/92 - present 0.122 meters
Duke MarineLab, NC
9/96 26+ 2/73 - present 0.099 meters
Oregon InletMarina, NC
8/98 6+ 5/77 - 4/784/94 - present
0.309 meters
The maximum elevations caused by Floyd approached within 0.3 meters of the maximum historicalelevations at nine other locations within or south of Chesapeake Bay. At Wilmington, NC, theNWLON station closest to the location where Floyd came ashore as a Category 2 hurricane, Floydfailed to surpass the historical maximum by 0.255 meters, which was set by Hurricane Hazel in 1954as it made landfall near the border between North and South Carolina as a Category 4 hurricane(Figure 10). However, Floyd did surpass, by 0.097 meters, the level reached in 1996 when HurricaneFran made landfall near Cape Fear as a Category 3 hurricane .
The time series in Appendix II illustrate a variety of localized responses to the storm. WhileHurricane Floyd passed less than 100 miles to the east of Settlement Point on the western tip ofGrand Bahama Island, the storm had little effect on the water level at that station (Figure 41 inAppendix II), although the bathymetry of the area includes the shallow waters of Little Bahama Bankand the land mass of Grand Bahama Island. For several days before Hurricane Floyd, the stationsfrom Trident Pier, FL to Charleston, SC exhibited elevated water levels at both high and low tides

16
(Figures 43 to 48 in Appendix II). After the storm passed through the area, the water level returnednear to predicted levels.
In contrast, for several days after the storm passed Wilmington, NC, the water levels at low tide wereelevated 0.6 - 0.7 meters above predicted; the water levels at high tide were slightly above predicted(Figure 50 in Appendix II). This elevation was probably due to the increased flow of the Cape FearRiver carrying the runoff from the heavy rainfall throughout the drainage basin of the river(Figure 5). The nonlinearity in the fluid dynamics of shallow bays and estuaries can cause the tidalrange to change during periods of abnormal conditions (Parker, 1991). Higher than normal riverflows tend to decrease the tidal range.
At most stations, the maximum observed elevation occurred very close to the time of a predictedhigh tide. However, at a few stations listed in Table 4, the intensity of the storm caused themaximum observed elevation to occur significantly earlier or later than the predicted high tide, withthe greatest tide prediction error at Duke Marine Lab, NC.
Table 4. Greatest timing differences of the maximum observedwater levels during Hurricane Floyd relative to predicted high tide
Wilmington, NC 1 hour 18 minutes later
Duke Marine Lab, NC 4 hours 30 minutes later
Gloucester Point, VA 2 hours 48 minutes earlier
Oregon Inlet Marina, NC 2 hours 12 minutes earlier
Cambridge, MD 2 hours 6 minutes earlier
Hampton Roads, VA 1 hour 36 minutes earlier
Money Point, VA 1 hour 30 minutes earlier
Chesapeake Bay Bridge Tunnel, VA 42 minutes earlier
Kiptopeke Beach, VA 36 minutes earlier
2/7810/91
9/38 Unnamed9/38 Unnamed
9/38 Unnamed9/38 Unnamed
9/38 Unnamed1/99
9/38 Unnamed8/54 Carol
9/60 Donna3/84
9/60 Donna12/929/85 Gloria
11/5010/80
3/622/98
3/629/96 Fran
8/55 Connie9/96 Fran
2/982/98
3/628/33 Unnamed
2/982/98
10/978/98 Bonnie
10/979/96 Fran
10/54 Hazel1/87
9/89 Hugo10/47 Unnamed
10/1898 Unnamed9/64 Dora
9/928/95 Erin
11/94 Gordon
0.0
0.5
1.0
1.5
2.0
2.5
3.0
3.5
4.0
Boston, MA
Nantucket, MA
Woods Hole, MA
Newport, RI
Providence, RI
New London, CT
Bridgeport, CT
Kings Point, NY
Willets Point, NY
Montauk, NY
The Battery, NY
Bergen Point, NY
Sandy Hook, NJ
Atlantic City, NJ
Cape May, NJ
Philadelphia, PA
Reedy Point, DE
Lewes, DE
Wachapreague, VA
Kiptopeke Beach, VA
Cambridge, MD
Solomons, MD
Colonial Beach, VA
Lewisetta, VA
Windmill Point, VA
Gloucester Point, VA
Hampton Roads, VA
Money Point, VA
Ches. Bay Brdg. Tnl., VA
Duck Pier, NC
Oregon Inlet Marina, NC
Cape Hatteras, NC
Duke Marine Lab, NC
Wilmington, NC
Springmaid Pier, SC
Charleston, SC
Fort Pulaski, GA
Fernandina Beach, FL
Mayport, FL
St Augustine Beach, FL
Trident Pier, FL
Virginia Key, FL
Settlement Point, BA
Meters above MHHW
Hurricane Floyd
Historical
Figure 9. Com
parison of historical maxim
um observed elevations (relative to M
HH
W) to the m
aximum
observed elevationsduring H
urricane Floyd – September 13-19, 1999. M
onth and year of historical maxim
um elevations are indicated. H
istoricalm
aximum
elevations caused by hurricanes are labeled and those caused by winter storm
s are unlabeled. Hurricanes before
1950 were unnam
ed.
17

Figure 10. Landfall location map of the U
.S. for all hurricanes during 1899-1996 classified from C
ategory 3 to Category 5 at
time of landfall [N
CD
C].
18
19
V. Storm Surge
Storm surge is defined as the difference between the observed water level and the predicted tidelevel. The predicted tide is computed using standard NOS harmonic analysis and predictionalgorithms. The timing of the maximum observed water level (discussed in the previous section)is dependent upon the interaction of the tide and the storm. The timing of the maximum storm surgedoes not necessarily coincide with the occurrence of the predicted high tide. Information on themaximum storm surge calculated at each station is found in Table 5 which provides the followingfor each station: the date and time of the maximum storm surge; the observed elevation of the waterabove MLLW at that time; the predicted elevation of the water above MLLW at that time; and thestorm surge value (observed minus predicted elevations).
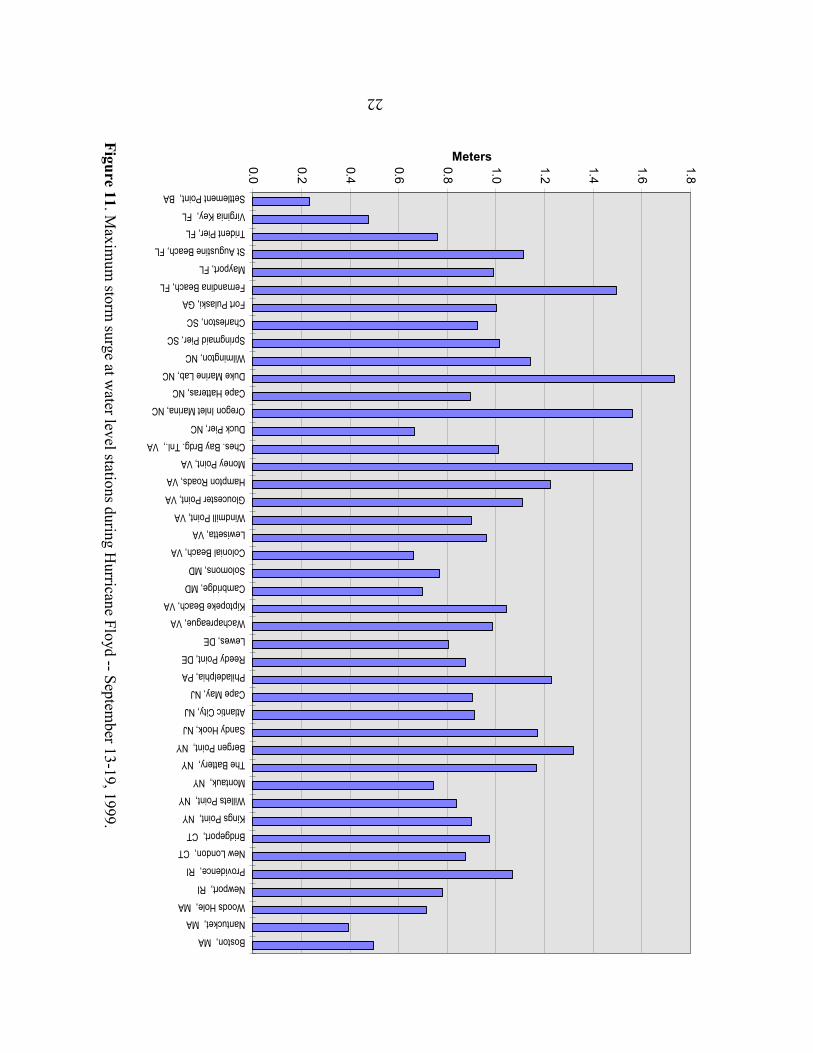
Time series plots of the storm surge were constructed without any smoothing of the observed dataprior to subtracting the predicted time series. Individual plots of the storm surge at each station arefound in Appendix III. Maximum storm surge values for all stations are displayed in Figure 11.Figures 12 through 18 are simultaneous plots of the storm surge for various geographical regionsover a seven-day time period centered around the time of the storm. The wide solid line in thesefigures is the track of the storm. All of the storm surge figures use the same vertical scale (in meters)so that the magnitude of the surge can be put into perspective between stations and regions.
The largest storm surge occurred at Duke Marine Lab, NC. The calculated surge was 1.733 meterson September 16 at 0912 GMT. Storm surge values greater than 1.4 meters also occurred atFernandina Beach, FL, Oregon Inlet Marina, NC, and Money Point, VA (Figure 11).
The storm surge plots for some of the stations show a degree of periodicity at the tidal frequencies.This is attributed to the subtraction of two curves (observed and predicted) that may be slightly outof phase because of the storm, and to the effect of a prolonged storm surge in modifying the normalshape of the observed tide curve.
First, the storm surge for nine selected stations that are closest to the open ocean are shown inFigure 12. These records are more representative of the storm’s effect on continental shelf waterlevels and less influenced by the localized effects of bays and estuaries. There was a generalcorrelation between the time of the maximum storm surge and the time of the passage of thehurricane, but several factors influenced the time, height, and duration of the surge. The locationof the station with respect to the track of the storm, the local orientation of the coastline with respectto the direction of prevailing winds, and the storm’s strength and speed at the time of passagecontributed to the amount of storm surge.
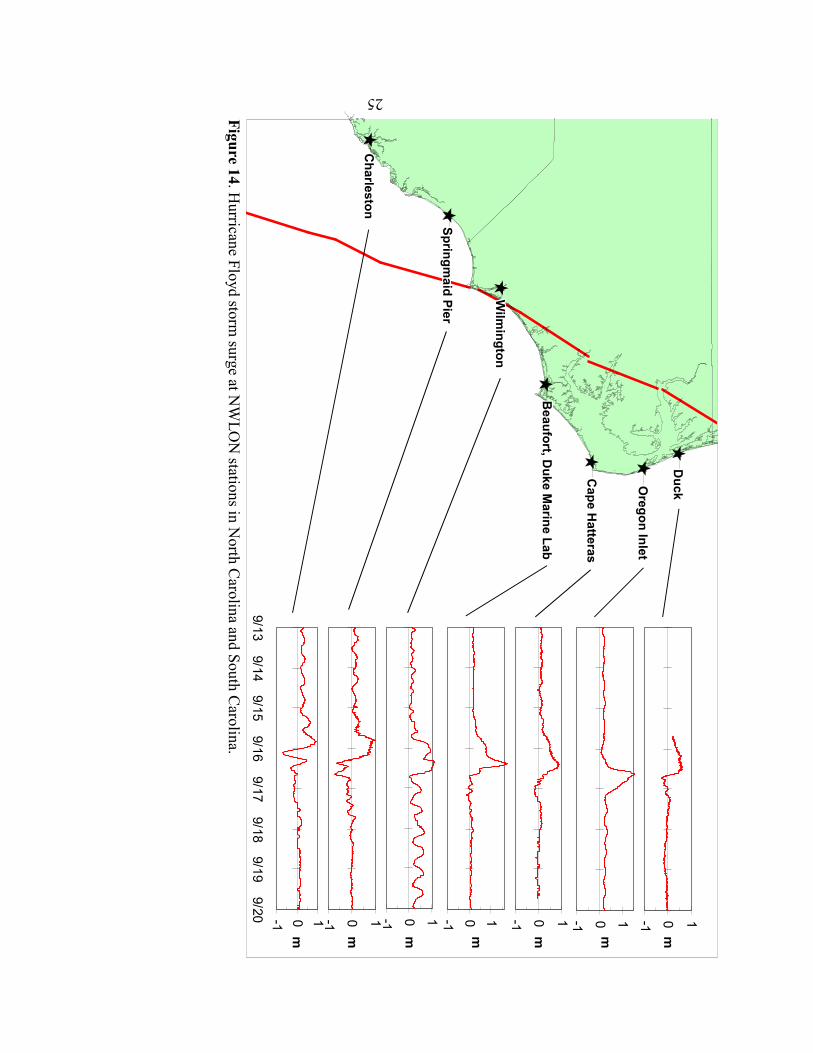
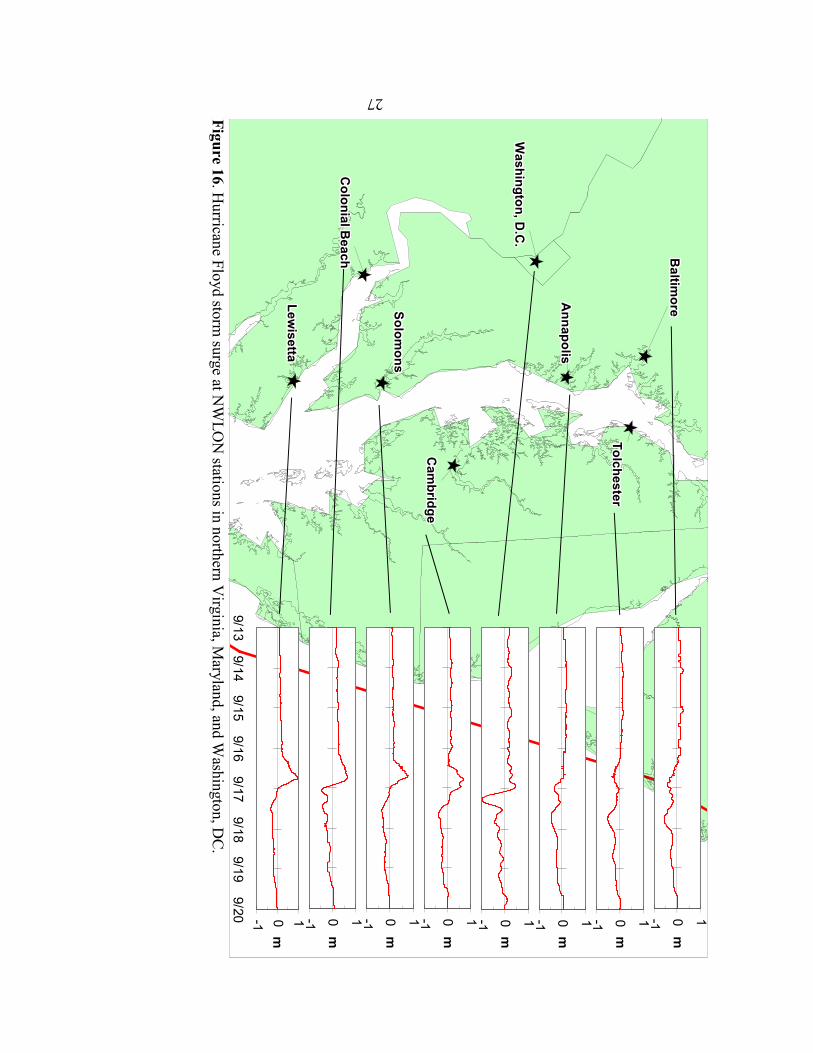
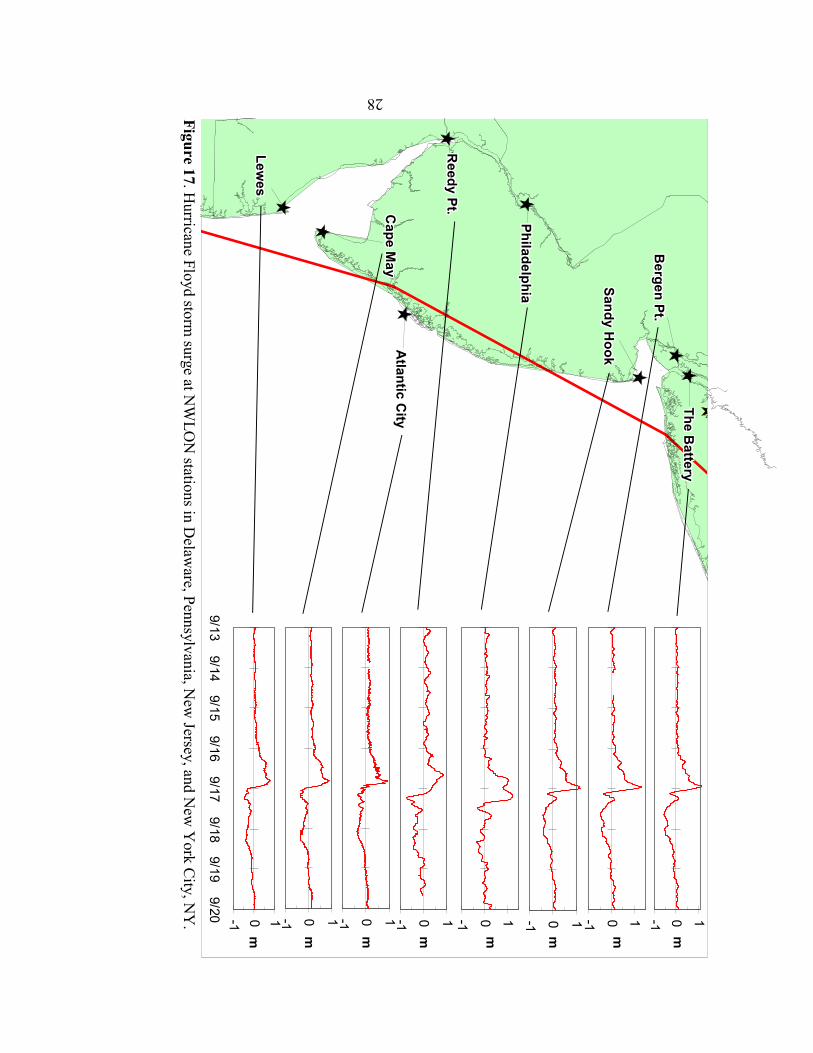
Storm surges for six regions of the Atlantic coast are shown along with the track of Hurricane Floyd(Figures 13 to 18): Florida/Georgia, the Carolinas, lower Chesapeake Bay, upper ChesapeakeBay/Potomac River, Delaware Bay/New Jersey/New York Harbor, and Long Island Sound/RhodeIsland/Massachusetts. A wide variety of storm surges were observed. Many of the stations withlarger surges are located in sounds or bays where persistent winds from the storm pushed water intoenclosed areas and held it there through a complete tidal cycle causing the water level to remainunusually high during the time of the predicted low tide. After the storm passed and the wind
20
changed direction, these stations showed a rapid drop in water elevation as the water that was heldin the embayment was pushed out to sea. Prominent negative storm surges were seen at Kings Point,NY (-1.073 m), Washington, DC (-0.977 m), Bridgeport, CT (-0.843 m), and Willets Point, NY(-0.838 m). Nine other stations showed negative storm surges greater than 0.5 meters.

21
Table 5. Maximum storm surge (meters) for Hurricane Floyd 1999
Station Date/Time (GMT) Elevation Above MLLW Storm(mo./day, hr.min.) Observed Predicted Surge
Settlement Point, BA 9/15 0836 0.507 0.272 0.235Virginia Key, FL 9/15 0730 0.943 0.470 0.473Trident Pier, FL 9/15 0418 1.858 1.096 0.762St Augustine Beach, FL 9/15 1112 1.450 0.338 1.112Mayport, FL 9/15 1006 1.294 0.307 0.987Fernandina Beach, FL 9/15 1018 1.584 0.088 1.496Fort Pulaski, GA 9/15 0848 1.556 0.552 1.004Charleston, SC 9/15 2018 1.772 0.845 0.927Springmaid Pier, SC 9/15 1918 1.987 0.971 1.016Wilmington, NC 9/16 0830 2.171 1.028 1.143Duke Marine Lab, NC 9/16 0912 2.040 0.307 1.733Cape Hatteras, NC 9/16 0942 1.127 0.232 0.895Oregon Inlet Marina, NC 9/16 1454 1.847 0.285 1.562Duck Pier, NC 9/16 1054 0.936 0.271 0.665Ches. Bay Brdg. Tnl., VA 9/16 1606 1.829 0.816 1.013Money Point, VA 9/16 1706 2.262 0.703 1.559Hampton Roads, VA 9/16 1624 1.937 0.714 1.223Gloucester Point, VA 9/16 1542 1.654 0.544 1.110Windmill Point, VA 9/16 1554 1.130 0.233 0.897Lewisetta, VA 9/16 1706 1.137 0.177 0.960Colonial Beach, VA 9/16 1742 0.795 0.132 0.663Solomons, MD 9/16 1636 0.953 0.185 0.768Cambridge, MD 9/16 1854 0.864 0.166 0.698Kiptopeke Beach, VA 9/16 1612 1.832 0.787 1.045Wachapreague, VA 9/16 0912 1.461 0.476 0.985Lewes, DE 9/16 1912 2.060 1.256 0.804Reedy Point, DE 9/16 1524 1.170 0.295 0.875Philadelphia, PA 9/17 0500 1.686 0.458 1.228Cape May, NJ 9/16 1930 2.210 1.308 0.902Atlantic City, NJ 9/16 2000 1.692 0.784 0.908Sandy Hook, NJ 9/16 2330 1.515 0.344 1.171Bergen Point, NY 9/16 2318 1.727 0.410 1.317The Battery, NY 9/16 2248 1.649 0.482 1.167Montauk, NY 9/17 0036 0.978 0.238 0.740Willets Point, NY 9/17 0136 1.432 0.594 0.838Kings Point, NY 9/16 1712 1.738 0.839 0.899Bridgeport, CT 9/17 0154 1.449 0.476 0.973New London, CT 9/17 0048 1.138 0.262 0.876Providence, RI 9/17 0206 1.754 0.687 1.067Newport, RI 9/17 0136 1.270 0.491 0.779Woods Hole, MA 9/17 0100 0.959 0.245 0.714Nantucket, MA 9/17 0312 0.579 0.188 0.391Boston, MA 9/17 0100 1.508 1.008 0.500
0.0
0.2
0.4
0.6
0.8
1.0
1.2
1.4
1.6
1.8Boston, MA
Nantucket, MA
Woods Hole, MA
Newport, RI
Providence, RI
New London, CT
Bridgeport, CT
Kings Point, NY
Willets Point, NY
Montauk, NY
The Battery, NY
Bergen Point, NY
Sandy Hook, NJ
Atlantic City, NJ
Cape May, NJ
Philadelphia, PA
Reedy Point, DE
Lewes, DE
Wachapreague, VA
Kiptopeke Beach, VA
Cambridge, MD
Solomons, MD
Colonial Beach, VA
Lewisetta, VA
Windmill Point, VA
Gloucester Point, VA
Hampton Roads, VA
Money Point, VA
Ches. Bay Brdg. Tnl., VA
Duck Pier, NC
Oregon Inlet Marina, NC
Cape Hatteras, NC
Duke Marine Lab, NC
Wilmington, NC
Springmaid Pier, SC
Charleston, SC
Fort Pulaski, GA
Fernandina Beach, FL
Mayport, FL
St Augustine Beach, FL
Trident Pier, FL
Virginia Key, FL
Settlement Point, BA
Meters
Figure 11. Maxim
um storm
surge at water level stations during H
urricane Floyd -- September 13-19, 1999.
22

-1 0 1
9/139/14
9/159/16
9/179/18
9/199/20
m
Sandy Hook
Sandy Hook
Sandy Hook
Sandy Hook
Sandy Hook
Sandy Hook
Sandy Hook
Sandy Hook
Sandy Hook
Lewes
Lewes
Lewes
Lewes
Lewes
Lewes
Lewes
Lewes
Lewes
Montauk
Montauk
Montauk
Montauk
Montauk
Montauk
Montauk
Montauk
Montauk
Ches. B
ay Brdg. Tnl.
Ches. B
ay Brdg. Tnl.
Ches. B
ay Brdg. Tnl.
Ches. B
ay Brdg. Tnl.
Ches. B
ay Brdg. Tnl.
Ches. B
ay Brdg. Tnl.
Ches. B
ay Brdg. Tnl.
Ches. B
ay Brdg. Tnl.
Ches. B
ay Brdg. Tnl.
Cape H
atterasC
ape Hatteras
Cape H
atterasC
ape Hatteras
Cape H
atterasC
ape Hatteras
Cape H
atterasC
ape Hatteras
Cape H
atteras
Springmaid Pier
Springmaid Pier
Springmaid Pier
Springmaid Pier
Springmaid Pier
Springmaid Pier
Springmaid Pier
Springmaid Pier
Springmaid Pier
Fort PulaskiFort PulaskiFort PulaskiFort PulaskiFort PulaskiFort PulaskiFort PulaskiFort PulaskiFort Pulaski
Mayport
Mayport
Mayport
Mayport
Mayport
Mayport
Mayport
Mayport
Mayport
Trident PierTrident PierTrident PierTrident PierTrident PierTrident PierTrident PierTrident PierTrident Pier
Figure 12. Hurricane Floyd storm
surge at selected US A
tlantic coast NW
LON
stations on or close to the ocean.
-1 0 1m
-1 0 1
m
-1 0 1
m
-1 0 1
m
-1 0 1
m
-1 0 1
m
-1 0 1
m
-1 0 1
m
23

-1 0 1
m
Settlement Pt.
Settlement Pt.
Settlement Pt.
Settlement Pt.
Settlement Pt.
Settlement Pt.
Settlement Pt.
Settlement Pt.
Settlement Pt.
Virginia Key
Virginia Key
Virginia Key
Virginia Key
Virginia Key
Virginia Key
Virginia Key
Virginia Key
Virginia Key
Fort PulaskiFort PulaskiFort PulaskiFort PulaskiFort PulaskiFort PulaskiFort PulaskiFort PulaskiFort Pulaski
Trident PierTrident PierTrident PierTrident PierTrident PierTrident PierTrident PierTrident PierTrident Pier
St. Augustine
St. Augustine
St. Augustine
St. Augustine
St. Augustine
St. Augustine
St. Augustine
St. Augustine
St. Augustine
Mayport
Mayport
Mayport
Mayport
Mayport
Mayport
Mayport
Mayport
Mayport
Fernandina Beach
Fernandina Beach
Fernandina Beach
Fernandina Beach
Fernandina Beach
Fernandina Beach
Fernandina Beach
Fernandina Beach
Fernandina Beach
Figure 13. Hurricane Floyd storm
surge at NW
LON
stations in Florida, Georgia, and the B
ahamas.
-1 0 1
m
-1 0 1m
-1 0 1
m
-1 0 1
9/139/14
9/159/16
9/179/18
9/199/20
m
-1 0 1
m
-1 0 1m
24
Oregon Inlet
Oregon Inlet
Oregon Inlet
Oregon Inlet
Oregon Inlet
Oregon Inlet
Oregon Inlet
Oregon Inlet
Oregon Inlet
Charleston
Charleston
Charleston
Charleston
Charleston
Charleston
Charleston
Charleston
Charleston
Springmaid Pier
Springmaid Pier
Springmaid Pier
Springmaid Pier
Springmaid Pier
Springmaid Pier
Springmaid Pier
Springmaid Pier
Springmaid Pier
Wilm
ingtonW
ilmington
Wilm
ingtonW
ilmington
Wilm
ingtonW
ilmington
Wilm
ingtonW
ilmington
Wilm
ington
Beaufort, D
uke Marine Lab
Beaufort, D
uke Marine Lab
Beaufort, D
uke Marine Lab
Beaufort, D
uke Marine Lab
Beaufort, D
uke Marine Lab
Beaufort, D
uke Marine Lab
Beaufort, D
uke Marine Lab
Beaufort, D
uke Marine Lab
Beaufort, D
uke Marine Lab
Cape H
atterasC
ape Hatteras
Cape H
atterasC
ape Hatteras
Cape H
atterasC
ape Hatteras
Cape H
atterasC
ape Hatteras
Cape H
atteras
Duck
Duck
Duck
Duck
Duck
Duck
Duck
Duck
Duck
Figure 14. Hurricane Floyd storm
surge at NW
LON
stations in North C
arolina and South Carolina.
-1 0 1
m
-1 0 1m
-1 0 1m
-1 0 1m
-1 0 1
9/139/14
9/159/16
9/179/18
9/199/20
m
-1 0 1
m
-1 0 1
m
25

Wachapreague
Wachapreague
Wachapreague
Wachapreague
Wachapreague
Wachapreague
Wachapreague
Wachapreague
Wachapreague
Gloucester Pt.
Gloucester Pt.
Gloucester Pt.
Gloucester Pt.
Gloucester Pt.
Gloucester Pt.
Gloucester Pt.
Gloucester Pt.
Gloucester Pt.
Windm
ill Pt.W
indmill Pt.
Windm
ill Pt.W
indmill Pt.
Windm
ill Pt.W
indmill Pt.
Windm
ill Pt.W
indmill Pt.
Windm
ill Pt.
Money Pt.
Money Pt.
Money Pt.
Money Pt.
Money Pt.
Money Pt.
Money Pt.
Money Pt.
Money Pt.
Ches. B
ay Brdg. Tnl.
Ches. B
ay Brdg. Tnl.
Ches. B
ay Brdg. Tnl.
Ches. B
ay Brdg. Tnl.
Ches. B
ay Brdg. Tnl.
Ches. B
ay Brdg. Tnl.
Ches. B
ay Brdg. Tnl.
Ches. B
ay Brdg. Tnl.
Ches. B
ay Brdg. Tnl.
Kiptopeake B
eachK
iptopeake Beach
Kiptopeake B
eachK
iptopeake Beach
Kiptopeake B
eachK
iptopeake Beach
Kiptopeake B
eachK
iptopeake Beach
Kiptopeake B
each
Ham
pton Roads, Sew
ells Pt.H
ampton R
oads, Sewells Pt.
Ham
pton Roads, Sew
ells Pt.H
ampton R
oads, Sewells Pt.
Ham
pton Roads, Sew
ells Pt.H
ampton R
oads, Sewells Pt.
Ham
pton Roads, Sew
ells Pt.H
ampton R
oads, Sewells Pt.
Ham
pton Roads, Sew
ells Pt.
Figure 15. Hurricane Floyd storm
surge at NW
LON
stations in southern Virginia.
-1 0 1
m
-1 0 1
m
-1 0 1
m
-1 0 1
m
-1 0 1m
-1 0 1
9/139/14
9/159/16
9/179/18
9/199/20
m
-1 0 1
m
26
Colonial B
eachC
olonial Beach
Colonial B
eachC
olonial Beach
Colonial B
eachC
olonial Beach
Colonial B
eachC
olonial Beach
Colonial B
each
Solomons
Solomons
Solomons
Solomons
Solomons
Solomons
Solomons
Solomons
Solomons
TolchesterTolchesterTolchesterTolchesterTolchesterTolchesterTolchesterTolchesterTolchester
Cam
bridgeC
ambridge
Cam
bridgeC
ambridge
Cam
bridgeC
ambridge
Cam
bridgeC
ambridge
Cam
bridge
Annapolis
Annapolis
Annapolis
Annapolis
Annapolis
Annapolis
Annapolis
Annapolis
Annapolis
Baltim
oreB
altimore
Baltim
oreB
altimore
Baltim
oreB
altimore
Baltim
oreB
altimore
Baltim
oreLewisetta
Lewisetta
Lewisetta
Lewisetta
Lewisetta
Lewisetta
Lewisetta
Lewisetta
Lewisetta
Washington, D
.C.
Washington, D
.C.
Washington, D
.C.
Washington, D
.C.
Washington, D
.C.
Washington, D
.C.
Washington, D
.C.
Washington, D
.C.
Washington, D
.C.
Figure 16. Hurricane Floyd storm
surge at NW
LON
stations in northern Virginia, M
aryland, and Washington, D
C.
-1 0 1
m
-1 0 1
m
-1 0 1
m
-1 0 1
m
-1 0 1
m
-1 0 1
m
-1 0 1
m
-1 0 1
9/139/14
9/159/16
9/179/18
9/199/20
m
27
The Battery
The Battery
The Battery
The Battery
The Battery
The Battery
The Battery
The Battery
The Battery
Sandy Hook
Sandy Hook
Sandy Hook
Sandy Hook
Sandy Hook
Sandy Hook
Sandy Hook
Sandy Hook
Sandy Hook
Lewes
Lewes
Lewes
Lewes
Lewes
Lewes
Lewes
Lewes
Lewes
Cape M
ayC
ape May
Cape M
ayC
ape May
Cape M
ayC
ape May
Cape M
ayC
ape May
Cape M
ayA
tlantic City
Atlantic C
ityA
tlantic City
Atlantic C
ityA
tlantic City
Atlantic C
ityA
tlantic City
Atlantic C
ityA
tlantic City
Reedy Pt.
Reedy Pt.
Reedy Pt.
Reedy Pt.
Reedy Pt.
Reedy Pt.
Reedy Pt.
Reedy Pt.
Reedy Pt.
PhiladelphiaPhiladelphiaPhiladelphiaPhiladelphiaPhiladelphiaPhiladelphiaPhiladelphiaPhiladelphiaPhiladelphia
Bergen Pt.
Bergen Pt.
Bergen Pt.
Bergen Pt.
Bergen Pt.
Bergen Pt.
Bergen Pt.
Bergen Pt.
Bergen Pt.
Figure 17. Hurricane Floyd storm
surge at NW
LON
stations in Delaw
are, Pennsylvania, New
Jersey, and New
York C
ity, NY
. -1 0 1m
-1 0 1m
-1 0 1
m
-1 0 1
m
-1 0 1m
-1 0 1
m
-1 0 1
9/139/14
9/159/16
9/179/18
9/199/20
m
-1 0 1
m
28

ProvidenceProvidenceProvidenceProvidenceProvidenceProvidenceProvidenceProvidenceProvidence
New
portN
ewport
New
portN
ewport
New
portN
ewport
New
portN
ewport
New
port
New
LondonN
ew London
New
LondonN
ew London
New
LondonN
ew London
New
LondonN
ew London
New
London
Montauk
Montauk
Montauk
Montauk
Montauk
Montauk
Montauk
Montauk
Montauk
Bridgeport
Bridgeport
Bridgeport
Bridgeport
Bridgeport
Bridgeport
Bridgeport
Bridgeport
Bridgeport
King's Pt.
King's Pt.
King's Pt.
King's Pt.
King's Pt.
King's Pt.
King's Pt.
King's Pt.
King's Pt.
Willets Pt.
Willets Pt.
Willets Pt.
Willets Pt.
Willets Pt.
Willets Pt.
Willets Pt.
Willets Pt.
Willets Pt.
Nantucket
Nantucket
Nantucket
Nantucket
Nantucket
Nantucket
Nantucket
Nantucket
Nantucket
Woods H
oleW
oods Hole
Woods H
oleW
oods Hole
Woods H
oleW
oods Hole
Woods H
oleW
oods Hole
Woods H
ole
Boston
Boston
Boston
Boston
Boston
Boston
Boston
Boston
Boston
Figure 18. Hurricane Floyd storm
surge at NW
LON
stations in New
York, C
onnecticut, Rhode Island, and M
assachusetts.
-1 0 1
m
-1 0 1
m
-1 0 1
m
-1 0 1
m
-1 0 1
m
-1 0 1
m
-1 0 1
9/139/14
9/159/16
9/179/18
9/199/20
m
-1 0 1
m
-1 0 1
m
29

30

31
VI. Meteorological Data
A total of sixteen east coast NWLON stations collected ancillary meteorological data including thewind speed, wind direction, and barometric pressure during the passage of Hurricane Floyd. Thestation at Mayport, FL collected wind speed but not wind direction. The stations at Newport, RI andProvidence, RI collected barometric pressure but no wind data. The lowest point of a barometricpressure record at a water level station indicates the time that the storm came closest to that station;a rapid fall and rise in pressure indicates that the center of the hurricane came close to or passed overthat station. Time series plots of all wind speed and barometric pressure data collected at NWLONstations are found in Appendix IV.
Barometric pressure at some representative NWLON stations are plotted in Figures 19 to 21. Thelowest pressures recorded were at Duck, where the pressure dropped to 972.1 mb, and at ChesapeakeBay Bridge Tunnel, where the pressure reached 976.4 mb. The center of the hurricane passedVirginia Key around 2200 GMT on September 14, and Mayport around 2000 GMT onSeptember 15. On September 16, it came close to Duck and Cape Hatteras at 1300 GMT,Chesapeake Bay Bridge Tunnel at 1600 GMT, the northern Chesapeake Bay stations near 2000GMT, and Sandy Hook near 2300 GMT. It passed Newport around 0500 GMT on September 17and Eastport later that day near midnight GMT.
A change in the air pressure over a body of water can raise or lower water levels due to an inversebarometer effect. Low air pressure results in a rise in the level of the water surface, while high airpressure depresses the level of the water surface. A simple rule of thumb is that a 1 millibar changein air pressure corresponds to a 1 centimeter change in water level over open ocean (Harris, 1963).Although many variables will change the magnitude of the inverse barometer effect, rough estimatescan be made of the pressure effect of Hurricane Floyd on the water level. The maximum effect, atthe instant of lowest barometric pressure, could range from about 10 centimeters at Virginia Key,FL to about 50 centimeters at Duck, NC.
During a storm, the effect of the wind stress on water levels is often substantially greater than theinverse barometer effect. Wind stress acting on the surface of a shallow body of water with a solidboundary creates a slope against the boundary. A reduced slope forms for a deeper body of watersince a countercurrent at depth is induced to oppose the effect of wind stress on the surface slope,resulting in upwelling or downwelling at the boundary. Since wind stress is proportional to thesquare of wind speed, large changes in water levels can be caused by winds over shallow water(Harris, 1963). In Figures 22 to 33, wind vectors and storm surges are plotted for the three days ofSeptember 15, 16, and 17, before and after the passage of the storm.
There was an interesting contrast in the storm surges of the three NWLON stations on the OuterBanks of North Carolina (Figures 22 to 24). The stations at Cape Hatteras and Duck, which arelocated on the ocean side of the Outer Banks, show rising water levels as Floyd approached withincreasing easterly winds pushing water toward shore. The station at Oregon Inlet Marina, whichis located on the Pamlico Sound side of the Outer Banks, initially did not respond to the approachingstorm. As the storm passed by, the wind speed rose to a maximum of about 30 m/s and rotated toa southerly direction, followed by a westerly direction. The water levels at Cape Hatteras and Duck

32
rapidly dropped back to normal as water was pushed away from shore. In contrast, the water levelat Oregon Inlet Marina began a rapid rise in response to a southerly wind direction, reaching amaximum storm surge about twice the maximum storm surges at Cape Hatteras and Duck. This waslikely caused by the water in shallow Pamlico Sound being pushed toward the north. As the windspeed dropped over a period of 24 hours, the water level at Oregon Inlet Marina slowly returned tonormal.
At most of the NWLON stations, the storm surge level rose before the passage of the storm and fellafter the passage of the storm. The change in wind direction as the center of the storm passed,indicated a change in the trend of the storm surge at the station. The closer the hurricane came toa station, the quicker the wind changed direction as the center passed by. At Chesapeake Bay BridgeTunnel, VA, Hampton Roads, VA, Sandy Hook, NY, Bergen Point, NY and Kings Point, NY, thewind direction rotated over 90 degrees within an hour, near the time of maximum storm surge.
At some locations, where the winds following the storm’s passage were sustained, the storm surgebecame negative. The largest negative storm surges occurred in upper Chesapeake Bay and westernLong Island Sound. At Tolchester Beach, MD (Figure 30), there was no positive storm surge as therise in water level from southern Chesapeake Bay did not propagate far enough north, beforenortherly winds began to push the water of northern Chesapeake Bay toward the south. At KingsPoint, NY (Figure 33), unlike the nearby stations at Bergen Point and Sandy Hook, there was a delayof about 6 hours after the local winds shifted direction, before the water level began falling. Thiscould be because the wind at Kings Point was not representative of the winds over Long IslandSound, which has an effect on Kings Point water levels.
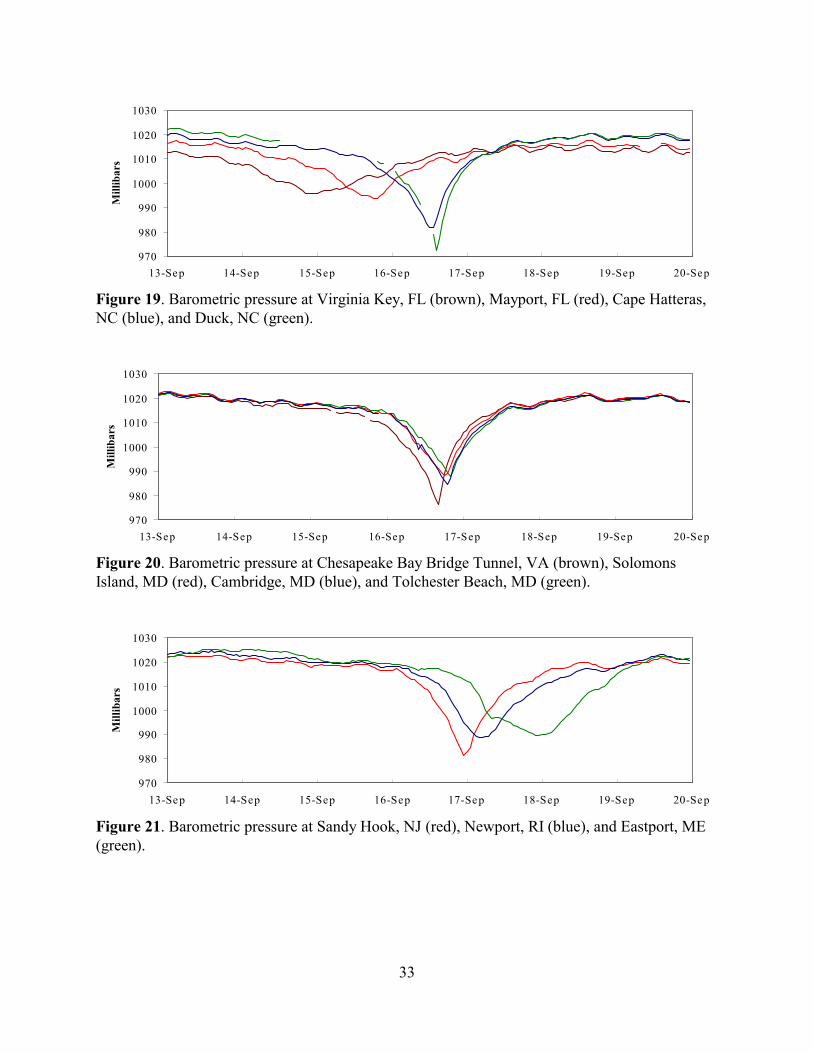
33
970
980
990
1000
1010
1020
1030
13-Sep 14-Sep 15-Sep 16-Sep 17-Sep 18-Sep 19-Sep 20-Sep
Mill
ibar
s
Figure 19. Barometric pressure at Virginia Key, FL (brown), Mayport, FL (red), Cape Hatteras,NC (blue), and Duck, NC (green).
970
980
990
1000
1010
1020
1030
13-Sep 14-Sep 15-Sep 16-Sep 17-Sep 18-Sep 19-Sep 20-Sep
Mill
ibar
s
Figure 20. Barometric pressure at Chesapeake Bay Bridge Tunnel, VA (brown), SolomonsIsland, MD (red), Cambridge, MD (blue), and Tolchester Beach, MD (green).
970
980
990
1000
1010
1020
1030
13-Sep 14-Sep 15-Sep 16-Sep 17-Sep 18-Sep 19-Sep 20-Sep
Mill
ibar
s
Figure 21. Barometric pressure at Sandy Hook, NJ (red), Newport, RI (blue), and Eastport, ME(green).
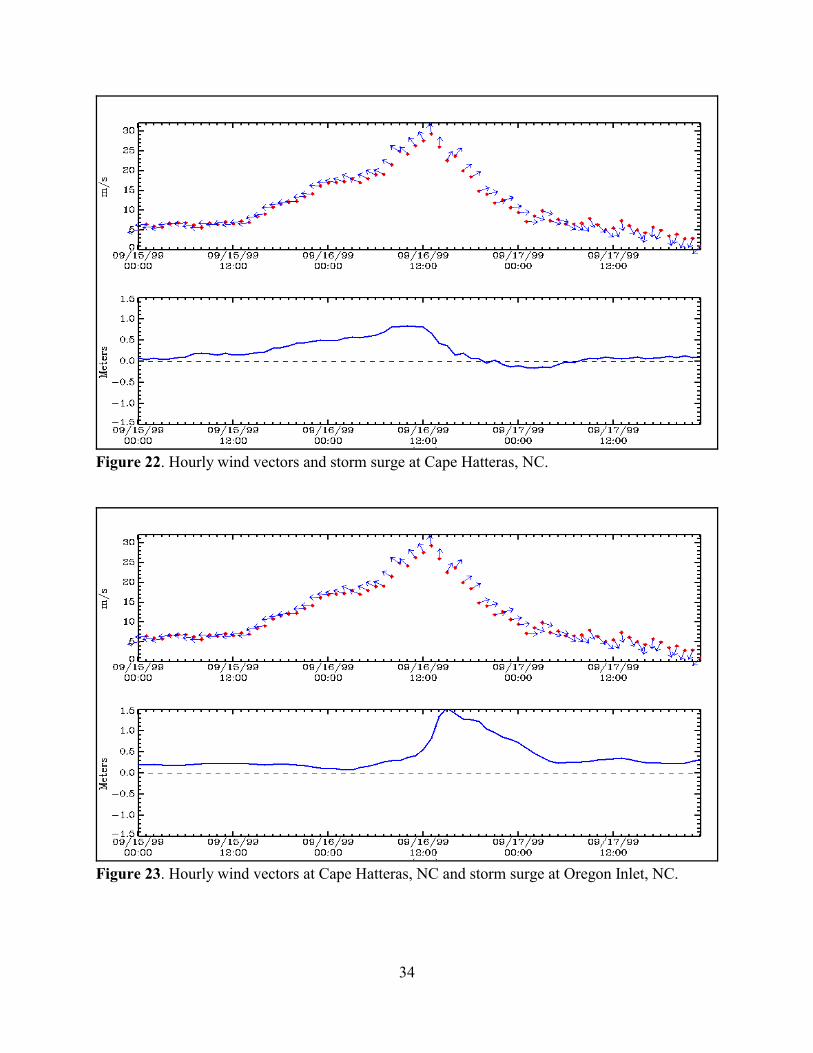
34
Figure 22. Hourly wind vectors and storm surge at Cape Hatteras, NC.
Figure 23. Hourly wind vectors at Cape Hatteras, NC and storm surge at Oregon Inlet, NC.

35
Figure 25. Hourly wind vectors and storm surge at Chesapeake Bay Bridge Tunnel, VA.
Figure 24. Hourly wind vectors and storm surge at Duck, NC.
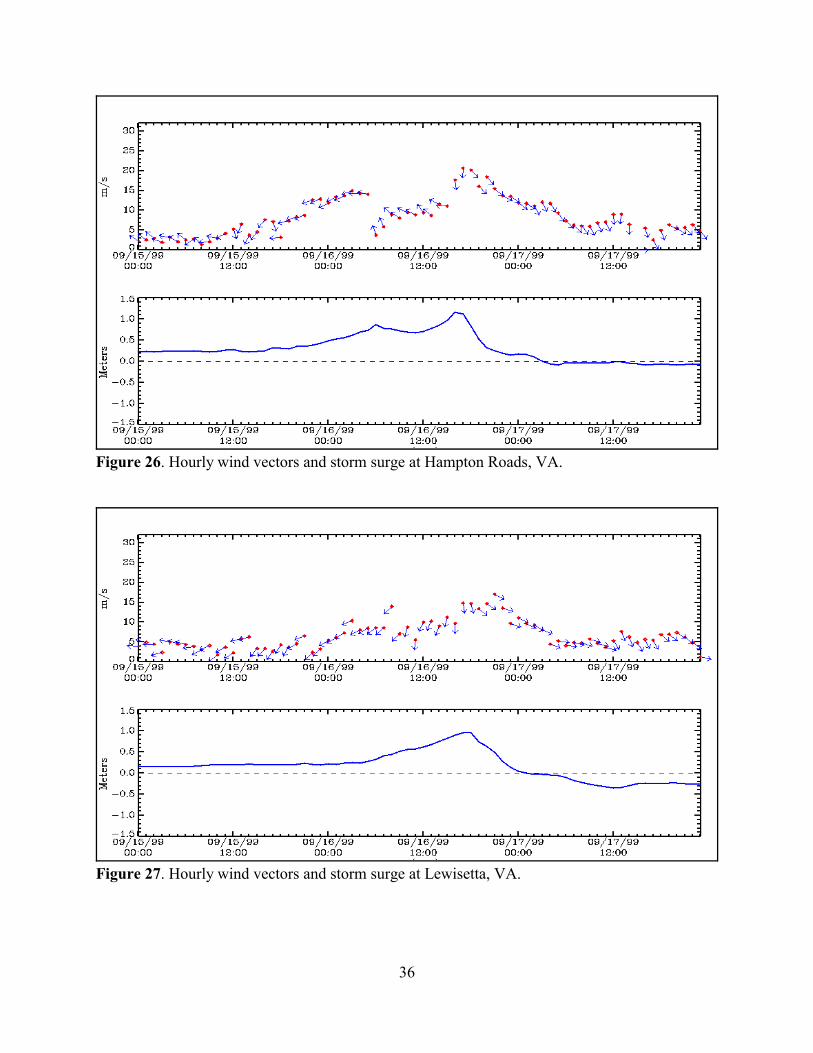
36
Figure 26. Hourly wind vectors and storm surge at Hampton Roads, VA.
Figure 27. Hourly wind vectors and storm surge at Lewisetta, VA.
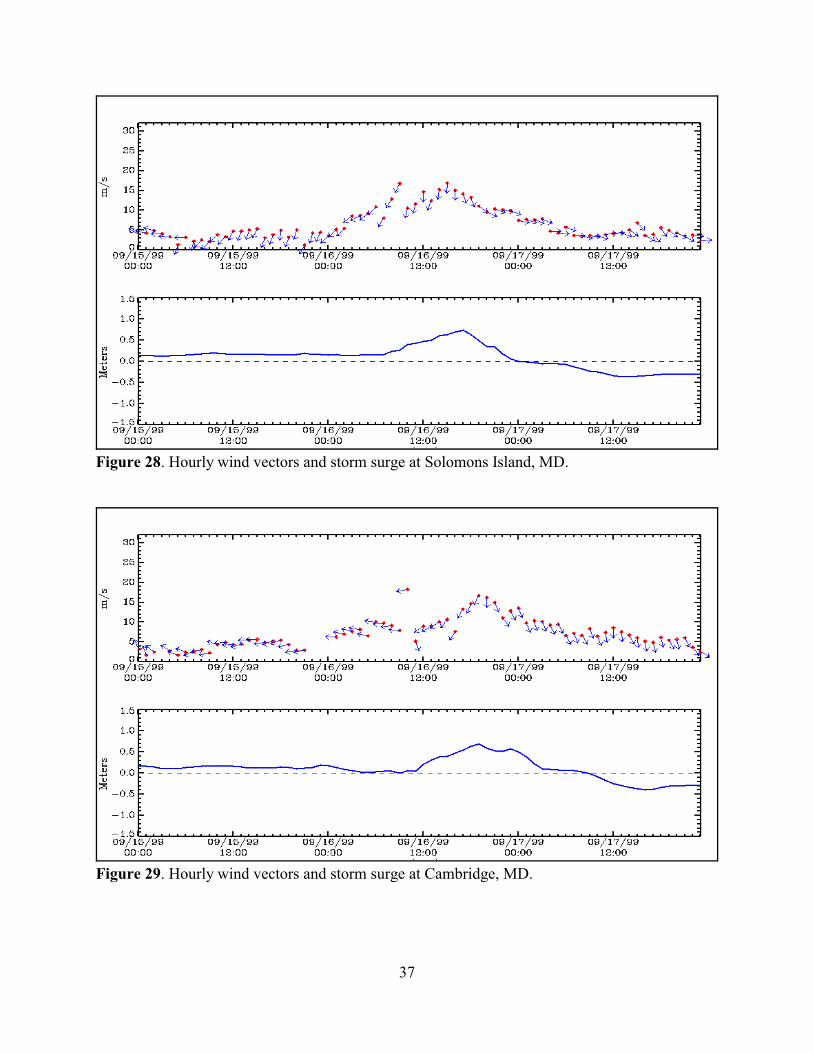
37
Figure 28. Hourly wind vectors and storm surge at Solomons Island, MD.
Figure 29. Hourly wind vectors and storm surge at Cambridge, MD.
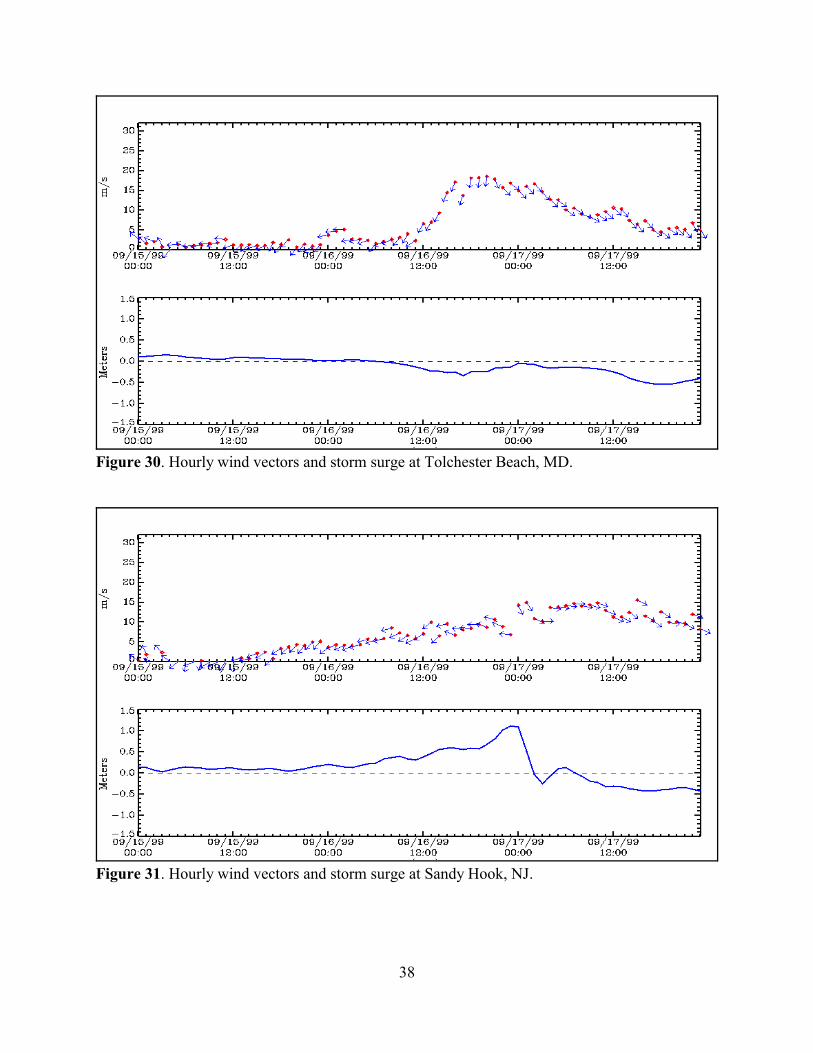
38
Figure 30. Hourly wind vectors and storm surge at Tolchester Beach, MD.
Figure 31. Hourly wind vectors and storm surge at Sandy Hook, NJ.
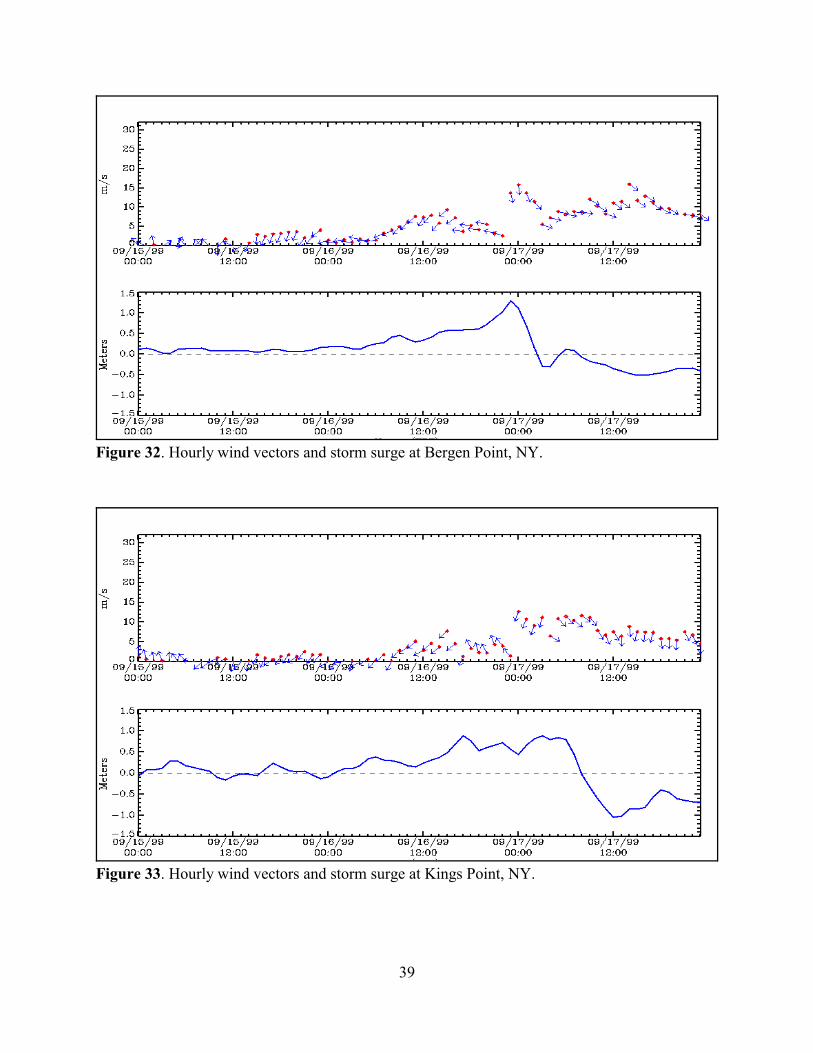
39
Figure 32. Hourly wind vectors and storm surge at Bergen Point, NY.
Figure 33. Hourly wind vectors and storm surge at Kings Point, NY.

40

41
VII. Currents near Hampton Roads, VA
Mariners have always required accurate and dependable information on the movement of the watersin which they navigate, and this has become even more important in recent years as the volume ofseagoing commerce and the size of ships has increased, leading to greater risk in the Nation's ports.One of the responsibilities of CO-OPS is to acquire, archive, and disseminate information on tidalcurrents in U.S. ports and estuaries. The CO-OPS Current Observation Program (COP) has the goalof improving the quality and accuracy of the NOS Tidal Current Tables. The information in thetables is a critical part of NOS’ efforts toward promoting safe navigation in our Nation’s waterways.
During the spring and summer months of 1999, CO-OPS conducted a small oceanographic surveyof the currents in the lower Chesapeake Bay. Over the decades, the currents have been affected byextensive dredging and deepening of channels, new harbor and channel construction, and othernatural and man-made modifications. In addition, the large military presence and heavy volume ofshipping in the lower Chesapeake Bay called for the latest technology in evaluating the accuracy andadequacy of the NOS tidal current predictions. From the mouth of the Bay near Cape Henry toNewport News, five new current meter stations were occupied in a 23-mile stretch. An acousticDoppler current profiler (ADCP) was deployed at the five stations, each for more than two months,producing valuable new information on the currents. The ADCPs are deployed on the bottom andsample currents in 1-meter layers from a level close to the instrument head to a level near the surface.
Currents in the lower Chesapeake Bay are tidally dominated; they are primarily driven by theastronomical tides on the mid-Atlantic continental shelf. The tidal currents are semidiurnal,consisting of two flood and two ebb periods each day. They are rectilinear and reversing, in that thewater flows alternately in approximately opposite directions, with a slack water at each reversal ofdirection. Maximum tidal current velocities in the lower Bay generally range from less than ½ knotto slightly over 2 knots.
Two ADCP current meters were operating in the lower Chesapeake Bay during the time that Floydtransited the Norfolk area on September 16, 1999 (Figure 34). The first station was located just tothe east of Craney Island in the main shipping channel near the mouth of the Elizabeth River, at adepth of approximately 54 feet below MLLW. The second station was located just off of the mainshipbuilding docks of Newport News in the main shipping channel near the mouth of the JamesRiver, at a depth of approximately 53 feet below MLLW.
The highest current speeds measured by an ADCP are generally at the level nearest the water surface.Only the currents at this level will be discussed in this report. The maximum current speed observedduring the 68-day measurement period at the Craney Island station was at a depth of 7.0 feet belowMLLW. The maximum current speed observed during the 68-day measurement period at theNewport News station was at a depth of 5.6 feet below MLLW. Both maxima occurred onSeptember 16 as Hurricane Floyd passed over the area.
Tidal current constituents were derived using a least squares harmonic analysis and used to predictthe tidal currents for the entire measurement periods. A time series plot representing the measuredcurrents and the tidal current predictions at Craney Island, along the flood current azimuth of 183b
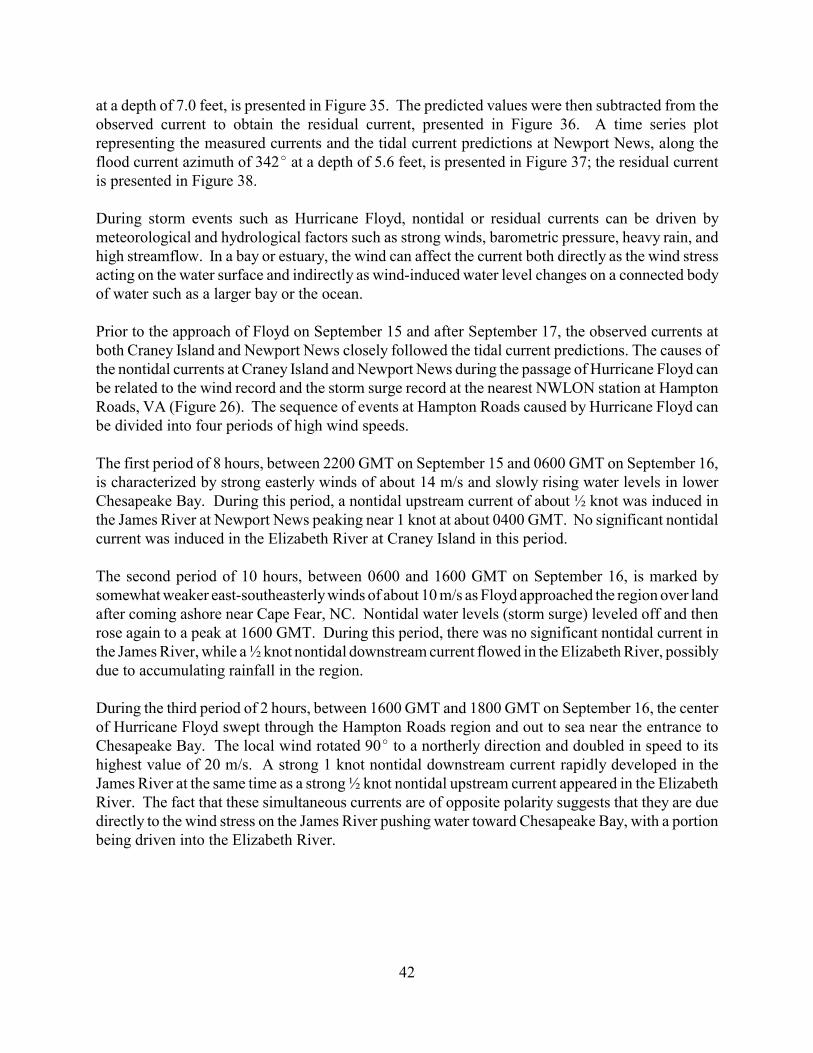
42
at a depth of 7.0 feet, is presented in Figure 35. The predicted values were then subtracted from theobserved current to obtain the residual current, presented in Figure 36. A time series plotrepresenting the measured currents and the tidal current predictions at Newport News, along theflood current azimuth of 342b at a depth of 5.6 feet, is presented in Figure 37; the residual currentis presented in Figure 38.
During storm events such as Hurricane Floyd, nontidal or residual currents can be driven bymeteorological and hydrological factors such as strong winds, barometric pressure, heavy rain, andhigh streamflow. In a bay or estuary, the wind can affect the current both directly as the wind stressacting on the water surface and indirectly as wind-induced water level changes on a connected bodyof water such as a larger bay or the ocean.
Prior to the approach of Floyd on September 15 and after September 17, the observed currents atboth Craney Island and Newport News closely followed the tidal current predictions. The causes ofthe nontidal currents at Craney Island and Newport News during the passage of Hurricane Floyd canbe related to the wind record and the storm surge record at the nearest NWLON station at HamptonRoads, VA (Figure 26). The sequence of events at Hampton Roads caused by Hurricane Floyd canbe divided into four periods of high wind speeds.
The first period of 8 hours, between 2200 GMT on September 15 and 0600 GMT on September 16,is characterized by strong easterly winds of about 14 m/s and slowly rising water levels in lowerChesapeake Bay. During this period, a nontidal upstream current of about ½ knot was induced inthe James River at Newport News peaking near 1 knot at about 0400 GMT. No significant nontidalcurrent was induced in the Elizabeth River at Craney Island in this period.
The second period of 10 hours, between 0600 and 1600 GMT on September 16, is marked bysomewhat weaker east-southeasterly winds of about 10 m/s as Floyd approached the region over landafter coming ashore near Cape Fear, NC. Nontidal water levels (storm surge) leveled off and thenrose again to a peak at 1600 GMT. During this period, there was no significant nontidal current inthe James River, while a ½ knot nontidal downstream current flowed in the Elizabeth River, possiblydue to accumulating rainfall in the region.
During the third period of 2 hours, between 1600 GMT and 1800 GMT on September 16, the centerof Hurricane Floyd swept through the Hampton Roads region and out to sea near the entrance toChesapeake Bay. The local wind rotated 90b to a northerly direction and doubled in speed to itshighest value of 20 m/s. A strong 1 knot nontidal downstream current rapidly developed in theJames River at the same time as a strong ½ knot nontidal upstream current appeared in the ElizabethRiver. The fact that these simultaneous currents are of opposite polarity suggests that they are duedirectly to the wind stress on the James River pushing water toward Chesapeake Bay, with a portionbeing driven into the Elizabeth River.

43
Figure 34. Station location map for the lower Chesapeake Bay area.
The fourth period of 11 hours, from 1800 GMT on September 16 to 0500 GMT on September 17,is characterized by northwesterly winds gradually weakening from 20 m/s to 10 m/s and droppingnontidal water levels due to water being driven out of Chesapeake Bay, rapidly at first and then moreslowly. During this period, strong nontidal downstream currents were dominating the flows in boththe James and the Elizabeth Rivers. These nontidal downstream currents peaked at about 2½ knotson the James River and about 1¼ knots on the Elizabeth River, at about 1900 GMT on September16. A smaller current pulse with about half the speeds peaked at about 0400 GMT on September17.
The nontidal currents caused by the passage of Hurricane Floyd over the Hampton Roads regionwere strong enough to significantly change the timing and amplitude of the predicted flood and ebbtidal currents. At Craney Island in the Elizabeth River, two floods and two ebbs were affected byFloyd (Figure 35). At Newport News in the James River, three floods and two ebbs were affectedby Floyd (Figure 37). The timing of some of the predicted slack periods were also shifted by severalhours at both locations.
current meter location
water level gage location
Newport News
Craney Island
Hampton Roads
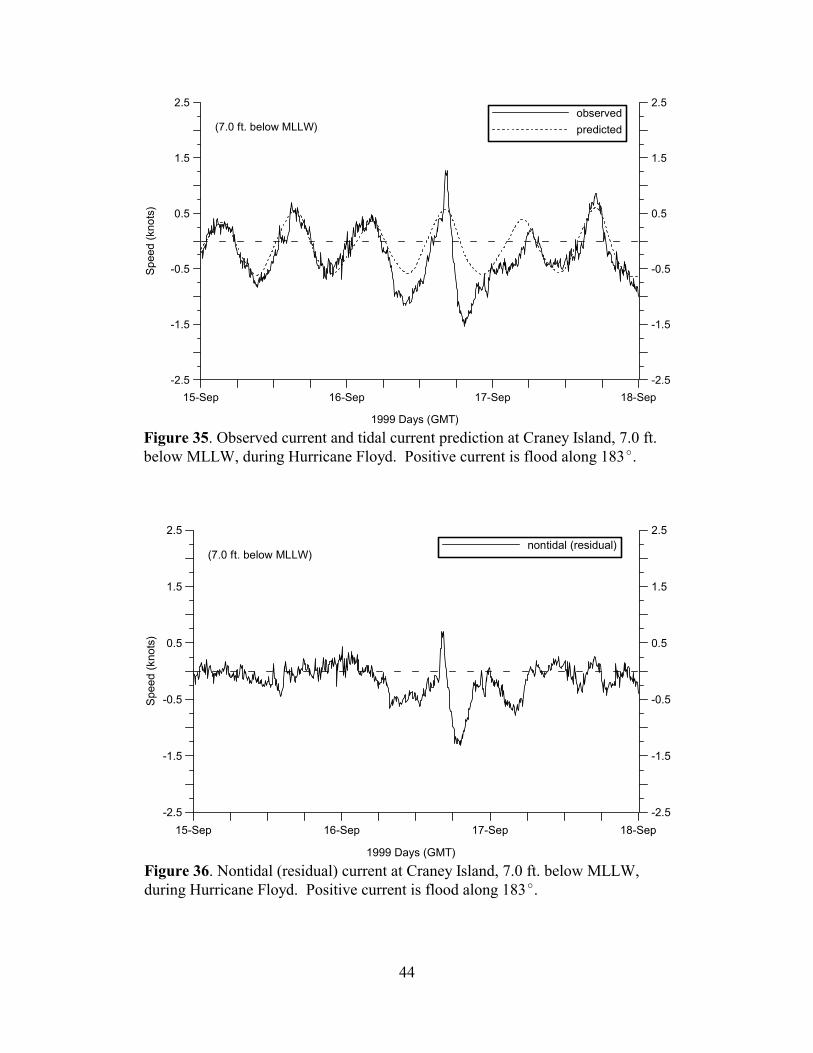
44
15-Sep 16-Sep 17-Sep 18-Sep
1999 Days (GMT)
-2.5
-1.5
-0.5
0.5
1.5
2.5
-2.5
-1.5
-0.5
0.5
1.5
2.5
Spee
d (k
nots
)
observedpredicted(7.0 ft. below MLLW)
Figure 35. Observed current and tidal current prediction at Craney Island, 7.0 ft.below MLLW, during Hurricane Floyd. Positive current is flood along 183b.
15-Sep 16-Sep 17-Sep 18-Sep
1999 Days (GMT)
-2.5
-1.5
-0.5
0.5
1.5
2.5
-2.5
-1.5
-0.5
0.5
1.5
2.5
Spee
d (k
nots
)
nontidal (residual)(7.0 ft. below MLLW)
Figure 36. Nontidal (residual) current at Craney Island, 7.0 ft. below MLLW,during Hurricane Floyd. Positive current is flood along 183b.

45
15-Sep 16-Sep 17-Sep 18-Sep
1999 Days (GMT)
-2.5
-1.5
-0.5
0.5
1.5
2.5
-2.5
-1.5
-0.5
0.5
1.5
2.5
Spee
d (k
nots
)
observedpredicted(5.6 ft. below MLLW)
Figure 37. Observed current and tidal current prediction at Newport News, 5.6 ft.below MLLW, during Hurricane Floyd. Positive current is flood along 342b.
15-Sep 16-Sep 17-Sep 18-Sep
1999 Days (GMT)
-2.5
-1.5
-0.5
0.5
1.5
2.5
-2.5
-1.5
-0.5
0.5
1.5
2.5
Spee
d (k
nots
)
nontidal (residual)(5.6 ft. below MLLW)
Figure 38. Nontidal (residual) current at Newport News, 5.6 ft. below MLLW,during Hurricane Floyd. Positive current is flood along 342b.

46

47
VIII. Operation of the Real-Time Monitoring System
In addition to running the NWLP, CO-OPS is responsible for the operation and maintenance of fourPhysical Oceanographic Real Time Systems (PORTS). To monitor the PORTS sensors and the dataquality, the Continuous Operational Real-Time Monitoring System (CORMS) was developed. Theobjective of CORMS is to provide quality control and decision support on a 24-hour a day, 7-daya week basis. CORMS combines the use of real-time communications and data analysis with agraphical user interface for monitoring and notification. CORMS is monitored by a team of qualifiedtechnicians who perform designated actions based on standard operating procedures. It is co-locatedwith the NWS Telecommunications Gateway office in Silver Spring, MD.
In addition, some specific portions of the NWLON are monitored for operations and data quality.Data collection platforms (DCP) transmit hourly data to headquarters via NOAA’s GOES satellite.During times of severe storms, these gauges operate in a special mode to provide data every 20minutes for distribution to the NWS AFOS network. Since CORMS is co-located with the 24-hourmonitoring systems of the NWS, it is convenient to receive weather bulletins, early designations oftropical depressions, and storm warnings.
CORMS monitors National Hurricane Center (NHC) reports of tropical formation of hurricanes andutilizes the NHC Landfall product to determine when to trigger the special reporting mode capabilityof the water level gauges. Gauges in a particular coastal area are triggered when the NHC Landfallproduct indicates that, based on the current track of a storm, landfall is predicted with a 10%confidence level. These gauges provide data about the deviation of water levels from the predictedtide in order to assist state and federal emergency management teams in deciding strategies forevacuation. In addition, a new CO-OPS web site named Tides Online, developed to provide real-timewater level data via the Internet, gives the public access to time series plots of the data.
CORMS operations staff were tracking Hurricane Floyd from its beginning as a tropical depressionuntil its dissipation. The operations staff were continuously updated by the NWS during the storm.They monitored gauge performance, providing information regarding gauge failure and dataproblems during the hurricane. CORMS continuously maintained gauges in a reporting mode andexperienced only a few gauge failures during the storm.
One station experienced a significant operational problem; the acoustic sensor at Duck, NC wasmalfunctioning as Floyd made its way up the Florida east coast. A field crew from the AtlanticRegional Office (ARO) of the Field Operations Division of CO-OPS was sent to the site to makeemergency repairs. The acoustic sensor became operational only one day before Floyd made landfallin North Carolina.
A total of six stations had phone line problems during the storm: Settlement Point, BA, Mayport,FL, Charleston, SC, Cape Hatteras, NC, Cambridge, MD, and Cape May, NJ. Since stations areactivated into storm surge mode by calling the DCP by phone, these stations did not transmit dataevery 20 minutes. They did transmit data either hourly or every three hours, which are the normaltransmission schedules. The station at Cape Hatteras, NC had a phone line problem until September

48
15, when continuous attempts to reach the DCP by phone were finally successful and it was set intostorm surge reporting mode.
The station at Cape Hatteras, NC suffered considerable damage to the protective well and soundingtube (components of the water level gauge), as was discovered in a post storm inspection by ARO.The bottom half of the well was broken off by heavy wave action or possibly by debris tossed in thesurf. This damage appears to have happened a few days after the storm passage.

49
IX. Internet Dissemination of Storm Surge Data
CO-OPS has developed a new web site, named Tides Online, to give the public access to real-timewater level, wind, and barometric pressure data from NWLON stations. Stations in storm surgemode are listed on the main page of the web site, giving the user quick access to available time seriesdata plots. Currently, some NWLON stations are not equipped with meteorological instruments.
The Tides Online web page provides the most recent 48 hours of water level data along with tidepredictions. Predictions are also provided 24 hours into the future so users can see when the nexthigh or low tide is predicted to occur. Some stations also show wind and barometric pressure dataavailable with concurrent time lines. Plotting these data on the same page paints an accurate pictureof the course of a storm. Figure 39 is a plot of the data as it appeared on the web page for Lewisetta,VA on September 17 at 0948 Eastern Daylight Time (EDT), after the passage of Hurricane Floyd.
On September 14, NOAA issued a media advisory announcing the Tides Online web site.Newspaper weather page editors and broadcast meteorologists were encouraged to publicize the website address. The text of the announcement is printed below. A special note was made that the datareflects what is happening at the time and is not a storm surge prediction system.
MEDIA ADVISORY
NOAA OPENS HURRICANE STORM SURGE WEB SITE – TIDES ON LINE
NOAA’s tides and water level experts have created a public web site that providesnear real-time observations from tide gauge equipment along the coast to show the extent of‘storm surge’ from hurricanes and other storms.
The web site: www.tidesonline.nos.noaa.gov
graphically illustrates tide levels which are actually being observed (shown by red line) ascompared to long-range tide predictions (shown on a blue line) such as those published innewspapers and in tide forecast books.
The ‘Tides On Line’ system is always in operation giving hourly updates on tides andwater levels around the nation and in some overseas locations. During major storms orhurricanes, certain observation stations are placed in “storm surge mode” and are automaticallyupdated every twenty minutes. Some of the observation stations also include wind andbarometric pressure data.
Weather page editors and broadcast meteorologists are encouraged to publish andpublicize the web site, but with regard to storm and hurricane warnings they should remindreaders and viewers that this web site only reflects what’s happening AT THE TIME and isnot a storm surge prediction system. NOAA provides storm surge prediction information aspart of storm and hurricane forecasts and everyone should heed official warnings and forecastsand predictions about storm surge and flood threats issued by federal, state and local officials.
Real time Storm Surge Levels: www.tidesonline.nos.noaa.gov
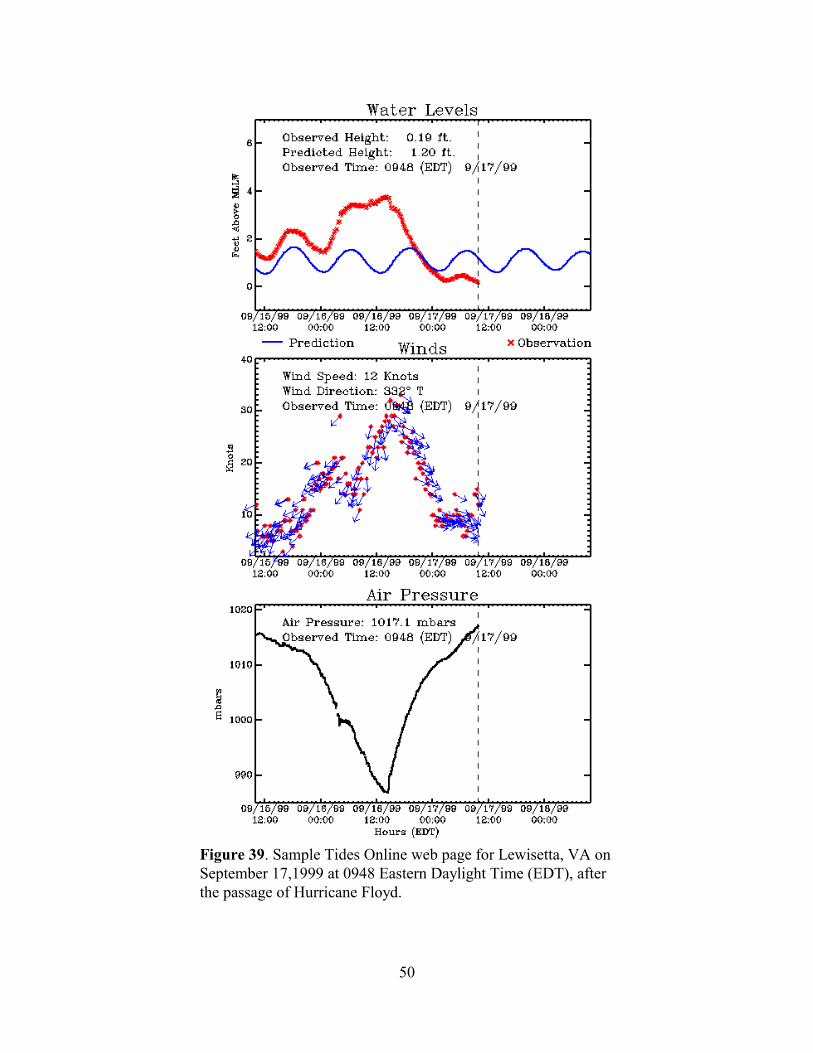
50
Figure 39. Sample Tides Online web page for Lewisetta, VA onSeptember 17,1999 at 0948 Eastern Daylight Time (EDT), afterthe passage of Hurricane Floyd.

51
0
10000
20000
30000
40000
50000
60000
70000
80000
90000
Num
ber o
f Hits
2-S ep
12-S ep
13-S ep
14-S ep
15-S ep
16-S ep
17-S ep
18-S ep
19-S ep
20-S ep
21-S ep
22-S ep
23-S ep
24-S ep
25-S ep
26-S ep
27-S ep
28-S ep
29-S ep
30-S ep
D ate
Figure 40. Number of hits on the Tides Online web site after it became operational. Themedia advisory was released on September 14. Hurricane Floyd came ashore onSeptember 16.
The media advisory had a significant effect on the number of web site hits during the storm. Figure40 shows the number of hits on the Tides Online web site after it became operational. Note theincrease in hits on September 14 when the press announcement of Tides Online was released.September 16 was the middle of Hurricane Floyd’s interaction with the eastern U.S. coast; thepublic’s response is evident. The rest of the graph shows normal use of Tides Online for accessingdaily plots for any of the NWLON stations.

52
53
X. Coordination with Federal and State Agencies
In the summer of 1999, NOS created a Response Plan for Natural Disasters. The intent of the planwas to establish a formal response structure with activation and notification protocols to provide forthe efficient use of NOS capabilities in responding to natural disasters such as hurricanes. Each NOSline office identified an office coordinator and key office capabilities which could be offered to assistthe Federal Emergency Management Agency (FEMA) and other federal and state agencies in stormmonitoring and disaster recovery. All requests for assistance and resulting actions by NOS wereorganized by the NOS coordinator.
Part of the NOS plan included a formal partnership with state emergency management centers inNorth Carolina, Georgia, Alabama, and Mississippi. During the period of Hurricane Floyd, NOSsent a representative to actively participate with state officials in the North Carolina emergencyoperations center. NOS also established a section of its HAZMAT web site, as a centralcommunication point where all e-mails, reports assessments, and aerial photos regarding the stormcould be reviewed by members of the NOS and state response teams.
The CO-OPS coordinator on the NOS response team provided daily email reports to the NOScoordinator and state officials on storm progress and water level station status. These email updateswere also posted on the NOS HAZMAT web site. The basic operation of the Tides Online web sitewas explained to familiarize team members with its purpose and capabilities. Although the NWSAFOS network automatically receives storm surge transmissions from NOS water level stations, theNWS regional forecast offices were also notified of the Tides Online web site as an additional sourceof information for storm surge data.

54

55
XI. Summary
Hurricane Floyd was the most powerful and destructive storm of the 1999 Atlantic hurricane season.Due to its storm track, it affected nearly the entire US Atlantic coast before and after making landfallearly on September 16 near Cape Fear, NC. Widespread flooding caused by heavy rains associatedwith Floyd resulted in significant casualties, property loss, and environmental damage, particularlyin eastern North Carolina.
Hurricane Floyd raised water levels significantly above MHHW at many of the east coast NWLONstations, with the highest maximum observed elevation at Oregon Inlet Marina, NC on PamlicoSound, setting a new station record of 1.480 meters above MHHW. Historical maximum elevationswere also exceeded at Duke Marine Lab, NC and at St. Augustine Beach, FL. At Duke Marine Lab,NC, the maximum observed elevation occurred 4½ hours after predicted high tide.
Storm surge, the difference between observed water levels and predicted tide levels, showedconsiderable variation between stations depending on wind speed and direction, air pressure, localorientation of the coastline, and the storm’s speed and distance at time of passage. The greatestrecorded storm surge was 1.733 meters at Duke Marine Lab, NC. Rapid changes in wind directionas the storm passed a station were quickly followed by changes in the trend of the storm surge. Inaddition, the effect of Floyd’s winds on currents near Hampton Roads, VA was measured by twoCO-OPS current meters that were in the water at the time.
The operation of CORMS during the period of Hurricane Floyd was described, including theprocedure for setting NWLON DCPs into storm surge reporting mode, the resolution ofcommunication problems, and a description of equipment damage. The newly-developed TidesOnline website was announced to the public via a NOAA media advisory two days before HurricaneFloyd came ashore. The main page indicates which NWLON stations are in storm surge reportingmode and each station’s web page gives time series plots of available water level, wind, andbarometric pressure data. The number of web page hits peaked above 80,000 on September 16 asFloyd came ashore. Finally, there was a description of CO-OPS participation on the NOS naturaldisaster response team and its coordination with federal and state emergency management centers.
Preliminary data recorded during the storm were provided to NWS, FEMA, and the U.S. ArmyCorps of Engineers. Information on tidal datums, storm surge, and times series analyses fromstations listed in this report and from other NOS stations can be obtained from:
NOAA/ National Ocean ServiceCenter for Operational Oceanographic Products and ServicesProducts and Services Division, N/OPS31305 East-West HighwaySilver Spring, MD 20910-3281Telephone: 301-713-2877Internet URL: www.co-ops.nos.noaa.gov

56
57
Acknowledgments
This report represents the cumulative efforts of personnel of the Center for OperationalOceanographic Products and Services. We would like to acknowledge the support of the FieldOperations Division personnel who are responsible for the operation and maintenance of the waterlevel stations, and the Products and Services Division personnel who are responsible for theprocessing and analysis of the data incorporated into this report. Zhong Li produced the wind plots,Noriko Shoji researched historical station record periods, and Cherel Fitzgerald transcribed theNOAA media advisory. Brenda Via and Gina Stoney prepared and reviewed the final document forpublication. We would also like to thank Stephen Gill, William Stoney, Leonard Hickman, andStephen Lyles for their suggestions and reviews which helped to improve this report.

58

59
References
Harris, D. Lee, 1963. Characteristics of the hurricane storm surge, Weather Bureau, TechnicalPaper No. 48, U.S. Dept. of Commerce.
Parker, Bruce B., 1991. The relative importance of the various nonlinear mechanisms in a widerange of tidal interactions (Review). In Tidal Hydrodynamics, (Ed.) Bruce B. Parker, pp237-268, John Wiley & Sons, Inc., New York, NY.
Storm Event Data Reports
The following data reports were compiled after major storm events. The formats of the reports vary;however, each contains tabular and graphical information on the maximum elevations of the waterlevels during the storm, as well as storm surge information calculated from the difference betweenobserved and predicted tides.
1. Hurricane Hugo, Effects on water levels and storm surge recorded at NOAA/National OceanService water level stations. Data Report, November 30, 1989.
2. Effects of Hurricane Bob on water levels. Data Report, October 1991.
3. Effects of the late October 1991 North Atlantic extra-tropical storm on water levels. Data Report,January 1992.
4. Effects of the January 1992 Atlantic Ocean coastal storm on water levels. Data Report, May1992.
5. Effects of Hurricane Andrew on water levels in coastal Florida and Louisiana. NOAA TechnicalMemorandum NOS OES 004, Data Report, December 1992.
6. Effects of December 1992 northeaster on water levels. NOAA Technical Memorandum NOSOES 006, Data Report, May 1993.
7. Effects of February 1998 northeaster on water levels. NOAA Technical Memorandum NOS CO-OPS 0019, Data Report, December 1998.

60

61
Appendix I.
Data Tables
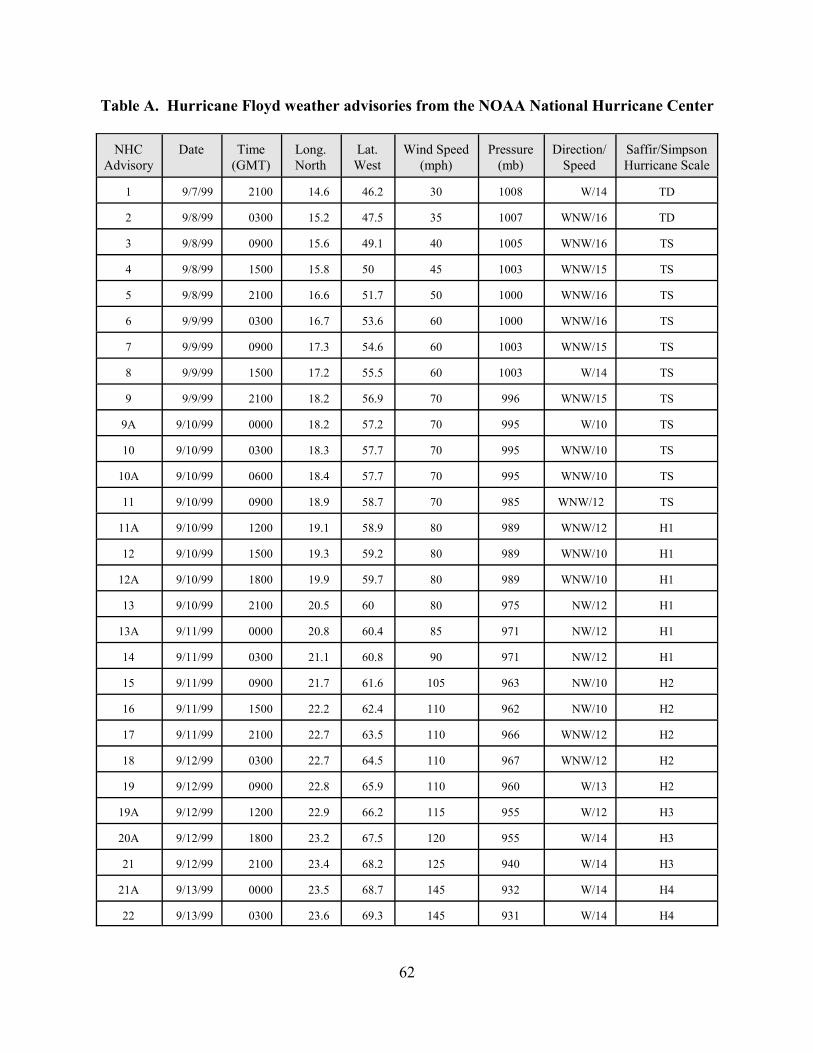
62
Table A. Hurricane Floyd weather advisories from the NOAA National Hurricane Center
NHCAdvisory
Date Time(GMT)
Long.North
Lat.West
Wind Speed(mph)
Pressure(mb)
Direction/Speed
Saffir/SimpsonHurricane Scale
1 9/7/99 2100 14.6 46.2 30 1008 W/14 TD
2 9/8/99 0300 15.2 47.5 35 1007 WNW/16 TD
3 9/8/99 0900 15.6 49.1 40 1005 WNW/16 TS
4 9/8/99 1500 15.8 50 45 1003 WNW/15 TS
5 9/8/99 2100 16.6 51.7 50 1000 WNW/16 TS
6 9/9/99 0300 16.7 53.6 60 1000 WNW/16 TS
7 9/9/99 0900 17.3 54.6 60 1003 WNW/15 TS
8 9/9/99 1500 17.2 55.5 60 1003 W/14 TS
9 9/9/99 2100 18.2 56.9 70 996 WNW/15 TS
9A 9/10/99 0000 18.2 57.2 70 995 W/10 TS
10 9/10/99 0300 18.3 57.7 70 995 WNW/10 TS
10A 9/10/99 0600 18.4 57.7 70 995 WNW/10 TS
11 9/10/99 0900 18.9 58.7 70 985 WNW/12 TS
11A 9/10/99 1200 19.1 58.9 80 989 WNW/12 H1
12 9/10/99 1500 19.3 59.2 80 989 WNW/10 H1
12A 9/10/99 1800 19.9 59.7 80 989 WNW/10 H1
13 9/10/99 2100 20.5 60 80 975 NW/12 H1
13A 9/11/99 0000 20.8 60.4 85 971 NW/12 H1
14 9/11/99 0300 21.1 60.8 90 971 NW/12 H1
15 9/11/99 0900 21.7 61.6 105 963 NW/10 H2
16 9/11/99 1500 22.2 62.4 110 962 NW/10 H2
17 9/11/99 2100 22.7 63.5 110 966 WNW/12 H2
18 9/12/99 0300 22.7 64.5 110 967 WNW/12 H2
19 9/12/99 0900 22.8 65.9 110 960 W/13 H2
19A 9/12/99 1200 22.9 66.2 115 955 W/12 H3
20A 9/12/99 1800 23.2 67.5 120 955 W/14 H3
21 9/12/99 2100 23.4 68.2 125 940 W/14 H3
21A 9/13/99 0000 23.5 68.7 145 932 W/14 H4
22 9/13/99 0300 23.6 69.3 145 931 W/14 H4

NHCAdvisory
Date Time(GMT)
Long.North
Lat.West
Wind Speed(mph)
Pressure(mb)
Direction/Speed
Saffir/SimpsonHurricane Scale
63
22A 9/13/99 0600 23.6 70 150 923 W/14 H4
23 9/13/99 0900 23.7 70.6 155 922 W/14 H4
23A 9/13/99 1200 23.9 71.4 155 921 W/14 H4
24 9/13/99 1500 24.1 72.1 155 921 W/14 H4
24A 9/13/99 1800 24.2 73 155 926 W/15 H4
25 9/13/99 2100 24.2 73.7 155 923 W/16 H4
25A 9/14/99 0000 24.4 74.1 155 924 W/14 H4
26 9/14/99 0300 24.5 74.7 155 924 W/14 H4
26A 9/14/99 0700 24.9 75.3 155 928 WNW/14 H4
27 9/14/99 0900 25.1 75.9 155 927 WNW/14 H4
27A 9/14/99 1300 25.4 76.1 150 929 WNW/14 H4
28 9/14/99 1600 25.7 76.8 145 932 WNW/14 H4
28A 9/14/99 1900 26 77 140 933 WNW/14 H4
29 9/14/99 2200 26.5 77.4 140 929 NW/12 H4
29A 9/15/99 0100 27.1 77.6 140 934 NNW/12 H4
30 9/15/99 0400 27.7 77.6 140 933 NW/13 H4
30A 9/15/99 0700 28.2 78.5 140 935 NW/13 H4
31 9/15/99 1000 28.8 78.8 140 938 NNW/14 H4
31A 9/15/99 1300 29.3 78.8 135 941 NNW/14 H4
32 9/15/99 1600 29.9 79 125 943 NNW/14 H3
32A 9/15/99 1800 30.3 79.1 125 946 NNW/14 H3
32B 9/15/99 2000 30.8 79.1 120 947 N/15 H3
33 9/15/99 2200 31.3 79 115 949 N/17 H3
33A 9/16/99 0000 32.1 78.7 115 949 NNE/17 H3
33B 9/16/99 0200 32.4 78.6 115 950 NNE/17 H3
34 9/16/99 0400 32.9 78.3 115 951 NNE/18 H3
34B 9/16/99 0800 34 77.9 110 956 NNE/20 H2
35 9/16/99 1000 34.5 77.6 105 956 NNE/23 H2
35A 9/16/99 1200 35.2 77.1 100 960 NNE/24 H2
35B 9/16/99 1400 36 76.6 90 962 NNE/25 H1
36 9/16/99 1600 36.8 76 80 967 NNE/24 H1

NHCAdvisory
Date Time(GMT)
Long.North
Lat.West
Wind Speed(mph)
Pressure(mb)
Direction/Speed
Saffir/SimpsonHurricane Scale
64
36A 9/16/99 1900 37.8 75.2 75 974 NNE/29 H1
37 9/16/99 2200 39.3 74.6 65 974 NNE/30 TS
37A 9/17/99 0100 40.6 73.5 65 974 NNE/30 TS
38 9/17/99 0400 41.7 72.2 60 980 NE/35 TS
39 9/17/99 1000 43.5 70.8 60 984 NE/26 TS
TD= Tropical Depression; TS= Tropical Storm; H# = Hurricane Category #.
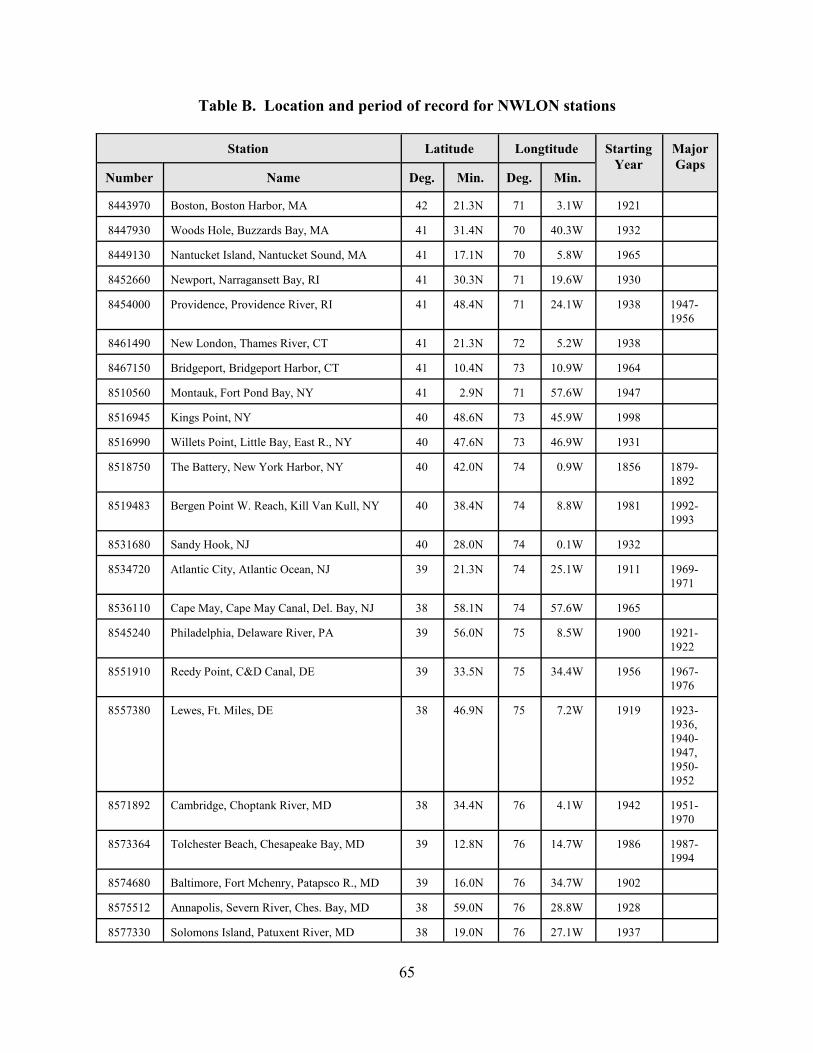
65
Table B. Location and period of record for NWLON stations
Station Latitude Longtitude StartingYear
MajorGaps
Number Name Deg. Min. Deg. Min.
8443970 Boston, Boston Harbor, MA 42 21.3N 71 3.1W 1921
8447930 Woods Hole, Buzzards Bay, MA 41 31.4N 70 40.3W 1932
8449130 Nantucket Island, Nantucket Sound, MA 41 17.1N 70 5.8W 1965
8452660 Newport, Narragansett Bay, RI 41 30.3N 71 19.6W 1930
8454000 Providence, Providence River, RI 41 48.4N 71 24.1W 1938 1947-1956
8461490 New London, Thames River, CT 41 21.3N 72 5.2W 1938
8467150 Bridgeport, Bridgeport Harbor, CT 41 10.4N 73 10.9W 1964
8510560 Montauk, Fort Pond Bay, NY 41 2.9N 71 57.6W 1947
8516945 Kings Point, NY 40 48.6N 73 45.9W 1998
8516990 Willets Point, Little Bay, East R., NY 40 47.6N 73 46.9W 1931
8518750 The Battery, New York Harbor, NY 40 42.0N 74 0.9W 1856 1879-1892
8519483 Bergen Point W. Reach, Kill Van Kull, NY 40 38.4N 74 8.8W 1981 1992-1993
8531680 Sandy Hook, NJ 40 28.0N 74 0.1W 1932
8534720 Atlantic City, Atlantic Ocean, NJ 39 21.3N 74 25.1W 1911 1969-1971
8536110 Cape May, Cape May Canal, Del. Bay, NJ 38 58.1N 74 57.6W 1965
8545240 Philadelphia, Delaware River, PA 39 56.0N 75 8.5W 1900 1921-1922
8551910 Reedy Point, C&D Canal, DE 39 33.5N 75 34.4W 1956 1967-1976
8557380 Lewes, Ft. Miles, DE 38 46.9N 75 7.2W 1919 1923-1936,1940-1947,1950-1952
8571892 Cambridge, Choptank River, MD 38 34.4N 76 4.1W 1942 1951-1970
8573364 Tolchester Beach, Chesapeake Bay, MD 39 12.8N 76 14.7W 1986 1987-1994
8574680 Baltimore, Fort Mchenry, Patapsco R., MD 39 16.0N 76 34.7W 1902
8575512 Annapolis, Severn River, Ches. Bay, MD 38 59.0N 76 28.8W 1928
8577330 Solomons Island, Patuxent River, MD 38 19.0N 76 27.1W 1937
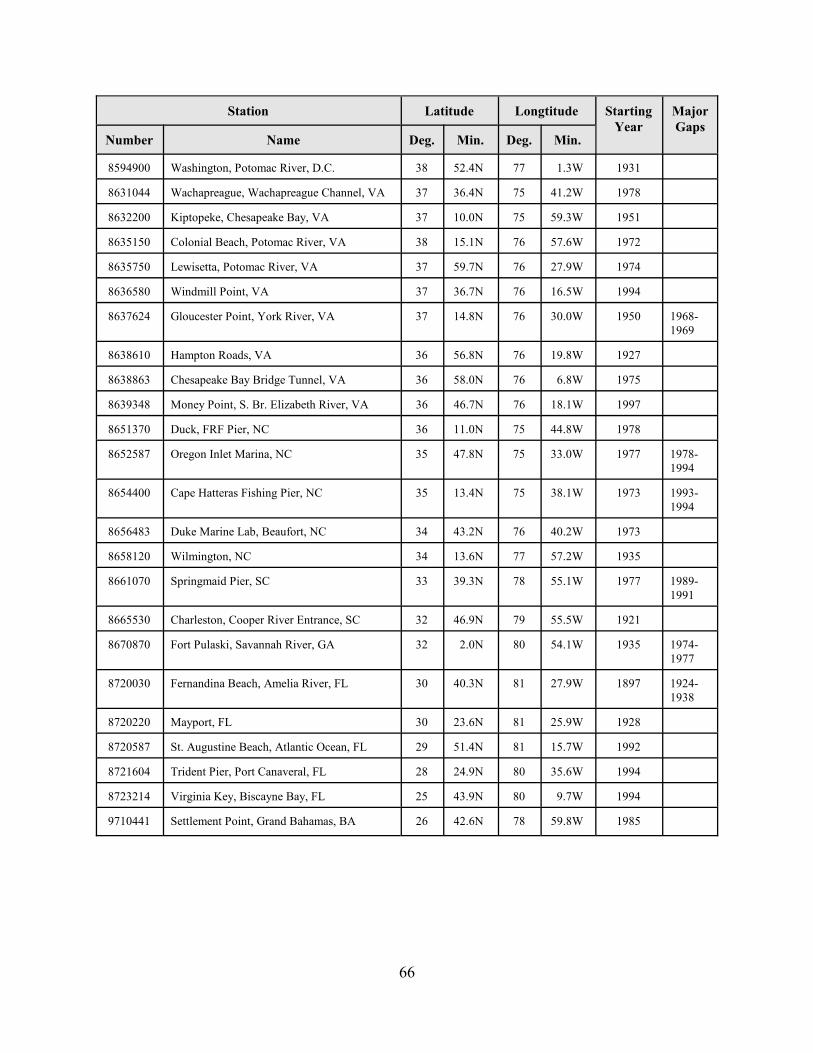
Station Latitude Longtitude StartingYear
MajorGaps
Number Name Deg. Min. Deg. Min.
66
8594900 Washington, Potomac River, D.C. 38 52.4N 77 1.3W 1931
8631044 Wachapreague, Wachapreague Channel, VA 37 36.4N 75 41.2W 1978
8632200 Kiptopeke, Chesapeake Bay, VA 37 10.0N 75 59.3W 1951
8635150 Colonial Beach, Potomac River, VA 38 15.1N 76 57.6W 1972
8635750 Lewisetta, Potomac River, VA 37 59.7N 76 27.9W 1974
8636580 Windmill Point, VA 37 36.7N 76 16.5W 1994
8637624 Gloucester Point, York River, VA 37 14.8N 76 30.0W 1950 1968-1969
8638610 Hampton Roads, VA 36 56.8N 76 19.8W 1927
8638863 Chesapeake Bay Bridge Tunnel, VA 36 58.0N 76 6.8W 1975
8639348 Money Point, S. Br. Elizabeth River, VA 36 46.7N 76 18.1W 1997
8651370 Duck, FRF Pier, NC 36 11.0N 75 44.8W 1978
8652587 Oregon Inlet Marina, NC 35 47.8N 75 33.0W 1977 1978-1994
8654400 Cape Hatteras Fishing Pier, NC 35 13.4N 75 38.1W 1973 1993-1994
8656483 Duke Marine Lab, Beaufort, NC 34 43.2N 76 40.2W 1973
8658120 Wilmington, NC 34 13.6N 77 57.2W 1935
8661070 Springmaid Pier, SC 33 39.3N 78 55.1W 1977 1989-1991
8665530 Charleston, Cooper River Entrance, SC 32 46.9N 79 55.5W 1921
8670870 Fort Pulaski, Savannah River, GA 32 2.0N 80 54.1W 1935 1974-1977
8720030 Fernandina Beach, Amelia River, FL 30 40.3N 81 27.9W 1897 1924-1938
8720220 Mayport, FL 30 23.6N 81 25.9W 1928
8720587 St. Augustine Beach, Atlantic Ocean, FL 29 51.4N 81 15.7W 1992
8721604 Trident Pier, Port Canaveral, FL 28 24.9N 80 35.6W 1994
8723214 Virginia Key, Biscayne Bay, FL 25 43.9N 80 9.7W 1994
9710441 Settlement Point, Grand Bahamas, BA 26 42.6N 78 59.8W 1985

67
Appendix II.
Time series of observed water level and predicted tide at NWLON stations

68
-0.50
0.51
1.52
2.53
3.5
13-Sep 14-Sep 15-Sep 16-Sep 17-Sep 18-Sep 19-SepGMT
Met
ers
Figure 41. Settlement Point, BA observed (solid) and predicted (dashed) water levels on MLLW.
-0.50
0.51
1.52
2.53
3.5
13-Sep 14-Sep 15-Sep 16-Sep 17-Sep 18-Sep 19-SepGMT
Met
ers
Figure 42. Virginia Key, FL observed (solid) and predicted (dashed) water levels on MLLW.
-0.50
0.51
1.52
2.53
3.5
13-Sep 14-Sep 15-Sep 16-Sep 17-Sep 18-Sep 19-SepGMT
Met
ers
Figure 43. Trident Pier, FL observed (solid) and predicted (dashed) water levels on MLLW.

69
-0.50
0.51
1.52
2.53
3.5
13-S ep 14-S ep 15-S ep 16-S ep 17-S ep 18-S ep 19-S epGM T
Met
ers
Figure 44. St. Augustine Beach, FL observed (solid) and predicted (dashed) water levels onMLLW.
-0.50
0.51
1.52
2.53
3.5
13-Sep 14-Sep 15-Sep 16-Sep 17-Sep 18-Sep 19-SepGMT
Met
ers
Figure 45. Mayport, FL observed (solid) and predicted (dashed) water levels on MLLW.
-0.50
0.51
1.52
2.53
3.5
13-S ep 14-S ep 15-S ep 16-S ep 17-S ep 18-S ep 19-S epGM T
Met
ers
Figure 46. Fernandina Beach, FL observed (solid) and predicted (dashed) water levels onMLLW.

70
-0.50
0.51
1.52
2.53
3.5
13-Sep 14-Sep 15-Sep 16-Sep 17-Sep 18-Sep 19-SepGMT
Met
ers
Figure 47. Fort Pulaski, GA observed (solid) and predicted (dashed) water levels on MLLW.
-0.50
0.51
1.52
2.53
3.5
13-Sep 14-Sep 15-Sep 16-Sep 17-Sep 18-Sep 19-SepGMT
Met
ers
Figure 48. Charleston, SC observed (solid) and predicted (dashed) water levels on MLLW.
-0.50
0.51
1.52
2.53
3.5
13-Sep 14-Sep 15-Sep 16-Sep 17-Sep 18-Sep 19-SepGMT
Met
ers
Figure 49. Springmaid Pier, SC observed (solid) and predicted (dashed) water levels on MLLW.

71
-0.50
0.51
1.52
2.53
3.5
13-Sep 14-Sep 15-Sep 16-Sep 17-Sep 18-Sep 19-SepGMT
Met
ers
Figure 50. Wilmington, NC observed (solid) and predicted (dashed) water levels on MLLW.
-0.5
00.5
11.5
22.5
3
3.5
13-Sep 14-S ep 15-S ep 16-S ep 17-S ep 18-S ep 19-S epGM T
Met
ers
Figure 51. Duke Marine Lab, NC observed (solid) and predicted (dashed) water levels onMLLW.
-0.50
0.51
1.52
2.53
3.5
13-Sep 14-Sep 15-Sep 16-Sep 17-Sep 18-Sep 19-SepGMT
Met
ers
Figure 52. Cape Hatteras, NC observed (solid) and predicted (dashed) water levels on MLLW.

72
-0.5
00.5
11.5
22.5
3
3.5
13-Sep 14-S ep 15-S ep 16-S ep 17-S ep 18-S ep 19-S epGM T
Met
ers
Figure 53. Oregon Inlet Marina, NC observed (solid) and predicted (dashed) water levels onMLLW.
-0.50
0.51
1.52
2.53
3.5
13-Sep 14-Sep 15-Sep 16-Sep 17-Sep 18-Sep 19-SepGMT
Met
ers
Figure 54. Duck Pier, NC observed (solid) and predicted (dashed) water levels on MLLW.
-0.50
0.51
1.52
2.53
3.5
13-Sep 14-S ep 15-S ep 16-S ep 17-S ep 18-S ep 19-S epGM T
Met
ers
Figure 55. Chesapeake Bay Bridge Tunnel, VA observed (solid) and predicted (dashed) waterlevels on MLLW.

73
-0.50
0.51
1.52
2.53
3.5
13-Sep 14-Sep 15-Sep 16-Sep 17-Sep 18-Sep 19-SepGMT
Met
ers
Figure 56. Money Point, VA observed (solid) and predicted (dashed) water levels on MLLW.
-0.50
0.51
1.52
2.53
3.5
13-Sep 14-Sep 15-Sep 16-Sep 17-Sep 18-Sep 19-SepGMT
Met
ers
Figure 57. Hampton Roads, VA observed (solid) and predicted (dashed) water levels on MLLW.
-0.50
0.51
1.52
2.53
3.5
13-S ep 14-S ep 15-S ep 16-Sep 17-S ep 18-S ep 19-S epGM T
Met
ers
Figure 58. Gloucester Point, VA observed (solid) and predicted (dashed) water levels onMLLW.
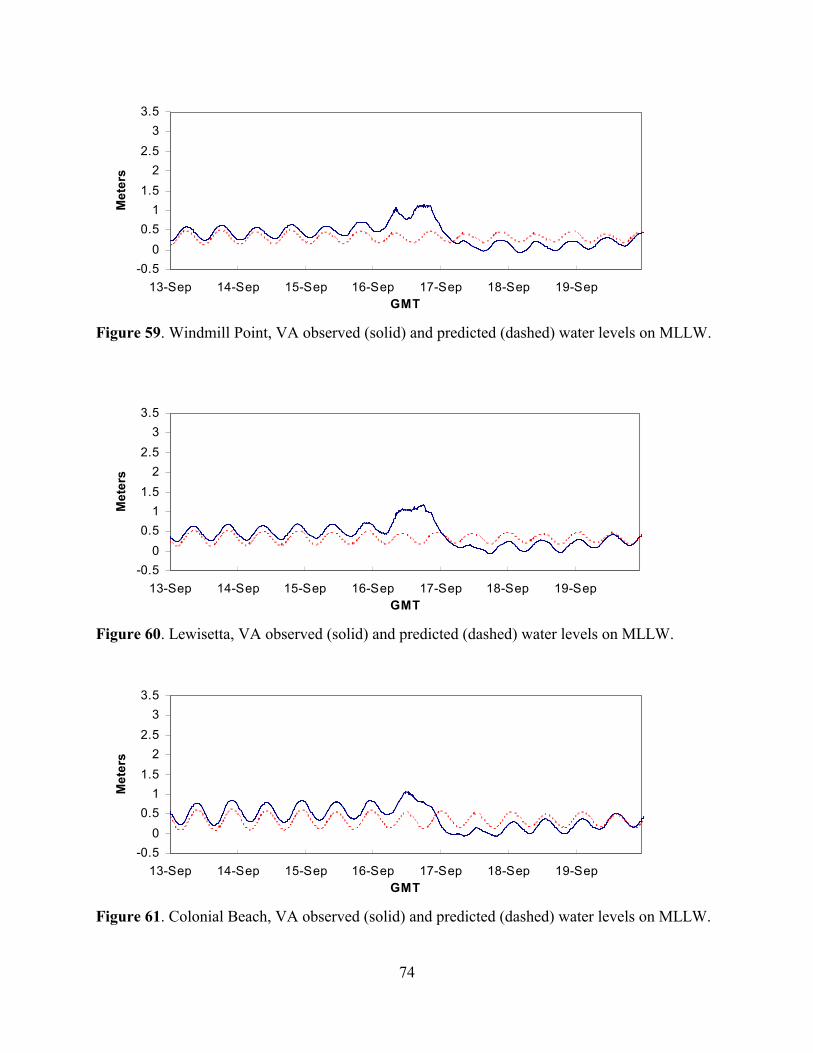
74
-0.50
0.51
1.52
2.53
3.5
13-Sep 14-Sep 15-Sep 16-Sep 17-Sep 18-Sep 19-SepGMT
Met
ers
Figure 59. Windmill Point, VA observed (solid) and predicted (dashed) water levels on MLLW.
-0.50
0.51
1.52
2.53
3.5
13-Sep 14-Sep 15-Sep 16-Sep 17-Sep 18-Sep 19-SepGMT
Met
ers
Figure 60. Lewisetta, VA observed (solid) and predicted (dashed) water levels on MLLW.
-0.50
0.51
1.52
2.53
3.5
13-Sep 14-Sep 15-Sep 16-Sep 17-Sep 18-Sep 19-SepGMT
Met
ers
Figure 61. Colonial Beach, VA observed (solid) and predicted (dashed) water levels on MLLW.
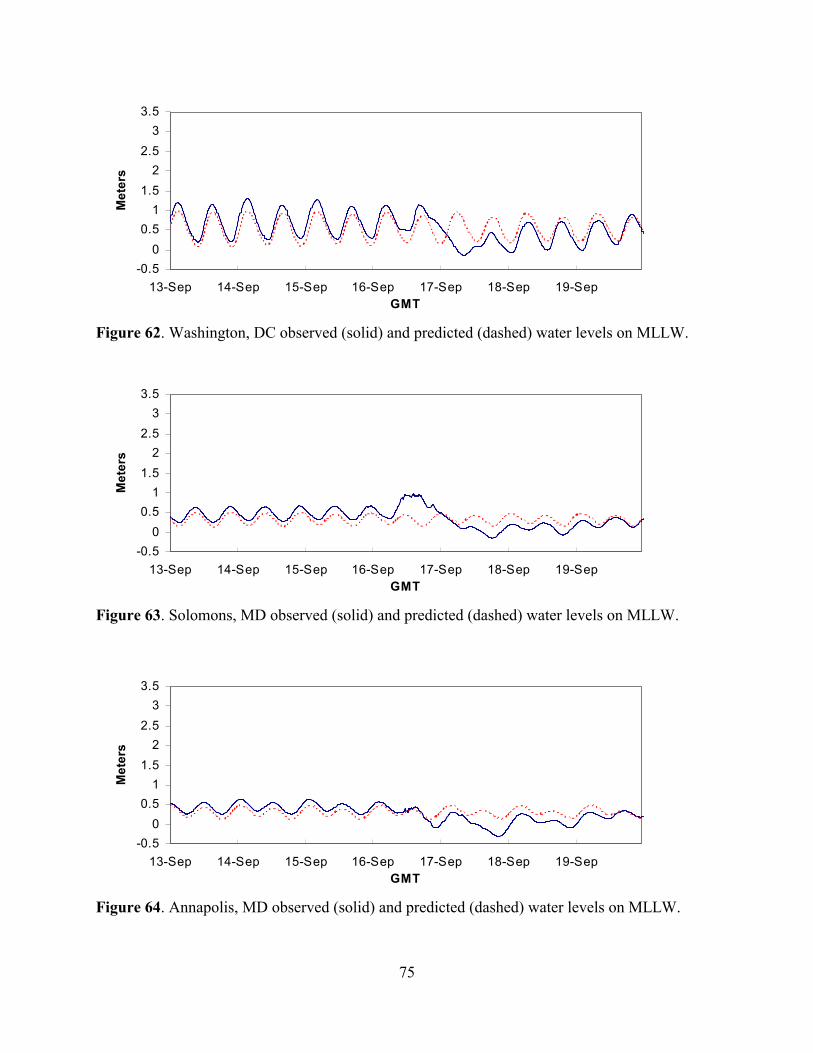
75
-0.50
0.51
1.52
2.53
3.5
13-Sep 14-Sep 15-Sep 16-Sep 17-Sep 18-Sep 19-SepGMT
Met
ers
Figure 62. Washington, DC observed (solid) and predicted (dashed) water levels on MLLW.
-0.50
0.51
1.52
2.53
3.5
13-Sep 14-Sep 15-Sep 16-Sep 17-Sep 18-Sep 19-SepGMT
Met
ers
Figure 63. Solomons, MD observed (solid) and predicted (dashed) water levels on MLLW.
-0.50
0.51
1.52
2.53
3.5
13-Sep 14-Sep 15-Sep 16-Sep 17-Sep 18-Sep 19-SepGMT
Met
ers
Figure 64. Annapolis, MD observed (solid) and predicted (dashed) water levels on MLLW.

76
-0.50
0.51
1.52
2.53
3.5
13-Sep 14-Sep 15-Sep 16-Sep 17-Sep 18-Sep 19-SepGMT
Met
ers
Figure 65. Baltimore, MD observed (solid) and predicted (dashed) water levels on MLLW.
-0.50
0.51
1.52
2.53
3.5
13-S ep 14-S ep 15-S ep 16-Sep 17-S ep 18-S ep 19-S epGM T
Met
ers
Figure 66. Tolchester Beach, MD observed (solid) and predicted (dashed) water levels onMLLW.
-0.50
0.51
1.52
2.53
3.5
13-Sep 14-Sep 15-Sep 16-Sep 17-Sep 18-Sep 19-SepGMT
Met
ers
Figure 67. Cambridge, MD observed (solid) and predicted (dashed) water levels on MLLW.
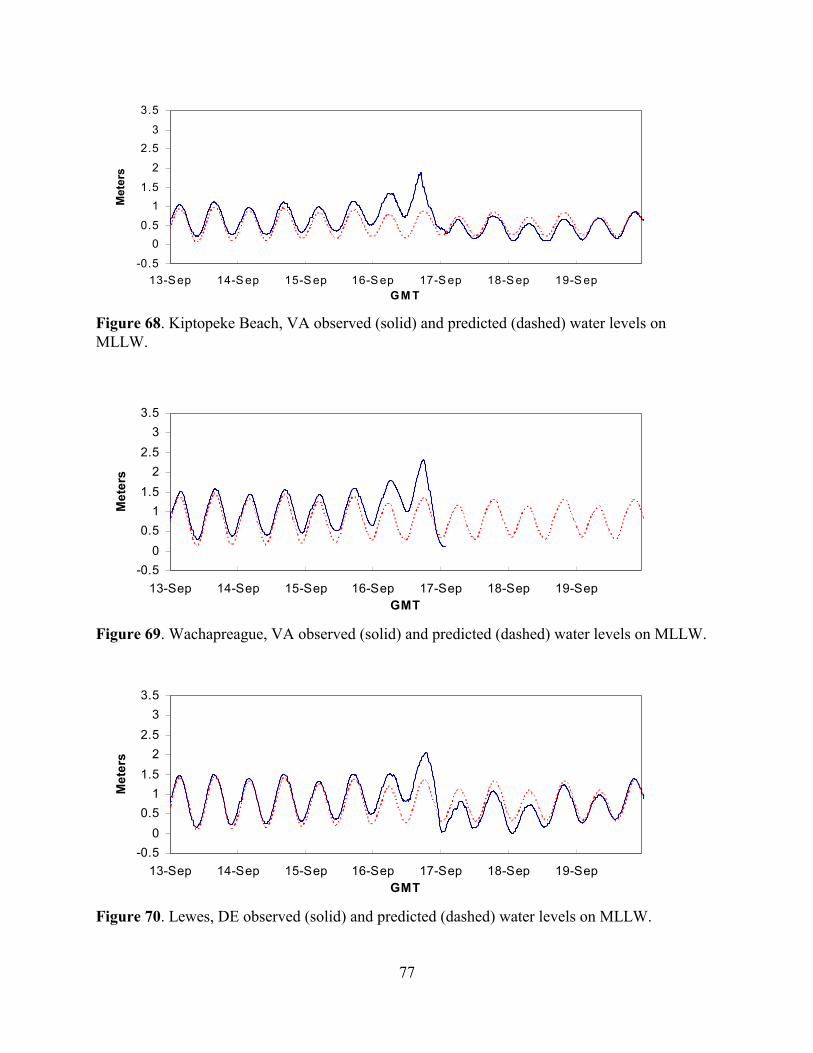
77
-0.50
0.51
1.52
2.53
3.5
13-Sep 14-S ep 15-S ep 16-S ep 17-S ep 18-S ep 19-S epGM T
Met
ers
Figure 68. Kiptopeke Beach, VA observed (solid) and predicted (dashed) water levels onMLLW.
-0.50
0.51
1.52
2.53
3.5
13-Sep 14-Sep 15-Sep 16-Sep 17-Sep 18-Sep 19-SepGMT
Met
ers
Figure 69. Wachapreague, VA observed (solid) and predicted (dashed) water levels on MLLW.
-0.50
0.51
1.52
2.53
3.5
13-Sep 14-Sep 15-Sep 16-Sep 17-Sep 18-Sep 19-SepGMT
Met
ers
Figure 70. Lewes, DE observed (solid) and predicted (dashed) water levels on MLLW.
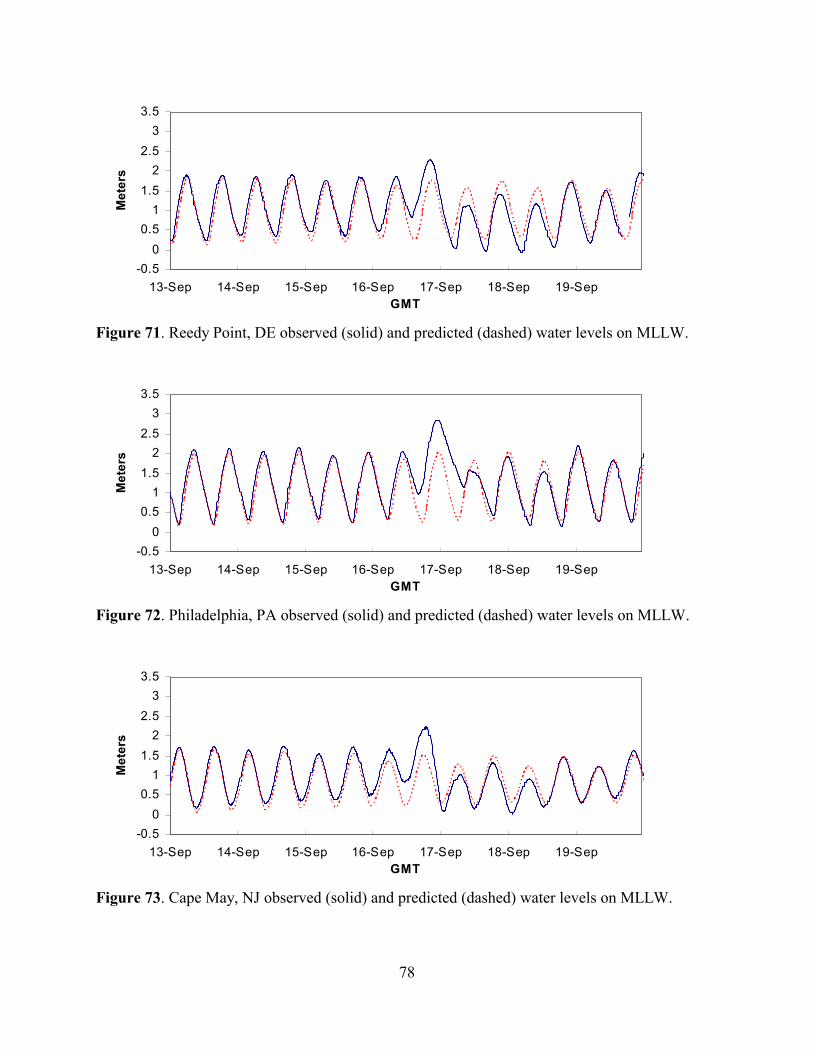
78
-0.50
0.51
1.52
2.53
3.5
13-Sep 14-Sep 15-Sep 16-Sep 17-Sep 18-Sep 19-SepGMT
Met
ers
Figure 71. Reedy Point, DE observed (solid) and predicted (dashed) water levels on MLLW.
-0.50
0.51
1.52
2.53
3.5
13-Sep 14-Sep 15-Sep 16-Sep 17-Sep 18-Sep 19-SepGMT
Met
ers
Figure 72. Philadelphia, PA observed (solid) and predicted (dashed) water levels on MLLW.
-0.50
0.51
1.52
2.53
3.5
13-Sep 14-Sep 15-Sep 16-Sep 17-Sep 18-Sep 19-SepGMT
Met
ers
Figure 73. Cape May, NJ observed (solid) and predicted (dashed) water levels on MLLW.
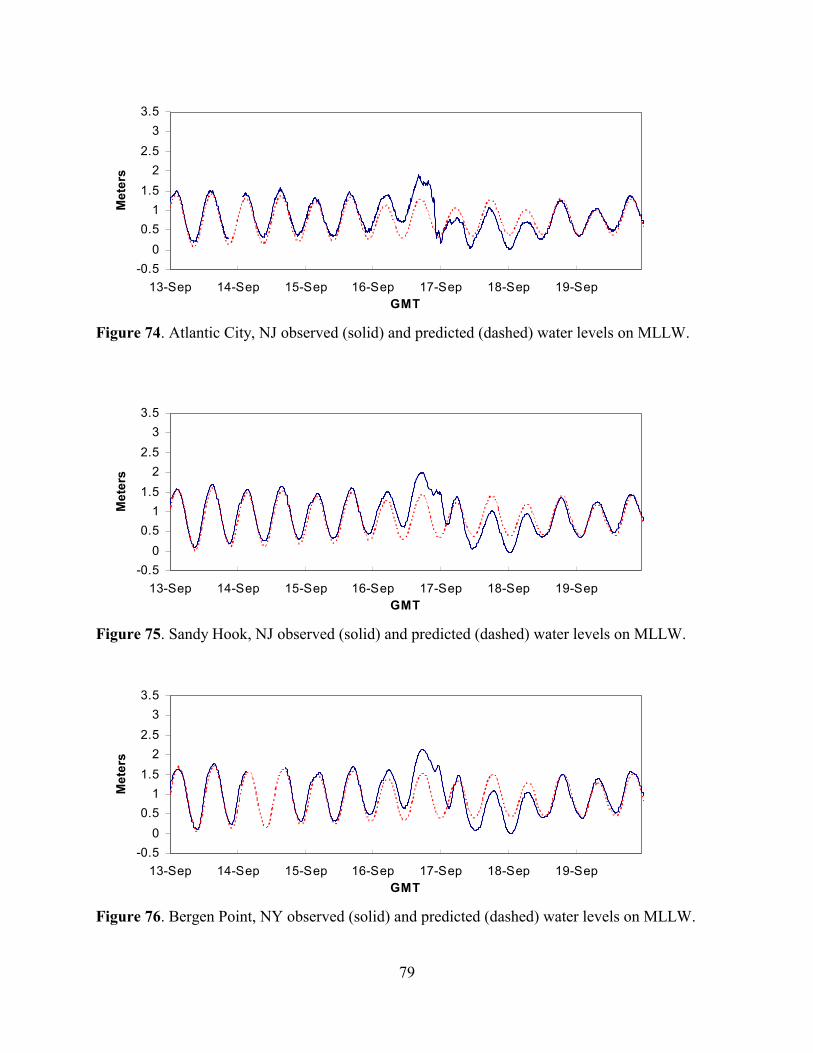
79
-0.50
0.51
1.52
2.53
3.5
13-Sep 14-Sep 15-Sep 16-Sep 17-Sep 18-Sep 19-SepGMT
Met
ers
Figure 74. Atlantic City, NJ observed (solid) and predicted (dashed) water levels on MLLW.
-0.50
0.51
1.52
2.53
3.5
13-Sep 14-Sep 15-Sep 16-Sep 17-Sep 18-Sep 19-SepGMT
Met
ers
Figure 75. Sandy Hook, NJ observed (solid) and predicted (dashed) water levels on MLLW.
-0.50
0.51
1.52
2.53
3.5
13-Sep 14-Sep 15-Sep 16-Sep 17-Sep 18-Sep 19-SepGMT
Met
ers
Figure 76. Bergen Point, NY observed (solid) and predicted (dashed) water levels on MLLW.
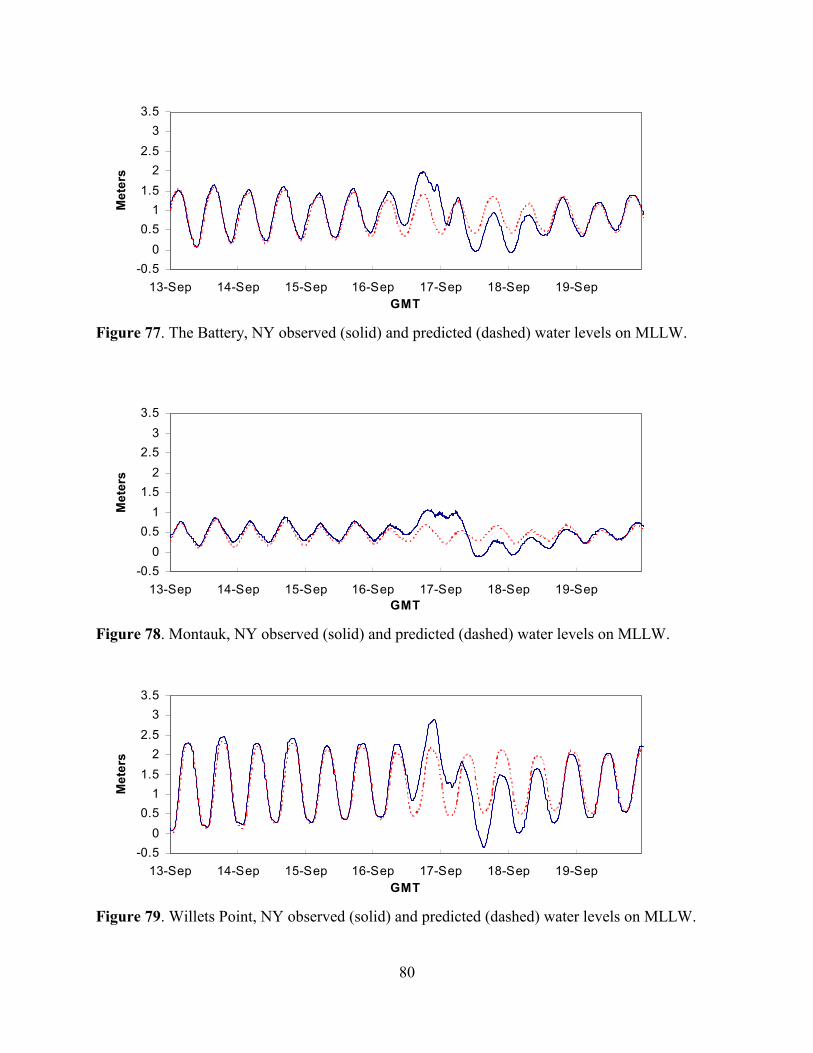
80
-0.50
0.51
1.52
2.53
3.5
13-Sep 14-Sep 15-Sep 16-Sep 17-Sep 18-Sep 19-SepGMT
Met
ers
Figure 77. The Battery, NY observed (solid) and predicted (dashed) water levels on MLLW.
-0.50
0.51
1.52
2.53
3.5
13-Sep 14-Sep 15-Sep 16-Sep 17-Sep 18-Sep 19-SepGMT
Met
ers
Figure 78. Montauk, NY observed (solid) and predicted (dashed) water levels on MLLW.
-0.50
0.51
1.52
2.53
3.5
13-Sep 14-Sep 15-Sep 16-Sep 17-Sep 18-Sep 19-SepGMT
Met
ers
Figure 79. Willets Point, NY observed (solid) and predicted (dashed) water levels on MLLW.

81
-0.50
0.51
1.52
2.53
3.5
13-Sep 14-Sep 15-Sep 16-Sep 17-Sep 18-Sep 19-SepGMT
Met
ers
Figure 80. Kings Point, NY observed (solid) and predicted (dashed) water levels on MLLW.
-0.50
0.51
1.52
2.53
3.5
13-Sep 14-Sep 15-Sep 16-Sep 17-Sep 18-Sep 19-SepGMT
Met
ers
Figure 81. Bridgeport, CT observed (solid) and predicted (dashed) water levels on MLLW.
-0.50
0.51
1.52
2.53
3.5
13-Sep 14-Sep 15-Sep 16-Sep 17-Sep 18-Sep 19-SepGMT
Met
ers
Figure 82. New London, CT observed (solid) and predicted (dashed) water levels on MLLW.

82
-0.50
0.51
1.52
2.53
3.5
13-Sep 14-Sep 15-Sep 16-Sep 17-Sep 18-Sep 19-SepGMT
Met
ers
Figure 83. Providence, RI observed (solid) and predicted (dashed) water levels on MLLW.
-0.50
0.51
1.52
2.53
3.5
13-Sep 14-Sep 15-Sep 16-Sep 17-Sep 18-Sep 19-SepGMT
Met
ers
Figure 84. Newport, RI observed (solid) and predicted (dashed) water levels on MLLW.
-0.50
0.51
1.52
2.53
3.5
13-Sep 14-Sep 15-Sep 16-Sep 17-Sep 18-Sep 19-SepGMT
Met
ers
Figure 85. Woods Hole, MA observed (solid) and predicted (dashed) water levels on MLLW.
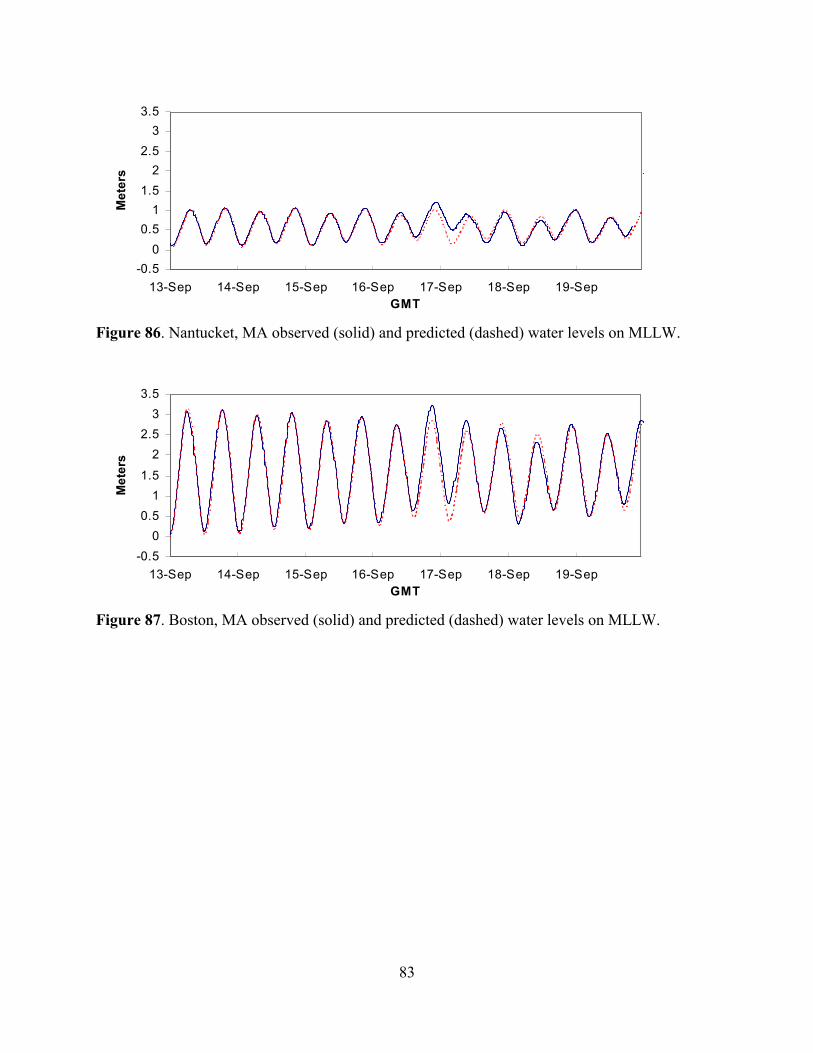
83
-0.50
0.51
1.52
2.53
3.5
13-Sep 14-Sep 15-Sep 16-Sep 17-Sep 18-Sep 19-SepGMT
Met
ers
Figure 86. Nantucket, MA observed (solid) and predicted (dashed) water levels on MLLW.
-0.50
0.51
1.52
2.53
3.5
13-Sep 14-Sep 15-Sep 16-Sep 17-Sep 18-Sep 19-SepGMT
Met
ers
Figure 87. Boston, MA observed (solid) and predicted (dashed) water levels on MLLW.

84

85
Appendix III.
Time series of storm surge at NWLON stations

86
-2-1.5
-1-0.5
00.5
11.5
2
13-Sep 14-Sep 15-Sep 16-Sep 17-Sep 18-Sep 19-Sep 20-SepGMT
Met
ers
Figure 88. Settlement Point, BA storm surge.
-2-1.5
-1-0.5
00.5
11.5
2
13-Sep 14-Sep 15-Sep 16-Sep 17-Sep 18-Sep 19-Sep 20-SepGMT
Met
ers
Figure 89. Virginia Key, FL storm surge.
-2-1.5
-1-0.5
00.5
11.5
2
13-Sep 14-Sep 15-Sep 16-Sep 17-Sep 18-Sep 19-Sep 20-SepGMT
Met
ers
Figure 90. Trident Pier, FL storm surge.
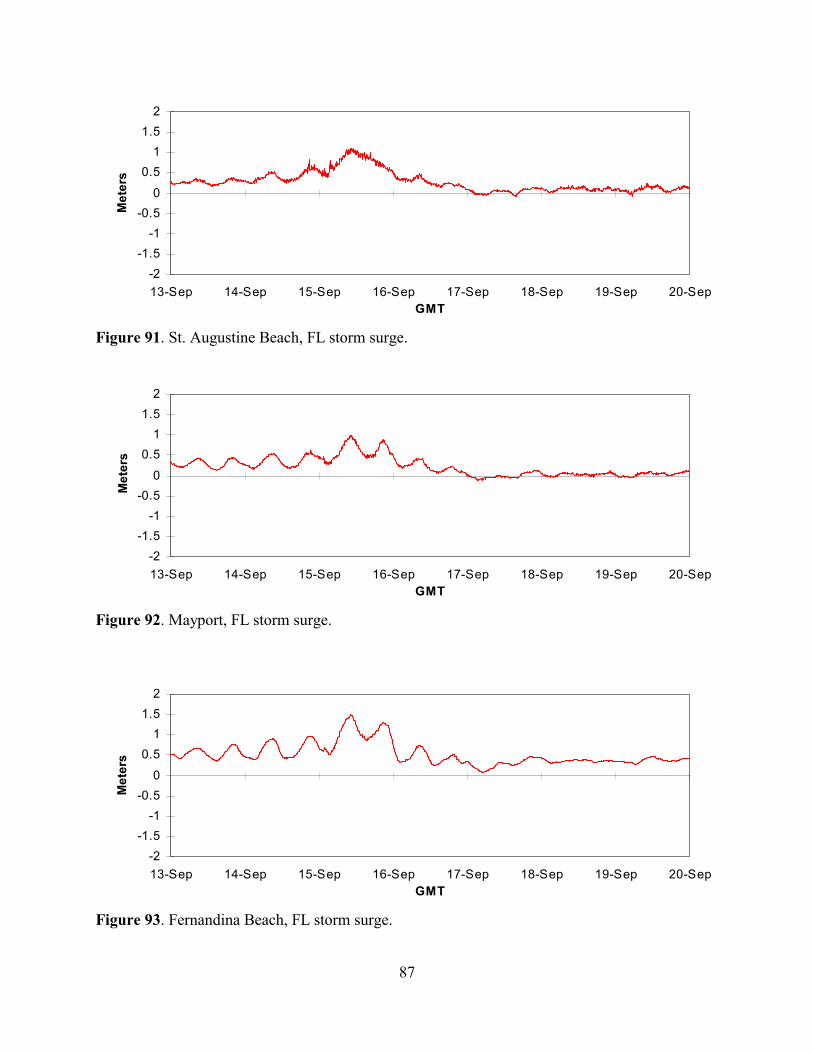
87
-2-1.5
-1-0.5
00.5
11.5
2
13-Sep 14-Sep 15-Sep 16-Sep 17-Sep 18-Sep 19-Sep 20-SepGMT
Met
ers
Figure 91. St. Augustine Beach, FL storm surge.
-2-1.5
-1-0.5
00.5
11.5
2
13-Sep 14-Sep 15-Sep 16-Sep 17-Sep 18-Sep 19-Sep 20-SepGMT
Met
ers
Figure 92. Mayport, FL storm surge.
-2-1.5
-1-0.5
00.5
11.5
2
13-Sep 14-Sep 15-Sep 16-Sep 17-Sep 18-Sep 19-Sep 20-SepGMT
Met
ers
Figure 93. Fernandina Beach, FL storm surge.

88
-2-1.5
-1-0.5
00.5
11.5
2
13-Sep 14-Sep 15-Sep 16-Sep 17-Sep 18-Sep 19-Sep 20-SepGMT
Met
ers
Figure 94. Fort Pulaski, GA storm surge.
-2-1.5
-1-0.5
00.5
11.5
2
13-Sep 14-Sep 15-Sep 16-Sep 17-Sep 18-Sep 19-Sep 20-SepGMT
Met
ers
Figure 95. Charleston, SC storm surge.
-2-1.5
-1-0.5
00.5
11.5
2
13-Sep 14-Sep 15-Sep 16-Sep 17-Sep 18-Sep 19-Sep 20-SepGMT
Met
ers
Figure 96. Springmaid Pier, SC storm surge.
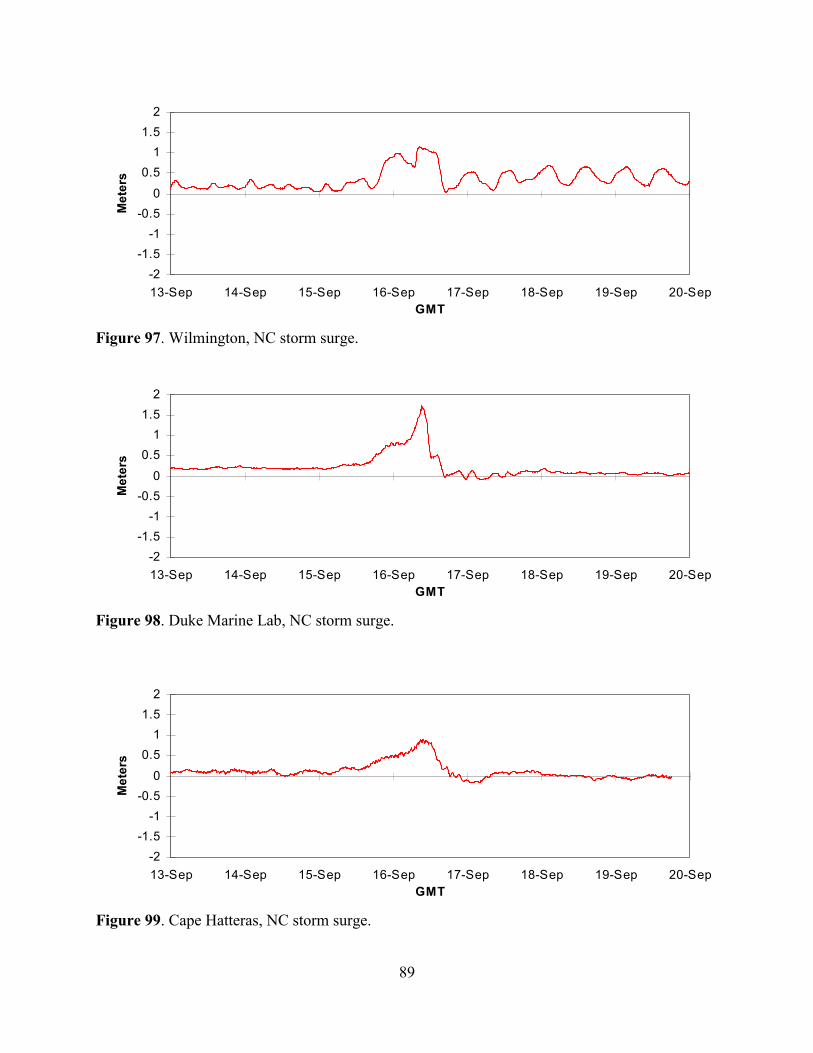
89
-2-1.5
-1-0.5
00.5
11.5
2
13-Sep 14-Sep 15-Sep 16-Sep 17-Sep 18-Sep 19-Sep 20-SepGMT
Met
ers
Figure 97. Wilmington, NC storm surge.
-2-1.5
-1-0.5
00.5
11.5
2
13-Sep 14-Sep 15-Sep 16-Sep 17-Sep 18-Sep 19-Sep 20-SepGMT
Met
ers
Figure 98. Duke Marine Lab, NC storm surge.
-2-1.5
-1-0.5
00.5
11.5
2
13-Sep 14-Sep 15-Sep 16-Sep 17-Sep 18-Sep 19-Sep 20-SepGMT
Met
ers
Figure 99. Cape Hatteras, NC storm surge.

90
-2-1.5
-1-0.5
00.5
11.5
2
13-Sep 14-Sep 15-Sep 16-Sep 17-Sep 18-Sep 19-Sep 20-SepGMT
Met
ers
Figure 100. Oregon Inlet Marina, NC storm surge.
-2-1.5
-1-0.5
00.5
11.5
2
13-Sep 14-Sep 15-Sep 16-Sep 17-Sep 18-Sep 19-Sep 20-SepGMT
Met
ers
Figure 101. Duck Pier, NC storm surge.
-2-1.5
-1-0.5
00.5
11.5
2
13-Sep 14-Sep 15-Sep 16-Sep 17-Sep 18-Sep 19-Sep 20-SepGMT
Met
ers
Figure 102. Chesapeake Bay Bridge Tunnel, VA storm surge.

91
-2-1.5
-1-0.5
00.5
11.5
2
13-Sep 14-Sep 15-Sep 16-Sep 17-Sep 18-Sep 19-Sep 20-SepGMT
Met
ers
Figure 103. Money Point, VA storm surge.
-2-1.5
-1-0.5
00.5
11.5
2
13-Sep 14-Sep 15-Sep 16-Sep 17-Sep 18-Sep 19-Sep 20-SepGMT
Met
ers
Figure 104. Hampton Roads, VA storm surge.
-2-1.5
-1-0.5
00.5
11.5
2
13-Sep 14-Sep 15-Sep 16-Sep 17-Sep 18-Sep 19-Sep 20-SepGMT
Met
ers
Figure 105. Gloucester Point, VA storm surge.

92
-2-1.5
-1-0.5
00.5
11.5
2
13-Sep 14-Sep 15-Sep 16-Sep 17-Sep 18-Sep 19-Sep 20-SepGMT
Met
ers
Figure 106. Windmill Point, VA storm surge.
-2-1.5
-1-0.5
00.5
11.5
2
13-Sep 14-Sep 15-Sep 16-Sep 17-Sep 18-Sep 19-Sep 20-SepGMT
Met
ers
Figure 107. Lewisetta, VA storm surge.
-2-1.5
-1-0.5
00.5
11.5
2
13-Sep 14-Sep 15-Sep 16-Sep 17-Sep 18-Sep 19-Sep 20-SepGMT
Met
ers
Figure 108. Colonial Beach, VA storm surge.

93
-2-1.5
-1-0.5
00.5
11.5
2
13-Sep 14-Sep 15-Sep 16-Sep 17-Sep 18-Sep 19-Sep 20-SepGMT
Met
ers
Figure 109. Washington, DC storm surge.
-2-1.5
-1-0.5
00.5
11.5
2
13-Sep 14-Sep 15-Sep 16-Sep 17-Sep 18-Sep 19-Sep 20-SepGMT
Met
ers
Figure 110. Solomons, MD storm surge.
-2-1.5
-1-0.5
00.5
11.5
2
13-Sep 14-Sep 15-Sep 16-Sep 17-Sep 18-Sep 19-Sep 20-SepGMT
Met
ers
Figure 111. Annapolis, MD storm surge.
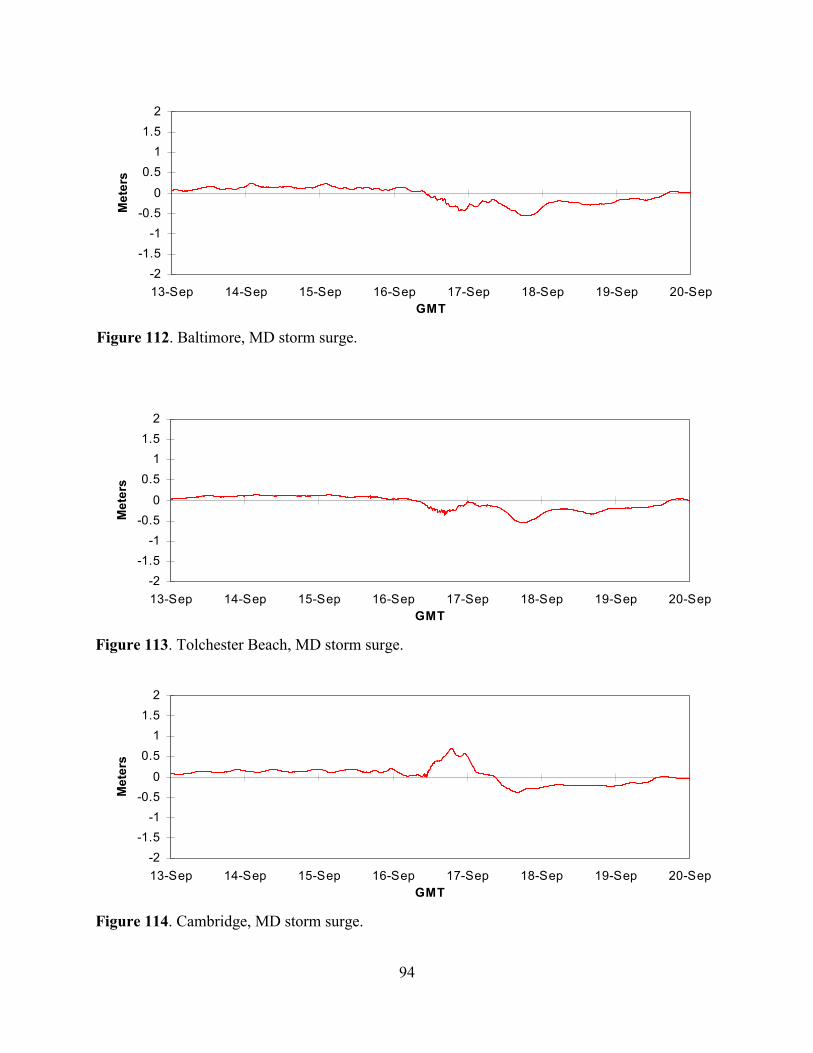
94
-2-1.5
-1-0.5
00.5
11.5
2
13-Sep 14-Sep 15-Sep 16-Sep 17-Sep 18-Sep 19-Sep 20-SepGMT
Met
ers
Figure 112. Baltimore, MD storm surge.
-2-1.5
-1-0.5
00.5
11.5
2
13-Sep 14-Sep 15-Sep 16-Sep 17-Sep 18-Sep 19-Sep 20-SepGMT
Met
ers
Figure 113. Tolchester Beach, MD storm surge.
-2-1.5
-1-0.5
00.5
11.5
2
13-Sep 14-Sep 15-Sep 16-Sep 17-Sep 18-Sep 19-Sep 20-SepGMT
Met
ers
Figure 114. Cambridge, MD storm surge.

95
-2-1.5
-1-0.5
00.5
11.5
2
13-Sep 14-Sep 15-Sep 16-Sep 17-Sep 18-Sep 19-Sep 20-SepGMT
Met
ers
Figure 115. Kiptopeke Beach, VA storm surge.
-2-1.5
-1-0.5
00.5
11.5
2
13-Sep 14-Sep 15-Sep 16-Sep 17-Sep 18-Sep 19-Sep 20-SepGMT
Met
ers
Figure 116. Wachapreague, VA storm surge.
-2-1.5
-1-0.5
00.5
11.5
2
13-Sep 14-Sep 15-Sep 16-Sep 17-Sep 18-Sep 19-Sep 20-SepGMT
Met
ers
Figure 117. Lewes, DE storm surge.

96
-2-1.5
-1-0.5
00.5
11.5
2
13-Sep 14-Sep 15-Sep 16-Sep 17-Sep 18-Sep 19-Sep 20-SepGMT
Met
ers
Figure 118. Reedy Point, DE storm surge.
-2-1.5
-1-0.5
00.5
11.5
2
13-Sep 14-Sep 15-Sep 16-Sep 17-Sep 18-Sep 19-Sep 20-SepGMT
Met
ers
Figure 119. Philadelphia, PA storm surge.
-2-1.5
-1-0.5
00.5
11.5
2
13-Sep 14-Sep 15-Sep 16-Sep 17-Sep 18-Sep 19-Sep 20-SepGMT
Met
ers
Figure 120. Cape May, NJ storm surge.
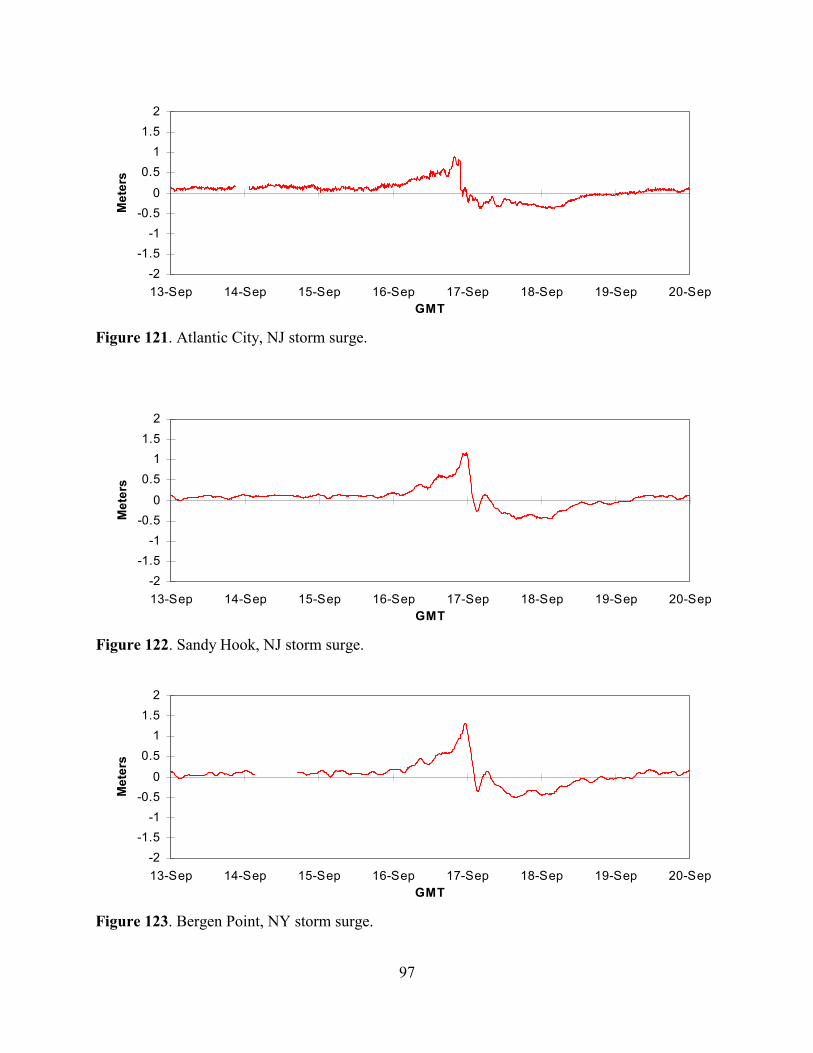
97
-2-1.5
-1-0.5
00.5
11.5
2
13-Sep 14-Sep 15-Sep 16-Sep 17-Sep 18-Sep 19-Sep 20-SepGMT
Met
ers
Figure 121. Atlantic City, NJ storm surge.
-2-1.5
-1-0.5
00.5
11.5
2
13-Sep 14-Sep 15-Sep 16-Sep 17-Sep 18-Sep 19-Sep 20-SepGMT
Met
ers
Figure 122. Sandy Hook, NJ storm surge.
-2-1.5
-1-0.5
00.5
11.5
2
13-Sep 14-Sep 15-Sep 16-Sep 17-Sep 18-Sep 19-Sep 20-SepGMT
Met
ers
Figure 123. Bergen Point, NY storm surge.

98
-2-1.5
-1-0.5
00.5
11.5
2
13-Sep 14-Sep 15-Sep 16-Sep 17-Sep 18-Sep 19-Sep 20-SepGMT
Met
ers
Figure 124. The Battery, NY storm surge.
-2-1.5
-1-0.5
00.5
11.5
2
13-Sep 14-Sep 15-Sep 16-Sep 17-Sep 18-Sep 19-Sep 20-SepGMT
Met
ers
Figure 125. Montauk, NY storm surge.
-2-1.5
-1-0.5
00.5
11.5
2
13-Sep 14-Sep 15-Sep 16-Sep 17-Sep 18-Sep 19-Sep 20-SepGMT
Met
ers
Figure 126. Willets Point, NY storm surge.
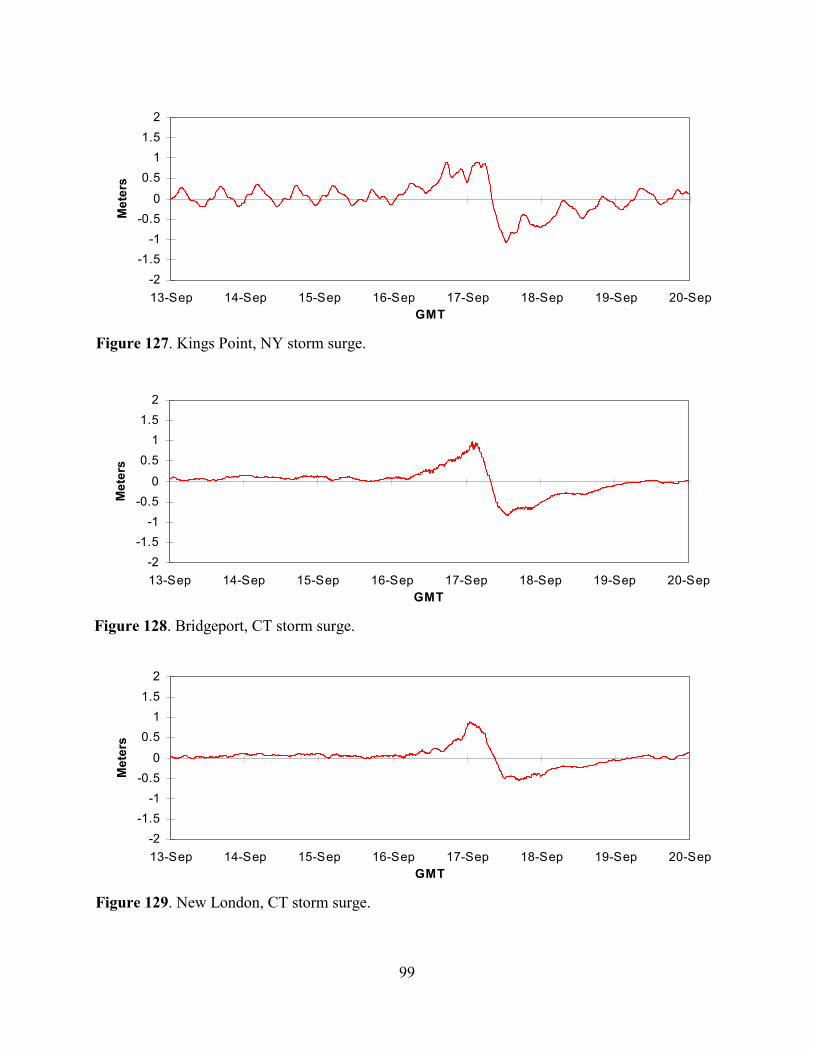
99
-2-1.5
-1-0.5
00.5
11.5
2
13-Sep 14-Sep 15-Sep 16-Sep 17-Sep 18-Sep 19-Sep 20-SepGMT
Met
ers
Figure 127. Kings Point, NY storm surge.
-2-1.5
-1-0.5
00.5
11.5
2
13-Sep 14-Sep 15-Sep 16-Sep 17-Sep 18-Sep 19-Sep 20-SepGMT
Met
ers
Figure 128. Bridgeport, CT storm surge.
-2-1.5
-1-0.5
00.5
11.5
2
13-Sep 14-Sep 15-Sep 16-Sep 17-Sep 18-Sep 19-Sep 20-SepGMT
Met
ers
Figure 129. New London, CT storm surge.

100
-2-1.5
-1-0.5
00.5
11.5
2
13-Sep 14-Sep 15-Sep 16-Sep 17-Sep 18-Sep 19-Sep 20-SepGMT
Met
ers
Figure 130. Providence, RI storm surge.
-2-1.5
-1-0.5
00.5
11.5
2
13-Sep 14-Sep 15-Sep 16-Sep 17-Sep 18-Sep 19-Sep 20-SepGMT
Met
ers
Figure 131. Newport, RI storm surge.
-2-1.5
-1-0.5
00.5
11.5
2
13-Sep 14-Sep 15-Sep 16-Sep 17-Sep 18-Sep 19-Sep 20-SepGMT
Met
ers
Figure 132. Woods Hole, MA storm surge.

101
-2-1.5
-1-0.5
00.5
11.5
2
13-Sep 14-Sep 15-Sep 16-Sep 17-Sep 18-Sep 19-Sep 20-SepGMT
Met
ers
Figure 133. Nantucket, MA storm surge.
-2-1.5
-1-0.5
00.5
11.5
2
13-Sep 14-Sep 15-Sep 16-Sep 17-Sep 18-Sep 19-Sep 20-SepGMT
Met
ers
Figure 134. Boston, MA storm surge.

102

103
Appendix IV.
Time series of wind speed and barometric pressure at NWLON stations

104
0
5
10
15
20
25
30
35
13-Sep 14-Sep 15-Sep 16-Sep 17-Sep 18-Sep 19-Sep 20-Sep
Met
ers/S
econ
d
970
980
990
1000
1010
1020
1030
Mill
ibar
s
Figure 135. Virginia Key, FL wind speed (thick line) and barometric pressure (thin line).
0
5
10
15
20
25
30
35
13-Sep 14-Sep 15-Sep 16-Sep 17-Sep 18-Sep 19-Sep 20-Sep
Met
ers/S
econ
d
970
980
990
1000
1010
1020
1030
Mill
ibar
s
Figure 136. Mayport, FL wind speed (thick line) and barometric pressure (thin line).
0
5
10
15
20
25
30
35
13-Sep 14-Sep 15-Sep 16-Sep 17-Sep 18-Sep 19-Sep 20-Sep
Met
ers/S
econ
d
970
980
990
1000
1010
1020
1030M
illib
ars
Figure 137. Cape Hatteras, NC wind speed (thick line) and barometric pressure (thin line).
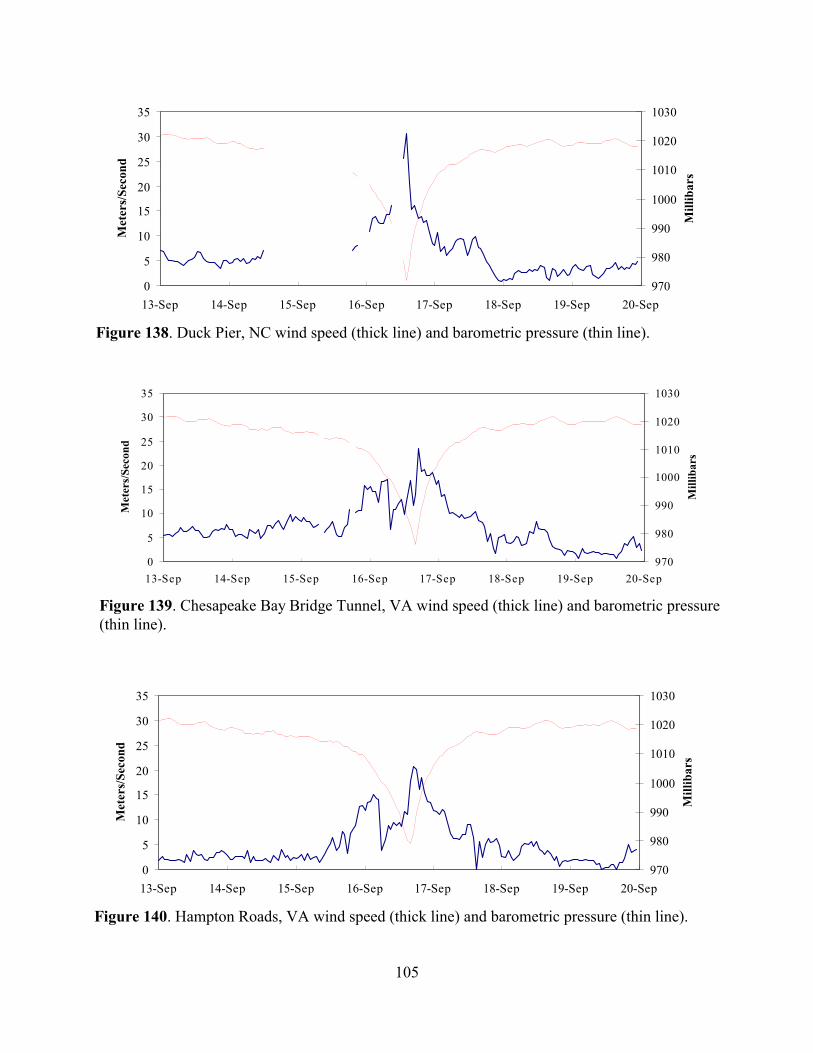
105
0
5
10
15
20
25
30
35
13-Sep 14-Sep 15-Sep 16-Sep 17-Sep 18-Sep 19-Sep 20-Sep
Met
ers/S
econ
d
970
980
990
1000
1010
1020
1030
Mill
ibar
s
Figure 138. Duck Pier, NC wind speed (thick line) and barometric pressure (thin line).
0
5
10
15
20
25
30
35
13-Sep 14-Sep 15-Sep 16-Sep 17-Sep 18-Sep 19-Sep 20-Sep
Met
ers/
Seco
nd
970
980
990
1000
1010
1020
1030
Mill
ibar
s
Figure 139. Chesapeake Bay Bridge Tunnel, VA wind speed (thick line) and barometric pressure(thin line).
0
5
10
15
20
25
30
35
13-Sep 14-Sep 15-Sep 16-Sep 17-Sep 18-Sep 19-Sep 20-Sep
Met
ers/S
econ
d
970
980
990
1000
1010
1020
1030M
illib
ars
Figure 140. Hampton Roads, VA wind speed (thick line) and barometric pressure (thin line).
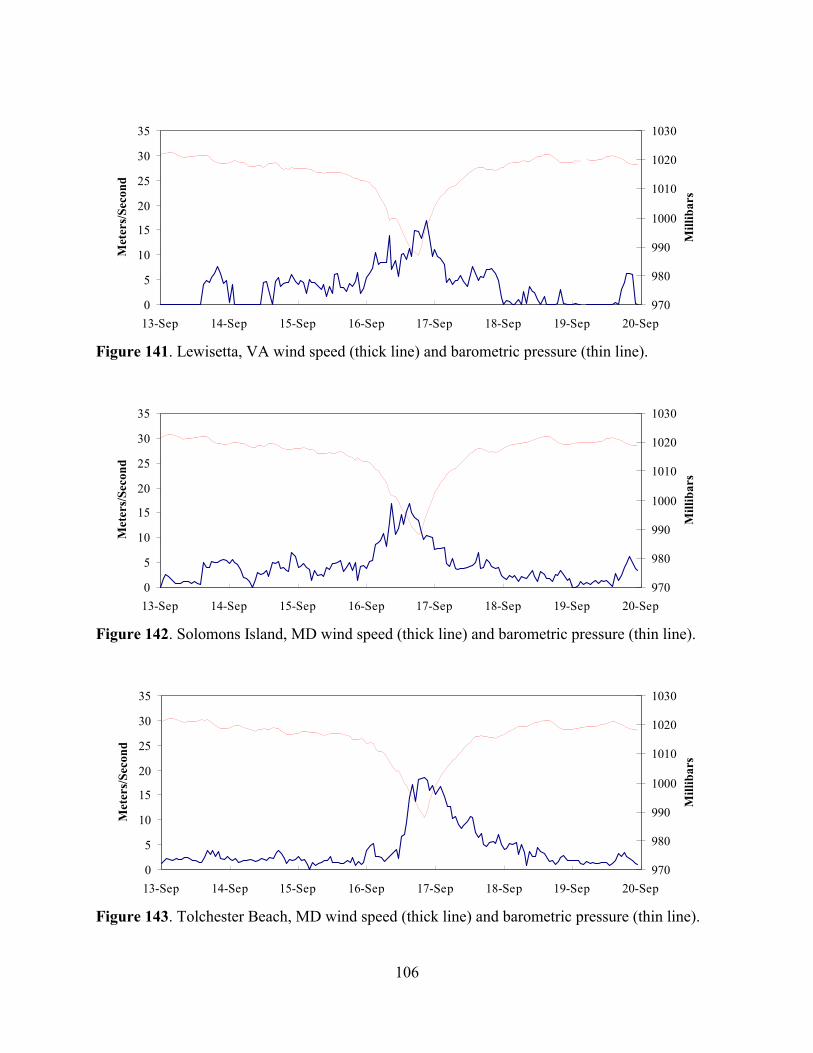
106
0
5
10
15
20
25
30
35
13-Sep 14-Sep 15-Sep 16-Sep 17-Sep 18-Sep 19-Sep 20-Sep
Met
ers/S
econ
d
970
980
990
1000
1010
1020
1030
Mill
ibar
s
Figure 141. Lewisetta, VA wind speed (thick line) and barometric pressure (thin line).
0
5
10
15
20
25
30
35
13-Sep 14-Sep 15-Sep 16-Sep 17-Sep 18-Sep 19-Sep 20-Sep
Met
ers/S
econ
d
970
980
990
1000
1010
1020
1030
Mill
ibar
s
Figure 142. Solomons Island, MD wind speed (thick line) and barometric pressure (thin line).
0
5
10
15
20
25
30
35
13-Sep 14-Sep 15-Sep 16-Sep 17-Sep 18-Sep 19-Sep 20-Sep
Met
ers/S
econ
d
970
980
990
1000
1010
1020
1030M
illib
ars
Figure 143. Tolchester Beach, MD wind speed (thick line) and barometric pressure (thin line).

107
0
5
10
15
20
25
30
35
13-Sep 14-Sep 15-Sep 16-Sep 17-Sep 18-Sep 19-Sep 20-Sep
Met
ers/S
econ
d
970
980
990
1000
1010
1020
1030
Mill
ibar
s
Figure 144. Cambridge, MD wind speed (thick line) and barometric pressure (thin line).
0
5
10
15
20
25
30
35
13-Sep 14-Sep 15-Sep 16-Sep 17-Sep 18-Sep 19-Sep 20-Sep
Met
ers/S
econ
d
970
980
990
1000
1010
1020
1030
Mill
ibar
s
Figure 145. Sandy Hook, NJ wind speed (thick line) and barometric pressure (thin line).
0
5
10
15
20
25
30
35
13-Sep 14-Sep 15-Sep 16-Sep 17-Sep 18-Sep 19-Sep 20-Sep
Met
ers/S
econ
d
970
980
990
1000
1010
1020
1030M
illib
ars
Figure 146. Bergen Point, NY wind speed (thick line) and barometric pressure (thin line).

108
0
5
10
15
20
25
30
35
13-Sep 14-Sep 15-Sep 16-Sep 17-Sep 18-Sep 19-Sep 20-Sep
Met
ers/S
econ
d
970
980
990
1000
1010
1020
1030
Mill
ibar
s
Figure 147. Kings Point, NY wind speed (thick line) and barometric pressure (thin line).
970
980
990
1000
1010
1020
1030
13-Sep 14-Sep 15-Sep 16-Sep 17-Sep 18-Sep 19-Sep 20-Sep
Mill
ibar
s
Figure 148. Providence, RI barometric pressure.
970
980
990
1000
1010
1020
1030
13-Sep 14-Sep 15-Sep 16-Sep 17-Sep 18-Sep 19-Sep 20-Sep
Mill
ibar
s
Figure 149. Newport, RI barometric pressure.
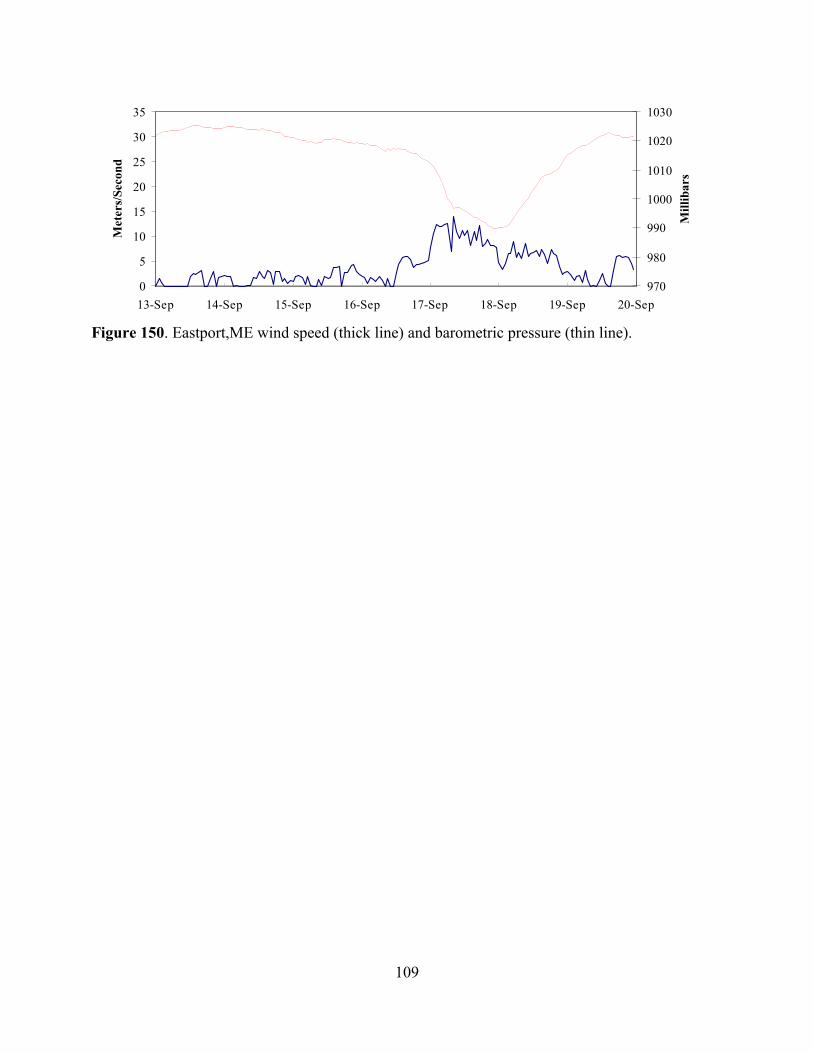
109
0
5
10
15
20
25
30
35
13-Sep 14-Sep 15-Sep 16-Sep 17-Sep 18-Sep 19-Sep 20-Sep
Met
ers/
Seco
nd
970
980
990
1000
1010
1020
1030
Mill
ibar
s
Figure 150. Eastport,ME wind speed (thick line) and barometric pressure (thin line).

![THE NATIONAL HURRICANE RE · 2009. 2. 5. · Sep 1999. Floyd was a part of the upturn in Atlantic hurricane activity that began in 1995. [Source: Neal Dorst, NOAA.] A history of the](https://static.fdocuments.us/doc/165x107/5fefdacb0defbf7e6e6a39c3/the-national-hurricane-re-2009-2-5-sep-1999-floyd-was-a-part-of-the-upturn.jpg)