Habitat Assessment of a Newly Established Breeding Pond for the
ORIGINAL ARTICLE
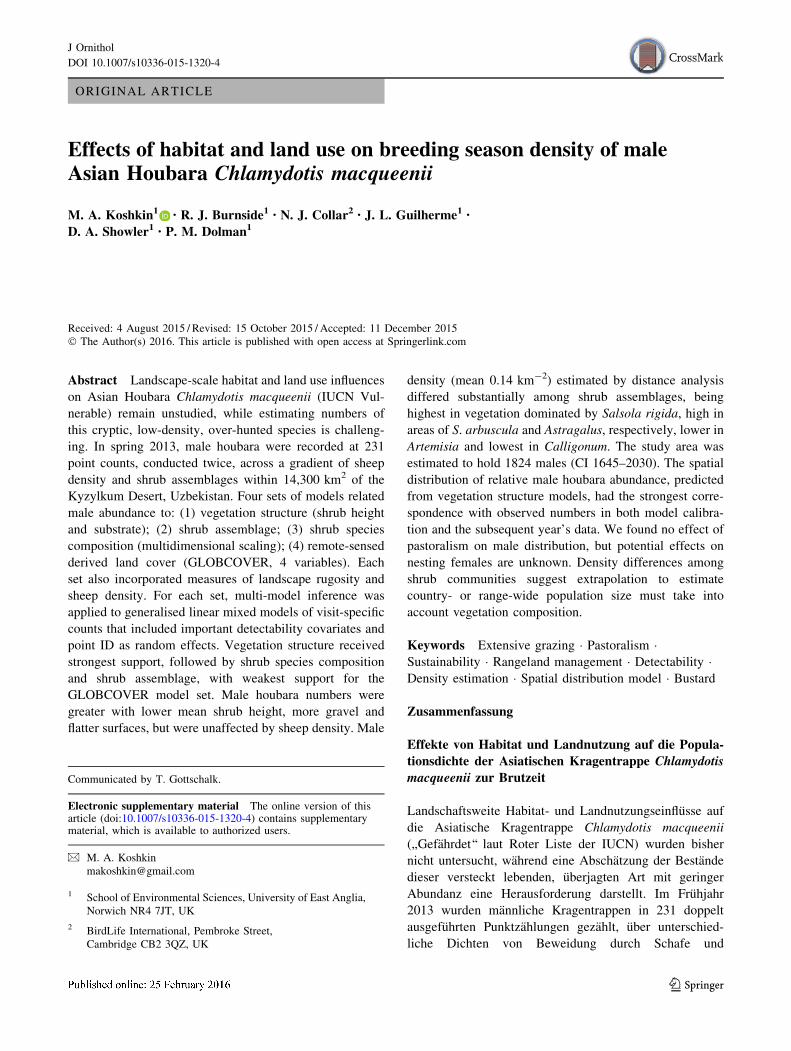
Effects of habitat and land use on breeding season density of maleAsian Houbara Chlamydotis macqueenii
M. A. Koshkin1 • R. J. Burnside1 • N. J. Collar2 • J. L. Guilherme1 •
D. A. Showler1 • P. M. Dolman1
Received: 4 August 2015 / Revised: 15 October 2015 / Accepted: 11 December 2015
� The Author(s) 2016. This article is published with open access at Springerlink.com
Abstract Landscape-scale habitat and land use influences
on Asian Houbara Chlamydotis macqueenii (IUCN Vul-
nerable) remain unstudied, while estimating numbers of
this cryptic, low-density, over-hunted species is challeng-
ing. In spring 2013, male houbara were recorded at 231
point counts, conducted twice, across a gradient of sheep
density and shrub assemblages within 14,300 km2 of the
Kyzylkum Desert, Uzbekistan. Four sets of models related
male abundance to: (1) vegetation structure (shrub height
and substrate); (2) shrub assemblage; (3) shrub species
composition (multidimensional scaling); (4) remote-sensed
derived land cover (GLOBCOVER, 4 variables). Each
set also incorporated measures of landscape rugosity and
sheep density. For each set, multi-model inference was
applied to generalised linear mixed models of visit-specific
counts that included important detectability covariates and
point ID as random effects. Vegetation structure received
strongest support, followed by shrub species composition
and shrub assemblage, with weakest support for the
GLOBCOVER model set. Male houbara numbers were
greater with lower mean shrub height, more gravel and
flatter surfaces, but were unaffected by sheep density. Male
density (mean 0.14 km-2) estimated by distance analysis
differed substantially among shrub assemblages, being
highest in vegetation dominated by Salsola rigida, high in
areas of S. arbuscula and Astragalus, respectively, lower in
Artemisia and lowest in Calligonum. The study area was
estimated to hold 1824 males (CI 1645–2030). The spatial
distribution of relative male houbara abundance, predicted
from vegetation structure models, had the strongest corre-
spondence with observed numbers in both model calibra-
tion and the subsequent year’s data. We found no effect of
pastoralism on male distribution, but potential effects on
nesting females are unknown. Density differences among
shrub communities suggest extrapolation to estimate
country- or range-wide population size must take into
account vegetation composition.
Keywords Extensive grazing � Pastoralism �Sustainability � Rangeland management � Detectability �Density estimation � Spatial distribution model � Bustard
Zusammenfassung
Effekte von Habitat und Landnutzung auf die Popula-
tionsdichte der Asiatischen Kragentrappe Chlamydotis
macqueenii zur Brutzeit
Landschaftsweite Habitat- und Landnutzungseinflusse auf
die Asiatische Kragentrappe Chlamydotis macqueenii
(,,Gefahrdet‘‘ laut Roter Liste der IUCN) wurden bisher
nicht untersucht, wahrend eine Abschatzung der Bestande
dieser versteckt lebenden, uberjagten Art mit geringer
Abundanz eine Herausforderung darstellt. Im Fruhjahr
2013 wurden mannliche Kragentrappen in 231 doppelt
ausgefuhrten Punktzahlungen gezahlt, uber unterschied-
liche Dichten von Beweidung durch Schafe und
Communicated by T. Gottschalk.
Electronic supplementary material The online version of thisarticle (doi:10.1007/s10336-015-1320-4) contains supplementarymaterial, which is available to authorized users.
& M. A. Koshkin
1 School of Environmental Sciences, University of East Anglia,
Norwich NR4 7JT, UK
2 BirdLife International, Pembroke Street,
Cambridge CB2 3QZ, UK
123
J Ornithol
DOI 10.1007/s10336-015-1320-4
Strauchbewuchs hinweg, in einem 14.300 km2 großen
Gebiet der Kyzylkum-Wuste in Usbekistan. Vier Modelle
stellten den Zusammenhang der Abundanz der Mannchen
dar zu: (1) Vegetationsstruktur (Strauchhohe und Substrat),
(2) Strauchdichte, (3) Zusammensetzung der Straucharten
(Multidimensionale Skalierung), (4) Landbedeckung, her-
geleitet aus Fernerkundungsdaten (GLOBCOVER, 4
Variable). Jeder Datensatz enthielt auch Maße fur die
Rauheit der Landschaft sowie die Beweidungsdichte durch
Schafe. Fur jeden Datensatz wurde eine Multi-Modell
Inferenz auf GLMMs von Zahlen einer bestimmten Zah-
lung angewandt, die wichtige Kovariate zur ,,Entdeckbar-
keit‘‘ und Punkt-ID als Random Effect einschloss.
Vegetationsstruktur wurde am starksten unterstutzt, gefolgt
von Zusammensetzung der Straucharten und Strauchdichte,
mit der schwachsten Unterstutzung fur die Daten aus dem
GLOBCOVER Modell. Die Anzahl mannlicher Kragen-
trappen war großer mit geringerer mittlerer Strauchhohe,
mehr Schotter und flacheren Oberflachen, waren aber
unbeeinflusst von der Beweidungsdichte durch Schafe. Die
Abundanz von Mannchen (durchschnittlich 0,14 km-2),
geschatzt anhand einer Distanzanalyse, unterschied sich
wesentlich zwischen verschiedenen Zusammensetzungen
von Strauchern: sie war am hochsten in Vegetationen, die
von Salsola rigida dominiert wurde, hoch in Gegenden mit
S. arbuscula und Astralagus, geringer fur Artemisia und am
niedrigsten mit Calligonum. Die Anzahl der Mannchen im
Untersuchungsgebiet wurde auf 1824 (1645-2030)
geschatzt. Die raumliche Verteilung der relativen Abun-
danz der mannlichen Kragentrappen, vorhergesagt aus
Vegetationsstruktur-Modellen, hatte die starkste Uberein-
stimmung mit den beobachteten Zahlen sowohl in der
Modellkalibration als auch den Daten des Folgejahres. Wir
fanden keinen Effekt von Hutehaltung auf die Verteilung
der Mannchen, aber ein moglicher Effekt auf nistende
Weibchen ist unbekannt. Dichteunterschiede zwischen
Strauch-Gesellschaften legen es nahe, dass zur Extrapola-
tion einer landes- oder gebietsweiten Populationsgroße die
Zusammensetzung der Vegetation berucksichtigt werden
muss.
Introduction
Sparsely distributed cryptic animals present a serious
challenge to researchers. Habitat suitability modelling
allows the relative importance of environmental factors to
be assessed and supports distribution and relative density
mapping of such species (Peterson 2006; Hirzel and Lay
2008), and this can be used to prioritise areas for man-
agement and protection (Renwick et al. 2012; Johnston
et al. 2015). However, estimating their actual population
size is much more problematic, although this is a necessary
requirement for evidence-based management of exploited
populations (Waber et al. 2013).
The Asian Houbara Chlamydotis macqueenii is a large
but cryptic terrestrial bird of sparsely vegetated semi-arid
environments stretching from Sinai (Egypt) to Mongolia.
Poorly regulated and unsustainable hunting and trapping on
both migration routes and wintering grounds (Combreau
et al. 2001) have been blamed for declines in Kazakhstan
(Tourenq et al. 2004, 2005; Riou et al. 2011), which hosts
an estimated 77 % of the global population (Goriup 1997),
resulting in Asian Houbara being listed by the International
Union for Conservation of Nature (IUCN) as Vulnerable
(BirdLife International 2015). Habitat degradation from
agricultural intensification and overgrazing, combined with
human disturbance, is thought also to be affecting the
species in parts of its range (Goriup 1997; Combreau et al.
2001, 2002), albeit with little published evidence.
The conservation response to the plight of the Asian
Houbara has focused on large-scale captive breeding and
release (Seddon et al. 1995; Combreau and Smith 1998;
Charge et al. 2014) rather than on improved regulation to
render hunting sustainable. However, a further possible
measure to partly compensate for the effects of hunting and
trapping is the management of local wild populations
within the core breeding range. This could take the form of
identifying and mitigating region-specific issues affecting
habitat quality and extent, local abundance and demogra-
phy. To establish an evidence base for such management it
is necessary (1) to establish the degree to which houbara
abundance varies with habitats and with the anthropogenic
pressures exerted on them, and (2) to reach a robust esti-
mate of local population size as a benchmark against which
to monitor the effects of future interventions.
Several studies have related land use factors to density
and distribution of resident African Houbara C. undulata
across its range, and indicated that breeding birds are
negatively affected by direct and indirect human distur-
bance, avoiding settlements, major roads, wells, shepherds’
camps and agricultural fields (Carrascal et al. 2006, 2008;
Hingrat et al. 2008; Chammem et al. 2012). In contrast, a
study in Iran showed wintering Asian Houbara were
associated with croplands (Aghainajafi-Zadeh et al. 2010),
while breeding season distribution of male Asian Houbara
was not found to be influenced by pastoralism in Uzbek-
istan (Koshkin et al. 2014).
Most studies assessing habitat use by wild houbara of
both species have operated at the micro-scale: the imme-
diate vicinity of male display sites (10 m 9 10 m, Yang
et al. 2002b), nests (10 m 9 10 m, in both Yang et al.
2002b; Aghanajafizadeh et al. 2012), tracks (2.5-m width,
Launay et al. 1997b) or telemetry locations (50 m 9 3 m,
Combreau and Smith 1997; 100-m radius, Hingrat et al.
J Ornithol
123

2007). However, heterogeneity of topography, vegetation
and soil, and a need for conservation planning on a regional
extent, necessitate the study of how density varies at
landscape scales rather than at micro-site scales. Other
studies have examined the influence of habitat and land use
characteristics on houbara presence/absence at larger spa-
tial scales, i.e. for 500 m walked transects (Carrascal et al.
2008) or 20 km 9 20 km grid cells (Chammem et al.
2012). Van Heezik and Seddon (1999) examined Asian
Houbara habitat selection among seven habitats (defined by
landform and substrate) in Saudi Arabia, using a sample of
sightings (n = 229) collected along standardised drives
within a study area of about 750 km2, and found that
probability of selection for different habitats varied with
season. However, sex was not considered and analysis of
habitat selection was performed on observation data
merged across four years to obtain sufficient sample sizes.
Density estimates are necessary for the extrapolation of
population sizes, which can then potentially be used to
inform sustainable harvest quotas and the assessment of
conservation status. However, few recent estimates exist
for migrant houbara population sizes in the breeding range
from Central Asia to Mongolia. In the mid-1990s the global
population of the Asian Houbara was estimated at
39,000–52,000 individuals, of which 77 % were in Kaza-
khstan and 15 % in Uzbekistan (Goriup 1997). This esti-
mate, however, extrapolated country-wide numbers from
local estimates (Gubin 1992; Mitropolsky et al. 1996).
Subsequent studies that provided density estimates for
several subpopulations in Kazakhstan (Tourenq et al. 2004,
2005; Riou et al. 2011) experienced methodological limi-
tations (see ‘‘Discussion’’), while for Uzbekistan the two
assessments available were considered preliminary and
provisional (Launay et al. 1997a; Koshkin et al. 2014).
To our knowledge, no previous study has sought to
establish regional population sizes by comparing houbara
breeding densities among habitats at the landscape scale.
Here, we assess the effects of habitat and human land use
on houbara abundance and provide the first robust estimate
of density and a regional population size for this species.
Methods
Study area
The study area (39.34–40.56�N 62.21–65.20�E,170–400 m above sea level; approximately 14,300 km2) is
located in the Bukhara District of Uzbekistan, within the
Kyzylkum part of the Southern Central Asian Desert
(Fig. 1). The terrain is predominantly flat to gently rolling,
bounded to the north and east by low dry mountains, and to
the south-east by irrigated croplands and permanent
settlements. Plant communities are dominated by drought-
resistant and halophytic shrubs, with shrub assemblage and
vegetation structure varying with landform and substrate
(gypseous soils, consolidated or loose sands), resulting in a
mosaic of habitats at the landscape scale. Although largely
unpopulated with only a few scattered small settlements,
parts of the area are grazed in spring by mixed flocks of
sheep (predominantly) and goats (hereafter ‘sheep’). Most
such livestock are managed from seasonal camps and their
distribution is limited by the distribution of functioning
wells and to areas to which water can be transported. Thus,
livestock densities are highest in areas closer to settlements
and permanent water sources, leaving substantial areas of
the desert sheep-free (Koshkin et al. 2014).
Sampling of houbara
Houbara are shy and difficult to see. However, during the
breeding season (March–May) displaying males (and also
floating males; see SOM, ‘‘Discussion’’ section) are con-
spicuous and can be apparent from long distances. This
provides an opportunity for male population assessment
with a relatively high degree of accuracy. From 24 March
to 19 May 2013, two counts several weeks apart were made
at each of 231 points across the study area. Counts were
repeated at each location to reduce sampling error from
weather or time of day. Subsequent analyses of visit-
specific counts allowed these factors, as well as season
(detectability was expected to decrease with season pro-
gress), to be controlled for in analyses of abundance, while
separate analysis of the maximum count across two visits
did not account for these covariates. Point count locations
were randomly selected (excluding known unsuit-
able breeding habitats, e.g. wetlands, mountains, irrigated
and built-up areas), originally stratifying sampling effort
across four shrub assemblages as mapped by Rachovskaya
(1995): Artemisia, Salsola spp., Astragalus and Cal-
ligonum, following Koshkin et al. (2014). Locations were a
minimum of 4 km apart to avoid pseudo-replication and
reduce spatial autocorrelation. The classification and dis-
tribution of shrub assemblages were subsequently refined
using vegetation data collected during this study, providing
the following revised distribution of sampling locations:
Artemisia (2873 km2), n = 33; Salsola arbuscula
(3904 km2), n = 67; S. rigida (2180 km2), n = 36; As-
tragalus (3778 km2), n = 69; and Calligonum (1603 km2),
n = 26 (Fig. 1). For a full description of vegetation sam-
pling, classification and assemblages see (SOM, ‘‘Intro-
duction’’ section).
Each count was conducted from the most appropriate
vantage point (highest point, typically a small rise) within
400 m of the location originally selected in GIS, with the
second count conducted from the same point. Each point
J Ornithol
123
count (an initial scan with binoculars followed by extensive
scanning with a 20–609 telescope) lasted 30 min and was
undertaken by a single observer during the period of peak
male display activity, i.e. within 3 h after sunrise and 2 h
before sunset (Combreau and Launay 1996). For each
houbara or houbara group observed, the sex, age, number
of individuals, distance from observer (measured by laser
rangefinder up to 1400 m) and activity (flying, walking,
standing, crouching and/or displaying) and time of obser-
vation were recorded. Combination of plumage and struc-
ture of head and neck, as well as relative size of individuals
in a group, was used to sex non-displaying birds. Obser-
vations beyond 1400 m could not be reliably measured by
rangefinder and were, therefore, excluded from further
analysis to avoid error and potential bias in density esti-
mation (Buckland et al. 2001). As weather conditions may
affect behaviour and, thus, detectability, wind strength was
recorded during each point count (0 = no wind, 3 = strong
wind; see Table 1). Other conditions, such as fog and
morning dew, which could affect a bird’s behaviour and
visibility, were not encountered during the study, whereas
counts were not conducted during rain.
Detectability covariates and estimates of male
houbara density and numbers
Six a priori factors, date, visit, time, wind, shrub height and
landscape rugosity (a measure of terrain unevenness; DEM
SD), were postulated to affect houbara detectability (see
Table 1). The first four may influence the incidence of
male display, while shrub height and landscape rugosity
could influence visibility (SOM, ‘‘Methods’’ section). Their
effects on detectability were examined in a series of mul-
tiple-covariate distance sampling (MCDS) models within
DISTANCE 6.0, which also examined alternative contin-
uous, quadratic or categorical formulations (SOM,
‘‘Methods’’ section). Those detectability covariates sup-
ported by the best MCDS model [lowest Akaike informa-
tion criterion (AIC)] were subsequently included in
distance models used to estimate houbara density and
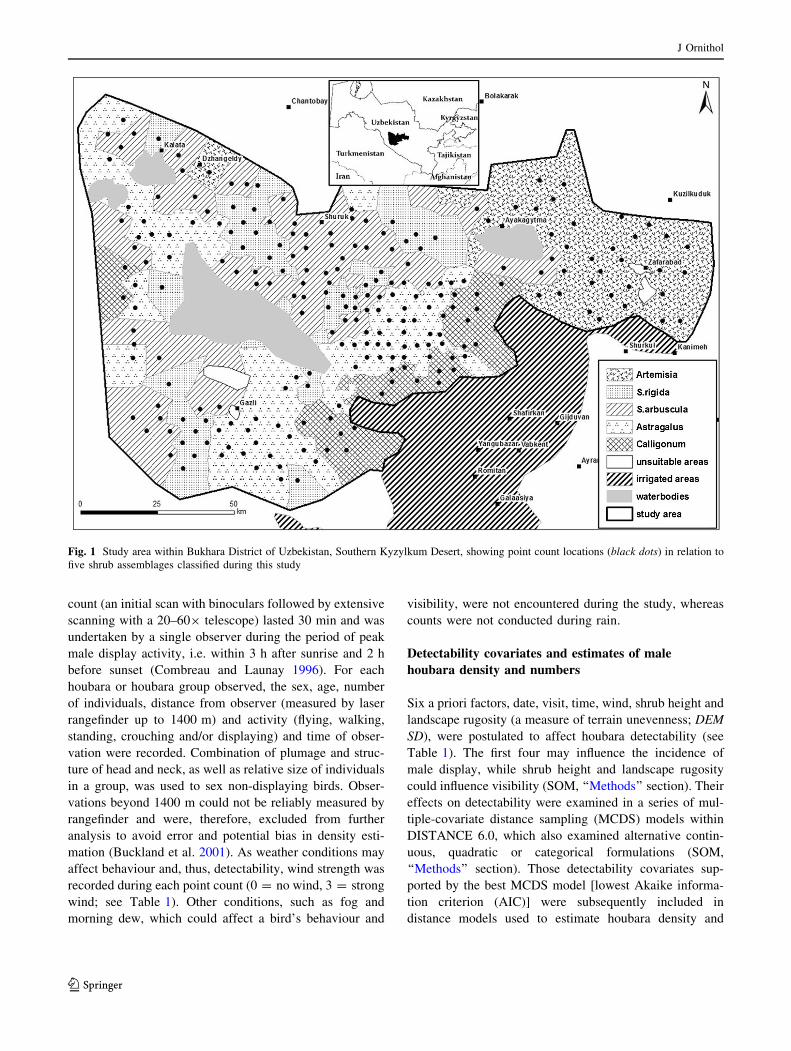
Fig. 1 Study area within Bukhara District of Uzbekistan, Southern Kyzylkum Desert, showing point count locations (black dots) in relation to
five shrub assemblages classified during this study
J Ornithol
123
population size and in subsequent multivariate species
habitat models.
The density of male houbara in each of the five shrub
assemblages was estimated by MCDS models that incor-
porated supported detectability variables, stratifying
encounter rate and density by shrub assemblage, and the
total number of males was estimated as the area-weighted
mean of assemblage-specific estimates.
Habitat and land use variables
To examine the potential influence of habitat, landform and
land use on houbara abundance, six habitat variables
(landscape rugosity, remote sensed land cover, and field
derived measures of soil [substrate] type, shrub vegetation
composition and structure) and one anthropogenic variable
(sheep density) were considered (Table 1). The mean
seasonal sheep density around each point was extracted
from an interpolated density surface based on multiple
distance transects, rather than visit-specific measures that
would be affected by sampling error relative to daily flock
movements. Field measures of substrate, shrub composi-
tion, assemblage class and structure taken around each
point count were used in model calibration. Similar mea-
sures were taken at an additional 586 sampling locations
across the study area, allowing interpolation to calculate
assemblage extent (for habitat-area weighted population
estimates) and resampling when predicting abundance
using multivariate habitat models.
Shrub species composition and structure measurements
were taken along four 50-m line intercepts located 500 m
from each of the 231 point count locations during 16 May–
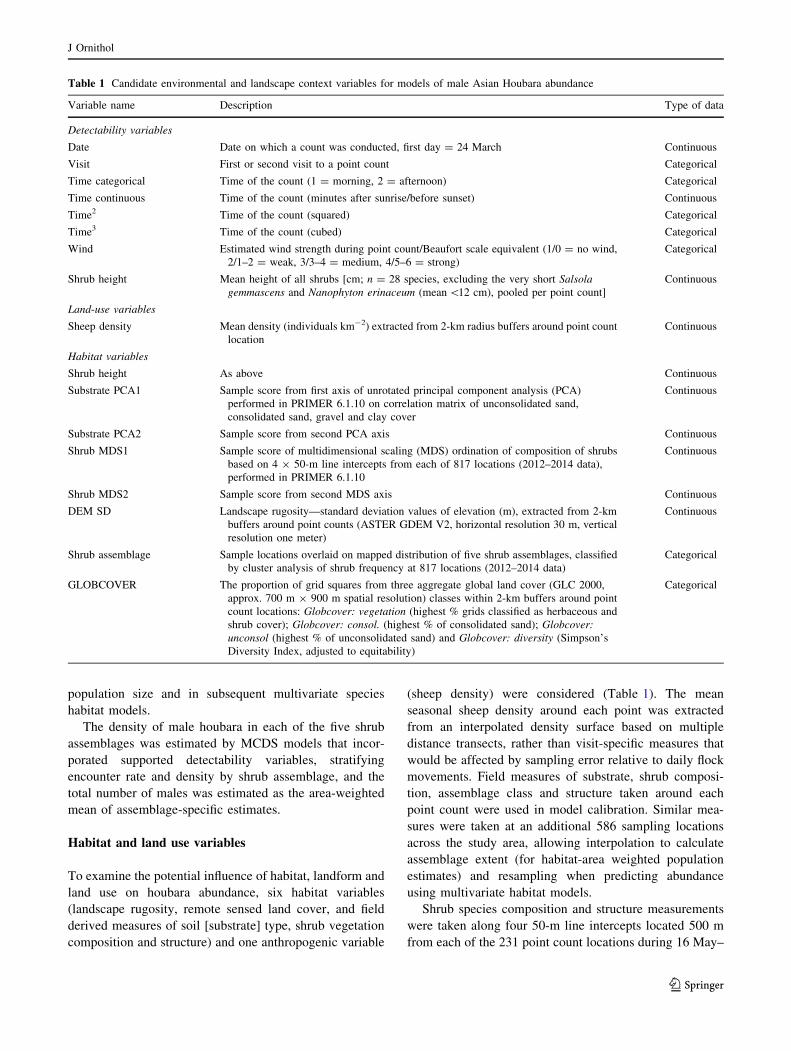
Table 1 Candidate environmental and landscape context variables for models of male Asian Houbara abundance
Variable name Description Type of data
Detectability variables
Date Date on which a count was conducted, first day = 24 March Continuous
Visit First or second visit to a point count Categorical
Time categorical Time of the count (1 = morning, 2 = afternoon) Categorical
Time continuous Time of the count (minutes after sunrise/before sunset) Continuous
Time2 Time of the count (squared) Categorical
Time3 Time of the count (cubed) Categorical
Wind Estimated wind strength during point count/Beaufort scale equivalent (1/0 = no wind,
2/1–2 = weak, 3/3–4 = medium, 4/5–6 = strong)
Categorical
Shrub height Mean height of all shrubs [cm; n = 28 species, excluding the very short Salsola
gemmascens and Nanophyton erinaceum (mean\12 cm), pooled per point count]
Continuous
Land-use variables
Sheep density Mean density (individuals km-2) extracted from 2-km radius buffers around point count
location
Continuous
Habitat variables
Shrub height As above Continuous
Substrate PCA1 Sample score from first axis of unrotated principal component analysis (PCA)
performed in PRIMER 6.1.10 on correlation matrix of unconsolidated sand,
consolidated sand, gravel and clay cover
Continuous
Substrate PCA2 Sample score from second PCA axis Continuous
Shrub MDS1 Sample score of multidimensional scaling (MDS) ordination of composition of shrubs
based on 4 9 50-m line intercepts from each of 817 locations (2012–2014 data),
performed in PRIMER 6.1.10
Continuous
Shrub MDS2 Sample score from second MDS axis Continuous
DEM SD Landscape rugosity—standard deviation values of elevation (m), extracted from 2-km
buffers around point counts (ASTER GDEM V2, horizontal resolution 30 m, vertical
resolution one meter)
Continuous
Shrub assemblage Sample locations overlaid on mapped distribution of five shrub assemblages, classified
by cluster analysis of shrub frequency at 817 locations (2012–2014 data)
Categorical
GLOBCOVER The proportion of grid squares from three aggregate global land cover (GLC 2000,
approx. 700 m 9 900 m spatial resolution) classes within 2-km buffers around point
count locations: Globcover: vegetation (highest % grids classified as herbaceous and
shrub cover); Globcover: consol. (highest % of consolidated sand); Globcover:
unconsol (highest % of unconsolidated sand) and Globcover: diversity (Simpson’s
Diversity Index, adjusted to equitability)
Categorical
J Ornithol
123
6 June 2013, and from an additional 586 locations sampled
during May–June 2012, 2013 and 2014 (for details on
sampling, please see SOM, ‘‘Introduction’’ section). Pooled
line intercept data were used to calculate average shrub
height (considered as a measure of concealment and
potentially also the availability of invertebrate prey).
Substrate cover, i.e. clay, consolidated sand, drifting sand
and gravel, was measured in one 2 m 9 2 m-quadrat per
line intercept and pooled means were reduced to two
orthogonal variables, substrate PCA1 and substrate PCA2
(Table 1), by unrotated principal component analysis per-
formed on the correlation matrix in PRIMER 6.1.10. Shrub
species were identified following Gintzburger et al. (2003);
further sampling details are provided in ‘Supplementary
materials’ (SOM, ‘‘Introduction’’ section). Shrub compo-
sition was considered separately in terms of classification
of five categorical shrub assemblage (by cluster analysis,
SOM, ‘‘Introduction’’ section), or as two uncorrelated
ordination axes obtained by multidimensional scaling
(MDS): shrub MDS1 and shrub MDS2 (SOM, Fig.S1).
Shrub assemblage, shrub structure and substrate were
interpolated (using the inverse distance weighted tool in
ArcMap 10.1) across the study area from data recorded at
all 817 sampling locations. As the habitat and landscape
context selected by the most distant birds affect numbers
seen within 1.4 km of a point count, sheep density, rugosity
and land cover were extracted from a buffer of 2 km
around the point.
To test if freely available remotely sensed land cover
classification provided meaningful models of abundance,
thus removing the need for detailed field measures, we used
global land cover data (GLC 2000; Bartholome and Bel-
ward 2005), with proportionate cover of each of three
aggregate classes (see Table 1 for definitions) extracted
within a 2-km buffer around points using ArcMap 10.1.
Land cover diversity within each buffer was calculated as
Simpson’s diversity index, D (Simpson 1949), adjusted to
equitability (evenness), ED following:
ED ¼ D
Dmax
¼ 1
SP3
i¼1 p2i
where Dmax is the maximum value D could assume if the
three land cover classes were evenly distributed and pi the
proportion of the ith class.
Landscape rugosity (DEM SD) was obtained from
ASTER GDEM V2 (NASA 2011), with low and high DEM
SD values indicating flat and undulating/dissected terrain,
respectively.
Sheep were counted along a total of 947 5-km transects
between 26 March and 31 May 2013 from a vehicle driven
at 30–50 km/h along trackways, with a minimum of 2 km
between consecutive transects to avoid spatio-temporal
autocorrelation. Sheep are walked across the desert all day,
excluding sunrise and sunset, when they are herded to or
from camps; so counts were conducted between 08:00 and
17:00. For each flock, numbers were counted (using
binoculars) and the perpendicular distance to the flock
centre, following Buckland et al. (2001), was measured by
rangefinder. Sheep density was estimated by distance
analysis and an interpolated surface was created (SOM,
‘‘Results’’ section).
Multivariate models of houbara distribution
Habitat, land cover, landform and land use effects on visit-
specific counts of male houbara were examined by random
intercept generalised linear mixed models (GLMMs) with
Poisson error, constructed in R (Ime4 package), allowing
detectability of covariates supported by distance analysis to
be incorporated as fixed effects and including point identity
(ID) as a random effect to control for repeat visits. How-
ever, to extrapolate relative abundance across the study
area, we also constructed separate generalised linear
models (GLMs) of maximum count across the two visits
(as the random effect of point ID cannot be extrapolated for
unsampled areas). Binomial mixture models were consid-
ered inappropriate as their assumption of a static popula-
tion between resampling events (Royle 2004) was probably
violated (SOM, ‘‘Discussion’’ section). Strong intercorre-
lation, defined as r[ 0.5, following Freckleton (2002), was
found between shrub MDS1 and substrate PCA1
(r = -0.645) and between shrub MDS1 and shrub height
(r = -0.580). Therefore, physical vegetation and substrate
measures were considered separately from shrub compo-
sition data for analysis, resulting in four sets of environ-
mental models: (1) ‘Vegetation structure’: shrub
height ? substrate PCA1 ? substrate PCA2; (2) ‘Shrub
assemblage’: shrub assemblage; (3) ‘Shrub MDS’: shrub
MDS1 ? shrub MDS2; (4) ‘GLOBCOVER’ (four continu-
ous variables). All environmental models also considered
the effect of landscape rugosity and sheep density.
For model selection multi-model inference (MMI), an
information theoretic framework, was applied to each of
the four sets of candidate models, following Burnham and
Anderson (2002), using the ‘MuMIn’ package in R (Barton
2013). Model-averaged parameter estimates, their uncon-
ditional errors and the relative support for each variable
(relative variable importance [RVI], scale 0–1) were cal-
culated across the 95 % model confidence set. However,
variables which have no effect accumulate weight through
their presence in models that gain support by their inclu-
sion of important variables. Therefore, to assess the relative
importance of candidate predictors, we examined the 95 %
interval of RVI distribution of a simulated random null
variable (mean = 1, SD = 1) iterated across 1000 MMI
iterations, following Boughey et al. (2011). Candidate
J Ornithol
123

variables with an RVI beyond the 95 % null distribution
and with a model average coefficient 95 % confidence limit
(calculated from unconditional standard errors) not span-
ning zero were considered to have support (following
Boughey et al. 2011). All models were run in R 3.0.2 (R
Core Team 2013). Potential spatial autocorrelation in
model-averaged residuals was examined by Moran’s I in R
(Graf et al. 2005).
The mapped relative distribution predicted by MMI
species-habitat models was examined by overlaying a grid
(resolution 1836 m 9 1836 m, cell area = 3.371 km2) on
the study area, providing a grid cell area equal to that
encompassed by the estimated effective detection radius
(EDR; 1036 m) around point counts (see ‘‘Results’’).
Values of each variable were extracted from each cell and
numbers were predicted from the model-averaged 95 %
confidence subset of candidate GLMs for each model set.
Temporal transferability of models was examined by
repeating surveys twice at 140 of the points in 2014 and
inspecting the correlation (R2) between predicted (abun-
dance values extracted from grid cells intersecting point
count locations) and observed (maximum number of birds
per point count) abundance.
Results
During 2013, at point count locations (n = 231) 317
individuals or small groups of houbara were recorded,
comprising 321 adults and 15 juveniles. Of the adults that
could be sexed (n = 311, 98 %), 94 % were males;
females were substantially under-recorded as they are far
more cryptic than males in the breeding season, with many
incubating during the survey period (Burnside, unpublished
data). Observations of females were, therefore, excluded
and unsexed birds and males were pooled for subsequent
analysis, adjusting for the estimated proportion of males
among unsexed birds in density estimates.
Habitat gradients
A total of 65,939 shrubs were identified and measured
along 155.1 km of walked line intercepts at 817 sampling
locations (mean of 46.8 shrubs per composite sample,
SD = 34.2, range 0–233 shrubs). Mean shrub height varied
from over 45 cm in the west and south, mainly in Astra-
galus and Calligonum, to under 30 cm in Artemisia, Sal-
sola rigida and S. arbuscula assemblages (SOM, Fig. S2d).
The first substrate component (Substrate PC1) explained
59.2 % of the variance and represented a gradient from
greater cover of clay to greater cover of consolidated sand;
gravel and drifting sand had negligible loadings on this
component. The second component (Substrate PC2)
explained a further 20.4 % of the variance, with a gradient
from gravel (low values) to drifting sand (high values;
SOM, Fig. S3). Dominant substrate types differed between
shrub assemblages, with [50 % cover of clay in both
Artemisia and Salsola rigida,[75 % cover of consolidated
sand in Astragalus and the highest cover of drifting sand
(18 %) in Calligonum (SOM, Fig. S4).
Sheep density differed among shrub assemblages
(F4,761 = 32.5, p = 0.001, all pair-wise Tukey p\ 0.05),
being highest in Calligonum (mean 40.0 individuals
km-2 ± 2.1[SE]), similar between Astragalus and Arte-
misia (31.5 ± 1.5; 24.7 ± 2.2, Tukey p[ 0.05) and lowest
in Salsola arbuscula (19.4 ± 1.3) and S. rigida
(14.4 ± 1.5; SOM Fig. S2a), but variation within shrub
assemblages was high and overall variance explained by
shrub assemblage was low (GLM, R2 = 0.17), allowing
independent effects to be tested.
Detectability covariates and estimates of male
houbara density
In distance analysis of houbara observations, half-normal
functions with cosine adjustments provided the best fit,
with a mean EDR of 1036 m (95 % confidence interval
[CI]; 985–1091). A 400-m wide trough in radial distance
suggests that some houbara near to the observers either
crouched and remained undetected, or (more likely)
sneaked off and were subsequently detected when over
400 m away (Fig. 2). The best MCDS model included visit
(season effect) and time categorical (am/pm) covariates,
which improved the model fit (DAICc = -5.6) relative to
a null model. The three closest competing MCDS models
also included combinations of both season (visit or date)
and time of day (time categorical, or time ? time2) and
provided similar density estimates and CIs; these represent
Fig. 2 Probability of detection of male houbara on point counts,
based on the best MCDS model (including visit and time categorical
as detectability covariates), with half-normal detection function (with
cosine adjustment) fitted to visit-specific count data, truncated at
1400-m distance from the observer
J Ornithol
123
alternative formulation of the same detectability effects
(SOM, Table S1,A). Therefore visit and time categorical
were included in subsequent distance models of houbara
density and as fixed effects in all multivariate abundance-
habitat models. Three models that also incorporated shrub
height and wind were within two AICc units of the best
model but addition of these covariates to the best model did
not improve the model fit or alter the detection function
(maximum EDR change 1 m) or density estimate (SOM,
Table S1,B); thus, there is no evidence that they affected
detectability. As shrub height did not affect detectability it
was included as a candidate variable in subsequent multi-
variate models of habitat association.
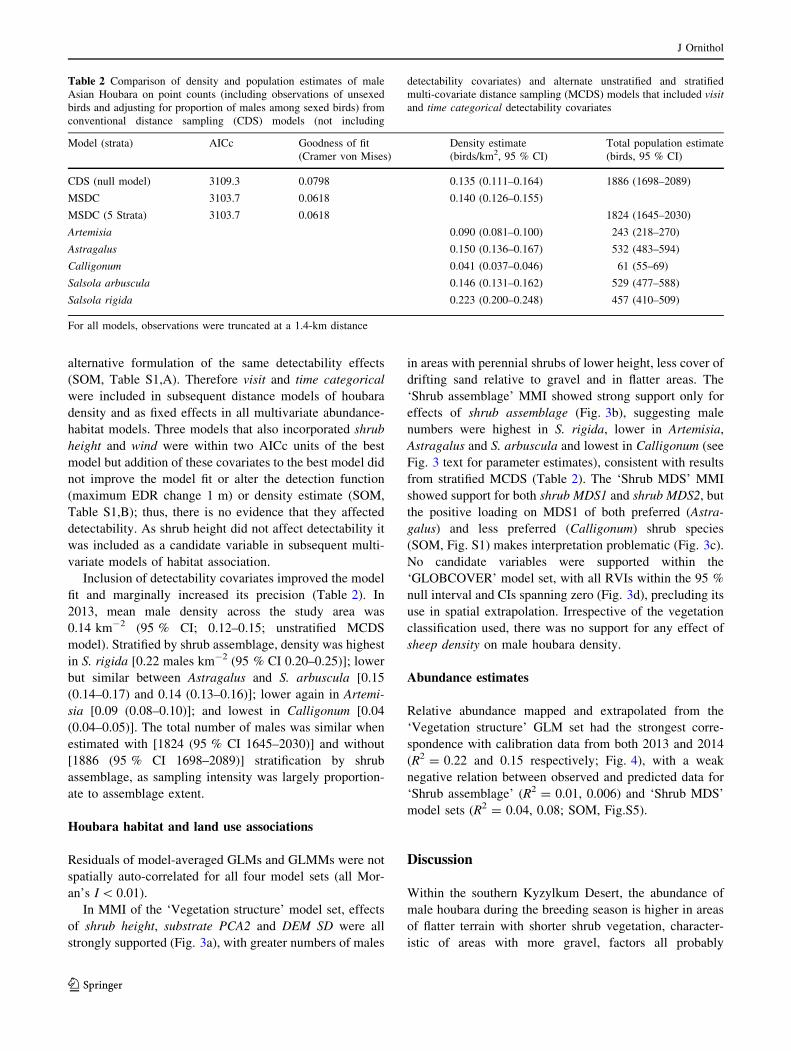
Inclusion of detectability covariates improved the model
fit and marginally increased its precision (Table 2). In
2013, mean male density across the study area was
0.14 km-2 (95 % CI; 0.12–0.15; unstratified MCDS
model). Stratified by shrub assemblage, density was highest
in S. rigida [0.22 males km-2 (95 % CI 0.20–0.25)]; lower
but similar between Astragalus and S. arbuscula [0.15
(0.14–0.17) and 0.14 (0.13–0.16)]; lower again in Artemi-
sia [0.09 (0.08–0.10)]; and lowest in Calligonum [0.04
(0.04–0.05)]. The total number of males was similar when
estimated with [1824 (95 % CI 1645–2030)] and without
[1886 (95 % CI 1698–2089)] stratification by shrub
assemblage, as sampling intensity was largely proportion-
ate to assemblage extent.
Houbara habitat and land use associations
Residuals of model-averaged GLMs and GLMMs were not
spatially auto-correlated for all four model sets (all Mor-
an’s I\ 0.01).
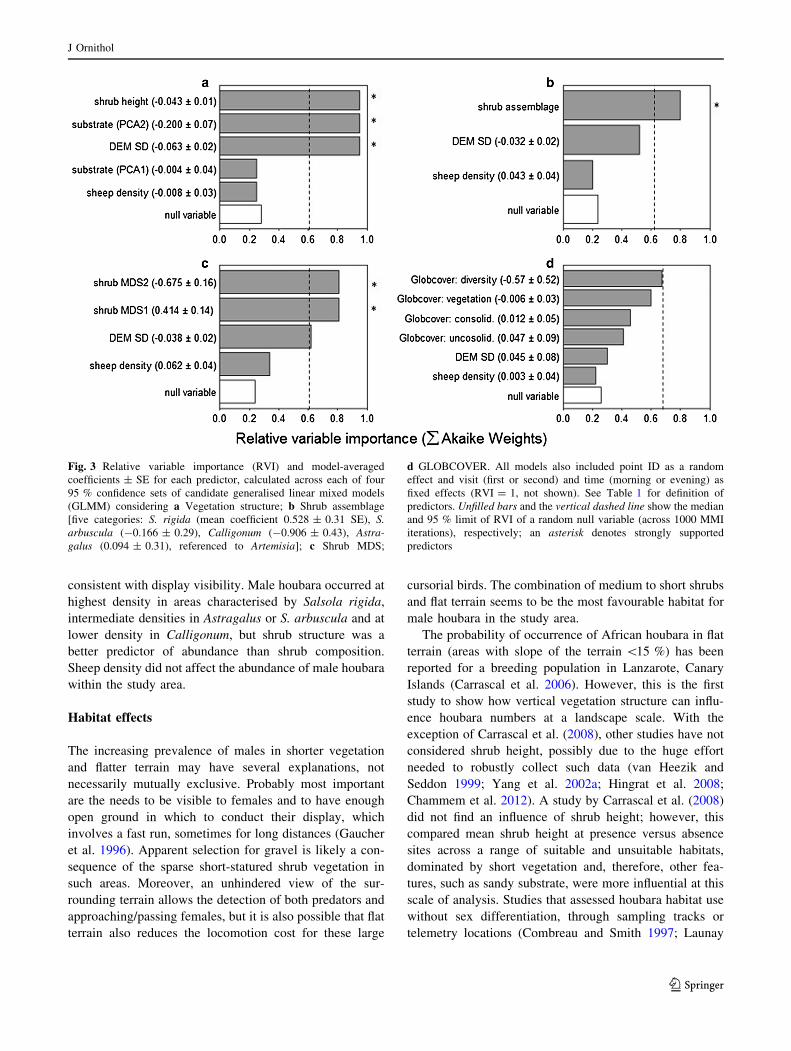
In MMI of the ‘Vegetation structure’ model set, effects
of shrub height, substrate PCA2 and DEM SD were all
strongly supported (Fig. 3a), with greater numbers of males
in areas with perennial shrubs of lower height, less cover of
drifting sand relative to gravel and in flatter areas. The
‘Shrub assemblage’ MMI showed strong support only for
effects of shrub assemblage (Fig. 3b), suggesting male
numbers were highest in S. rigida, lower in Artemisia,
Astragalus and S. arbuscula and lowest in Calligonum (see
Fig. 3 text for parameter estimates), consistent with results
from stratified MCDS (Table 2). The ‘Shrub MDS’ MMI
showed support for both shrub MDS1 and shrub MDS2, but
the positive loading on MDS1 of both preferred (Astra-
galus) and less preferred (Calligonum) shrub species
(SOM, Fig. S1) makes interpretation problematic (Fig. 3c).
No candidate variables were supported within the
‘GLOBCOVER’ model set, with all RVIs within the 95 %
null interval and CIs spanning zero (Fig. 3d), precluding its
use in spatial extrapolation. Irrespective of the vegetation
classification used, there was no support for any effect of
sheep density on male houbara density.
Abundance estimates
Relative abundance mapped and extrapolated from the
‘Vegetation structure’ GLM set had the strongest corre-
spondence with calibration data from both 2013 and 2014
(R2 = 0.22 and 0.15 respectively; Fig. 4), with a weak
negative relation between observed and predicted data for
‘Shrub assemblage’ (R2 = 0.01, 0.006) and ‘Shrub MDS’
model sets (R2 = 0.04, 0.08; SOM, Fig.S5).
Discussion
Within the southern Kyzylkum Desert, the abundance of
male houbara during the breeding season is higher in areas
of flatter terrain with shorter shrub vegetation, character-
istic of areas with more gravel, factors all probably
Table 2 Comparison of density and population estimates of male
Asian Houbara on point counts (including observations of unsexed
birds and adjusting for proportion of males among sexed birds) from
conventional distance sampling (CDS) models (not including
detectability covariates) and alternate unstratified and stratified
multi-covariate distance sampling (MCDS) models that included visit
and time categorical detectability covariates
Model (strata) AICc Goodness of fit
(Cramer von Mises)
Density estimate
(birds/km2, 95 % CI)
Total population estimate
(birds, 95 % CI)
CDS (null model) 3109.3 0.0798 0.135 (0.111–0.164) 1886 (1698–2089)
MSDC 3103.7 0.0618 0.140 (0.126–0.155)
MSDC (5 Strata) 3103.7 0.0618 1824 (1645–2030)
Artemisia 0.090 (0.081–0.100) 243 (218–270)
Astragalus 0.150 (0.136–0.167) 532 (483–594)
Calligonum 0.041 (0.037–0.046) 61 (55–69)
Salsola arbuscula 0.146 (0.131–0.162) 529 (477–588)
Salsola rigida 0.223 (0.200–0.248) 457 (410–509)
For all models, observations were truncated at a 1.4-km distance
J Ornithol
123
consistent with display visibility. Male houbara occurred at
highest density in areas characterised by Salsola rigida,
intermediate densities in Astragalus or S. arbuscula and at
lower density in Calligonum, but shrub structure was a
better predictor of abundance than shrub composition.
Sheep density did not affect the abundance of male houbara
within the study area.
Habitat effects
The increasing prevalence of males in shorter vegetation
and flatter terrain may have several explanations, not
necessarily mutually exclusive. Probably most important
are the needs to be visible to females and to have enough
open ground in which to conduct their display, which
involves a fast run, sometimes for long distances (Gaucher
et al. 1996). Apparent selection for gravel is likely a con-
sequence of the sparse short-statured shrub vegetation in
such areas. Moreover, an unhindered view of the sur-
rounding terrain allows the detection of both predators and
approaching/passing females, but it is also possible that flat
terrain also reduces the locomotion cost for these large
cursorial birds. The combination of medium to short shrubs
and flat terrain seems to be the most favourable habitat for
male houbara in the study area.
The probability of occurrence of African houbara in flat
terrain (areas with slope of the terrain \15 %) has been
reported for a breeding population in Lanzarote, Canary
Islands (Carrascal et al. 2006). However, this is the first
study to show how vertical vegetation structure can influ-
ence houbara numbers at a landscape scale. With the
exception of Carrascal et al. (2008), other studies have not
considered shrub height, possibly due to the huge effort
needed to robustly collect such data (van Heezik and
Seddon 1999; Yang et al. 2002a; Hingrat et al. 2008;
Chammem et al. 2012). A study by Carrascal et al. (2008)
did not find an influence of shrub height; however, this
compared mean shrub height at presence versus absence
sites across a range of suitable and unsuitable habitats,
dominated by short vegetation and, therefore, other fea-
tures, such as sandy substrate, were more influential at this
scale of analysis. Studies that assessed houbara habitat use
without sex differentiation, through sampling tracks or
telemetry locations (Combreau and Smith 1997; Launay
Fig. 3 Relative variable importance (RVI) and model-averaged
coefficients ± SE for each predictor, calculated across each of four
95 % confidence sets of candidate generalised linear mixed models
(GLMM) considering a Vegetation structure; b Shrub assemblage
[five categories: S. rigida (mean coefficient 0.528 ± 0.31 SE), S.
arbuscula (-0.166 ± 0.29), Calligonum (-0.906 ± 0.43), Astra-
galus (0.094 ± 0.31), referenced to Artemisia]; c Shrub MDS;
d GLOBCOVER. All models also included point ID as a random
effect and visit (first or second) and time (morning or evening) as
fixed effects (RVI = 1, not shown). See Table 1 for definition of
predictors. Unfilled bars and the vertical dashed line show the median
and 95 % limit of RVI of a random null variable (across 1000 MMI
iterations), respectively; an asterisk denotes strongly supported
predictors
J Ornithol
123

et al. 1997b), are not comparable to ours as habitat use is
expected to differ between males and females (Hingrat
et al. 2007).
Male houbara densities differed among the five shrub
assemblages. Sparse short halophytic vegetation dominated
by Salsola rigida supported the highest density (Table 2).
Lower densities (similar to each other) occurred in vege-
tation dominated by Astragalus villosissimus and Salsola
arbuscula. Owing to the large area they occupy
(=7682 km2), the latter two assemblages together hold over
50 % of all males estimated for the Bukhara study area.
Calligonum and Artemisia shrub assemblages supported
lower densities of male houbara. Calligonum comprises a
rich diversity of shrubs on drifting sand, including Cal-
ligonum sp., Convolvulus sp. and Astragalus villosissimus.
The main limiting factor for male houbara here is most
likely the mean height of vegetation ([0.5 m), which
presumably impairs visibility of their display. Artemisia
shrub assemblages (dominated by A. diffusa) prevail in the
most elevated parts of the study area, but, although plants
of this genus are palatable to houbara (Gubin 2004), they
are not thought to be preferred food during the breeding
season (J. Al-Khaili personal communication). Also, owing
to the uniform low height and, hence, poor concealment by
the vegetation, these areas might be less suitable for nest-
ing females. If the houbara ‘exploded lek’ system follows a
‘hotspot’ model (Beehler and Foster 1988; i.e. males lek
where females congregate for resources), it is possible that
lower suitability of both Calligonum and Artemisia
assemblages for breeding females may affect male densi-
ties. Both MDS predictors were supported, indicating that
density of male houbara was affected by shrub species
composition, but neither shrub assemblage nor MDS gave
as good an explanation of male distribution as shrub
structure. This suggests males primarily respond to shrub
structure, for which composition is a proxy, rather than to
systematic differences in resource availability among shrub
assemblages.
Land use effects
Our evidence that at landscape scales male houbara do not
avoid areas with greater sheep densities (highest mean per
point count [100 individuals km-2) confirms an earlier
Fig. 4 Distribution of male Asian Houbara density across the
Bukhara District in Uzbekistan predicted from the averaged ‘Vege-
tation structure’ MMI model set, overlaid with the observed
maximum numbers seen during point counts in 2013. R2 indicates
correspondence of predicted abundance with observed point count
maxima in the model calibration year (2013) and subsequent year
(2014)
J Ornithol
123
study (Koshkin et al. 2014) and agrees with findings on
African Houbara in Tunisia (Chammem et al. 2012) but not
from Morocco (Le Cuziat et al. 2005a, b). The discrepancy
with Morocco perhaps reflects differences between range-
land systems. In Morocco (Le Cuziat et al. 2005b) and in
Tunisia (Combreau personal communication), sheep and
goats grazed desert adjacent to wells all year round, thus
permanently affecting vegetation, whereas in the more
strongly seasonal pastoralism of Uzbekistan grazing is
predominantly confined to the spring and early summer
months. Such seasonal pastoralism, which is probably the
most important and widespread land use within the entire
range of the Asian Houbara, appears to have no negative
impact on either Chlamydotis species or their habitat
(Gamoun 2014; Koshkin et al. 2014), at least at the range
of sheep densities examined. However, caution is needed
on this issue, as disturbance of nesting females and inci-
dental nest destruction by livestock and egg-taking by
shepherds, together suggested to be the main threats for a
population in Israel (Lavee 1988), cannot be discounted.
Houbara population estimate
Our estimate of 0.14 male houbara km-2 (95 % CI
0.12–0.15) suggests 0.28 (0.24–0.30) adult houbara overall
for the study area in Uzbekistan, if an equal sex ratio can be
assumed (following Combreau et al. 2002). However,
comparison with densities estimated for other Asian Hou-
bara populations is problematic. Most recent studies used
driven transects (Tourenq et al. 2004, 2005; Gubin 2008;
Riou et al. 2011) and each had methodological drawbacks.
In Koshkin et al. (2014) point counts were found to per-
form better than transects, at least in the conditions of the
southern Kyzylkum. Gubin (2008) based multi-annual
estimates for several areas in south-western Kazakhstan on
numbers of individuals recorded along driven transects
within a 200-m survey strip (range of 0.01–0.24 birds/
km2); this may indicate relative abundance among areas,
but as detectability was unknown it is not possible to
account for undetected birds to estimate density. Although
Riou et al. (2011) and Tourenq et al. (2004, 2005) used
distance analysis, distance measurements were not taken
and the effective strip width (ESW) is not reported; also,
analysis pooled across regions with differing relative
abundance resulting in wide uncertainty, and timing and
sex composition are not reported. Although more females
are detected during driven transects (30 % of adult birds)
than on point counts (7 %; Koshkin et al. 2014), densities
estimated by Riou et al. (2011) and Tourenq et al. (2004,
2005) will have been underestimated to an unknown extent.
Depending on timing, estimates may lie somewhere
between an estimate of male numbers (comparable to our
male estimate) for survey during incubation (when females
are infrequently observed even on driven transects) to an
estimate comprising both males and females during brood
rearing/post-nesting, closer to, but still likely underesti-
mating, total numbers.
With these considerations, our estimate of male houbara
density appears substantially greater than breeding densities
observed in Oman [average across 3 years, 0.03 birds km-2
(inter-annual range 0.01–0.05 birds km-2); Tourenq et al.
(2005)] and in three regions of Kazakhstan, each averaged
across three 3-year periods (Riou et al. 2011): ‘Kyzylkum’,
0.05 birds km-2 (inter-period range 0.04–0.06); ‘Karakum’,
0.02 (0.01–0.02) and ‘North east’ 0.01 (0.008–0.02); but
comparable to densities in two other regions of Kazakhstan:
‘Betpak-Dala’ of 0.11 birds km-2 (inter-period range
0.06–0.15) and ‘Balkash’, 0.10 (0.06–0.15; Riou et al. 2011)
and in China [average across five years 0.12 birds km-2;
(inter-annual range 0.05–0.20); Tourenq et al. (2005)].
Analytical challenges
Inclusion of a random null variable following Boughey et al.
(2011) clarified the interpretation of variable importance in
cases when model selection ranked a variable high based on
the sum of AIC weights. We used GLMs to predict and map
abundances—an approach widely used and tested in eco-
logical studies (Segurado and Araujo 2004; Elith and Gra-
ham 2009; Oppel et al. 2012). Predictors within the
‘GLOBCOVER’ model set failed to explain abundance of
male houbara, probably owing to coarse resolution (approx.
700 m 9 900 m) and potential lower ability of the GLC
2000 dataset to meaningfully classify subtle differences
among desert vegetation and substrates. Thus, freely avail-
able data could not substitute for detailed field measure-
ments. A massive sampling effort was needed for the
extrapolation of field measurements of shrub height and
composition across the study area as well for the stratifica-
tion by shrub assemblages of distance estimates. This
enabled comparison of densities among plant assemblages,
but did not substantially improve precision of the overall
estimate, with 95 % CIs only 1.5 % narrower than those of
the unstratified pooled estimate (Table 2), presumably due
to proportionate sampling relative to assemblage extent.
Maps of houbara male abundance based on the three
remaining model sets showed different patterns, with
‘Vegetation structure’ giving the strongest agreement with
the validation set.
Conclusion
This study is an initial step towards an understanding of the
habitat requirements of and constraints on Asian Houbara
populations on their breeding grounds, and is the first time
J Ornithol
123

that abundance of the species has been linked to particular
plant assemblages. The more than two-fold difference in
density between Salsola- and Artemisia-dominated habi-
tats, and five-fold lower density in Calligonum habitats on
unconsolidated sands, show the risks of extrapolating
range-wide population estimates from local estimates of
density, without accounting for desert shrub/substrate
composition. Habitats selected by males are likely to
maximise the visibility and performance of their displays,
as in male Great Bustards Otis tarda (Moreira et al. 2004)
and male Bengal Floricans Houbaropsis bengalensis (Gray
et al. 2009). However, the possibility remains that lower
densities in some shrub assemblages reflect a lower suit-
ability of these habitats for females, and, thus, a reduced
attractiveness for males to congregate in such landscapes.
Further work is required to determine what conditions the
far more elusive females need for breeding, as their habitat
and landscape preferences may differ somewhat from those
of males (Hingrat et al. 2007), as in Bengal Florican (Gray
et al. 2009). The southern Kyzylkum Desert is increasingly
being targeted for energy (gas and oil) exploration (per-
sonal observation), and conservation biologists need a
robust evidence base to ensure the best management for
Uzbekistan’s houbaras as their habitat experiences disrup-
tions associated with economic development and infras-
tructural encroachment. As more information accumulates
it will become possible to prioritise particular habitats for
protection; evidence presented here suggests higher prior-
ity should be given to Salsola- and Astragalus-dominated
areas than to Calligonum habitats on unconsolidated sands.
Acknowledgments This study was funded by the Ahmed bin Zayed
Charitable Foundation, and permission to conduct it was given by the
State Committee for Nature Conservation of the Republic of
Uzbekistan. We thank Vladimir Terentyev, Lizzie Grayshon, Judit
Mateos, Sofie Forsstrom and Charlotte Packman for contributions to
data collection; Prof. Antonina Butnik and Dr. Toshpulot Rajabov for
validation of our identification of desert shrubs and Olivier Combreau
and an anonymous reviewer for helpful comments on an earlier
version of the paper.
Open Access This article is distributed under the terms of the
Creative Commons Attribution 4.0 International License (http://crea
tivecommons.org/licenses/by/4.0/), which permits unrestricted use,
distribution, and reproduction in any medium, provided you give
appropriate credit to the original author(s) and the source, provide a
link to the Creative Commons license, and indicate if changes were
made.
References
Aghainajafi-Zadeh S, Hemami MR, Karami M, Dolman PM (2010)
Wintering habitat use by houbara bustard (Chlamydotis mac-
queenii) in steppes of Harat, central Iran. J Arid Environ
74:912–917
Aghanajafizadeh S, Hemami MR, Naderi G, Heydari F (2012)
Estimation of Houbara Bustard, Chlamydotis macqueenii, pop-
ulation density in the central Iranian steppes. Zool Middle East
56:3–8
Bartholome E, Belward AS (2005) GLC2000: a new approach to
global land cover mapping from Earth observation data. Int J
Remote Sens 26:1959–1977
Barton K (2013) MuMIn: multi-model inference. R package version
1.15.1. http://cran.r-project.org/web/packages/MuMIn/index.
html
Beehler BM, Foster MS (1988) Hotshots, hotspots, and female
preference in the organization of lek mating systems. Am Nat
131:203–219
BirdLife International (2015) Species factsheet: Chlamydotis mac-
queenii. http://www.birdlife.org. Accessed on 31 July 2015
Boughey KL, Lake IR, Haysom KA, Dolman PM (2011) Effects of
landscape-scale broadleaved woodland configuration and extent
on roost location for six bat species across the UK. Biol Conserv
144:2300–2310
Buckland ST, Anderson DR, Burnham KP, Laake JL, Borchers DL,
Thomas L (2001) Introduction to distance sampling: estimating
abundance of biological populations. Oxford University Press,
Oxford
Burnham KP, Anderson DR (eds) (2002) Model selection and multi-
model inference. A practical information-theoretic approach.
Springer, New York
Carrascal LM, Seoane J, Palomino D, Alonso CL (2006) Habitat
preferences, population size and demographic trends of houbara
bustard Chlamydotis undulata in Lanzarote and La Graciosa
(Canary Islands). Ardeola 53:251–269
Carrascal LM, Palomino D, Seoane J, Alonso CL (2008) Habitat use and
population density of the houbara bustard Chlamydotis undulata in
Fuerteventura (Canary Islands). Afr J Ecol 46:291–302
Chammem M, Selmi S, Khorchani T, Nouira S (2012) Using a
capture-recapture approach for modelling the detectability and
distribution of houbara bustard in southern Tunisia. Bird
Conserv Int 22:288–298
Charge R, Sorci G, Saint Jalme M, Lesobre L, Hingrat Y, Lacroix F,
Teplitsky C (2014) Does recognized genetic management in
supportive breeding prevent genetic changes in life-history
traits? Evol Appl 7:521–532
Combreau O, Launay F (1996) Activity rhythms of houbara bustards
(Chlamydotis undulata macqueenii) in relation to some abiotic
factors. J Arid Environ 33:463–472
Combreau O, Smith TR (1997) Summer habitat selection by houbara
bustards introduced in central Saudi Arabia. J Arid Environ
36:149–160
Combreau O, Smith TR (1998) Release techniques and predation in
the introduction of Houbara bustards in Saudi Arabia. Biol
Conserv 84:147–155
Combreau O, Launay F, Lawrence M (2001) An assessment of annual
mortality rates in adult-sized migrant houbara bustards (Ch-
lamydotis undulata macqueenii). Anim Conserv 4:133–141
Combreau O, Qiao J, Lawrence M, Gao X, Yao J, Yang W, Launay F
(2002) Breeding success in a houbara bustard Chlamydotis
[undulata] macqueenii population on the eastern fringe of the
Jungar Basin, People’s Republic of China. Ibis 144:E45–E56
Elith J, Graham CH (2009) Do they? How do they? WHY do they
differ? On finding reasons for differing performances of species
distribution models. Ecography 32:66–77
Freckleton RP (2002) On the misuse of residuals in ecology:
regression of residuals vs. multiple regression. J Anim Ecol
71:542–545
Gamoun M (2014) Grazing intensity effects on the vegetation in
desert rangelands of Southern Tunisia. J Arid Land 6:324–333
J Ornithol
123
Gaucher P, Paillat P, Chappuis C, Saint Jalme M, Lotfikhah F, Wink
M (1996) Taxonomy of the houbara bustard Chlamydotis
undulata subspecies considered on the basis of sexual display
and genetic divergence. Ibis 138:273–282
Gintzburger G, Toderich KN, Mardonov BK, Mahmudov MM (2003)
Rangelands of the arid and semi-arid zones in Uzbekistan.
CIRAD, ICARDA, Paris
Goriup PD (1997) The world status of the houbara bustard
Chlamydotis undulata. Bird Conserv Int 7:373–397
Graf RF, Bollmann K, Suter W, Bugmann H (2005) The importance
of spatial scale in habitat models: capercaillie in the Swiss Alps.
Landsc Ecol 20:703–717
Gray TNE, Chamnan H, Collar NJ, Dolman PM (2009) Sex-specific
habitat use by a lekking bustard: conservation implications for
the critically endangered Bengal Florican (Houbaropsis ben-
galensis) in an intensifying agroecosystem. Auk 126:112–122
Gubin B (1992) Numbers, distribution and state of protection of the
houbara bustard in the south of Kazakhstan. Bustard Studies
5:98–103
Gubin BM (2004) Drofa-krasotka (Houbara Bustard). Kolor, Almaty
(in Russian)Gubin B (2008) Numbers and seasonal distribution of Asian houbara
(Chlamydotis undulata macqueenii) in Mangystau district
(Kazakhstan). In: Spitsina VV (ed) Bustards of the Palearctic:
breeding and conservation. Moscow, pp 108-129 (in Russian)Hingrat Y, Saint Jalme M, Ysnel F, Le Nuz E, Lacroix F (2007)
Habitat use and mating system of the houbara bustard (Chlamy-
dotis undulata undulata) in a semi-deserticarea of North Africa:
implications for conservation. J Ornithol 148:39–52
Hingrat Y, Saint Jalme M, Chalah T, Orhant N, Lacroix F (2008)
Environmental and social constraints on breeding site selection.
Does the exploded-lek and hotspot model apply to the houbara
bustard Chlamydotis undulata undulata? J Avian Biol 39:393–404
Hirzel AH, Lay GL (2008) Habitat suitability modelling and niche
theory. J Appl Ecol 45:1372–1381
Johnston A et al (2015) Modelling the abundance and distribution of
marine birds accounting for uncertain species identification.
J Appl Ecol 52:150–160
Koshkin MA, Collar NJ, Dolman PM (2014) Do sheep affect
distribution and habitat of Asian Houbara Chlamydotis mac-
queenii? J Arid Environ 103:53–62
Launay F, Loughland R, Mukhina EA (1997a) Preliminary observa-
tions of the incubation and covey behaviour of Houbara Bustard
Chlamydotis undulata macqueeni. Sandgrouse 19:51–55
Launay F, Roshier D, Loughland R, Aspinall SJ (1997b) Habitat use
by houbara bustard (Chlamydotis undulata macqueenii) in arid
shrubland in the United Arab Emirates. J Arid Environ
35:111–121
Lavee D (1988) Why is the houbara Chlamydotis undulata mac-
queenii still an endangered species in Israel? Biol Conserv
45:47–54
Le Cuziat J, Lacroix F, Roche P, Vidal E, Medail F, Orhant N,
Beranger PM (2005a) Landscape and human influences on the
distribution of the endangered North African houbara bustard
(Chlamydotis undulata undulata) in Eastern Morocco. Anim
Conserv 8:143–152
Le Cuziat J, Vidal E, Roche P, Lacroix F (2005b) Human activities
affect the potential distribution of the Houbara Bustard Chlamy-
dotis undulata undulata. Ardeola 52:21–30
NASA Ma (2011) ASTER Global Digital Elevation Model V2. The
Ministry of Economy, Trade and Industry (METI) of Japan and
the United States National Aeronautics and Space Administra-
tion (NASA)
Mitropolsky OV, Mukhina EA, Nazarov OP (1996) Houbara Bustard
Chlamydotis undulata\macqueenii in Uzbekistan. In: First
meeting of the IUCN SSC houbara bustard working group.
Muscat, Oman
Moreira F, Morgado R, Arthur S (2004) Great bustard Otis tarda
habitat selection in relation to agricultural use in southern
Portugal. Wildl Biol 10:251–260
Oppel S, Meirinho A, Ramırez I, Gardner B, O’Connell AF, Miller PI,
Louzao M (2012) Comparison of five modelling techniques to
predict the spatial distribution and abundance of seabirds. Biol
Conserv 156:94–104
Peterson AT (2006) Uses and requirements of ecological niche
models and related distributional models. Biodiversity Informat-
ics 3:59–77
R Core Team (2013) R: a language and environment for statistical
computing. R Foundation for Statistical Computing. http://www.
R-project.org/. Vienna, Austria
Rachkovskaya EI (1995) Vegetation map of Kazakhstan and Middle
Asia (Desert region). Russian Academy of Sciences, Saint
Petersburg
Renwick AR, Massimino D, Newson SE, Chamberlain DE, Pearce-
Higgins JW, Johnston A (2012) Modelling changes in species’
abundance in response to projected climate change. Divers
Distrib 18:121–132
Riou S, Judas J, Lawrence M, Pole S, Combreau O (2011) A 10-year
assessment of Asian Houbara Bustard populations: trends in
Kazakhstan reveal important regional differences. Bird Conserv
Int 21:134–141
Royle JA (2004) N-mixture models for estimating population size
from spatially replicated counts. Biometrics 60:108–115
Seddon PJ, Saint Jalme M, van Heezik Y, Paillat P, Gaucher P,
Combreau O (1995) Restoration of houbara bustard populations
in Saudi Arabia: developments and future directions. Oryx
29:136–142
Segurado P, Araujo MB (2004) An evaluation of methods for
modelling species distributions. J Biogeogr 31:1555–1568
Simpson EH (1949) Measurement of diversity. Nature 163:688
Tourenq C, Combreau O, Pole SB, Lawrence M, Ageyev VS, Karpov
AA, Launay F (2004) Monitoring of Asian houbara bustard
Chlamydotis macqueenii populations in Kazakhstan reveals
dramatic decline. Oryx 38:62–67
Tourenq C et al (2005) Alarming houbara bustard population trends in
Asia. Biol Conserv 121:1–8
van Heezik Y, Seddon PJ (1999) Seasonal changes in habitat use by
houbara bustards Chlamydotis undulata macqueenii in northern
Saudi Arabia. Ibis 141:208–215
Waber K, Spencer J, Dolman PM (2013) Achieving landscape-scale
deer management for biodiversity conservation: the need to
consider sources and sinks. J Wildl Manage 77:726–736
Yang WK, Qiao JF, Combreau O, Gao XY, Zhong WQ (2002a)
Display-sites selection by houbara bustard (Chlamydotis undu-
lata macqueenii) in Mori, Xinjiang, People’s Republic of China.
J Arid Environ 51:625–631
Yang WK, Qiao JF, Combreau O, Yao J, Gao XY, Zhong WQ
(2002b) Breeding habitat selection by houbara bustard (Chlamy-
dotis undulata macqueenii) in Mori, Xinjiang, China. Sci China
Ser D Earth Sci 45:1–10
J Ornithol
123