Spatialized Vibrotactile Feedback Improves Goal-Directed ...

EFFECTS OF GOAL SETTING, E-MAIL FEEDBACK AND
GRAPHIC FEEDBACK ON THE PRODUCTIVITY OF
PUBLIC SCHOOL ATTENDANCE CLERKS
Robin D. Rexroat, B. S.
Thesis Prepared for the Degree of
MASTER OF SCIENCE
UNIVERSITY OF NORTH TEXAS
August 2000
APPROVED:
Janet Ellis, Major ProfessorJoel Greenspoon, Committee MemberCloyd Hyten, Committee MemberSigrid Glenn, Chair of the Department of Behavior
AnalysisDavid W. Hartman, Dean of the School of
Community ServiceC. Neal Tate, Dean of the Robert B. Toulouse
School of Graduate Studies

Rexroat, Robin D., Effects of goal setting, e-mail feedback and graphic feedback
on the productivity of public school attendance clerks. Master of Science (Behavior
Analysis), August 2000, 46 pp., 3 tables, 3 illustrations, references, 33 titles.
A package intervention, consisting of daily-adjusted goal setting, e-mail feedback,
and graphic feedback, was used in a public school attendance office to increase the
efficiency with which 3 attendance clerks documented student attendance. During the
intervention phase, the attendance secretary set a daily goal for each attendance clerk.
This goal was a percentage of student absences to be coded and entered in the school
computer program. After establishing a daily goal, the attendance secretary provided
daily feedback, in the form of a written e-mail response and graphed feedback to each
clerk. If the subjects had attained their daily goal, the attendance secretary also delivered
a praise statement along with the e-mail feedback. Results indicated that the intervention
package was ineffective in producing change in the attendance clerks� absence coding
behavior.

2

ii
ACKNOWLEDGEMENTS
I would like to thank the attendance staff at Colleyville Heritage High School for
their willingness to participate in this study. I also thank my Thesis Chair Dr. Janet Ellis
for her support and guidance throughout my years at UNT. Thanks also to my committee
members Drs. Joel Greenspoon and Cloyd Hyten for their input and direction regarding
this thesis.
iii
TABLE OF CONTENTS
Page
LIST OF TABLES…………………………………………………………………...……v
LIST OF ILLUSTRATIONS………………………………………………………..……vi
INTRODUCTION…………………………………………………………….…..1
Feedback as a Behavior Change MechanismFunctions of FeedbackFeedback Delivery Dimensions
Feedback SourcePrivate versus PublicWritten, Verbal and Graphic FeedbackFrequency of Feedback DeliveryFeedback Content
Goal DifficultyTask ComplexityGoal Intensity
Goal SpecificityGoal Acceptance and Goal SourcePackage Intervention
METHOD………………………………………………………………………..14
SubjectsSetting and EquipmentDependent VariableIndependent Variable
Daily-adjusted Goal SettingWritten E-mail Feedback/PraiseGraphic Feedback
Experimental DesignProcedures
RESULTS………………………………………………….…………………….22
iv
Page
DISCUSSION……………………………………………………….…….……..24
Recommendation for Future StudiesTask SimplificationModeling Previous ResearchMotivational VariablesComponent Analysis
APPENDICES………………………………………………………………….………..34
REFERENCES………………………………………………………………….……….42

v
LIST OF TABLES
Table 1 Page
Fabricated Sample of ATT.515D………………………………………………………35
Table 2
Baseline/Intervention Median Comparison among Subjects…………..……………….36
Table 3
Number of Goal Attainment per Subject per Phase……………………………………37

vi
LIST OF FIGURES
Figure1. Page
Percent of coded absences per day for Subject 1………………………………………39
Figure 2.
Percent of coded absences per day for Subject 2………………………………………40
Figure 3.
Percent of coded absences per day for Subject 3………………………………………41

1
INTRODUCTION
Although there has been considerable behavior analytic research regarding
behavior change in public school classrooms, little has been done to address improving
other operations within a public school system (Cooper, Thomson, & Baer, 1970;
Cossairt, Hall, & Hopkins, 1973; Drabman & Lahey, 1974; Fink & Carnine, 1975; Gillat
& Sulzer-Azaroff, 1994; Harris, Bushell, Sherman, & Kane, 1975; Ingham & Greer,
1992; Van Houten, Hill, & Parsons, 1975; Witt, Noell, LaFleur, & Mortenson, 1997). In
a review of literature, only two studies conducted by Wilk and Redmon (1990; 1998)
address the operation of a non-instructional unit involving support staff within an
academic setting. The Wilk and Redmon articles examined the effects of feedback on the
performance of admissions staff in a university setting.
Accurate documentation of attendance in a public school system is important for
many reasons. First, a public school district receives funding from federal, state and local
funding sources based upon the district’s average daily attendance (ADA) (Texas
Education Agency [TEA], 1998). Each campus within the district is allocated a
percentage of federal and state funds based upon their specific campus ADA. For
example, in 1998, one specific district in Texas received 1% federal funds, 5% state funds
and 94% local funds per student (TEA, 1998). Second, the campus attendance is also
used in the TEA’s Academic Excellence Indicator System (AEIS). The AEIS, developed
in 1991, serves as the “report card” for each of the public school districts in the state of

2
Texas and is disseminated to all households within a district (TEA, 1999). There are 6
AEIS performance indicators used to determine campus and district ratings. All public
school districts in Texas, as well as each campus within a district may receive an
exemplary, recognized or low performing rating. Of these 6 AEIS performance
indicators, 3 are related to attendance. Specifically, in order for a campus to receive an
exemplary rating (the highest rating attainable) the campus attendance cannot be below
94 %, the dropout rate cannot be above 1 % and the graduation (completion) rate must be
within a specific range.
Student attendance can affect both the campus dropout rate and graduation rate.
For example, if a student has 20 consecutive absences that person is withdrawn from
school, identified as a dropout and factored into the district and campus dropout rates.
Regarding the graduation rate, it is state law that a student attend 90% of the time their
class is offered to receive credit for that particular class (TEA, 1999). If a student has
more than 5 absences in any one class, they lose credit for that class regardless of their
academic performance. This loss of credit prevents students from completing their
required classes for graduation, thus affecting the district and campus graduation rates. If
the school is to receive appropriate funding and an acceptable rating from TEA, it is
imperative that the attendance office operate as efficiently and accurately as possible
documenting student attendance.
Feedback As A Behavior Change Mechanism
The Wilk and Redmon (1990; 1998) articles served as the model for this study.
Their intervention package, utilizing supervisory-delivered verbal and graphic feedback,

3
along with daily-adjusted goal setting, was implemented in a university admissions office.
An intervention package similar to theirs was selected as the independent variable in the
present study.
Wilk and Redmon (1998) reported that, “the most common OBM (Organizational
Behavior Management) interventions consist of performance feedback alone and goal
setting combined with performance feedback” (p.47). Generally, feedback has proven to
be an effective way to modify individual behavior in a number of settings (Balcazar,
Hopkins & Suarez 1985-86; Brown, Willis & Reid, 1981; Erez, 1977; Fox & Sulzer-
Azaroff, 1989; Hawkins, Burgio, Langford & Engel, 1992; Ilgen & Moore, 1987; Kim &
Hamner, 1976; Komaki, Collins & Penn, 1982; Prue & Fairbank, 1981; Wilk & Redmon,
1990; Wilk & Redmon, 1998). However, Brown et al. (1981) discovered that the
definition of “feedback” differed greatly across a number of research articles and that
many feedback studies failed to analyze the specific components that create a feedback
system. Feedback can be very complex, depending on the number of dimensions that are
included in its definition. The source, delivery mechanism, content, recipient and
delivery frequency of feedback can vary in a number of ways (Balcazar et al., 1985-86;
Prue & Fairbank, 1981). To accurately replicate a study and be able to identify the
elements comprising the feedback package, it is important to address and delineate each
of the feedback components.
Functions of Feedback
Balcazar et al. (1985-86) stated that feedback may function as an antecedent
stimulus or a consequence. They recommended that feedback be paired with a

4
generalized reinforcer (e.g., money) if it is to improve performance. Other researchers
also noted that feedback could serve as an antecedent or as a consequence (Fox & Sulzer-
Azaroff, 1989; Ilgen & Moore, 1987; Prue & Fairbank, 1981). These studies agreed that
the outcome of the intervention is ultimately a function of the organization’s history with
feedback interventions.
Feedback Delivery Dimensions
Feedback sources. Many researchers have tried to pinpoint the variables that
enable feedback to be most effective in producing behavior change (Balcazar et al., 1985-
86; Chhokar & Wallin, 1984; Fox & Sulzar-Azaroff, 1989; Kim & Hamner, 1976; Prue &
Fairbank, 1981; Wilk & Redmon, 1990; Wilk & Redmon, 1998). Concerning the source
of feedback, it has been documented that supervisory-delivered feedback offers more
consistent performance improvements than do other sources (i.e., peer- or self-generated)
(Balcazar et al., 1985-86; Gillat & Sulzer-Azaroff, 1994; Hawkins et al., 1992; Kim &
Hamner, 1976; Komaki et al., 1982; Wilk & Redmon, 1990). Gillat and Sulzer-Azaroff
(1989), Kim and Hamner (1976) and Locke et al. (1981) determined that supervisory
feedback was generally more effective, possibly due to the fact that not only do
supervisors deliver reinforcers or punishers, but also may control back-up reinforcers.
However, Fox and Sulzer-Azaroff (1989) reported that written feedback delivered by a
supervisor or non-supervisor was equally effective at producing a behavior change.
Private versus public feedback. Feedback delivery can also vary along other
dimensions: private versus public. Balcazar et al.’s (1985-86) review of feedback
literature indicated no documented differences between feedback when it was deliver

5
publicly or privately. Prue and Fairbank (1981), however, reported that private feedback
could eliminate the competitive or aversive effects of public feedback. Another aspect to
consider is that feedback delivered privately may not remain private if the recipients share
close relationships with one another or are in close physical proximity to others. Wilk
and Redmon (1990) used private verbal feedback in their study and found their subjects
open to sharing information concerning the feedback they received. The authors noted
that often the subjects congratulated each other after receiving supervisory feedback.
Written, verbal and graphic feedback. Feedback delivered in writing, verbally or
graphically has also produced differing results. Fox and Sulzer-Azaroff (1989) found that
written feedback was effective in improving their subjects’ performance, while Brown et
al. (1981) said verbal feedback reduced subjects’ off-task behaviors. Wilk and Redmon
(1990; 1998) also found that verbal feedback, when paired with goal-setting, improved
employee performance. However, in their 1998 article, Wilk and Redmon found that
graphic feedback produced a greater improvement in employee performance than verbal
feedback. Balcazar et al.’s (1985-86) review of the feedback literature also supports this
finding.
Frequency of feedback delivery. Balcazar et al. (1985-86) also reports that
although more researchers provided feedback to their subjects on a daily basis, there
appears to be no difference in performance when feedback is delivered daily or weekly.
Prue and Fairbank support this finding , but added that latency may be a factor when
shaping new behaviors. Chokkar and Wallin (1984) specifically examined the effects of

6
the frequency of feedback delivery on performance. They found that feedback delivered
daily or weekly produced the same effects.
Feedback content. The content of the feedback provided may also impact
performance. Feedback that is specific, quantitative, accurate and relevant to the target
behavior is most effective in producing behavior change (Balcazar et al., 1985-86, Fox &
Sulzer-Azaroff, 1989; Prue & Fairbank, 1981). Kim and Hamner (1976) noted that
feedback should be evaluative and descriptive. They stated that goals paired with
feedback that possessed these two characteristics were seen by subjects as more
reasonable and attainable. Just as there are several dimensions that appear to determine
the effectiveness of feedback (as an intervention), there are also components in goal
setting that can determine its usefulness as a motivational variable.
Concerning the use of goal setting in organizational behavior management
interventions, researchers indicate that while goals were effective in producing a change
in an individual’s behavior, the goals were more effective if paired with feedback
(Balcazar et al., 1985-86; Calpin, Edelstein & Redmon, 1988; Chhokar & Wallin, 1884;
Erez, 1977; Fellner & Sulzer-Azaroff, 1984; Fox & Sulzer-Azaroff, 1989; Gillat &
Sulzer-Azaroff, 1994; Kim & Hamner, 1976; Komaki et al., 1982; Locke, Shaw, Saari &
Latham, 1981; Mento, Steel, & Karren, 1987; Tubbs, 1986; Wilk & Redmon, 1990; Wilk
& Redmon, 1998). Applied psychology and behavioral sports literature have identified
and researched many parameters that should be considered to ensure that goal setting will
be effectively implemented (Burton, 1989; Fellner & Sulzer-Azaroff, 1984; Kim &
Hamner, 1976; Locke et al., 1981; Weinberg, Bruya, Garland & Jackson, 1990; Wood et

7
al., 1987). These parameters include goal difficulty (involving task complexity and
intensity), goal specificity, goal acceptance and goal source.
Goal Difficulty
Locke et al. (1981) identified and defined various components of goal setting.
They noted that difficulty in meeting a goal may be attributed to task complexity (i.e.,
skills required to accomplish it) or task intensity (i.e., effort required to perform the task).
Often in goal setting literature, the terms “task complexity”, “goal difficulty” and “goal
intensity” were used interchangeably; however, some researchers (Anshel et al., 1992;
Wood et al., 1987) differentiated between them.
Task complexity. Wood et al. (1987) conducted a meta-analysis examining
complex versus simple tasks involved in goal achievement. These authors labeled three
possible components involved in complex tasks: “1) component complexity - the number
of acts and information cues involved, 2) coordinative complexity - type and number of
relationships among acts and cues, and 3) dynamic complexity - changes in acts and cues
and the relationships among them” (p. 418). They indicated that task complexity was a
factor in goal attainment. The more complex the task, the less likely subjects are to attain
their goal. Burton (1989) also documented that the effects of goal setting were influenced
by complex tasks, but added that given ample time, subjects were able to achieve a goal
comprised of complex tasks because they were able to develop a strategy that allowed
them to succeed. Anshel et al.’s (1992) findings supported Burton’s research. In Anshel
et al. subjects repeatedly performed both simple and complex tasks; over a period of time
the differences in goal achievement between the two levels of complex tasks diminished.
8
One problem that researcher have failed to address in the literature concerning task
complexity is the difficulty in measuring what constitutes a complex task. In the Wood et
al. (1987) meta-analysis of task complexity, the researchers themselves rated the
complexity of tasks on a ten point scale using the three aspects of complexity they
identified - component, coodinative and dynamic complexity. This measure of task
complexity appears to be subjective. Presently, there is no metric to measure the
complexity or simplicity of a task.
Goal intensity. Locke et al. (1981) stated that a goal may be identified as intense
for two primary reasons. First, a goal could require that the subject achieve a certain skill
level. Secondly, amount of effort to be expended may make the goal more difficult to
attain. Researchers examining goal difficulty suggested that difficult goals do result in an
increase in subjects’ performance if subjects receive feedback on the relationship between
their performance and the goal (Anshel et al., 1992; Erez, 1977; Fellner & Sulzer-
Azaroff, 1984; Gillat & Sulzer-Azaroff, 1994; Kim & Hamner, 1976; Locke et al., 1981;
Tubbs, 1986). Although research supports the claim that difficult or challenging goals
produce increases in individual performance, Calpin et al. (1988) and Locke et al. (1981)
warn that if goals are too difficult subjects may abandon them.
Goal Specificity
Other researchers reported that specificity of a goal also impacts success in
reaching that goal. Subjects who were given specific goals, as opposed to being told, “Do
your best,” produced significant changes in their behavior (Burton, 1989; Calpin et al.,
1988; Fellner & Sulzer-Azaroff, 1984; Locke et al., 1981). Weinberg et al.’s (1990)

9
results challenged this finding. They reported that subjects given specific goals did not
perform better than did subjects with no goals or “do-your-best” goals. However, Burton
stated, “Specific goals enhanced performance more than general goals for low- but not for
high-complexity tasks” (p.43). Wood et al. (1987) also supported this claim.
Goal Acceptance and Goal Source
There has also been research examining the effects of self-generated goals versus
supervisory-imposed goals and the acceptance of these goals (Anshel et al., 1992; Calpin
et al., 1988; Erez, 1977; Fellner & Sulzer-Azaroff, 1984; Locke et al., 1981). Their
research has reported conflicting findings. Calpin et al. (1988) suggested that supervisor-
established goals may be effective due to the worker’s reinforcement or punishment
history paired with supervisor-delivered goals. In Anshel et al.’s (1992) study, 91% of
the subjects participating accepted their externally imposed (supervisory) goals and
increased their performance. Erez (1977) and Locke et al. (1981) addressed self-set and
participatively set goals, respectively. Both researchers noted that if the subject is
involved in establishing the goals, there is a greater probability the goals will be accepted
and successfully attained. Therefore, what procedure may be most effective in facilitating
goal acceptance is unclear. Supervisory-imposed or self-generated goals are equally
effective in gaining worker acceptance and producing a change in behavior.
Package Interventions
Several research articles cited in this study used package interventions as their
independent variable (Brown et al., 1981; Calpin et al., 1988; Chhokar & Wallin, 1984;
Gillat & Sulzer-Azaroff, 1994; Kim & Hamner, 1976; Wilk & Redmon, 1990; Wilk &

10
Redmon, 1998). Chhokar and Wallin (1984) used a package intervention that included
employee training, graphic feedback and goal setting to improve employee safety
performance. Specifically, they were examining the effects of the frequency of feedback
on employee performance, comparing weekly graphic feedback to graphic feedback
delivered once every 2 weeks. These researchers found that the employees were
successful at reaching their goal only after graphic feedback was provided along with
training and goal setting, regardless of how often it was delivered. These authors noted a
14% improvement in employee performance after implementing the three-component
package, as opposed to training and goal-setting alone.
Gillat and Sulzer-Azaroff (1994) used a package feedback intervention as their
independent variable in an academic setting. Their package consisted of goal-setting,
supervisory verbal feedback and supervisory verbal and nonverbal praise. These authors
trained school principals to deliver this package intervention. Once trained, these
principals were responsible for entering the classroom and implementing the multiple-
component intervention with both teachers and students. The second experiment in this
study involved the teacher implementing the package with students. In both experiments,
implementation of the package increased teachers’ classroom performance and students’
reading behavior.
Kim and Hamner (1976) were interested in studying whether behavior change
resulting from a goal-setting intervention could be further enhanced by adding feedback
and/or praise. Subjects were given weekly goals and weekly feedback. Although they
found goal setting improved behavior, the greatest improvements in employee behavior
11
occurred when subjects received a supervisor-determined goal, accompanied by
supervisory verbal feedback and praise.
Calpin et al. (1988) examined the effects of self-monitoring feedback and goal
setting with staff in a mental health facility. Their initial intervention involved subjects
utilizing weekly self-monitoring as their method of feedback. The second intervention
added goal setting to the self-monitoring component. Their findings supported a multiple
component approach in that a package consisting of feedback and goal setting produced a
greater behavior change than did self-monitoring alone. However, they noted that when
added to the self-monitoring feedback component, goal setting produced only a slight
increase over self-monitoring alone.
Brown et al. (1981) looked at the differences between supervisory verbal feedback
and supervisory verbal feedback plus (supervisor) praise. The feedback was delivered
immediately after a time sample interval. The researchers found that while the verbal
feedback decreased subjects’ off-task behaviors, there was no increase in their
performance. When praise was added to the feedback package, off-task behavior
decreased and performance increased.
Wilk and Redmon (1990) used a package intervention involving daily-adjusted
goal setting and supervisory verbal feedback (praise). This intervention was implemented
with 3 subjects in a multiple baseline design. The dependent variable was the total
number of tasks completed/day and recorded by the subject. A weekly reliability check
was conducted on the self-recorded data.

12
Daily-adjusted goal setting involved the supervisor meeting with the subject in the
morning and presenting a specific goal for the day. This goal was determined by the
supervisor, based on the subject’s previous day’s performance and the needs of the office.
If the subject met the daily goal, the goal remained the same the following day. The
supervisor increased the goal after it had been met for 2 consecutive days. This delay in
raising a subject’s attained goal was established to prevent the supervisor from
unintentionally punishing the subject’s goal-meeting behavior. Feedback in this package
was provided by the supervisor and consisted of praise if the subject met the goal or was
“close” to meeting the goal from the following day; however prompting and guidance
occurred if the subject failed to meet the goal. This feedback was provided twice daily-
morning and afternoon.
Wilk and Redmon found that each subject’s behavior significantly increased when
the feedback package was implemented. They did note two possible confounds. First, the
subject’s self-recorded data also served as self-generated feedback and could have
inflated their performance. The researchers noted that this alone could have produced an
increase in their behavior. Secondly, the subjects’ close proximity to each other plus their
social interactions could have served to create a competitive environment, thus
accounting for an increase in performance.
In Wilk and Redmon’s 1998 article, the initial intervention was the same as
described above - daily-adjusted goal setting paired with supervisory-delivered verbal
feedback/praise. However, the authors added supervisory-delivered graphic feedback in
their final intervention phase. Adding the graphic feedback produced even greater results
13
than did the goal setting/feedback/praise package. However, again the self-recording of
data and the close proximity of the subjects could have functioned as a confound. Also
noted in this study, was the need for future research to assess the effects of feedback on
both complex and simple tasks.
Based on the literature presented above, this study will implement a supervisor
delivered package intervention consisting of computer-generated daily-adjusted goal
setting, and e-mail feedback/praise statements, plus daily graphed feedback. The purpose
of this study is to examine the effects of this multiple component feedback package on the
absence coding behavior of three public high school attendance office clerks. Goal
setting has been reported to be most effective when paired with feedback. Within the
feedback literature, graphic supervisory feedback has produced the greatest results.
Therefore, it is feasible to hypothesize that a package consisting of these components
could be effective in producing a significant change in subjects’ behavior.

14
METHOD
Subjects
The subjects were 3 full-time, female, public high school attendance clerks. All
had been employed on the campus for over 1 year (Subject 1 for 4 years, Subject 2, 1.3
years, Subject 3, 3 years). Attendance clerks were supervised by a campus attendance
secretary. This attendance secretary had been in her position for 5 years and prior to this
position had been employed as a campus attendance clerk for 3 months.
Setting and Equipment
The attendance office, located in the main corridor of the school, was a large room
with four open windows facing onto the main corridor. A large roll-up door covered the
four windows during non-school hours (before 8:00 a.m. and after 4:00 p.m.). One
attendance clerk was stationed at each window, with the fourth window serving as the
Tardy Center. Each clerk had her own computer, telephone and general office supplies.
Other equipment used by the attendance clerks included an automated call home system
(Phonemaster®) and a Scantron® reader. Their supervisor (the attendance secretary)
worked at a desk in the attendance office and was positioned so that she could monitor
the clerks and serve as a backup clerk, if necessary.
Dependent Variable
The percent of coded computer data entries for students absent an entire day or
any part of the day was the dependent variable. Data were presented in percent form due

15
to the variation in number of students absent each day. Students with absences coded
truant (TR), unexcused absence (UA) or absent (A) were counted as unacceptable
because these absence codes indicate that the student was unaccounted for during that
absence. During each class period, classroom teachers took daily attendance on a
computer Scantron® form and these Scantron® forms were used to produce a report
(ATT.515D) that documented student attendance. For each absence indicated on the
report, an attendance clerk entered a code in the computer indicating the reason for that
student’s absence. For example, if a student was leaving second period for a doctor’s
visit, the student went to the attendance office and signed out. That student’s absence
was then coded ID (Ill Doctor). When the student returned with a doctor’s note the
absence code was changed to DN (Doctor’s Note). If a student were home ill the entire
day and the parent had contacted the school to inform the attendance staff of the absence,
the attendance clerk would code the absence PC (parent call) for that particular day.
Coding is critical because reimbursement for the ADA is based on these codes. There are
37 absence codes recognized by TEA, and according to TEA policy, the only excused or
allowed off-campus absences are absences covered by a doctor’s note (DN), absences due
to religious holidays (RH), and/or student field trips (FT). Excused/allowed absences are
not factored into the ADA percentage.
If a student leaves the campus without signing out, the clerk is alerted to that
student’s absence through the attendance report (ATT.510) generated by the attendance
Scantron® form (completed by the teacher). The clerk is then responsible for contacting
parents, teachers or the student, to explain the absence. If a teacher has marked a student

16
absent and there is no documentation (e.g., field trip list, teacher note, doctor note, etc.) or
parent phone call to explain that absence, the student’s absence is coded TR (truant) or
UA (unexcused absence) or A (absent).
Anytime a student has an absence coded TR, UA or A the attendance clerk
attempts to provide an acceptable code (i.e., DN, RH, FT) in one of several ways: 1)
contacting the student’s parents personally by telephone or 2) if unable to reach a parent,
using an automated telephone system (Phone Master®) that dialed the student’s home
phone number and left an automated message informing the parent of the absence and
requested an explanation, 3) contacting the teacher to ensure there was no error on the
Scantron® form, or 4) checking teachers’ notes sent to the office reporting that the
student was with another teacher. Accurately coding absences is a very complex task and
requires considerable time and effort because if 1) or 2) do not explain the absence, then
3) and/or 4) are implemented.
Independent Variable
A feedback package consisting of computer-delivered daily-adjusted goal setting,
written e-mail containing feedback/praise and hand-graphed feedback delivered by the
attendance secretary to the attendance clerks comprised the independent variable. I
reported each attendance clerk’s goal, the percentage of absences and the new or same
goal to the attendance secretary each afternoon and the attendance secretary transmitted
these data to the clerks the following day.
Daily-adjusted goal setting. Goals set as a percentage were based on average
percent of computer entries completed/clerk during the initial baseline phase. For

17
example, an attendance clerk made a computer entry for each student marked absent on
the Scantron® by a teacher. This goal was computed based on number of computer
entries required and actual number completed (not including unacceptable codes: TR’s,
UA’s or A’s). When average number of computer entries during baseline had been
calculated, 10 % was added to the average and served as the initial intervention goal.
Goals were delivered via e-mail each morning. The daily goal was to be increased by 2%
after a clerk had met her goal for 4 consecutive days.
Written e-mail feedback/praise. The supervisor provided a written e-mail
message each morning stating the previous day’s goal, the percent of coded absences
achieved and provided the new or same goal for that day. If the clerk met or exceeded her
daily goal, the attendance secretary praised the work performance of the clerk via e-mail.
The attendance secretary selected praise statements from a worksheet titled, “One
Hundred Ways To Praise.” Praise included such statements as, “You did a terrific job.”
“Great work.”, or “Good job keeping up with all your work yesterday.” The written e-
mail was delivered each morning by the attendance secretary. A typical e-mail message
would read, “Your goal yesterday was 67%. Yesterday your computer entries were at
72.5%. That’s great! Today your goal is 67%.”
If the clerk failed to meet her stated goal, the attendance secretary e-mailed the
clerk with the stated goal for that day, the actual percentage achieved and restated the
same goal from the previous day. No qualifying statement was made concerning the
clerk’s performance (no praise). The e-mail system provided documentation as to when
the supervisor delivered the feedback and when the clerk received it; e-mail feedback

18
appeared to be most feasible in this work setting due to the shared office space and close
proximity of the clerks’ workstations.
Graphic feedback. Graphic feedback consisted of two plots/day, the percent of
computer entries completed and the daily-adjusted goal plotted on graph paper.
Workdays were identified on the x-axis and the percent of computer entries completed
and daily goal were plotted on the y-axis. The attendance secretary gave each clerk a
graphic presentation of her task performance every morning during the intervention
conditions. During the initial baseline phase of the study, I met with the attendance
secretary one morning to explain how each clerk’s daily goal was calculated, how and
when to deliver the goal, e-mail and graphic feedback. I explained to her that I would be
calculating the daily goal, percent achieved, scripting the e-mail message and plotting the
graphic data; however, she would be responsible for the delivery of the information to the
clerks each morning.
Experimental Design
This study utilized an A-B-A-B reversal design (Barlow & Hersen, 1984). Data
comprising the dependent variable were generated from a computer report (ATT .515D)
identifying the students absent for the day or any part of the day and the absence code
entered for that absence. Each baseline and intervention phase was implemented over an
11-day period and the study lasted for 44 days.
Procedures
Each day the attendance secretary printed the daily student attendance report
(ATT.515D) from Aristotle ®, the campus computer program. I used this report to tally

19
the number of student absences/clerk. On this campus, the student population was
divided alphabetically between the three attendance clerks. Subject 1 was responsible for
monitoring and documenting the attendance of students whose last names began with A -
G; Subject 2, H - N; Subject 3, O - Z. Once the number of absences/clerk was
determined, only those absences coded TR, UA or A were counted as unacceptable.
These numbers, the number of absences/clerk and the number of unacceptable absences,
were used to calculate the dependent variable: percent of coded absences/clerk (calculated
by the total number of students marked absent and coded TR, UA or A divided by
number of students absent/clerk x 100 = % absences not coded - 100 = % absences
coded) (see Table 1). This percentage was calculated each day.
During the first day of the intervention phase, the 3 subjects received their goal
via e-mail from the attendance secretary when they logged onto their e-mail accounts.
Campus policy stated that e-mail be checked each morning and afternoon. After checking
their e-mail and receiving their daily goal, the attendance clerks began their work: 1)
answering phones to receive information concerning student absences, 2) checking voice
mail for information concerning absences that were phoned in after hours, 3) accepting
notes from students, 4) verifying teachers’ notes/e-mail messages, 5) entering computer
codes for each of these contacts, 6) taking messages for students, 7) making homework
requests for absent students, 8) issuing admit and dismissal forms to students arriving and
departing during the day, 9) entering student identification numbers into the Phone
Master® system for absence notification, and 10) mailing out 90% loss-of-credit letters.

20
Many of the clerks’ daily computer entries were recorded in the morning, and
generally these were comprised of absences not recorded from the previous day. The
clerks reported that being allowed to enter data from the previous day’s absences was
helpful for two reasons: 1) they had fewer demands on their time in the morning, and 2)
they had an opportunity to receive information necessary to accurately code those
absences from the previous day (i.e., doctor’s note, parent phone call, or teacher’s note).
To include this following day’s work in calculating percentage of entries, the computer
report (ATT.515D) used to generate the percent figures was run after 12:00 p.m. on the
day after the absence occurred. For example, Monday’s attendance report was printed on
Tuesday at 12:00 p.m. Thus, the clerk had from Monday morning when the teachers’
Scantron® reports were entered through Tuesday noon to record absences from Monday.
Because this daily report determined 99% of the school district’s funding generated by the
ADA, if the clerks had not completed their work by the (next day’s) noon deadline one of
several scenarios was enacted: 1) the supervisor completed the entries before the end of
the month (when ADA data was sent to the principal); or b) the attendance clerks
continued to work on the previous day’s data until the end of that week. Any data not
recorded by Friday remained unrecorded, unless a student brought in a doctor’s note or
parent note. Notes are routinely brought throughout the year to clear up unexcused
absences. Essentially, the clerks’ weekly data were never accurate nor completed. Lag
time for delivering the feedback (i.e., goal, actual percent achieved, praise statements and
the daily plotted graph) was 2 days. Attendance clerks were given feedback concerning
Monday’s absences on Wednesday morning.

21
Each day during the study, the ATT.515D report was printed at 12:00 p.m. and the
percent of absences coded were calculated per clerk. I wrote the results in an e-mail,
graphed both the goal and percent achieved on graph paper and provided these results to
the attendance secretary. The attendance secretary then delivered the e-mail feedback
and if appropriate, praise message via computer and personally presented the individual
graphs to the respective clerks the next morning.
When an attendance clerk was out for the day, or any part of the day, the
attendance secretary was responsible for conducting the clerk’s work. An e-mail message
was not delivered to the clerk regarding the day she was out. The feedback she received
following her absence was for the last workday preceding her absence.
I kept the hand-plotted graphs, printouts of e-mail feedback and checklist of the
“One Hundred Ways to Praise” sheet in a separate folder for each of the 3 clerks. As a
praise statement was used, the researcher placed a check mark next to that statement to
indicate the particular phrase had been used with a particular clerk. This prevented
repetitions of specific praise statements. The folders were kept in the researcher’s office
and delivered to the attendance secretary each morning. Attendance clerks were shown
only the graphs from their folders; they were not permitted to see the praise checklists or
the printed e-mail feedback.
22
RESULTS
The clerks’ percent of computer coding varied greatly during the course of this
study. During the baseline phases, the percent of coded absences for subject 1 varied
from 25.8% to 71%; subject 2, 33.7% to 74.6%; and subject 3, 31.8% to 77.9%. In the
intervention phases, percent of coded computer absences for subject 1 ranged from 37.5%
to 81%; subject 2, 51.3% to 77.2%; and subject 3, 49.3% to 81.4% (see Figures 1, 2, and
3). The median for each clerk in each phase was 54.4%, 66.2%, 60.8% and 59.2% for
subject 1 in baseline 1, intervention 1, baseline 2 and intervention 2, respectively. The
median data for subject 2 in each phase was 63.3%, 65.3%, 64.3% and 65.7%,
respectively. Subject 3’s median data for each phase was 58.3%, 60.5%, 61.4% and
63.5% (see Table 2). In comparing the three subjects baseline 1 data with intervention 1,
it appears that there has been some effect. The median of the percent of coded absences
for subject 1 increased by 11.8% between baseline 1 and intervention 1. Subjects 2 and
3’s median shows a slight increase of 2.0% and 2.2%, respectively. The median
decreased for subjects 1 and 2 during return to baseline and reintroduction of the
intervention produce another increase in the median. Subject 3’s median percent coded
absences increased steadily over all four phases of the study.
The clerks’ initial goals were 65.6 %, 65.9% and 67% for subjects 1, 2 and 3,
respectively. During the course of the study, the clerks’ goals were never raised from this
initial setting. For a goal to be increased, the clerk must have met or exceeded her goal 4

25
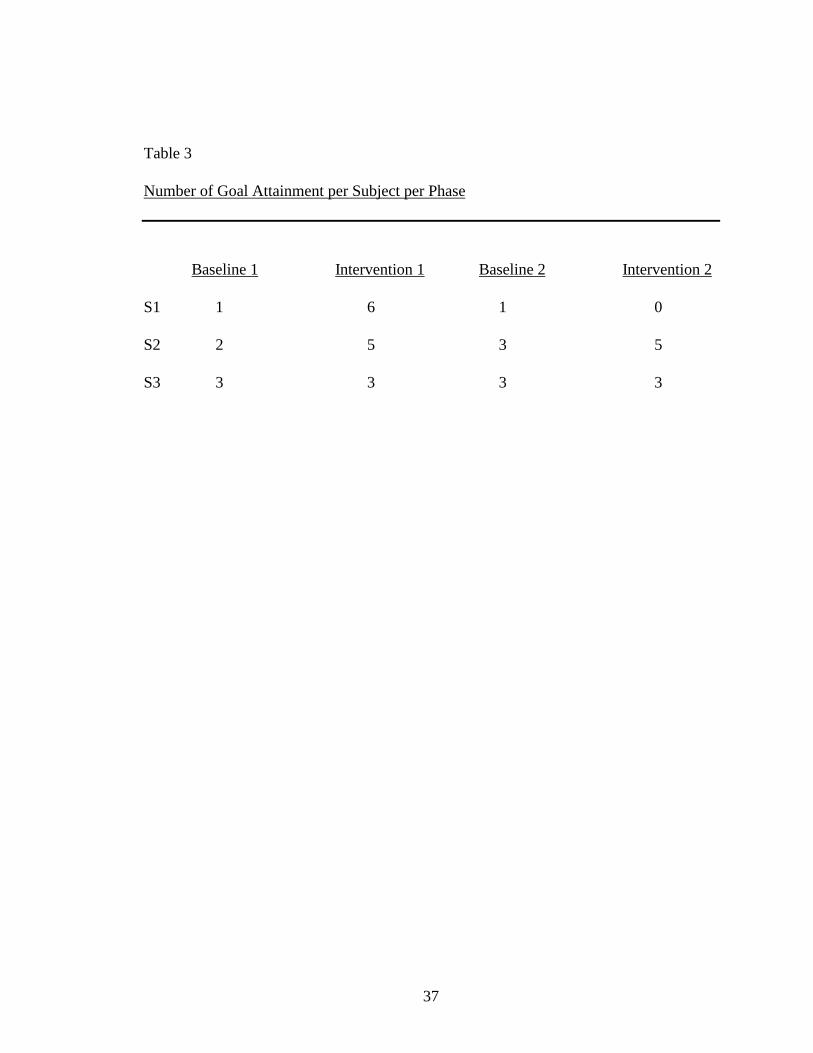
consecutive days. Only 2 of the 3 exceeded their goal for 3 consecutive days. Subject 1
exceeded her goal three times in the initial intervention phase. Subject 2 exceeded her
goal three consecutive times in the second baseline. Overall, subject 1 exceeded her goal
eight times total during the study, two times in baseline and six times during intervention.
Subject 2 exceeded her goal a total of 15 times throughout the study, 5 times in baseline
and 10 times during intervention. Subject 3 exceeded her goal 12 times during the study,
6 times during baseline and 6 times during intervention (see Table 3).
Absenteeism during the study did not seem to be excessive. Subjects 1 and 2
missed 1 day of work throughout this study, while subject 3 missed 2 days. Subject 1
missed a day during the last intervention phase, subject 2, second baseline and subject 3,
both intervention phases. No data is plotted on days when a subject was out. The
attendance secretary performed their work for that day. The clerks were provided
feedback for their last day’s work when they returned.
24
DISCUSSION
The package intervention, consisting of daily-adjusted goal setting, computer
generated written e-mail feedback/praise, and hand-graphed data, did not improve the
computer coding performance of these 3 public high school attendance clerks to a
meaningful degree. This study did not support Wilk and Redmon’s (1998) contention
that a multiple component feedback package including goal setting would be effective in
increasing support staff’s performance in an academic setting. In analyzing the data, it
appears that the clerks’ responses (i.e., total percentage attained) were not correlated with
the number of absences/day. On days when a greater number of students were absent
(i.e., 100 or more/clerk), the percent of coded absences was neither extremely high nor
low. However, the day that the highest number of absences were coded for all 3 subjects
(day 19) 167 band students were on a field trip performing in a state competition, and
many other students were out of school that day watching the band perform.
The high or low percentages and the days of the week were compared. It was
conceivable that the end of the week or an upcoming school holiday could have produced
a change in the clerks’ behavior; however, this was not the case. A few of the outlying
data points appear to be consistent between the 3 clerks. Days 5, 18 and 30 showed a
decrease in coding across all 3 subjects, while days 11 and 19 showed an increase in
coding across all subjects. The explanation for some of the similar response patterns can
be attributed to the Phonemaster® system, activated on day 5. On day 5, the clerks had to
25
verify and update student phone numbers in the computer system to ensure that the
Phonemaster® system to operated correctly. On day 18, one of the attendance clerks was
out for the day, but on other days (days 33, 41 and 43) when a clerk was out, coding rates
were not affected. On day 30, there was a fire in the building at 11:00 a.m. Everyone
was evacuated and not allowed to return until the following day. The 2 days that
document a high percentage of coding for all 3 clerks are days when students were on
field trips. There were a large number of student absences with the FT-code that did not
have to be researched. Although there are a few consistencies in the high and low
percentages, the majority of the clerks’ codes appear to be highly variable in both baseline
and intervention.
One reason for failure to modify clerk performance may be goal difficulty.
Specifically, the goals set for the clerks may have been too intense. The literature states
goals must be both specific and challenging to be effective in producing a behavior
change (Anshel et al., 1992; Erez, 1977; Fellner & Sulzer-Azaroff, 1984; Gillat & Sulzer-
Azaroff, 1994; Kim and Hamner, 1976; Locke et al., 1981; Tubbs, 1986). However, if a
goal is too challenging (i.e., subjects lack the skill or energy to attain it) the subject may
lose sight of the goal and stop working toward it (Anshel et al., 1992; Calpin et al., 1988;
Locke et al., 1981; Wood et al., 1987). While these clerks repeatedly demonstrated they
possessed the skill level necessary to accomplish their tasks, there was no way to measure
energy level required to execute the job. Each clerk had to spend a considerable amount
of time and energy tracking down and contacting teachers, parents and/or the student to
explain the absences. The level of energy necessary for meeting their goals fluctuated
26
daily depending on the types of absences and the work required to explain them. For
example, the day of the band field trip, there were more students out than on any other
day throughout the 44-day study. Because most of the coding involved FT (field trip),
there was less energy expended identifying and locating someone who could explain the
students’ absences. The students’ names were listed on a field trip form and this
information was coded into the computer. Throughout the intervention phase, these
subjects verbalized that the goals were “too hard” and that the work they would be
required to do to gather the information for all unaccounted students (i.e., contacting
parents, students and teachers) would be too time consuming.
Although it is possible that subjects failed to repeatedly meet their goal because
the goals were too difficult, the possibility also exists that the subject’s goals were not
challenging enough. Researchers have documented that goals must be specific and
difficult to produce an increase in subject performance (Anshel et al., 1992; Erez, 1977;
Fellner & Sulzer-Azaroff, 1984; Gillat & Sulzer-Azaroff, 1994; Kim & Hamner, 1976;
Locke et al., 1981; Tubbs, 1986). Perhaps if goals were set at a level that had not been
met by subjects during baseline, the motivation to attain the goal would have been
present. The question arises, how difficult must a goal be before it becomes too difficult?
Job task complexity could have inhibited the effectiveness of this package
intervention. Glenn (lecture on 28 March 2000) defined complexity as being
characterized by many different and functionally related parts. Wood et al. (1987)
identified three levels of task complexity: component complexity, coordinative
complexity and dynamic complexity. The description of the attendance clerks’ daily

27
responsibilities indicate that their everyday tasks were characterized by both component
complexity (i.e., they were required to perform a number of tasks and process a great
amount of information) and coordinative complexity (i.e., the relationships among these
tasks and information varied). The attendance clerks were required to perform long
chains of behavior, and the behaviors comprising these chains varied daily. For example,
the number of student absences fluctuated throughout the day as did various reasons for
those absences. Therefore, the work required to explain the absences differed day to day
and from absence to absence. Other aspects of the attendance clerks’ job also changed
daily. There may be a large number of messages to deliver and parent phone calls to
answer due to a weather change or a seasonal situation (i.e., students leaving early due to
icy road conditions, Valentine gifts being delivered to school or student class projects
delivered) or loss-of-credit letters mailed out based upon a student’s number of
unexcused absences. The behavior required to address particular aspects of the
attendance clerks’ job was dependent on a number of factors other than motivational
variables.
We can only speculate that task complexity may have been a factor in the subjects
failure to meet goal. Presently, there are no metrics available which allow us to
discriminate simple from complex tasks. The literature that addresses the issue of task
complexity used subjective measures, such as subjective rating scales, to identify simple
versus complex tasks (Anshel et al., 1992; Burton, 1989; Locke et al., 1981; Wood et al.,
1987).

28
Another possible reason for the failure of the feedback package to produce a
change in the behavior of the attendance clerks could be attributed to the failure of the
attendance secretary’s praise to function as a reinforcer. Although Fox and Sulzer-
Azaroff (1989) noted in their research that written feedback was effective in producing an
increase in employee behavior regardless of its source (internal/self-generated,
supervisory or peer), Locke et al. (1981), Gillat and Sulzer-Azaroff (1989) and Kim and
Hamner (1976) found that supervisory feedback was most effective if there were back-up
consequences. However in this study, the attendance secretary’s feedback/praise was not
paired with any tangible positive or negative outcomes and, therefore, probably
functioned as a neutral stimulus. Prue and Fairbank (1981) suggested that the rank of the
supervisor could account for greater or fewer changes in subjects’ behavior. For
example, feedback delivered by the principal (versus feedback delivered by the
attendance secretary) might have produced a beneficial change in the attendance clerks’
behavior, perhaps, because the school principal has direct control over reinforcers and/or
punishers that could be paired with this feedback. Gillat and Sulzer-Azaroff’s (1994)
research also support this claim.
Praise delivered to the attendance clerks may not have served as a reinforcer
regardless of the delivery source. Several authors mention that tangible rewards could
serve to enhance the effectiveness of the feedback system (Balcazar et al., 1985-86;
Fellner & Sulzer-Azaroff, 1984; Fox & Sulzer-Azaroff, 1989; Locke et al., 1981).
Fellner and Sulzer-Azaroff (1984) stated that for feedback to be effective, it must have
been “paired with a reinforcing stimulus sufficiently in the past” (p.42). In the present

29
study, there were no resources (e.g., increased pay or time off work) available to pair with
the attendance supervisor’s praise. Had back-up reinforcers been available, praise or
feedback alone might have produced a change in the clerks’ behavior.
Although providing a reinforcing stimulus might have increased the probability of
goal-attaining behavior, it is possible that coding accuracy could have been compromised.
The clerks may have begun to code more student absences, regardless of coding accuracy
(i.e., the clerks may have entered “fake” or “false” codes to address students’ unexplained
absences). A reliability measure might need to be included in future research to control
for this problem if reinforcing consequences are made contingent on coding outcomes.
Three variables in this study that differed from the Wilk and Redmon research
involve increase in goals, frequency of feedback and manner in which the goals and
feedback were delivered. First, Wilk and Redmond (1990; 1998) increased subjects’
goals after they had been met 2 consecutive days. In this study, subjects had to meet their
goal 4 consecutive days before it would be raised. The subjects never met their goal over
4 consecutive days. Therefore, since the initial goal never changed and the subjects
performance fluctuated close to the established goal, it is possible that the subjects
believed their performance was acceptable. Secondly, subjects in the Wilk and Redmon
articles were provided feedback consisting of praise or prompts two additional times
throughout their workday. In the Procedures section of this paper, there was a 2 day lag
in feedback delivery to the clerks. Although, researchers cited in this study have noted
that frequency of feedback does not appear to impact performance, this large a time
difference in feedback delivery may have produced a difference in subjects’ performances

30
(Balcazar et al., 1985-86; Chokkar & Wallin, 1884; Prue & Fairbank, 1981). Finally,
Wilk and Redmon presented their goals and feedback to subjects verbally via supervisor.
Although, research on feedback indicates that verbal and written feedback are effective at
producing change, verbally stated goals may have produced a greater change in subject
behavior than written e-mail goals (Balcazar et al., 1985-86; Brown et al., 1981; Fox &
Sulzer-Azaroff, 1989). The form in which goals are delivered may need to be researched
more thoroughly.
After reviewing the operations of the attendance office over time, it was apparent
that the work (coding of absences) was eventually completed by the attendance secretary.
She completed the coding prior to the principal receiving the monthly ADA report. There
were never any contingencies placed on the attendance clerks’ coding behavior.
Apparently, the attendance secretary cannot arrange reinforcing or punishing
contingencies for clerks’ behavior. The bottom line measurement important to the school
district is that student attendance be recorded at 94% or above for the year; however,
there are no checks to verify how this percentage is achieved.
Recommendations for Future Studies
Task simplification. Although the intervention in this study did not change any
behavior, research provides some direction for future studies. Future research could
examine the effects of simplifying the tasks while leaving the intervention components
the same. For example, in this particular study, specific job responsibilities could have
been assigned to individual clerks, assigning one subject to code student absences,
another to make the contacts “explaining” student absences and a third to answer the

31
phone and handle students signing in and out of school. Another solution might be to
address the issue of task complexity by delegating some of the clerks’ responsibilities to
others individuals within the school, such as student office aides or school volunteers.
These other individuals could be trained to answer the phone, enter student identification
numbers into the Phonemaster® and/or complete admit and dismissal forms (as students
sign in and out of school). This would provide additional time for the attendance clerks
to research unexplained absences and accurately code them.
In the Wilk and Redmon (1990; 1998) articles a number of different tasks served
as the dependent variable; however, all the tasks were related to the behaviors necessary
for university student admissions. Perhaps, if the component tasks that comprised the
chain of behavior necessary for coding students’ absences were identified and measured,
the problem of task complexity in this study could be addressed. The dependent variable
could consist of a number of component behaviors required for accurate and timely
absence coding.
Modeling previous research. There are other variables that could have more
closely resembled the research conducted by Wilk and Redmon (1990; 1998).
Specifically, goals could have been raised after clerks had met them 2 consecutive times;
feedback could have been delivered by the attendance secretary twice during the course of
the day; and goals could have been stated verbally, rather than in written e-mail form.
This would have produced a closer replication of the Wilk and Redmon studies, possibly
producing similar results.

32
Motivational variables. Future research could also address what might serve to
reinforce the attendance clerks’ behavior, as well as what source of feedback could
produce the greatest behavior change. A study that utilizes various tangible consequences
(e.g., longer lunch period, fewer work hours or periodic shifts to and from other, less
onerous tasks) or different sources of feedback (e.g., attendance supervisor, assistant
principal, principal) could provide valuable information concerning behavior change in an
attendance office. Gillat and Sulzer-Azaroff (1994) provided two sources of feedback
(principal and teacher-delivered) in their study and found both to be effective in
improving student reading behavior.
Component analysis. Finally, although package interventions have been proven to
be effective in a number of the research articles presented in this study, a greater
understanding of the effects of the intervention package may be found by including a
component analysis of the variables that create the package (Brown et al., 1981; Calpin et
al., 1988; Chhokar & Wallin, 1984; Gillat & Sulzer-Azaroff, 1994; Kim & Hamner,
1976; Wilk & Redmon, 1990; Wilk & Redmon, 1998). For example, Brown et al.
(1981), Calpin et al. (1988) Chhokar and Wallin (1984) and Wilk and Redmon (1998)
added components to their package intervention across time. In Wilk and Redmon (1998)
the initial intervention included only two components (daily-adjusted goal setting and
verbal feedback) and then the graphic feedback was added. It would be possible to
implement the same procedure in this environment and build the package, adding a single
component each time and varying the order in which the package was built among
subjects.

33
Presently, there is considerable behavior analytic research focusing on improving
student and teacher performance; however, the operation of school support staff and
administration appear to have been overlooked (Cooper, Thomson, & Baer, 1970;
Cossairt, Hall, & Hopkins, 1973; Drabman & Lahey, 1974; Fink & Carnine, 1975; Gillat
& Sulzer-Azaroff, 1994; Harris, Bushell, Sherman, & Kane, 1975; Ingham & Greer,
1992; Van Houten, Hill, & Parsons, 1975; Witt, Noell, LaFleur, & Mortenson, 1997). In
attempting to increase the effectiveness of administrative functions in the public school
system, it is important that all aspects of administrative operations be examined and
researched.

34
APPENDIX A
TABLES

35
Tab
le 1
Fabr
icat
ed S
ampl
e of
AT
T.5
15D
____
____
____
____
____
____
____
____
____
____
____
____
____
____
____
____
____
____
____
____
____
____
____
____
____
_
Ref
:A
TT
.515
DD
ate:
1/11
/00
Tim
e:11
:59:
13St
uden
t Abs
ence
s fr
om 1
/12/
00 to
1/1
2/00
Abs
ence
Typ
es: (
Au)
(A
e)
Hom
eroo
mH
omer
oom
Dai
lySt
uden
t #
Stud
ent N
ame
Cl
Tea
cher
Num
ber
01 0
2 0
3 0
4 0
5 0
6 0
7 0
8 R
easo
n
Dat
e
0000
00Ph
illip
s, J
ane
11Sm
ith, J
ane
B30
2A
A
A
A
PC
1/1
2/00
3333
33R
eeve
s, A
lice
12D
avis
, Am
y C
106
A
U
A
1
/12/
0099
9999
Smith
, Joe
09K
ent,
Cla
rkG
ymA
A
T
R
1
/12/
0077
7777
Tay
lor,
Rob
in09
Nel
son,
Jim
A10
4A
A
A
A
FT
1
/12/
0044
4444
Whi
te, M
ary
10N
elso
n, J
imA
104
A
A
A
AA
1/1
2/00
Not
e. D
epen
dent
var
iabl
e ca
lcul
ated
usi
ng th
e fo
llow
ing
form
ula:
Una
ccep
tabl
e ab
senc
e co
des
(UA
,TR
, A)
divi
ded
by to
tal n
umbe
r of
stud
ents
abs
ent/c
lerk
x 1
00 =
% a
bsen
ces
with
una
ccep
tabl
e co
des/
cler
k -
100
= %
cod
ed a
bsen
ces/
cler
k (
3 di
vide
d by
5 =
0.6
x 1
00 =
60%
- 1
00 =
40%
cod
ed a
bsen
ces)
. A
u =
Abs
ence
une
xcus
ed; A
e =
Abs
ence
exc
used
; Cl =
Gra
de C
lass
ific
atio
n; 0
1 =
Cla
ss p
erio
d; A
= A
bsen
ce; P
C =
Par
ent C
all;
UA
= U
nexc
used
Abs
ence
; TR
= T
ruan
t; FT
= F
ield
trip
.

36
Table 2
Baseline/Intervention Median Comparison among Subjects
Baseline 1 Intervention 1 Baseline 2 Intervention 2
S1 54.5% 66.2% 60.8% 59.2%
S2 63.3% 65.3% 64.3% 65.7%
S3 58.3% 60.5% 61.4% 63.5%
37
Table 3
Number of Goal Attainment per Subject per Phase
Baseline 1 Intervention 1 Baseline 2 Intervention 2
S1 1 6 1 0
S2 2 5 3 5
S3 3 3 3 3

38
APPENDIX B
FIGURES

Figure 1. Percent of coded absences per day for subject 1.
39
Subject 1
0
10
20
30
40
50
60
70
80
90
2 4 6 8 10 13 15 17 19 21 24 26 28 30 32 35 37 39 41 43
Days
Perc
ent o
f C
oded
Stu
dent
Abs
ence
s
Baseline Intervention Baseline Intervention

Figure 2. Percent of coded absences per day for subject 2.
40
Subject 2
0
10
20
30
40
50
60
70
80
90
2 4 6 8 10 13 15 17 19 21 24 26 28 30 32 35 37 39 41 43
Days
Perc
ent o
f C
oded
Stu
dent
Abs
ence
s
Baseline Intervention Baseline Intervention
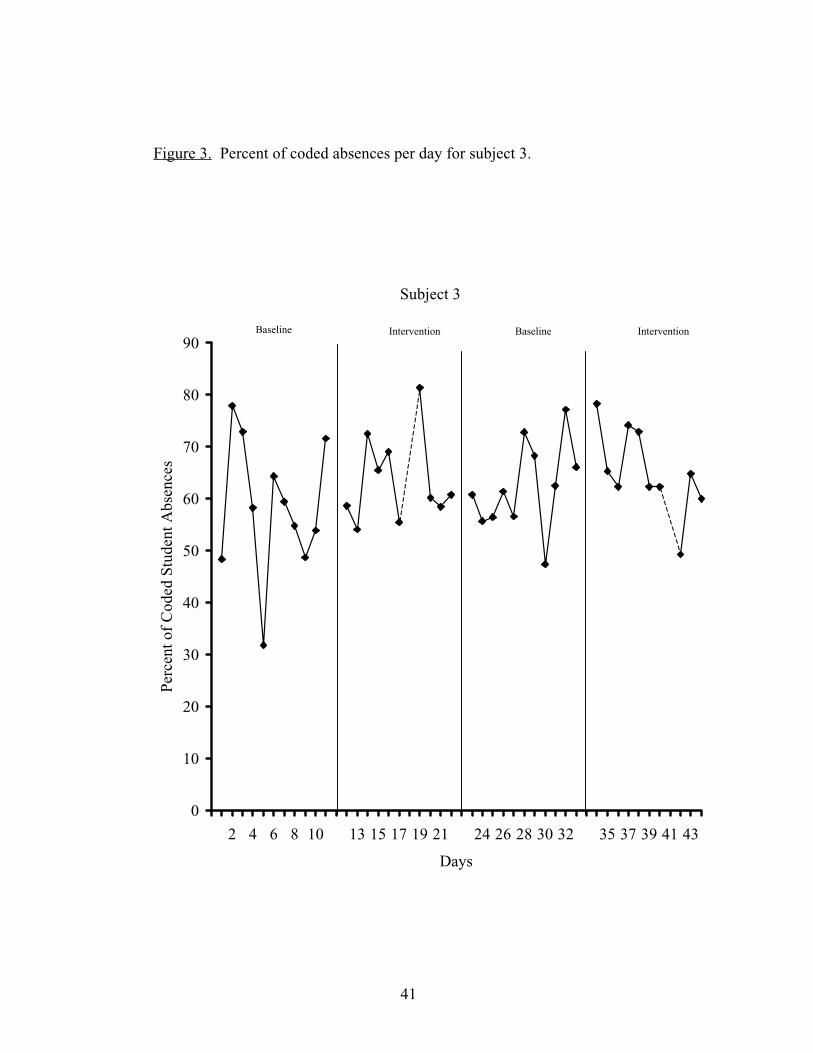
Figure 3. Percent of coded absences per day for subject 3.
41
Subject 3
0
10
20
30
40
50
60
70
80
90
2 4 6 8 10 13 15 17 19 21 24 26 28 30 32 35 37 39 41 43
Days
Perc
ent o
f C
oded
Stu
dent
Abs
ence
s
Baseline Intervention Baseline Intervention

42
REFERENCES
Anshel, M. H., Weinberg, R., & Jackson, A. (1992). The effects of goal
difficulty and task complexity on intrinsic motivation and motor performance. Journal of
Sport Behavior, 15(2), 159-176.
Balcazar, F. E., Hopkins, B. L., & Suarez, Y. (1985-86). A critical, objective
review of performance feedback. Journal of Organizational Behavior Management,
7(3/4), 65-89.
Barlow, D. H., & Hersen, M. (1984). Single case experimental designs. New
York: Pergamon Press.
Brown, K. M., Willis, B. S., & Reid, D. H. (1981). Differential effects of
supervisor verbal feedback and feedback plus approval on institutional staff performance.
Journal of Organizational Behavior Management, 3(1), 57-68.
Burton, D. (1989). The impact of goal specificity and task complexity on
basketball skill development. The Sport Psychologist, 3, 34-47.
Calpin, J. P., Edelstein, B., & Redmon, W. K. (1988). Performance feedback and
goal setting to improve mental health center staff productivity. Journal of Organizational
Behavior Management, 9(2), 35-58.
Chhokar, J. S., & Wallin, J. A. (1984). A field study of the effect of feedback
frequency on performance. Journal of Applied Psychology, 69(3), 524-530.

43
Cooper, M. L., Thomson, C. L., & Baer, D. M. (1970). The experimental
modification of teacher attending behavior. Journal of Applied Behavior Analysis, 3,
153-157.
Cossairt, A, Hall, R. V., & Hopkins, B. L. (1973). The effects of experimenter’s
instructions, feedback and praise on teacher praise of student attending behavior. Journal
of Applied Behavior Analysis, 6, 89-100.
Drabman, R. S., & Lahey, B. B. (1974). Feedback in classroom behavior
modification: Effects on the target and her classmates. Journal of Applied Behavior
Analysis, 7, 591-598.
Erez, M. (1977). Feedback: A necessary condition for the goal setting-
performance relationship. Journal of Applied Psychology, 62(5), 624-627.
Fellner, D. J., & Sulzer-Azaroff, B. (1984). A behavior analysis of goal setting.
Journal of Organizational Management, 6(1), 33-51.
Fink, W. T., & Carnine, D. W. (1975). Control of arithmetic errors using
informational feedback and graphing. Journal of Applied Behavior Analysis, 8, 461.
Fox, C. J., & Sulzer-Azaroff, B. (1989). The effectiveness of two different
sources of feedback on staff teaching of fire evacuation skills. Journal of Organizational
Behavior Management, 10(2), 19-35.
Gillat, A., & Sulzer-Azaroff, B. (1994). Promoting principals’ managerial
involvement in instructional improvement. Journal of Applied Behavior Analysis, 27,
115-129.

44
Harris, V. W., Bushell, D., Jr., Sherman, J. A., & Kane, J. F. (1975).
Instructions, feedback, praise, bonus payments, and teacher behavior. Journal of Applied
Behavior Analysis, 8, 462.
Hawkins, A. M., Burgio, L. D., Langford, A., & Engel, B. T. (1992). The effects
of verbal and written supervisory feedback on staff compliance with assigned promoted
voiding in a nursing home. Journal of Organizational Management, 13(1), 137-150.
Ilgen, D. R., & Moore, C. F. (1987). Types and choices of performance
feedback. Journal of Applied Psychology, 27(3), 401-406.
Ingham, P., & Greer, R. D. (1992). Changes in student and teacher response in
observed and generalized settings as a function of supervisor observation. Journal of
Applied Behavior Analysis, 5, 153-164.
Kim, J. S., & Hamner, W. C. (1976). Effects of performance feedback and goal
setting on productivity and satisfaction in an organizational setting. Journal of Applied
Psychology, 61(1), 48-57.
Komaki, J. L., Collins, R. L., & Penn, P. (1982). The role of performance
antecedents and consequences in work motivation. Journal of Applied Psychology, 67(3),
334-340.
Locke, D. A., Shaw, K. N., Saari, L. M., & Latham, G. P. (1981). Goal setting
and task performance: 1969-1980. Psychological Bulletin, 90(1), 125-152.
Mento, A. J., Steel, R. P., & Karren, R. J. (1987). A meta-analytic study of the
effects of goal setting on task performance 1966-1984. Organizational Behavior and
Human Decision Processes, 39, 52-83.

45
Prue, D. M., & Fairbank, J. A. (1981). Performance feedback in organizational
behavior management: A review. Journal of Organizational Behavior Management,
3(1), 1-16.
Texas Education Agency (1999). Academic Excellence Indicator System: 1998-
99 Campus Performance[On-line]. Available: www.tea.tx.us/perfreport/aeis/99/glossary.
html
Texas Education Agency (1998). Snapshots ’98: 1997-98 School District Profiles
[On-line]. Available: www.tea.state.tx.us/perfreport/snapshot/98/index.html
Tubbs, M. E. (1986). Goal setting: A meta-analytic examination of the empirical
evidence. Journal of Applied Psychology, 17(3), 474-483.
Van Houten, R., Hill, S., & Parsons, M. (1975). An analysis of a performance
feedback system: The effects of timing and feedback, public posting, and praise upon
academic performance and peer interaction. Journal of Applied Behavior Analysis, 8,
449-457.
Weinberg, R., Bruya, L., Garland, H., & Jackson, A. (1990). Effect of goal
difficulty and positive reinforcement on endurance performance. Journal of Sports and
Exercise Psychology, 12, 144-156.
Wilk, L. A., & Redmon, W. K. (1990). A daily-adjusted goal setting and
feedback procedure for improving productivity in a university admissions department.
Journal of Organizational Behavior Management, 10(2), 55-75.

46
Wilk, L. A., & Redmon, W. K. (1998). The effects of feedback and goal setting
on the productivity and satisfaction on university admissions staff. Journal of
Organizational Behavior Management, 15(1), 45-68.
Witt, J. C. Noell, G. H. LaFleur, L. H., & Mortenson, B. P. (1997). Teacher use
of interventions in general education settings: Measurement and analysis of the
independent variable. Journal of Applied Behavior Analysis, 30, 693-696.
Wood, R. E., Mento, A. J., & Locke, E. A. (1987). Task complexity as a
moderator of goal effects: A meta-analysis. Journal of Applied Psychology, 72(3), 416-
425.