Implants & Abutments · Implants & Abutments Instructions For Use (IFU) I20-0001-1501 06.05.2015
University of WollongongResearch Online
Coal Operators' Conference Faculty of Engineering and Information Sciences
2017
Effects of front abutments around multiple seammining operationsCihan KayisUniversity of Queensland
Mehmet Siddik KizilUniversity of Queensland
Research Online is the open access institutional repository for the University of Wollongong. For further information contact the UOW Library:[email protected]
Publication DetailsCihan Kayis and Mehmet Siddik Kizil, Effects of front abutments around multiple seam mining operations, in Naj Aziz and BobKininmonth (eds.), Proceedings of the 17th Coal Operators' Conference, Mining Engineering, University of Wollongong, 8-10February 2017, 17-31.

Coal Operators Conference The University of Wollongong
8-10 February 2017 17
EFFECTS OF FRONT ABUTMENTS AROUND
MULTIPLE SEAM MINING OPERATIONS
Cihan Kayis1 and Mehmet Siddik Kizil
ABSTRACT: Abutments form due to the redistribution of stresses around excavations. In longwall
mining, these stresses can redistribute in front of the longwall panel (front abutment), over the chain
pillars and intersections (side abutments) and into the goaf (goaf abutments). Front abutments are a
key factor for barrier pillar design and can significantly affect secondary support performance. Front
abutments for single seam mining operations can be detected using empirical methods, however
these methods are not useful for multiple seam mining operations. This paper investigates the effects
multiple seam mining has on the extent of the front abutment, requiring the secondary support to be
installed well ahead of the retreating longwall face. This paper focuses on the examination of longwall
abutments by analysing GEL extensometer data in order to identify the point where the total
displacement exceeds 3 mm. Preliminary results suggest that the remnant pillars located in upper
workings increase the detection distance by 125% and the goaf abutments in the upper workings
decrease the total range by 50%. The secondary support framework suggests that the bolting
advance rate and the longwall retreat rate should be accounted for when determining the lag
distance.
INTRODUCTION
Longwall mining is a common mining method used throughout the Bowen Basin in Queensland.
Multiple seam longwall mining is a relatively new concept in Australia. While extensive work has been
completed in the United Kingdom and in America, these concepts may not be applicable to Australian
mining conditions due to stronger and thicker coal seams (Peng, 2008). Front abutments can be used
to establish the minimum width required for barrier pillars, minimising coal sterilization within pillars.
The abutment can also influence the minimum lag distance required between the longwall face and
the secondary support installation. It is vitally important that the secondary support is installed before
the gateroad roof is subjected to front abutment effects. The abutment values can also be used to
develop a database for the Bowen Basin and act as a benchmark for other future operations.
This study focuses on a multiple seam operation located within the Bowen Basin. The mine contains
old bord and pillar workings located in the upper seam. The lower seam contains recently developed
longwall panels. The mine has an average depth of cover of 220m with an interburden thickness of
20m. The typical upper workings which are associated with multiple seam operations include:
Remnant pillars (blue), virgin ground (white), goaf areas (grey) and goaf boundaries, which are
illustrated in Figure 1. It also identifies areas where the operation type is unknown, but it is expected
to be goaf (green).
As the longwall retreats, the exposed roof area increases gradually. This leads to strong mine
pressure manifestation on the extracting coal mass ahead of the face (Xu, Wang and Shen, 2012). An
‘abutment’ is the redistribution of stresses around an excavation to form high stress concentrations
(Darling, 2011). The abutment pressure action is the root of various mine rock pressure
manifestations (Chen and Qian, 1994).
1School of Mechanical and Mining Engineering, University of Queensland, Brisbane, Queensland, Australia Email:
[email protected] Tel: +61 7 33654499

Coal Operators Conference The University of Wollongong
8-10 February 2017 18
Figure 1: Multiple seam mine in the Bowen Basin
When mining begins at the working face, advanced abutment pressure occurs inside of the coal mass
ahead of the face (Chen and Qian, 1994). The dynamic change directly reflects the roof activity,
indicating roof breakage and caving (Chen and Qian, 1994). Currently, the authors are not aware of
any methods or equations which link the front abutment distance and the associated multiple seam
features it encounters.
Morsy, Yassien and Peng (2006) state that the probability of multiple seam interactions increases
when the overburden to interburden ratio is greater than 7, the overburden depth is less than 300m
and the interburden thickness is less than 30 times the mining height of the lower seam. The four
controlling factors that dictate how far above and below the total extraction area the stress field
changes in multiple seam mines are (Zipf, 2005): OB (Overburden)/IB (Interburden) ratio, goaf width
to interburden thickness ratio, site-specific geology and horizontal stress to rock strength ratio.
However, the authors are unaware of any methods used to quantify the interactions.
Current multiple seam interaction mechanisms include the pressure bulb theory and pressure arch
theory. The pillars in the overlying seam using the tributary area concept (Akinkugbe, 2004) share a
uniform load of overburden equally. The pressure bulb theory suggests that the load will eventually be
transmitted by the pillars to the floor. The formation of a major pressure arch in longwall mining is
based on two assumptions. First, the ratio of the seam depth to longwall panel width must be at a
critical value so that the arch can support itself. Secondly, the gateroad pillars must be of sufficient in-
situ strength to support the abutment pressure (Luo, 1997). The pressure arch theory can be used to
determine the minimum barrier pillar width.
DETECTING ABUTMENTS
Instrumentation
Abutments can be detected using three main methods. The first method involves performing
geotechnical mapping and using pogo sticks (and other visual methods) to monitor when the stresses
are thrown in front of the face. Visual observations of rib fret and roof cracking often provide a good
indication of the front abutment. The second method for detecting abutments is to measure the
change in stress as the abutment comes through. Numerous stress-measuring instruments are
available on the market. The absolute stress can be determined using instruments which require
overcoring such as Hollow Inclusion (HI) cells (Chen, 2016). However, these methods require
relaxation in order to determine the stress and the data is only valid for the particular section of strata.
Abutment stresses can be measured using stress changes. The most common instrument used to
determine stress changes is the vibrating wire stress meter.
The final method used for detecting abutments is to measure the change in displacement concurring
in either the rib or the roof of the panel. Most mines measure the roof displacement caused due to the
Coal Operators Conference The University of Wollongong
8-10 February 2017 19
additional loading of the front abutment. The most common instrument used to measure roof and rib
displacement is the GEL extensometer. The extensometer works by using linear potentiometers to
detect strata movement (GEL Instrumentation, 2016).
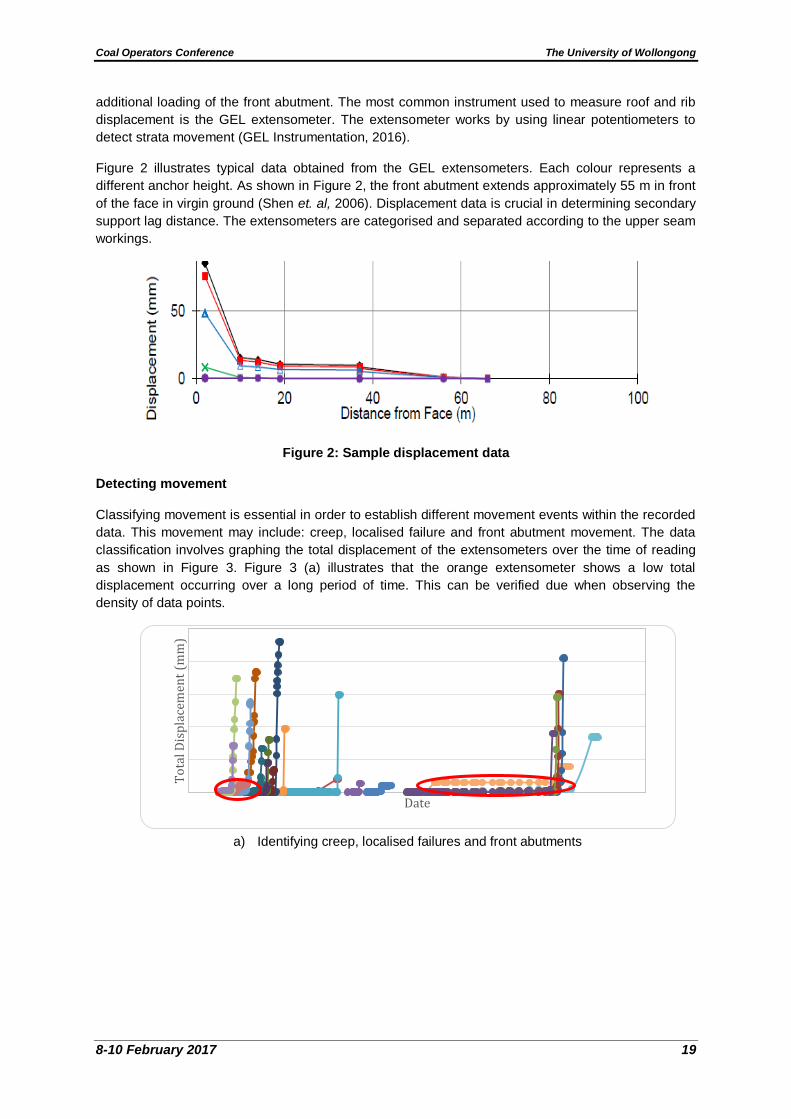
Figure 2 illustrates typical data obtained from the GEL extensometers. Each colour represents a
different anchor height. As shown in Figure 2, the front abutment extends approximately 55 m in front
of the face in virgin ground (Shen et. al, 2006). Displacement data is crucial in determining secondary
support lag distance. The extensometers are categorised and separated according to the upper seam
workings.
Figure 2: Sample displacement data
Detecting movement
Classifying movement is essential in order to establish different movement events within the recorded
data. This movement may include: creep, localised failure and front abutment movement. The data
classification involves graphing the total displacement of the extensometers over the time of reading
as shown in Figure 3. Figure 3 (a) illustrates that the orange extensometer shows a low total
displacement occurring over a long period of time. This can be verified due when observing the
density of data points.
a) Identifying creep, localised failures and front abutments
To
tal D
isp
lace
men
t (m
m)
Date
Coal Operators Conference The University of Wollongong
8-10 February 2017 20
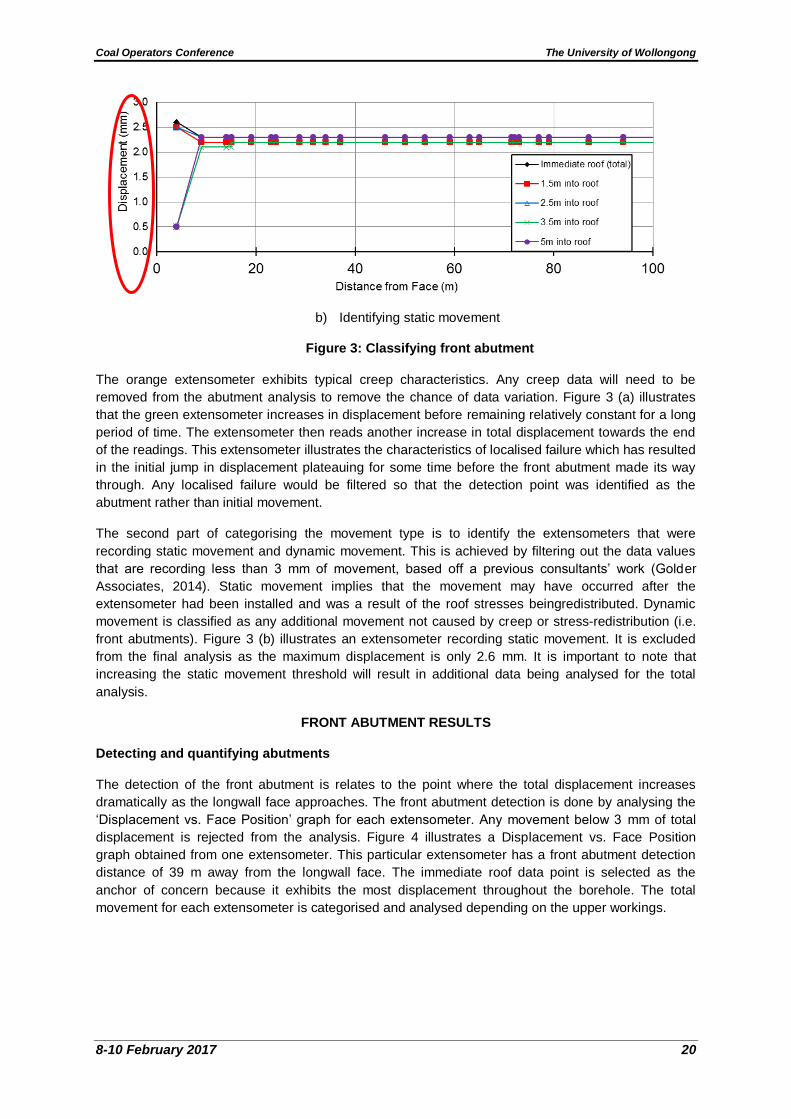
b) Identifying static movement
Figure 3: Classifying front abutment
The orange extensometer exhibits typical creep characteristics. Any creep data will need to be
removed from the abutment analysis to remove the chance of data variation. Figure 3 (a) illustrates
that the green extensometer increases in displacement before remaining relatively constant for a long
period of time. The extensometer then reads another increase in total displacement towards the end
of the readings. This extensometer illustrates the characteristics of localised failure which has resulted
in the initial jump in displacement plateauing for some time before the front abutment made its way
through. Any localised failure would be filtered so that the detection point was identified as the
abutment rather than initial movement.
The second part of categorising the movement type is to identify the extensometers that were
recording static movement and dynamic movement. This is achieved by filtering out the data values
that are recording less than 3 mm of movement, based off a previous consultants’ work (Golder
Associates, 2014). Static movement implies that the movement may have occurred after the
extensometer had been installed and was a result of the roof stresses beingredistributed. Dynamic
movement is classified as any additional movement not caused by creep or stress-redistribution (i.e.
front abutments). Figure 3 (b) illustrates an extensometer recording static movement. It is excluded
from the final analysis as the maximum displacement is only 2.6 mm. It is important to note that
increasing the static movement threshold will result in additional data being analysed for the total
analysis.
FRONT ABUTMENT RESULTS
Detecting and quantifying abutments
The detection of the front abutment is relates to the point where the total displacement increases
dramatically as the longwall face approaches. The front abutment detection is done by analysing the
‘Displacement vs. Face Position’ graph for each extensometer. Any movement below 3 mm of total
displacement is rejected from the analysis. Figure 4 illustrates a Displacement vs. Face Position
graph obtained from one extensometer. This particular extensometer has a front abutment detection
distance of 39 m away from the longwall face. The immediate roof data point is selected as the
anchor of concern because it exhibits the most displacement throughout the borehole. The total
movement for each extensometer is categorised and analysed depending on the upper workings.

Coal Operators Conference The University of Wollongong
8-10 February 2017 21
Figure 4: Displacement vs face position graph
Categorising abutments
The GEL extensometers installed in the mine fall either under old remnant pillars, under goaf areas,
under virgin ground or under a goaf/virgin boundary. Table 1 summarises the extensometers installed
at the mine according to their upper workings.
A total of 48 extensometers are useable for the analysis. The ajority of the extensometers are
installed outbye of the longwall face in the belt road. These extensometers have not recorded any
data at this point in time due to the location of the production face with respect to the instruments.
Table 1: Extensometer classification from the case study
Category Number of Extensometers
Insufficient or No Data 83
Recording Static Movement 35
Recording Creep Movement 4
Under Virgin Ground 20
Under Remnant Pillars 13
Under Goaf Boundaries 6
Under Goaf Areas 9
Total 170
Maingate front abutments
To reduce data bias and maintain consistency, the extensometer data is categorised into maingate
and tailgate results. The tailgate extensometers are exposed to additional loading due to the mining of
the previous longwall panel. Basic statistics can be used to identify the confidence interval of the
abutment data. A t-distribution is used for the analyses as the sample size of the data is less than 30
and the population standard deviation is unknown. Most engineering studies utilise a 95% confidence
interval for the project findings (University of Columbia, 2016).
Figure 5 illustrates the box and whisker plots generated for the maingate abutments. Figure 5 clearly
illustrates that the remnant pillars have the largest front abutment influence and the goaf has the least
influence. The virgin ground abutments are used as a benchmark for other values. Figure 5 suggests
that the remnant pillars are felt at a maximum of 90 m away from the face. This is 125% larger than
similar conditions in a single seam mining operation. However, 75% of the extensometers lie within 57
m from the face compared to 21.5 m for virgin ground conditions. The presence of remnant pillars in
the upper workings can result in larger barrier pillars and increased coal sterilisation. The larger
influence of upper workings confirms that pressure arch theory increases the abutment loading quite
substantially.

Coal Operators Conference The University of Wollongong
8-10 February 2017 22
Figure 5: Maingate front abutments
Figure 5 also illustrates that the presence of goaf in the upper workings can lead to a 50% reduction
in front abutment load as the maximum detection distance is at 21 m away from the face. This implies
that goaf is distributing its load in all directions rather than in a uniform direction as seen for remnant
pillars. Furthermore, goaf located in the upper workings will increase the side abutment loading on the
pillars, which may lead to stress shadowing on the face and increased load on the chain pillars and
intersections.
The smallest barrier pillar is left when the upper workings contain goaf. Figure 5 shows that the
transition of goaf boundaries to remnant pillars and virgin coal can throw the front abutment more than
virgin ground conditions can. It is recommended that the barrier pillar width is adjusted according to
the upper workings located above the proposed longwall take off position. Table 2 encapsulates the
statistical analysis performed on the maingate abutments. A 95% confidence suggests that the virgin
abutments for other coal mines lie between 11 m and 22 m. This estimation lies well below those
observed in the field.
Table 2 also indicates that the goaf abutments will lie somewhere between 0.6 m and 17 m from the
longwall face. A front abutment influence of 0.5 m is less than a web of coal and would not occur in
reality. The remnant pillar data suggests that the front abutment will be felt at a maximum of 52 m
away from the face. Using these values for design could impose significant geotechnical
consequences. The statistical confidence of data would increase dramatically if the sample size were
larger and a z-distribution were used instead. It is recommended that other mines in the Bowen Basin
use the box and whisker plot data for their preliminary studies rather than the statistical analysis.
Table 2: Maingate front abutment statistics
Upper Workings Sample Size
Sample Mean (m)
Standard Deviation (m)
Confidence Level (%)
Abutment Range (m)
Virgin Ground 16 16.72 10.02 95 11.38 – 22.06 Remnant Pillars 11 33.09 29.03 95 13.59 – 52.59 Goaf 5 9.00 6.78 95 0.58 – 17.42 Goaf Boundaries 6 27.67 13.78 95 13.21 – 42.13
Tailgate front abutments
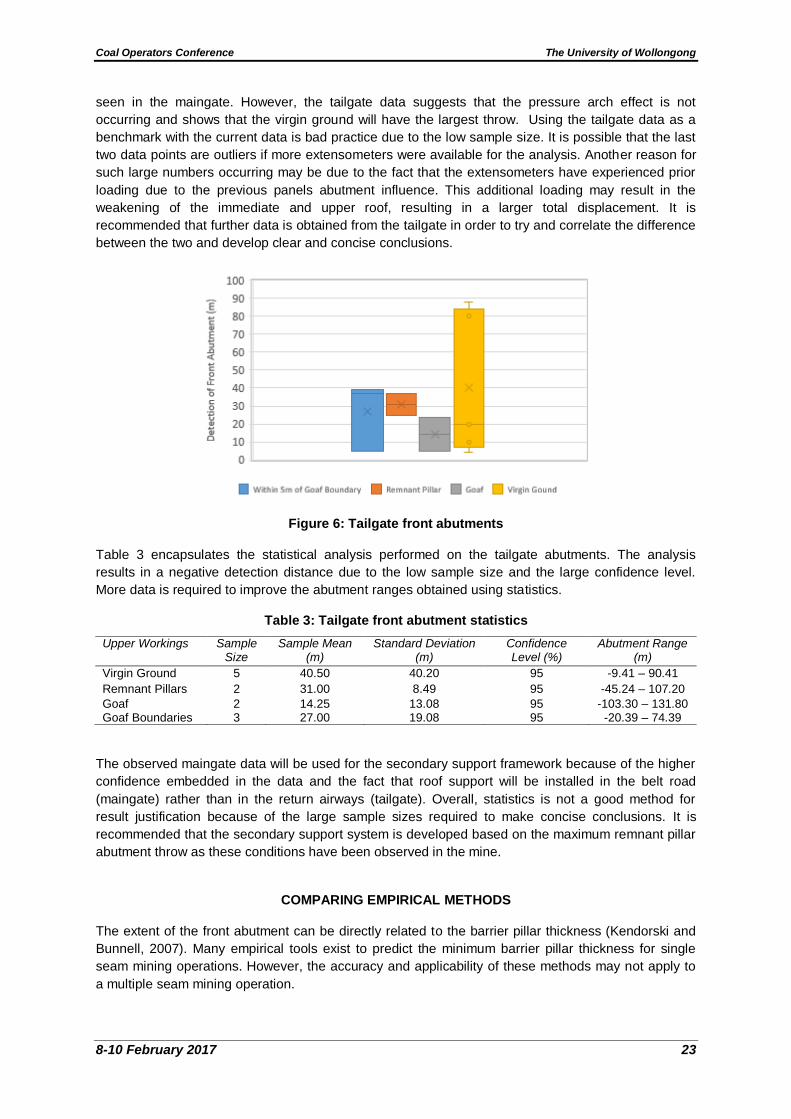
Figure 6 illustrates the box and whisker plots generated for the tailgate abutments. It clearly shows
that the virgin ground upper workings exhibit the greatest front abutment influence compared to the
other workings. The remnant pillars only exhibit a maximum throw of 37 m compared with the 90m
Coal Operators Conference The University of Wollongong
8-10 February 2017 23
seen in the maingate. However, the tailgate data suggests that the pressure arch effect is not
occurring and shows that the virgin ground will have the largest throw. Using the tailgate data as a
benchmark with the current data is bad practice due to the low sample size. It is possible that the last
two data points are outliers if more extensometers were available for the analysis. Another reason for
such large numbers occurring may be due to the fact that the extensometers have experienced prior
loading due to the previous panels abutment influence. This additional loading may result in the
weakening of the immediate and upper roof, resulting in a larger total displacement. It is
recommended that further data is obtained from the tailgate in order to try and correlate the difference
between the two and develop clear and concise conclusions.
Figure 6: Tailgate front abutments
Table 3 encapsulates the statistical analysis performed on the tailgate abutments. The analysis
results in a negative detection distance due to the low sample size and the large confidence level.
More data is required to improve the abutment ranges obtained using statistics.
Table 3: Tailgate front abutment statistics
Upper Workings Sample Size
Sample Mean (m)
Standard Deviation (m)
Confidence Level (%)
Abutment Range (m)
Virgin Ground 5 40.50 40.20 95 -9.41 – 90.41
Remnant Pillars 2 31.00 8.49 95 -45.24 – 107.20
Goaf 2 14.25 13.08 95 -103.30 – 131.80 Goaf Boundaries 3 27.00 19.08 95 -20.39 – 74.39
The observed maingate data will be used for the secondary support framework because of the higher
confidence embedded in the data and the fact that roof support will be installed in the belt road
(maingate) rather than in the return airways (tailgate). Overall, statistics is not a good method for
result justification because of the large sample sizes required to make concise conclusions. It is
recommended that the secondary support system is developed based on the maximum remnant pillar
abutment throw as these conditions have been observed in the mine.
COMPARING EMPIRICAL METHODS
The extent of the front abutment can be directly related to the barrier pillar thickness (Kendorski and
Bunnell, 2007). Many empirical tools exist to predict the minimum barrier pillar thickness for single
seam mining operations. However, the accuracy and applicability of these methods may not apply to
a multiple seam mining operation.
Coal Operators Conference The University of Wollongong
8-10 February 2017 24
Peng and Chiang’s method
Peng and Chiang (1984) found that the depth of the front abutment extent (D) can be a function of the
square root of the coal seam depth (H) and a empircal constant which can be shown in Equation 1:
D = 5.13 ∗ √H (1)
Dunn’s Rule
Dunn’s rule was developed in the United Kindgom where the coal seams are much thinner and
weaker. Kendorski and Blummel (2007) suggest that Dunn’s rule only considered the depth of the
coal seam (H). The equation has been converted from an imperial system to a metric system, as
summaried in Equation 2:
D = (((3.28084∗𝐻)−180)
20+ 15) ∗ 0.3048 (2)
Pennsylvania mines inspectorate rule
The Pennsylvaia Mines Inspectorate Rule was developed in America where the geology of the coal
seams varies from those seen in Australia. The method has been converted from an imperial
approach to the metric system. Kendorski and Blunnell (2007) show that this method incorporates the
seam depth (H) and the roadway height (T) which can be summarised in Equation 3:
D = (20 + (4 ∗ (3.28084 ∗ T) + 0.1 ∗ (3.28084 ∗ H)) ∗ 0.3048
(3) Pressure arch method
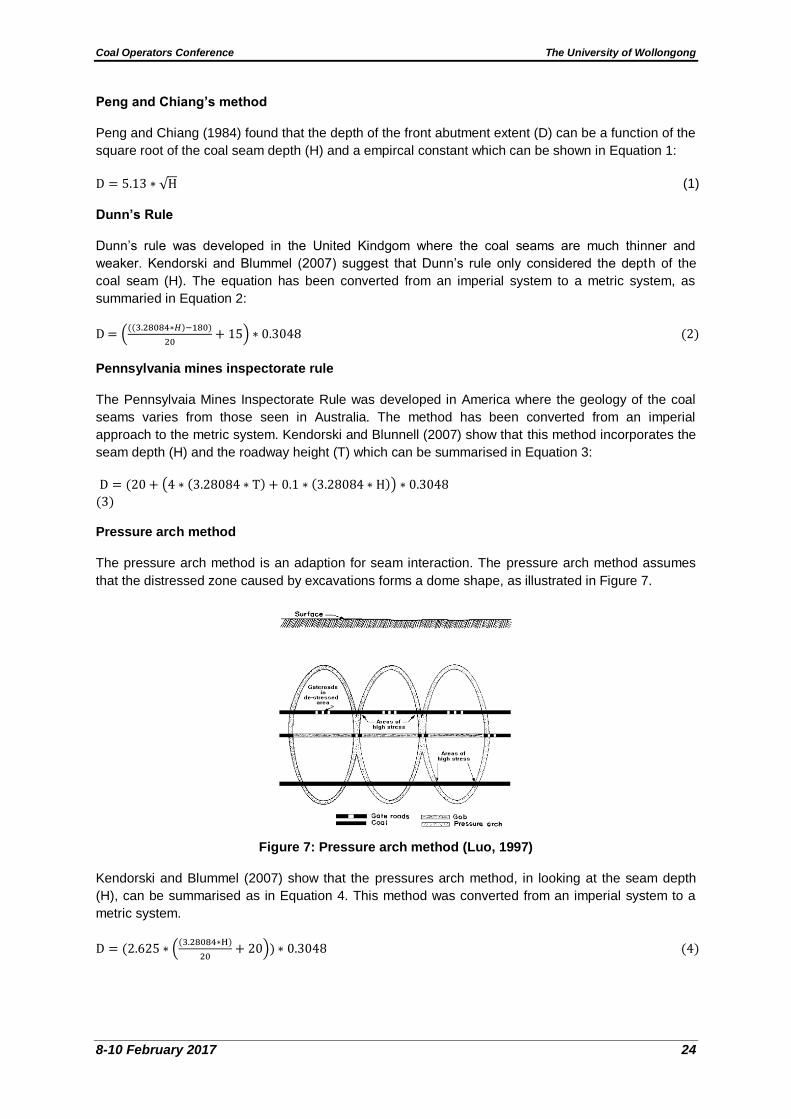
The pressure arch method is an adaption for seam interaction. The pressure arch method assumes
that the distressed zone caused by excavations forms a dome shape, as illustrated in Figure 7.
Figure 7: Pressure arch method (Luo, 1997)
Kendorski and Blummel (2007) show that the pressures arch method, in looking at the seam depth
(H), can be summarised as in Equation 4. This method was converted from an imperial system to a
metric system.
D = (2.625 ∗ ((3.28084∗H)
20+ 20)) ∗ 0.3048 (4)
Coal Operators Conference The University of Wollongong
8-10 February 2017 25
Case study results
The mine site seam parameters from the case study required for the empirical analysis include (Lines,
2015):
Seam Depth of 220 m; and
Roadway Height of 3.5 m
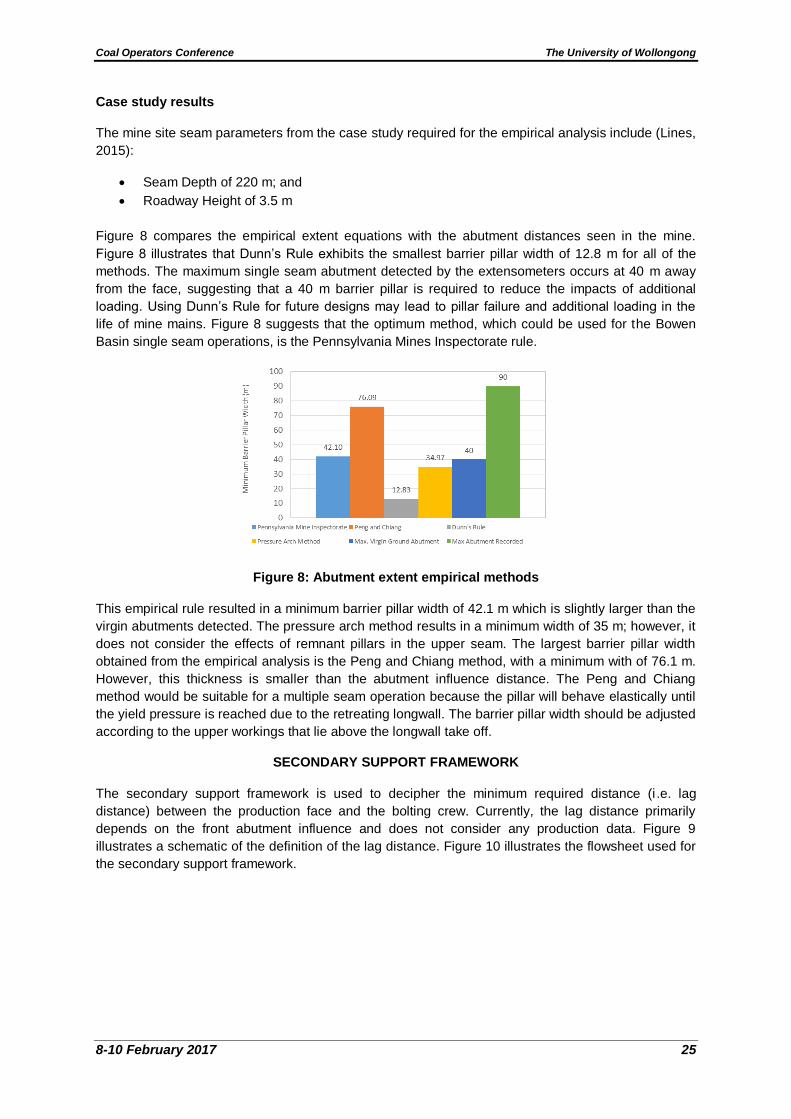
Figure 8 compares the empirical extent equations with the abutment distances seen in the mine.
Figure 8 illustrates that Dunn’s Rule exhibits the smallest barrier pillar width of 12.8 m for all of the
methods. The maximum single seam abutment detected by the extensometers occurs at 40 m away
from the face, suggesting that a 40 m barrier pillar is required to reduce the impacts of additional
loading. Using Dunn’s Rule for future designs may lead to pillar failure and additional loading in the
life of mine mains. Figure 8 suggests that the optimum method, which could be used for the Bowen
Basin single seam operations, is the Pennsylvania Mines Inspectorate rule.
Figure 8: Abutment extent empirical methods
This empirical rule resulted in a minimum barrier pillar width of 42.1 m which is slightly larger than the
virgin abutments detected. The pressure arch method results in a minimum width of 35 m; however, it
does not consider the effects of remnant pillars in the upper seam. The largest barrier pillar width
obtained from the empirical analysis is the Peng and Chiang method, with a minimum with of 76.1 m.
However, this thickness is smaller than the abutment influence distance. The Peng and Chiang
method would be suitable for a multiple seam operation because the pillar will behave elastically until
the yield pressure is reached due to the retreating longwall. The barrier pillar width should be adjusted
according to the upper workings that lie above the longwall take off.
SECONDARY SUPPORT FRAMEWORK
The secondary support framework is used to decipher the minimum required distance (i .e. lag
distance) between the production face and the bolting crew. Currently, the lag distance primarily
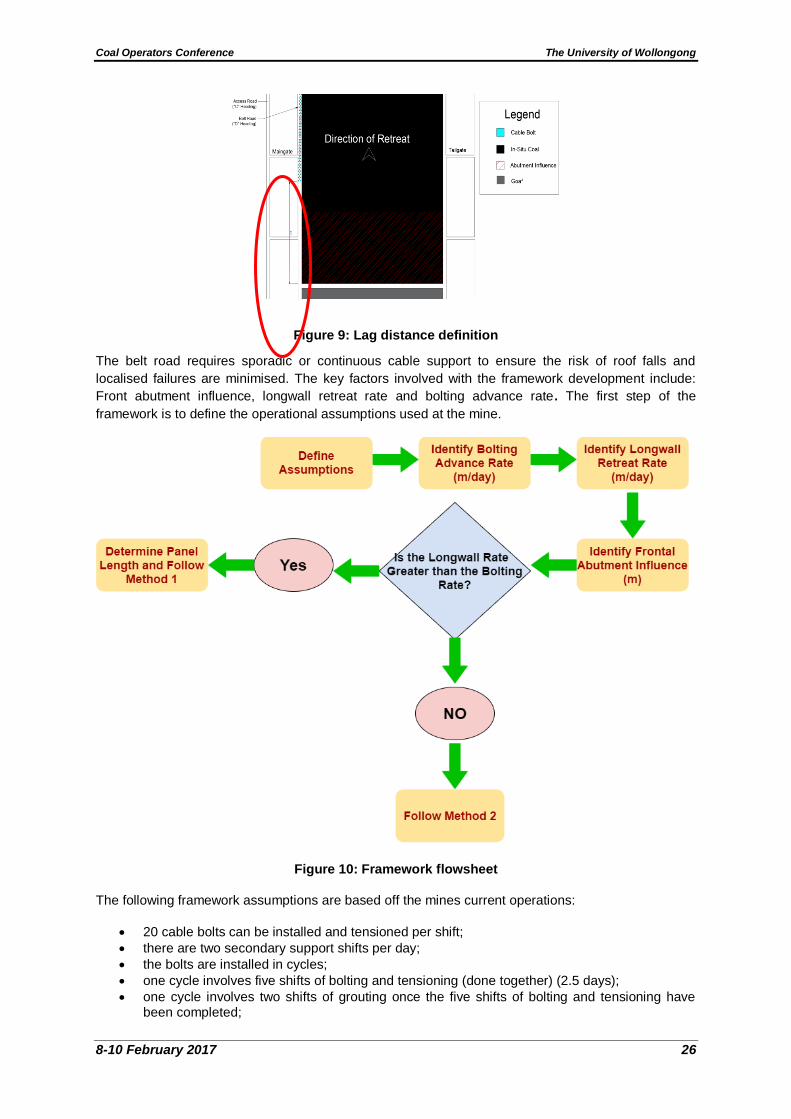
depends on the front abutment influence and does not consider any production data. Figure 9
illustrates a schematic of the definition of the lag distance. Figure 10 illustrates the flowsheet used for
the secondary support framework.
Coal Operators Conference The University of Wollongong
8-10 February 2017 26
Figure 9: Lag distance definition
The belt road requires sporadic or continuous cable support to ensure the risk of roof falls and
localised failures are minimised. The key factors involved with the framework development include:
Front abutment influence, longwall retreat rate and bolting advance rate. The first step of the
framework is to define the operational assumptions used at the mine.
Figure 10: Framework flowsheet
The following framework assumptions are based off the mines current operations:
20 cable bolts can be installed and tensioned per shift;
there are two secondary support shifts per day;
the bolts are installed in cycles;
one cycle involves five shifts of bolting and tensioning (done together) (2.5 days);
one cycle involves two shifts of grouting once the five shifts of bolting and tensioning have been completed;
Coal Operators Conference The University of Wollongong
8-10 February 2017 27
one cycle involves two shifts for the grout to reach an acceptable strength after pumping; and
one cycle is 4.5 days long (i.e. nine shifts).
The density and spacing of the bolts is determined by the geotechnical engineer. Generally, the
density of the bolts is increased when the bolting crew reach intersections, work under remnant pillars
and goaf areas from the upper seam and when the geology of the area changes due to roof quality
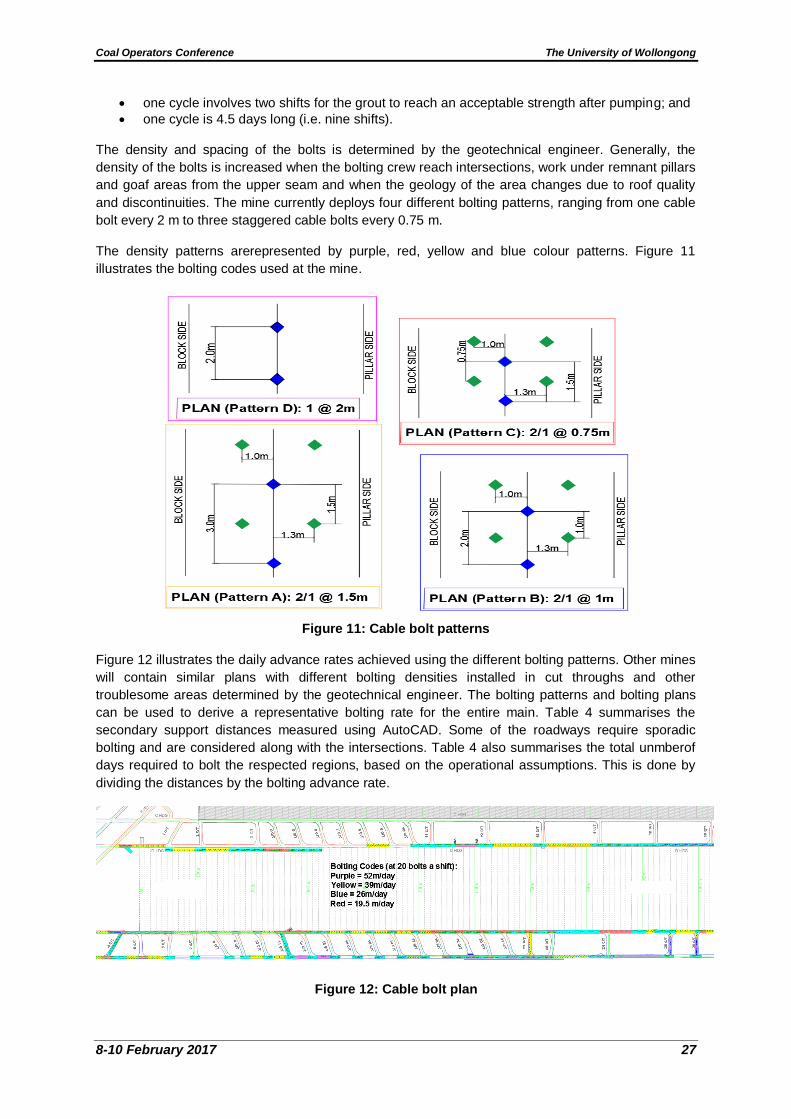
and discontinuities. The mine currently deploys four different bolting patterns, ranging from one cable
bolt every 2 m to three staggered cable bolts every 0.75 m.
The density patterns arerepresented by purple, red, yellow and blue colour patterns. Figure 11
illustrates the bolting codes used at the mine.
Figure 11: Cable bolt patterns
Figure 12 illustrates the daily advance rates achieved using the different bolting patterns. Other mines
will contain similar plans with different bolting densities installed in cut throughs and other
troublesome areas determined by the geotechnical engineer. The bolting patterns and bolting plans
can be used to derive a representative bolting rate for the entire main. Table 4 summarises the
secondary support distances measured using AutoCAD. Some of the roadways require sporadic
bolting and are considered along with the intersections. Table 4 also summarises the total unmberof
days required to bolt the respected regions, based on the operational assumptions. This is done by
dividing the distances by the bolting advance rate.
Figure 12: Cable bolt plan
Coal Operators Conference The University of Wollongong
8-10 February 2017 28
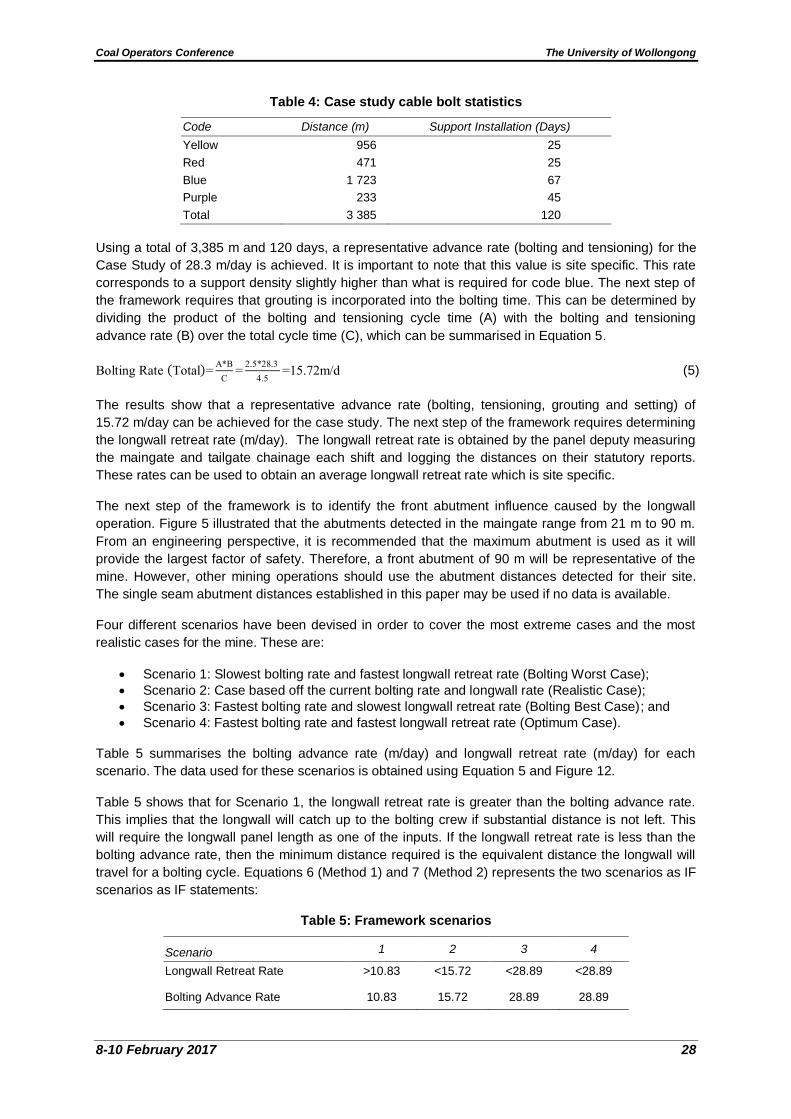
Table 4: Case study cable bolt statistics
Code Distance (m) Support Installation (Days)
Yellow 956 25
Red 471 25
Blue 1 723 67
Purple 233 45
Total 3 385 120
Using a total of 3,385 m and 120 days, a representative advance rate (bolting and tensioning) for the
Case Study of 28.3 m/day is achieved. It is important to note that this value is site specific. This rate
corresponds to a support density slightly higher than what is required for code blue. The next step of
the framework requires that grouting is incorporated into the bolting time. This can be determined by
dividing the product of the bolting and tensioning cycle time (A) with the bolting and tensioning
advance rate (B) over the total cycle time (C), which can be summarised in Equation 5.
Bolting Rate (Total)=A*B
C=
2.5*28.3
4.5=15.72m/d (5)
The results show that a representative advance rate (bolting, tensioning, grouting and setting) of
15.72 m/day can be achieved for the case study. The next step of the framework requires determining
the longwall retreat rate (m/day). The longwall retreat rate is obtained by the panel deputy measuring
the maingate and tailgate chainage each shift and logging the distances on their statutory reports.
These rates can be used to obtain an average longwall retreat rate which is site specific.
The next step of the framework is to identify the front abutment influence caused by the longwall
operation. Figure 5 illustrated that the abutments detected in the maingate range from 21 m to 90 m.
From an engineering perspective, it is recommended that the maximum abutment is used as it will
provide the largest factor of safety. Therefore, a front abutment of 90 m will be representative of the
mine. However, other mining operations should use the abutment distances detected for their site.
The single seam abutment distances established in this paper may be used if no data is available.
Four different scenarios have been devised in order to cover the most extreme cases and the most
realistic cases for the mine. These are:
Scenario 1: Slowest bolting rate and fastest longwall retreat rate (Bolting Worst Case);
Scenario 2: Case based off the current bolting rate and longwall rate (Realistic Case);
Scenario 3: Fastest bolting rate and slowest longwall retreat rate (Bolting Best Case); and
Scenario 4: Fastest bolting rate and fastest longwall retreat rate (Optimum Case).
Table 5 summarises the bolting advance rate (m/day) and longwall retreat rate (m/day) for each
scenario. The data used for these scenarios is obtained using Equation 5 and Figure 12.
Table 5 shows that for Scenario 1, the longwall retreat rate is greater than the bolting advance rate.
This implies that the longwall will catch up to the bolting crew if substantial distance is not left. This
will require the longwall panel length as one of the inputs. If the longwall retreat rate is less than the
bolting advance rate, then the minimum distance required is the equivalent distance the longwall will
travel for a bolting cycle. Equations 6 (Method 1) and 7 (Method 2) represents the two scenarios as IF
scenarios as IF statements:
Table 5: Framework scenarios
Scenario 1 2 3 4
Longwall Retreat Rate >10.83 <15.72 <28.89 <28.89
Bolting Advance Rate 10.83 15.72 28.89 28.89

Coal Operators Conference The University of Wollongong
8-10 February 2017 29
IF LR > 𝐵𝑅, 𝑥(m) = P − ((P−L
LR) ∗ BR) (6)
(7)
In Equation 6 and 7, ‘x’ represents the minimum lag distance required between the longwall face and
the bolting crew (m), ‘P’ represents the panel length (m), ‘L’ represents the abutment distance (m),
‘LR’ represents the longwall retreat rate (m/day), ‘BR’ represents the bolting advance rate (m/day) and
‘BC’ represents the total bolting cycle time (days).
Equation 6 shows that different parameters used in order to determine the required distance. The
bolting cycle is the time taken between the initial bolt installation and the time for the grout to fully
harden in the last bolt. Some mining operations may utilise a different secondary support approach.
The IF statement should be adjusted according to the condition, then the minimum required distance
will be dependent on the specific panels. It is assumed that the average panel length for the mining
operation is 2200 m. Table 6 encapsulates the minimum distance required for all four scenarios,
utilising Equations 6 and 7.
Table 6 shows that the minimum required distance for current mining practices is 119.7 m. The lag
distance ranges from 105 m to 719 m, with the minimum distance increasing significantly for scenario
1. This phenomenon occurs due to the fact that the longwall will catch up to the bolting crew if
significant distance is not left. Figure 13 illustrates the required distance based on varying the
abutment distance.
Table 6: Required distances
Scenario 1 2 3 4
Longwall Retreat (m/day) >10.83 <15.72 <28.89 <28.89
Bolting Advance (m/day) 10.83 15.72 28.89 28.89
Abutment Length (m) 90 90 90 90
Panel Length (m) 2200 - - -
Distance Required (m) 718.90 119.70 104.95 159.43
Figure 13: Required distance vs abutment distance

Coal Operators Conference The University of Wollongong
8-10 February 2017 30
Figure 13 illustrates that all four scenarios show linear trends. The trend line equation generated
represents the current trends being observed at the mine. A minimum distance of 29.3 m is required
due to bolting and production data. Disregarding the dynamic inputs of the framework may lead to the
cable bolts not being used to their maximum capacities due to early loading of the roof from the front
abutment. Figure 14 illustrates the required distance for the mine based on the longwall retreat rate.
Figure 14: Required distance vs longwall retreat rate
Figure 14 shows that the required minimum distance can be selected based on how the longwall is
performing. The required distance increases tremendously once the longwall rate surpasses the
bolting rate. Figures 13 and 14 clearly show that the required distance is higher than those being
currently used throughout the mine. Using an abutment distance of 90 m will contain an incorporated
factor of safety. It is recommended that the mine uses a lag distance of 120 m to account for the new
parameters. It is important to note that this model does not account for intersections and cut through
bolting. In the event that the longwall is faster than the bolting rate, it is recommended that an
additional crew is used to perform the secondary support installation in the cut throughs in order to not
to interfere with the primary crew operations.
CONCLUSION
In conclusion, the effects of the front abutment will be amplified by up to 125% if the longwall is
retreating under remnant pillars. The effects will be dampened by up to 50% if the longwall retreats
under upper seam goaf areas. The empirical equations suggest that the Pennsylvania Mines
Inspectorate method is the most accurate at predicting single seam abutments. However, the
empirical methods failed to predict longwall abutments under old bord and pillar workings. Peng and
Chiang’s method tends to overestimate single seam abutments; however, it underestimates the
maximum abutment throw experienced in the mine.
The secondary support requirements suggest that the lag distance is a function of the bolting advance
rate, longwall retreat rate, panel length and the front abutment. The lag distance is significantly
amplified if the longwall retreat rate exceeds the bolting rate. The limitations of the support distance
are that it does not incorporate the time required for intersection bolting and the curing time for the
grout is developed around industry rules of thumb. The framework can be adjusted to incorporate
parameters which are more applicable to certain sites. It is recommended that the abutment values
obtained from the extensometers are compared with other sites from the Bowen Basin and around
Australia to ensure that the data is valid and looks reasonable.
ACKNOWLEDGEMENTS
The authors would like to thank Peter Baker and Adam Lines for providing data, guidance and site
access in order to obtain front abutment information regarding multiple seam mining operations.
Req
uir
ed D
ista
nce
(m
)
Longwall Retreat Rate (m/day)
Coal Operators Conference The University of Wollongong
8-10 February 2017 31
Finally, the authors would like to thank Nick Gordon from Gordon Geotechniques for consultation and
giving advise on how to approach and fill the gap in industry.
REFERENCES
Akinkugbe, O O, 2004. A simple two-dimensional boundary element program for estimating multiple seam interactions, MScEng thesis (unpublished), University of West Virginia, Morgantown.
Chen, Y G and Qian, M G, 1994. Surrounding Wall Control of Chinese Longwall Mines, pp:184-197 (China University of Mining and Technology: Xuzhao).
Chen, Z, 2016. Instrumentation. MINE4128 Lecture delivered at 08-260, University of Queensland, 17 March.
Darling, P, 2011. SME Mining Engineering Handbook, pp:1024-1082 (Society for Mining, Metallurgy and Exploration).
GEL Instrumentation, 2016. Roof Extensometer [online]. Available from: < http://www.gelinst.com.au/ > [Accessed: 13 May 2016].
Golder Associates, 2014, Roof and rib support recommended for the driveage and widening of LW201 Installation Road, Cook Colliery Strata Control, Brisbane.
Kendorski, F S and Bunnell, M D, 2007. Design and performance of a longwall coal mine water-barrier pillar, in Proceedings of the 26
th International Conference on Ground Control in Mining,
Morgantown, West Virginia, pp:217-224 (Society for Mining, Metallurgy and Exploration). Lines, A, 2015. LW201 Pillar Review, Caledon Cook Colliery, pp:1-3. Luo, J L, 1997. Gateroad design in overlying multiple seam mines, MScEng thesis (unpublished),
Virginia Polytechnic Institute and State University, Virginia. Morsy, K, Yassien, A and Peng, S S, 2006. Multiple seam mining interactions – a case study, in
Proceedings of the 25th International Conference on Ground Control in Mining, West Virginia,
pp:308-314 (Society for Mining, Metallurgy and Exploration). Peng, S S, 2008. Coal Mine Ground Control 3
rd Edition, pp 389 – 419 (Society for Mining and
Metallurgy, Colorado). Shen, B, Guo, H, King, A and Wood, M, 2006. An integrated real-time roof monitoring system for
underground coal mines, in Proceedings of the 7th Coal Operators Conference, Wollongong,
NSW, pp:63-76 (The Australasian Institute of Mining and Metallurgy). University of Columbia, 2016. Statistical Sampling and Regression: t-Distribution [online]. Available
from: <http://ci.columbia.edu/ > [Accessed: 1 October 2016]. Xu, W Q, Wang, E Y and Shen, R X, 2012. Distribution pattern of front abutment pressure of fully-
mechanised working face of soft coal [online], International Journal of Mining Science and Technology, 22(2):279-284, Available from: < http://www.sciencedirect.com/ > [Accessed: 11 May 2016].
Zipf, R K, 2005. Failure mechanics of multiple seam mining interaction, in Proceedings of the 24th
International Conference on Ground Control in Mining, West Virginia, pp:93-106 (Society for Mining, Metallurgy and Exploration).