Performance Incentives, Divergent Thinking Training, and ...


Effects of Examinee Choice on a Test of Divergent Thinking
Donald E. Powers and Randy Elliot Bennett
GRE Board Final Report No. 93-20P
July 1998
This report presents the findings of a research project funded by and carried out under the auspices of the Graduate
Record Examinations Board.
Educational Testing Service, Princeton, NJ 0854 1

********************
Researchers are encouraged to elyress freely their professional judgment. Therefore. points of view or opinions stated in Graduate
Record Examinations Board Reports do not necessarily represent official Graduate Record Examinations Board position or policy.
********************
The Graduate Record Examinations Board and Educational Testing Service are dedicated to the principle of equal opportunity. and their programs,
services, and employment policies are guided by that principle.
EDUCATIONAL TESTING SERVICE. ETS, the ETS logo, GRADUATE RECORD EXAMINATIONS, and GRE are registered trademarks of Educational Testing Service.
Copyright c 1998 by Educational Testing Service. All rights reserved.
Acknowledgments
Many individuals contributed to this study. Bob Mislevy advised us on study design; Jan Flaugher managed development and data collection; Kelli Boyles and Lois Frankel wrote items, created rubrics, assembled test forms, and scored a subset of responses; Holly Knott produced the test packages; Peggy Redman conducted examinee interviews; Eleanore DeYoung helped edit data files; Phil Leung and Kathy Carberry prepared files for data analysis; and Ruth Yoder prepared the manuscript. Special thanks go to Eiji Muraki and Min hwei Wang for conducting analyses. Mary Enright and Bill Ward provided helpful comments on an earlier draR of this report, and Nancy Parr provided editorial suggestions. Finally, we would like to acknowledge members of the GRE Board and its Research Committee for their advice and support.

Abstract
Under some circumstances, allowing examinees to choose which items to respond to may increase test validity. In this study, we explored how choice affected examinee performance and related characteristics for a test of the ability to generate hypotheses about a given situation. Four forms of this experimental test were randomly spiraled within a large sample of students taking the computer-based GRE General Test, with two of the forms allowing examinee choice. Results suggested that items were, in fact, differentially attractive to gender, ethnic, undergraduate major, and ability groups, indicating that, in some form, choice was operating. Further, performance was significantly higher when a given item was chosen than when it was required. Effects of choice on subgroup performance were generally inconclusive. Finally, there was some indication that internal consistency was improved by the choice option.

Preface
Some 20 years ago, in an edition of the American Psychologist, industrial psychologist Robert Guion (1974) reported on a study of carton packers -- people who made their living by placing objects into containers. Among the objectives was to investigate the potential of a series of physical measurements for predicting job performance. The criterion was a brief work sample that entailed packing several cartons of golf balls. Success was measured in terms of the time taken to fill the cartons. Guion and his coinvestigator found that one particular examinee characteristic -- arm length, the number of inches in the outstretched limb -- was a significant predictor of performance on the task (c =.46): the longer the arm, the faster the packer.
On closer examination, the researchers discovered that arm length predicted packing speed only for women, not for men. It seems that the experimental conditions, as standardized by the investigators, constrained everyone to sit exactly 32 inches from the packing cartons. For most of the men in the study, this distance posed no problem. For most of the women, however, the reach was difficult.
The investigators repeated the study, this time decreasing the distance between seats and packing cartons to 24 inches. Under these new standardized conditions, the results were reversed: arm length was now a good predictor of performance for men, but not for women. It seems that the work space was now too cramped for many of the men, but about right for most of the women. From these results Guion reasoned that, if study participants were allowed to choose the appropriate distance for their chairs, seats could be placed at an optimum distance from packing cartons. The result of allowing this choice was that arm length was no longer predictive of performance for either men or women, and productivity was maximized.

Standardization -- presenting identical (or equivalent) tasks in the same way to every test taker -- has long been a valued aspect of many forms of testing, as it is thought to enable comparisons among examinees that are both fair and valid. Generally, this belief is strongly held by those who develop and administer such tests: the conditions of testing (e.g., the time allowed to complete a test, the content and format of questions, the test directions, and other features of the test and of the test administration) should be exactly the same for every test taker.
Sometimes, though, standardization is intentionally violated, as when visually impaired examinees are permitted to take Braille or large-print editions of a test. But currently, even these quite necessary modifications are typically noted by “flagging” test scores to indicate to test users that some aspect of standardization was breached. It is probably not surprising then that some test makers balk at the prospect of letting examinees choose the questions they will answer, for permitting such choices may amount to, as Wainer and Thissen (1994) characterize it, “allowing examinees to construct their own test forms” -- a far more serious transgression than those mentioned earlier. These authors cite Gulliksen’s (1950) contention that, because of the difficulties involved in equating tests that allow choice, “alternative questions should always be avoided” (p. 338). They conclude, therefore, that allowing examinee choice may be “anathema” to fair testing.
Yet there is a lesson to be learned, we think, from the example given in the preface -- that under certain circumstances valid measurement may be better served by selectively relaxing, rather than strictly observing, the conditions of standardization, provided that the conditions to be relaxed are in some sense artificial. In the example discussed above, breaching one aspect of standardization apparently eliminated an irrelevant, gender-related source of task difficulty, thus resulting in a fairer, more valid assessment of performance. In the example, think of packing speed as the ability to be assessed, and distance from the assembly line as one of the contextual variables under which ability is to be measured and on which the assessment is standardized. Arm length is an examinee characteristic that may affect measurement, but one that is not intrinsically related to the primary focus of measurement: packing speed. In some assessments (of writing ability, for example), distance might be analogous to the examiner’s choice of content or of topics on which the examinee is to write. Arm length would correspond to the examinee’s level of comfort or previous experience with the topic on which he or she is asked to write -- something that is of little interest to the examiner. One way to minimize any potential negative impact of largely irrelevant contextual variables might be to let test takers make certain choices for themselves.
Arguments for (and Against) Permitting Examinee Choice
The call for choice in testing has come from a number of quarters, most notably from the performance assessment arena. As Fitzpatrick and Yen (1995) asserted, offering choices appears to be “a desideratum of the authentic assessment movement” (p. 257). Gordon (1992) for instance, believes that allowing options and choices is a necessary condition for equitable assessment and has called for “self-designated tasks from examinee-generated inventories of
5

knowledge, skill, and understanding” (p. 7). Wiggins (1993) expressed a preference for giving exarninees “an opportunity to show off’ instead of having to undergo a “trial by question” (p. 141), believing that the former might be more likely than the latter to engage examinees.
Discussing learning environments, Snow and Jackson (1993) asserted that one of the factors affecting intrinsic motivation is the degree of control or choice that the learner has. Consistent with this view, Deci and Ryan (1985) provided evidence that when learners are allowed to choose, they exhibit greater motivation and are more likely to persevere at tasks. Other research also seems to support the common-sense notion that students work harder on tasks that are of interest to them (e.g., Hidi & Anderson, 1992). Quite conceivably, this situation might also apply to testing situations.
The call for examinee choice has also come from conventional testing circles. Even though computer adaptive testing tailors questions to examinees’ ability levels, it may not go far enough, according to some. Rocklin and his associates (Rocklin, O’Donnell, & Holst, 1995) implied that test questions could be tailored not only on the basis of difficulty level, but according to other, noncognitive factors as well. For instance, they suggest that permitting examinees to specify the difficulty level of the questions they will answer (self-adapted testing) results in higher test scores (even though adaptive testing should produce the same score for an examinee regardless of the specific questions presented). The researchers suggest that selecting questions so as to standardize the level of difficulty encountered by each examinee (that is, so every test taker answers the same pronortion of items correctly) might not be the best strategy. To them, not allowing such choice seems inconsistent with the increasing encouragement that many students now receive to exercise choice as self-regulated learners.
White (1994) portrayed a similar view of the assessment of writing, as held by some faculty members -- that to fix a topic is to constrain writers’ imagination. Underlying this conviction is an assumption that choosing a topic is itself so important a part of the construct of interest that it should be part of the task. But White disputed this view, feeling instead that this “supposed freedom” is in reality yet another constraint, requiring the writer to guess what the evaluator wants. Furthermore, as Wainer and Thissen (1994) asserted, not everyone is equally proficient at making wise choices, and this propensity seems to vary by gender and ethnicity. They cite numerous instances in which, when allowed to choose, examinees make less-than- optimal choices. The ability to choose well may also differ according to ability, for as White (1985) suggested, the most difficult (essay) questions are often the most interesting/challenging and therefore the most appealing to the most able examinees. This is in fact what Powers, Fowles, Famum, and Gerritz (1992) found for a set of essay prompts developed for a beginning teacher certification test.
Toward Defining: the Circumstances Under Which Examinee Choice Is Appropriate
Bridgeman, Morgan, and Wang (1995) argued that if the purpose of an (essay) assessment is to determine examinees’ ability to organize evidence and present a cogent argument on a topic.

on which they are knowledgeable, choice may be necessary. On the other hand, if an assessment is intended to measure specific knowledge, the choice of questions is best left to the examiner.
Similarly, Burton (1993) expressed a belief that choice is acceptable in situations in which the ability to make good choices is central to the construct being measured, but that it is not acceptable when the objective is to make inferences about knowledge of a domain. She suggested that choice may be necessary, for example, when measuring low-level reading proficiency in a foreign language: unless examinees have some familiarity with the general content, a much higher level of proficiency is required. The same argument has been advanced with regard to measuring writing proficiency (Powers et al., 1992).
Wainer and Thissen (1994) believe that choice is permissible only when “. . .those aspects that characterize the choice are irrelevant to what is being tested” (p. 191). They also attributed to W. B. Schrader another justification for permitting examinee choice. Assuming that outstanding people are usually outstanding on a small number of qualities (and that the purpose of the exam is to identify such people), test takers ought to be allowed to select the tasks on which they can demonstrate their best performances. Similarly, Longford (1993) also suggested that when the goal is to determine strengths, choice may be appropriate, but when the objective is to diagnose weaknesses, permitting examinee choice is probably not an advisable measurement strategy.
Related Research
Several studies have investigated the role of choice in assessment situations. All of the studies cited here have been conducted relatively recently, indicating perhaps a heightened interest in the effects of allowing examinee choice. As suggested in Table 1, these studies have differed in their objectives, their designs, and the kinds of measures that have been investigated. Tests of reading and writing skills and achievement tests in chemistry and history have been the focus of the studies we were able to locate. Most of the studies were of tests that required students to construct responses. Most attempted to estimate the overall effect of allowing choice, most discussed examinee preferences for different content, and some examined the effects of choice on the validity of test scores. One study attempted to determine how examinees go about making their choices. A few addressed the question of who makes good choices.
As can be seen from Table 1, the results of the studies to date have been mixed with respect to the effects of permitting examinee choice. The most succinct summary we can provide is that
l the effects of choice may differ according to the nature of the test: the average effect may be negative for some tests and positive for others
l test takers do not uniformly make good choices: at least some examinees will apparently make poor choices regardless of the nature of the test
l the prevalence of poor choices may vary according to the nature of the test and the characteristics of examinees
7

Table 1
Summary of Studies Investigating Effects of Examinee Choice
Measures/ Subjects
Test Format/ scoring Nature of Choice Results
Possible Study Limitations
Bridgeman, Morgan, Lti Wang (199s)
Advanced Placement Exams in U.S. and European History/ Secondary school history students
Reading: ability to construct meaning from literary, informational, and instructional texts/
00 3rd, 5th, and 8th grade students
Writing: composing persuasive essays/ 11 th graders
Writing: description, comparison, and argumentation/ International students enrolled in an intensive English program at a US. university
Constructed response/ Holistic scoring on a 9-point scale
Constructed response/ 2-, 3-, or 4-point ratings
Gabrielson, Gordon, & Engelha #d (1995)
Constructed response/ Students were assigned to either a 4-point analytical scoring choice or a no-choice condition. in 4 domains: content and Within the choice condition each
~ organization, style, student was given a pair of tasks and ~ conventions, and sentence asked to choose one (60 different pairs formation were constituted).
Constructed response (30- minute essay)
For each of two subject areas, students were presented with two topics (in all, four pairs were constituted). They were asked to read both topics and to choose the question that they felt best prepared to answer. They were then asked to answer both questions.
Fitzpatrick & Yen (1995)
Students received a combination of Ehoice and no-choice reading passages.
Reading passages were differentially popular overall and in their attractiveness to gender and ethnic groups. Differences in performance on choice and nochoice passages were small, inconsistent. There was a modest, but not completely consistent, trend for more able students to choose the more difficult passages, and vice versa.
Polio & Glew (1996)
Students were asked to choose one of three topics
For each of the two subject areas, mean scores were higher on preferred topics by about .3 to .5 sds. For each area about 30% of students - made the wrong choice, that is, got a higher score on the nonpreferred topic. Preferred essays correlated more strongly than did non- preferred essays with other measures.
Very small effects (.Ol to .05 as) were noted in favor of the nocloice condition. -
Students appeared to have little if any difficulty in deciding which topic to write on: on average, little time was taken to choose, but there was significant variance. Students chose mainly on the basis of their familiarity with a topic (or their estimate of how much they could write about it).
Possible unintended effect of allowing students to choose and then requiring them to answer both questions.
Nonexperimental, confounding of passage content and choice condition, not designated to determine if students make good choices,
AI1 writing tasks were in the same (persuasive) mode, one of the most difficult to respond to.
Small, possibly unrepresentative sample. No analysis of test performance attempted.

Table 1 (cont’d)
Measures/ Test Format/ Subjects Scoring Nature of Choice Results
Advanced Placement exams in chemistry, U.S. and European history, comparative government and politics, and U.S. government and politics/ Secondary school students
Advanced Placement exams in chemist@ Secondary school chemistry students
Constructed response/ Holistic scoring on either a 9-point or 15-point scale
Multiple-choice/ Dichotomous (right/wrong)
Advanced Placement exam Constructed response/ in chemistry/ Holistic scoring on a National population of 9-point scale secondary school AP chemistry test takers
Pomplun, Morgan, & Nellikunnell(l992)
Amount of choice varied by exam -- Choices differed by ability level either one of two, one of five, one of performance on multiplechoice six, or two of four. on mandatory free-response questions).
various choice questions were difficulty. The tests differed with who was disadvantaged by allowing
Wang, Wainer, & Thissen (1993)
Students were given three pairs of questions (within a 20-item test) and asked, for each pair, which one they would choose. After responding they were required to answer both questions.
Wang (1996)
Three of five questions.
Not all students chose the items subsequently performed best. differed with respect to the “wiseness” choices made.
Correlation between popularity performance was -.60. Effect greater for middle-ability students high- and low-ability students. combination was chosen about students at different ability levels. teachers and test takers judged to be easier.

Currently, it is possible, therefore (depending on the research one cites), to either strongly favor examinee choice or vigorously oppose it. As more becomes known about the impact of examinee choice under varying circumstances, it seems likely that extreme opinions will moderate, and the question will be phrased not in terms of whether or not choice should be allowed, but rather in terms of (a) under what circumstances choice is acceptable (or even necessary), (b) when it is desirable, and (c) when it is altogether unacceptable.
Obiectives
The overarching objective of the study reported here was to provide some additional information about the effects of allowing examinee choice, thereby helping to inform the issue of when choice may be appropriate and when it may not be. Specifically, we hoped to learn something about each of the following:
l the degree to which examinees (and subgroups of examinees) have preferences among alternative questions
l the effects of choice on level of performance for all examinees as well as for a number of subgroups
l the effects of choice on certain psychometric properties of test scores (e.g., reliability and relations with other variables).
The test studied here was a test of examinees’ ability to generate plausible explanations or hypotheses for given situations. As will be discussed below, this test is quite different from other tests that have been investigated in studies of the effects of examinee choice.
Method
Study Participants
Participants were examinees who took the Graduate Record Examinations (GRE) General Test during the summer and fall of 1994 at approximately 200 computer-based testing centers throughout the United States. The version of the General Test that was administered during this time period included a final, 30-minute experimental section containing generating explanations (GE) items. The GE section was identified as experimental, and examinees were informed that their scores on this section of the test would not be reported.
Instruments
The measure -- “generating explanations” (formerly called “formulating hypotheses”) -- was developed by Frederiksen (1959) and researched by Frederiksen and his colleagues (Frederiksen & Ward, 1978; Ward, Frederiksen, & Carlson, 1980). It can be characterized as a measure of divergent production -- by virtue of both its requirements (to generate multiple responses) and its relationship with measures of the ability to generate ideas. It contrasts, therefore, with most
10

traditional multiple-choice tests inasmuch as the latter tend to draw heavily on the ability to converge on a single correct answer. Performance on the measure, in fact, is only very modestly related to performance on the GRE General Test (Bennett & Rock, 1995; in press).
The measure was administered in a computerized format in which examinees typed, edited, and saved up to 15 hypotheses (each of-15 words or fewer) for each question. Exam&es were given a description of the test at the end of the last operational section of the GRE General Test; an untimed tutorial that provided instructions on use of the computer; and information on how responses would be scored. In scoring, credit was awarded to each plausible, unduplicated hypothesis. Further details on scoring are available in Bennett & Rock (ii press).
Six GE problems were used in the study. Each problem described, in approximately 50 to 150 words, a phenomenon to be explained. Some problems were accompanied by a graph or chart depicting the situation. Every problem concluded with a statement (e.g., “the sharp drop in _ the number of deer reported killed occurred because.. . “) which the examinee was to complete by generating as many possible explanations as he or she could. An abbreviated description of each problem follows (abbreviations to be used henceforth are designated in-bold):
A The number of deer killed by automobiles remained relatively constant over the years, but showed a sharp drop in one year. The sharp drop in the number of deer reported killed occurred because.. .
B Although there were far fewer major Dutch landscape painters than minor ones, of the paintings that have survived, those attributed to major artists greatly outnumber those attributed to minor artists. The apparent disproportion -- the fact that paintings attributed to the relatively few major artists far outnumber attributions to the minor artists - exists because. . .
C The amount of garbage cleaned off beaches rose steadily over a 50.year period. The steady rise in the number of tons of garbage cleaned off of Datar’s beaches occurred because.. .
D The total annual weight of codfish caught by ships sailing from a certain port remained constant over several years but dropped sharply in one year. The sharp drop in the annual tonnage of codfish occurred because.. .
E “Daybooks” (accounts kept by 18th- and early 19th.century silversmiths) were consulted occasionally by scholars and collectors between 1930 and the 1980’s, but not fkom 1983 to 1988. In 1989 a visiting scholar was told that the books were unavailable. This occurred because.. .
F Over a 20-year period the rate of death rate of police officers killed in the line of duty dropped significantly. The drop in the rate of police officers killed in the line of duty occurred because.. .
11

Design
Four different forms of the GE test were spiraled in the experimental section (i.e., they were randomly assigned to examinees). For two of the forms (no-choice), examinees were asked to complete all three problems presented in 30 minutes; for two other forms (choice) they were asked to complete two problems presented in 20 minutes. In a separately timed section they were then shown the final sentences (e.g., “The drop in the rate of police officers killed in the line of duty occurred because . . . “) of three other problems. Exam&es were then asked to read the directions and select one of the three alternative questions and to answer it. The level of choice is similar to that employed in operational test settings, for example, in the College Board’s Advanced Placement Program, and was thus believed to allow a reasonable degree of latitude. The degree of choice allowed here was also believed to differ suf?iciently from a no-choice situation to enable the detection of any practically significant effect of allowing choice.’ The basic design is shown in the following:
Test Form Choice Problems
1 No AB,andC 2 No D,E,andF 3 Yes 4B+d
(C, D, or E) 4 Yes D, E, and
WLorB) Study Design
The design resulted in each examinee taking one of several possible combinations of items. Exam&es in the no-choice condition answered either questions A, B, and C or questions D, E, and F. Those in the choice condition answered (1) A, B, and C, (2) A B, and D, (3) A B, and E, (4) D, E and F, (5) D, E, and A or (6) D, E, and B.
Results
Samnle Descrintion
Characteristics of the sample on which analyses are based are shown in Table 2. Slightly fewer than half of the exam&es to whom the GE test was offered actually chose to respond to it.
’ In each of the choice conditions, the standard tutorial and the standard test directions were given, as in the no-choice conditions. Next, however, slightly modified section directions were presented, informing exam&es that they would have 20 minutes to answer the next two required items. After they had completed these items, examinees were shown the three choice items and given up to four minutes to select one to answer. They had 10 minutes to answer the item chosen.
12

In addition, when all data were examined, it was clear that, although some examinees responded, they spent minimal time and effort attempting the items, reading the test directions, or studying the interface tutorial. Others either submitted only a single response (a maximum of 15 was possible) or entered humorous or nonsensical responses. Cases were deleted so that the final sample included only examinees who offered more than a single serious response and who spent at least a minimal amount of time on the tutorial, the directions, and in trying items. Additionally, examinees in the choice condition who failed to follow instructions regarding choice (e.g., they answered more than one of the alternative choice questions) were deleted. Further details (and rationale) for the exclusion of study participants are given by Bennett & Rock (in press). Although the final choice and no-choice samples are similar with respect to several important characteristics, they do differ slightly, but significantly, with regard to average GRE verbal and quantitative scores. This difference results from the exclusion of examinees who did not comply with the directions for choosing, as these participants had slightly lower test scores on average.
Analysis of Examinee Choices
Table 3 shows that the items in each choice form were differentially attractive. One item (“police”) appeared to be especially appealing when offered in combination with “deer” and “paintings,” the latter being quite unpopular overall. As Tables 4-7 reveal, however, choices differed somewhat according to examinee characteristics. For instance, the item on “fish” was chosen less often by females than males relative to their choice of the item about “daybooks” (Table 4). There were also significant differences among ethnic groups with respect to their choice of items about “police,” “ deer,” and “paintings” (Table 5). The patterns of choice were also significantly different according to undergraduate major field (Table 6) -- “paintings,” for example, being relatively more attractive to humanities majors than to other groups. Examinees who chose to answer the “paintings” question were, on average, the most able of any groups according to their GRE scores, and those who chose “beaches” were the least able (Table 7).
We also attempted to describe examinee choices in a more multivariate fashion by trying to identify clusters of examinees making similar choices. To this end we attempted to segment the total sample into subgroups by using CHAID (Chi-squared automatic interaction detector); Magidson, 1993. The objective was to form the subgroups on the basis of variables that best predicted examinees’ choices of items to answer. Sex, degree aspirations, GRE scores, and undergraduate major were used as the predictors. For each of the two choice forms, undergraduate major was the primary determinant of examinee clusters (i.e., the first variable selected by CHAID to classify examinees). Several other variables were instrumental in effecting further subclassifications. However, when subjected to verification by analysis on random halves of the samples, the results were not at all consistent for either form of the test. And, even though undergraduate major was, for each test form and each random sample of examinees, the variable that best defined choices, the groupings of majors were not consistent across samples.
13

Table 2
Characteristics of Choice Sample vs. No-Choice
Characteristic Choice Sample No-choice Sample
(lJ = 2429) (IJ = 4720)
Sex (% female) 57 58
Ethnicitv (%)
American Indian
Black
Asian American
white
Hispanic’
Undergraduate Major (%)
Life Science
Physical Science
Engineering
Social Science
Humanities
Education
Business
Other
Undergraduate Grade Average (%)
Mean overall (sdJ2
Mean in major (sdJ2
GRE General Test
Mean GRE verbal (a
Mean GRE quantitative (sd)
Mean GRE analytical (sd)
1 1
4 5
5 4
85 84
6 6
25 28
9 8
8 8
22 20
16 17
8 9
4 4
7 7
5.3(1.1) 5.2(1.1)
5.7(1.0) 5.7(1.0)
512(111) 505(111)
572( 133) 561( 135)
595( 136) 589( 136)
Note. Ns for each characteristic are based on variable numbers of subjects for whom data were available. Nearly 100% of the samples reported their gender, about 94% their ethnicity, about 88% their undergraduate major, about 49% their undergraduate grades. GRE scores were available for more than 99% of the sample.
‘Includes Mexican American, Puerto Rican, and other Hispanics.
*Grades were reported on a 7-point scale, with A = 7, A- = 6, B = 5, B- = 4, C = 3, C- = 2, D or lower = 1.
14

Table 3
Percentages of Examinees Choosing Each Problem
Test Form N, Percentage Choosing Each Problem
3 1242 Beaches (48) Fish (20) Books (32)
4 1187 Police (76) Deer (20) Paintings (4)
Table 4
Percentages of Females and Males Choosing Each Generating Explanations Items
Group Form/Item
Form 3
Beaches Fish Books x2
Female (n=703)
Male @=535)
45 16 39 p<.OOl
51 25 23
Form 4
Police Deer Paintings
Female @=674) 76 19 5 n.s.
Male (r~=5 12) 76 20 3
15
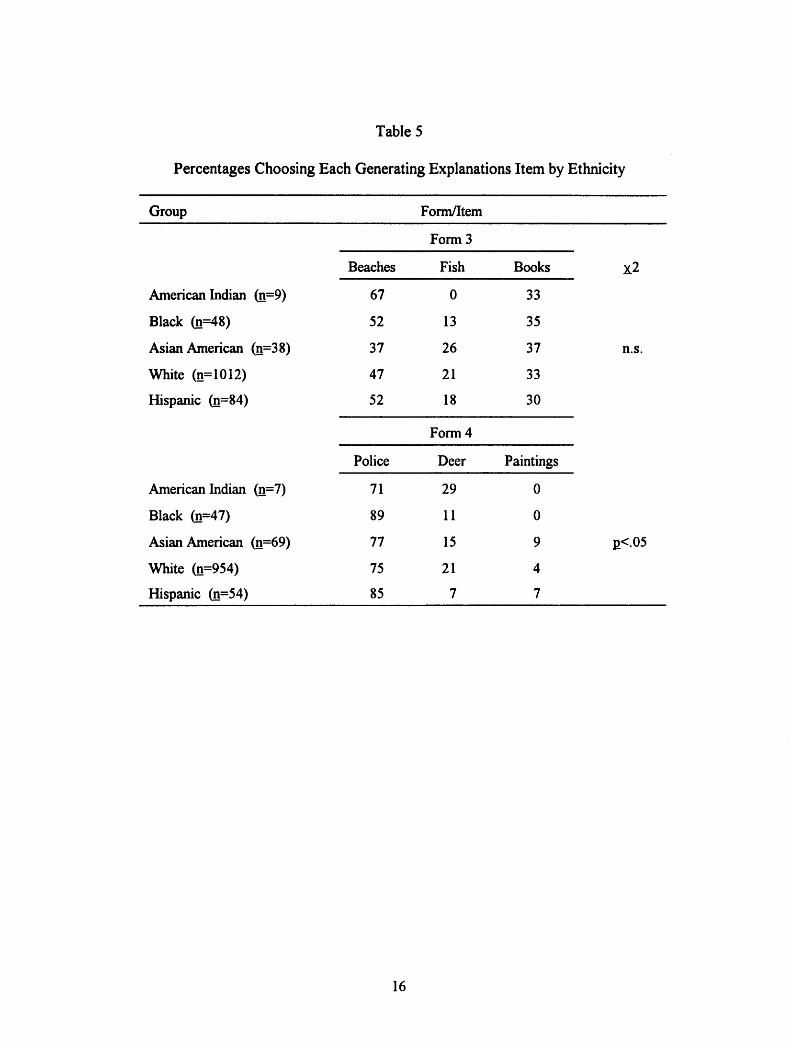
Table 5
Percentages Choosing Each Generating Explanations Item by Ethnicity
Group For&Item
Form 3
Beaches Fish Books x2
American Indian (n=9) 67 0 33
Black (n=48) 52 13 35
Asian American (n=38) 37 26 37
White (1~=1012) 47 21 33
Hispanic (J1=84) 52 18 30
n.s.
Form 4
Police Deer Paintings
American Indian (n=7) 71 29 0
Black (n=47) 89 11 0
Asian American (L1’69) 77 15 9 EC.05
white &l=954) 75 21 4
Hispanic (n=54) 85 7 7
16

Table 6
Percentages Choosing Each Generating Explanations Item by Undergraduate Major Field
Major Field Form/Item
Life Science (n=284)
Physical Science @=97)
Engineering (n=84)
Social Science @=23 1)
Humanities &I= 180)
Education (n=90)
Business (n=5 6)
Other (n=84)
Life Science (~=267)
Physical Science (11=96)
Engineering @=lOl)
Social Science (n=246)
Humanities b=158)
Education (n=92)
Business (n=35)
Other @=74)
Form 3
Beaches Fish Books X2
44
45 28
58 26
48 13
38 18
63 9
41 20
37 23
29
Form 4
27
27
16
39
44
28
39
40
Police Deer Paintings
71
72
79
80
68
80
89
84
28 1
25 3
20 1
17 4
17 15
16 3
9 3
13 3
PK.001
PC.00 1
17

Table 7
GRE General Test Scores by Choice of Generating Explanations Items
GRE General Test Score Form/Item
Form 3
Beaches Fish Books F
GRE verbal
GRE quantitative
GRE analytical
496( 112) 524( 105) 532( 111) PC001
563( 130) 603(119) 565( 130) p<.OOl
569( 136) 629( 129) 606( 132) p?OOl
Form 4
Police Deer Paintings
GRE verbal
GFW quantitative
GRE analytical
501(110) 524( 104) 593( 116) Iz<.OOl
564( 140) 600( 122) 601(142) pc.001
585( 138) 635( 124) 656( 123) QC.001
Note. Table entries are mean GRE scores with standard deviations in parentheses.
18

Performance on Choice and Reauired Items
Table 8 shows the performance of all examinees on each of the two choice forms and on each of the two no-choice forms. The status of each item (i.e., whether it was required or whether it was an optional, choice item) is also indicated. As is clear (from the statistics from the no-choice forms), the items were differentially difficult. For instance, the difference between the easiest item (deer) and the most difficult (paintings) was about .7 sd units, a relatively large difference in terms of effect sizes (Cohen, 1977). Table 8 also suggests that the four items that were required on both the choice and the no-choice forms (deer, paintings, fish, and books) were easier for students who took the choice forms than for those who took the no-choice forms -- by, on average, approximately . 1 sd units. These differences result almost entirely from our deletion from the sample of (the lower performing) examinees who failed to follow our instructions to answer only three items. Before the deletion of these noncomplying examinees, the choice and no-choice samples performed virtually identically on all but one of the items. Inexplicably, the deer item was slightly (. 1 sd), but significantly (pc.001) easier for examinees taking the choice form. Of more interest, however, is that when comparisons are made within choice forms (where samples are comparable), performance was slightly but significantly (p<.OOl) higher (by . 1 to .2 & units) on each of the four items when examinees were allowed a choice of the item. On average, then, choice was beneficial to examinees.
This result was confirmed by applying a partial-credit item response model (Masters, 1982) to a portion of our data, specifically to item C in forms 1 and 3 and to item F in forms 2 and 4. The assumption underlying this analysis was that the groups taking the different forms (1 and 3 or 2 and 4) were equivalent in terms of latent trait distributions. (As we know, however, this assumption is questionable because we deleted the records of some examinees who took the choice forms.) It was also assumed that the slope parameter for all items was 1 .O. This analysis too suggested that for each of these two items, allowing choice made the item slightly easier.
Pooularitv of Items Versus Performance
?
Table 9 reveals that, for test form 3, the relationship between the extent to which examinees chose an item and the difficulty of the item (as determined fi-om performances under a no-choice condition) was not entirely consistent. Although the least popular item (paintings), chosen by only 4% of the sample, was also by far the most difficult item, there was a reversal for the other two items on this form. Some of the inconsistency between popularity and difficulty may be due, as shown later, to differences in the ability levels of examinees making particular choices. For the second form, however, the popularity of items was completely consistent with their difficulty, but in an unexpected direction: the harder the item (when required for all examinees), the more popular the item when choice was allowed.
19

Table 8
Performance on Generating Explanations Items by Test Form and Choice Condition
No Choice Choice
Item
Deer
StatuS
m
sd
n
Form 1 Form 2 Form 3 Form 4
Required Required Choice
6.3 - 6.6 7.1
3.0 - 3.2 3.4
2351 - 1242 233
Paintings
St&US Required
m 4.3
sd 2.5
J1 2351
-
-
-
Required Choice
4.8 5.2
2.9 2.0
1242 48
Beaches
status Required
m 5.3
sd 3.0
-
-
Choice
6.0
3.6
-
-
n 2351 - 592 -
Fish
status m -
sd
n
-
-
-
Required Choice Required
6.1 6.9 6.4
3.0 3.3 3.2
2369 249 1187
Books
status m _
sd
11
-
-
-
Required Choice Required
5.7 6.6 6.0
3.1 3.6 3.2
2369 401 1187
Police
status m _
sd
II
-
-
-
Required
6.0
3.3
2369
-
-
-
Choice
6.6
3.5
906
20
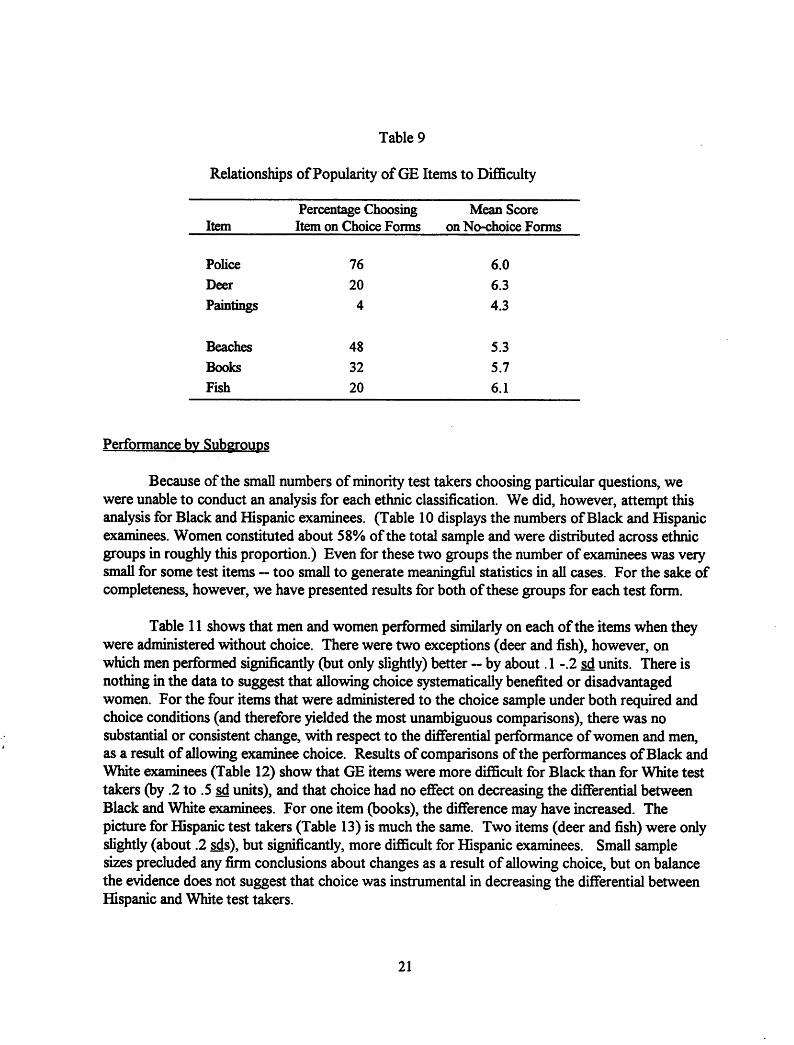
Table 9
Relationships of Popularity of GE Items to Difliculty
Item Percentage Choosing Mean Score Item on Choice Forms on No-choice Forms
Police 76 6.0 Deer 20 6.3 Paintings 4 4.3
Beaches 48 5.3 Books 32 5.7 Fish 20 6.1
Performance bv Subgroups
Because of the small numbers of minority test takers choosing particular questions, we were unable to conduct an analysis for each ethnic classification. We did, however, attempt this analysis for Black and Hispanic examinees. (Table 10 displays the numbers of Black and Hispanic examinees. Women constituted about 58% of the total sample and were distributed across ethnic groups in roughly this proportion.) Even for these two groups the number of examinees was very small for some test items - too small to generate meaningful statistics in all cases. For the sake of completeness, however, we have presented results for both of these groups for each test form.
Table 11 shows that men and women performed similarly on each of the items when they were administered without choice. There were two exceptions (deer and fish), however, on which men performed significantly (but only slightly) better -- by about . 1 -.2 sd units. There is nothing in the data to suggest that allowing choice systematically benefited or disadvantaged women. For the four items that were administered to the choice sample under both required and choice conditions (and therefore yielded the most unambiguous comparisons), there was no substantial or consistent change, with respect to the differential performance of women and men, as a result of allowing examinee choice. Results of comparisons of the performances of Black and White examinees (Table 12) show that GE items were more diicult for Black than for White test takers (by .2 to .5 sd units), and that choice had no effect on decreasing the diierential between Black and White examinees. For one item (books), the difference may have increased. The picture for Hispanic test takers (Table 13) is much the same. Two items (deer and fish) were only slightly (about .2 s&), but significantly, more difficult for Hispanic examinees. Small sample sizes precluded any firm conclusions about changes as a result of allowing choice, but on balance the evidence does not suggest that choice was instrumental in decreasing the differential between Hispanic and White test takers.
21

Table 10
Numbers of Examinees Upon Whom Item Score Comparisons Are Based
Choice Status
Group Required Required
(No-choice Form) (Choice Form) Choice
(Choice Form)
Blade 115
Hispanic 116
white 1,891
48 5
4
201
84
1,012
Black
Hispanic
115
116
48 0
84 4
1,012 37
Paintings
Fish
Police
white 1,891
Black 115
Hispanic 116
white 1,891
25
44
472
Black 124 47 6
HiSpaniC 149 54 15
white 1,867 954 209
Black 124 47 17
Hispanic 149 54 25
white 1,867 954 331
Black 124
Hispanic 149
white 1,867
42
46
716
-
-
-
22

Table 11
Mean Generating Explanations Item Scores by Gender and Choice Condition
Choice Status
Item Females/ Males
Required (No-choice Form)
Required (Choice Form)
Choice (Choice Form)
Deer
Paintings
Beaches
Fish
Books
Police
F
M
d
F
M
d
F
M
d
F
M
d
F
M
d
F
M
d
6.1(3.0)
6.5(3.1)
-. 12*
4.3(2.5) 4.tq2.9)
4.3(2.6) 4.9(2.9)
-.02 -.03
5.3(3.0)
5.3(3.1)
+.Ol
6.0(3.1)
6.4(3.0)
-. 13”
5.6(3.2)
5.7(3.1)
-.02
5.9(3.2)
6.1(3.4)
-.07
6.4(3.2)
6.9(3.2)
-. HI**
6.2(3.2)
6.8(3.2)
-. 19”
5.8(3.2)
6.2(3.2)
-.12
-
6.7(3.3)
7.5(3.4)
-.25
5.5(2.0)
4.5(1.8)
+.56
6.1(3.5)
5.9(3.7)
+.06
7.0(3.3)
6.8(3.3)
+.07
6.3(3.7)
7.1(3.5)
-.21
6.4(3.5)
6.7(3.5)
-.07
d = mean of female test takers minus mean of male test takers divided by the within-group d. @s are in parentheses.
“pc.05, **p<.o1
23
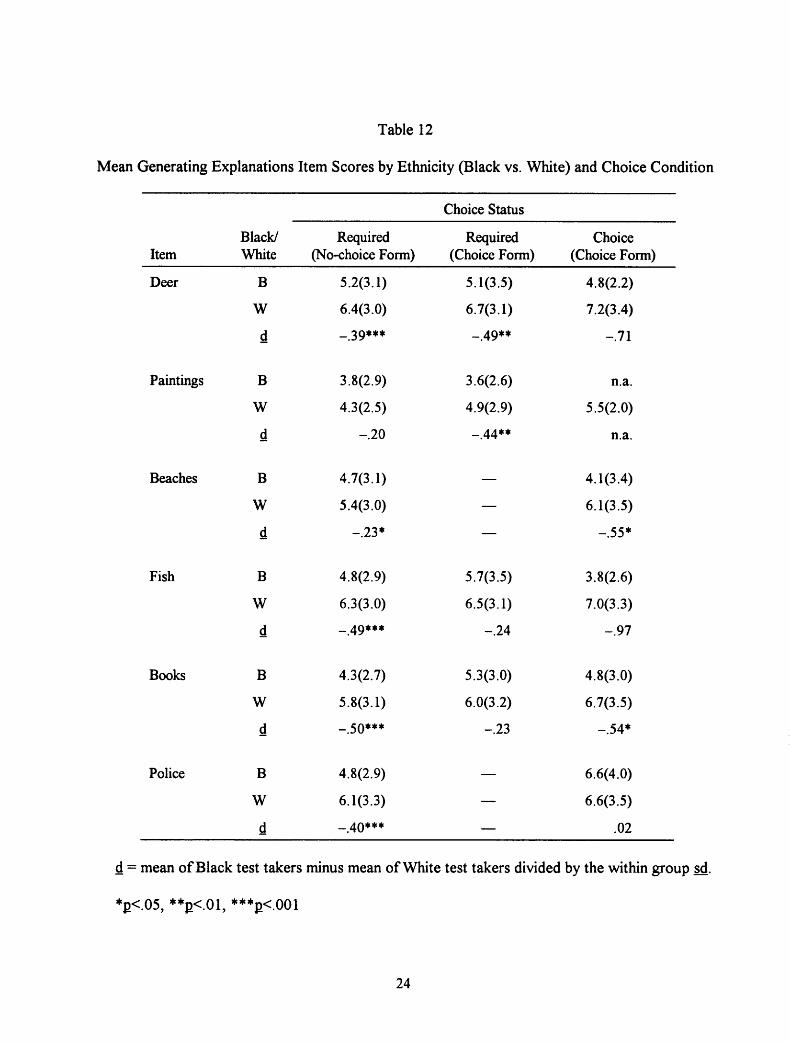
Table 12
Mean Generating Explanations Item Scores by Ethnicity (Black vs. White) and Choice Condition
Choice Status
Item Black/ Required White (No-choice Form)
Required (Choice Form)
Choice (Choice Form)
Deer B
W
d
Paintings B
W
d
Beaches B
W
d
Fish B
W
d
Books B
W
d
Police B
W
d
5.2(3.1)
6.4(3.0)
-.39””
3.8(2.9)
4.3(2.5)
-.20
4.7(3 * 1)
5.4(3.0)
-.23*
4.8(2.9)
6.3(3.0)
-*49***
4.3c2.7)
5.8(3.1)
-.50***
4.8(2.9)
6.1(3.3)
-.40***
5.1(3.5)
6.7(3.1)
-.49**
3.6(2.6)
4.9(2.9)
-.44”
5.7(3.5)
6.5(3.1)
-.24
5.3(3.0)
6.0(3.2)
-.23
-
4.8(2.2)
7.2(3.4)
-.71
n.a.
5.5(2.0)
n.a.
4.1(3.4)
6.1(3.5)
-.55’
3.8(2.6)
7.0(3.3)
-.97
4.8(3.0)
6.7c3.5)
-.54*
6.6(4.0)
6.6(3.5)
.02
d = mean of Black test takers minus mean of White test takers divided by the within group sd.
*p<.o5, **p<.o1, ***p<.oo1
24

Table 13
Mean Generating Explanations Item Scores by Ethnicity (Hispanic vs. White) and Choice Condition
Choice Status
Item Hispanic/ Required
White (No-choice Form) Required
(Choice Form)
_
Choice (Choice Form)
Deer H
W
d
5.8(2.9)
6.4(3.0)
-.18*
6.3(3.7)
6.7(3.1)
-. 13
8.5(4.4)
7.2(3.4)
.39
Paintings H
W
d
4.1(2.2)
4.3(2.5)
-.09
4.4(2.8)
4.9(2.9)
-.15
3.8(1.0)
5.5(2.0)
-.89***
Beaches H
W
d
5.2(3.1)
5.4(3.0)
-.04
6.3(4.1)
6.1(3.5)
-.07
-
-
-
Fish H
W
d
5.7(2.8)
6.3(3.0)
-.20*
6.9(3.6)
6.5(3.1)
-.13
6.1(3.6)
7.0(3.3)
-.26
Books H
W
d
5.5(3.3)
5.8(3.1)
-.ll
6.3(3.4)
6.0(3.2)
.09
5.3(3.8)
6.7(3.5)
-.40
Police H
W
d
6.0(3.6)
6.1(3.3)
-.03
6.9(3.5)
6.6(3.5)
.09
-
-
d = mean of Hispanic test takers minus mean of White test takers divided by the within group &.
*p c.05, **p c.01, ***p c.001
25

The final subgroup analysis of GE items was by undergraduate major area. An analysis of variance revealed that, for all but two of the items (fish and police), there were significant differences among undergraduate major fields when examinees were required to answer on the no-choice test forms. As suggested by F ratios, the differences among groups were smaller (and nonsignificant) on the choice forms -- both when items were required and when they were optional. The lack of any significant differences among groups on the choice forms may have been, however, largely a function of our having deleted examinees who did not follow directions. A group’s performance was more often higher when an item could be chosen instead of when it was required, but the patterns were not consistent from item to item.
Correlations With Other Variables
Correlations of GE item scores with GRE scores and with undergraduate grade averages are shown in Table 14. When examinees were required to answer items -- either on the choice forms or on the no-choice forms -- the correlations were modest, ranging from .05 to .22 on the no-choice forms and from .04 to .22 on the choice forms. Allowing examinee choice did not seem to have any dramatic effect on these correlations. (We note, however, that correlations were slightly higher for three of four items when examinees chose them than when they were required, but the reverse was true for the fourth item (paintings), for which we had comparatively little data and for which performance was considerably more restricted in range.)
It was also possible to examine, in a limited way, the effects of choice on the internal consistency of GE measures. This was accomplished by correlating the combined performance on the first two, required items (deer and paintings) with the third item (beaches), which was required on the no-choice form and optional on the choice form. This correlation was significantly higher (g<.OOl) when examinees were allowed to choose the third item instead of when it was required (L= .71 vs. .78). For the other form of the test (in which fish and books were the required items and police the third item), the correlation was also slightly higher under the choice condition than in the required one (I= .74 vs. .77), but not significantly different statistically. Thus there was, at the least, no evidence that allowing choice disturbed the internal consistency of the GE measures, and there was some indication that it may have improved them.
Timinq
By analyzing the amount of time that examinees took to answer questions under choice and no-choice conditions, we hoped to provide corroborating evidence of the effects of choice. To this end, the amount of time that examinees took to answer each question was captured. Using the two choice forms, we compared times for the four items that were choosable in one form and required in the other. The results revealed that for three of the four items the average amount of time taken to answer the item was significantly less (p < .Ol) when the item was chosen than when it was required. For the fourth item, there was no significant difference. These results were rendered equivocal, however, by the fact that there appeared to be an
26

Table 14
Correlations of Generating Explanations Items with GRE Scores and Undergraduate Grade Point Average (by Choice Condition)
Item
Form Deer Paintings Beaches Fish Books Police
1. (No choice) GRE-V .22 .18 .13 GRE-Q .15 .09 .06 GRE-A .19 .14 .09 UGPA .07 .09 .09
- -
- -
- -
- -
2. (No choice) GRE-V - - GRE-Q - - GRE-A - - UGPA - -
- .21 .22 .16 - .15 .12 .12 - .16 .19 .15 - .05 .07 .09
Required Choice
3. (Choice) GRE-V .22 .15 GRE-Q .21 .12 GRE-A .19 .12 UGPA .13 .lO
Choice
4. (Choice) GRE-V
GRE-Q
GRE-A
UGPA
.24 .lO”
.24 -.04”
.27 .ll”
.20 -.27”
.lO
.06”
.05”
.OS”
-
-
-
-
.26 .29
.16 .22
.19 .28
.13” .Ol Iw
Required
.19 .20
.13 .15
.lO .15
.04” .04”
-
-
-
-
-
-
-
-
.15
JO
.08
-.04”
Note. All correlations except those designated by n.s. are significant at the .05 level or beyond.
27
(unanticipated) order effect: In each of the no-choice forms, examinees took progressively less time on each subsequent item -- possibly, we speculate, because of either a practice effect or waning motivation. Because the choice items were always given last, the order of administration and choice condition were confounded and, therefore, no conclusions were possible from our data about the effects of choice on time needed to answer questions.
Discussion
Summary
The GE items that were the focus of our study varied dramatically with respect to the extent to which they were chosen by (attractive to) examinees. The implication of this finding is that examinees would probably welcome having a choice of items. Although they might appreciate having a choice of questions to answer, our results do not suggest that, as a group, examinees would make optimal choices. For instance, there was no consistent tendency for examinees to choose easier items over more difficult ones. In fact, except for one very unpopular, difficult item, there appeared to be a tendency to choose difficult items more often than easier ones.
There was also ample evidence in our data that items were differentially attractive to different subgroups of examinees, particularly according to undergraduate area of study. Test takers’ choices were also associated with their ability levels, as indexed by performance on the GRE General Test, which measure largely unrelated constructs. In particular, there was some indication, as noted in another earlier effort (Powers et al., 1992), that the most able students were more likely to choose unpopular alternatives than were their less able counterparts, possibly because of a perceived greater challenge.
Whether or not every examinee made optimal choices, each item was, on average, somewhat easier when it was chosen instead of required. The effect varied somewhat from item to item, but on average was about . l-.2 & -- an effect that can be considered small but noteworthy by most standards.
Subgroups differed with respect to their average performances on GE items. Although there was very little difference in the scores of men and women on the items, average scores did differ by ethnicity. Hispanic test takers performed very nearly as well, on average, as White examinees, but Black examinees did slightly less well on average than their White counterparts. Performances also differed significantly by undergraduate major area of study.
The evidence was less clear with regard to the effects of allowing choice on subgroups of test takers. For men and women, the ability to choose their questions did little or nothing, on average, to change their (nearly equal) standing relative to one another. Because of smaller sample sizes and less stable estimates, the results for ethnic subgroup comparisons were less conclusive. Overall, differences in favor of White over Back test takers tended to be at least as
28

large when choice was offered as when it was not. For Hispanic examinees, the results were inconsistent, but, overall, choice did not seem to have any differential effect on their test performance relative to that of White test takers. The analysis of subgroups by undergraduate
. major was inconclusive.
Finally, there was some evidence that the reliability (internal consistency) of GE items may have increased when choice was permitted. This in turn may have accounted for the slightly, but not consistently, higher correlations of GE performance with indicators of academic ability (GRE scores and grades). To the extent that performance is more stable over items, choice may render the GE measure a better indicator of the construct of interest.
Implications
Perhaps the most consistent finding was that performance was higher, on average, for every item studied when examinees were allowed to choose an item from among a set than when they were required to answer an item. Apparently, when allowed a choice, at least a portion of examinees were able to avoid answering an item on which their performance would have been worse (or succeeded in choosing an item on which their performance would be better) than that of their fellow test takers, thus increasing the average performance of the group. A major implication of this finding stems from the apparent movement toward more complex assessments of performance. It appears that educational assessment in general, and the GRE Program in particular, is moving away from traditional multiple-choice formats to methods that are more performance based in nature (Aschbacher, 1991). The GRE Program, for instance, has invested relatively heavily in the development of measures that require examinees to construct responses, and most recently has endorsed the development of a GRE writing measure, which will require examinees to develop an extended response in the form of an essay. Many believe that these more complex assessments offer a number of advantages over conventional multiple-choice tests. Despite their advantages, however, these assessments often lack some of the desirable qualities (e.g., breadth of content coverage) that have made multiple-choice measures so prevalent.
One major drawback of many performance assessments is their limited generalizability from one task to another. That is, performance is often highly dependent on the particular task given: Typically, questions are not interchangeable. Moreover, because of their complexity, these assessments are usually rather time-consuming, thus restricting the number of tasks that can be posed. These limitations have been noted with some frequency (e.g., Bennett, 1993; Dunbar, Koretz, & Hoover, 1991; Linn, 1993) in a wide variety of contexts: writing assessments @eland, Camp, Jones, Morris, & Rock, 1987) hands-on science exercises (Shavelson, Baxter, & Pine, 1992), performance tasks in a military setting (Shavelson, Mayberry, Li, & Webb, 1990), and clinical measures in medical licensure exams (Swanson, Norcini, & Grosso, 1987). Linn (1993) concluded that
. . . low levels of generalizability across tasks limit the validity of inferences about performances for a domain and pose serious problems regarding comparability and
29
fairness to individuals who are judged against petiormance standards on a small number, and perhaps different set, of tasks (p. 13).
Limited generalizability is to some degree apparent also in the measures being developed for the GRE Program. In a recently reported GRE Board-sponsored study, for example, Bennett and Rock (1995) found that, for each of two different formats of a test of the ability to formulate hypotheses (the kind of item we have referred to as “generating explanations” in our current study), a significant portion of variation (22% to 24%) was due to a person-by-question interaction. In practical terms, this means that an examinee’s performance depends to a practically significant degree on the particular items administered. To the extent that examinee choice enables at least some examinees to sidestep questions (or content) that are, by chance, outside the realm of their experience, examinee choice may be a legitimate testing tool. Vigilance will be needed, however, to ensure that choice does not inadvertently disadvantage some test takers.
Conclusion
This study has, we believe, added modestly to the available information about the potential effects of allowing examinee choice. It is clear, however, that considerably more work will be needed to understand (a) the role that examinee choice might play in standardized testing and (b) the effects it may have on examinees and on the psychometric quality of the tests they take. Further explication will be needed to sort out the circumstances for which choice may enhance the psychometric properties of a test as well as the conditions under which choice might instead constitute an irrelevant source of variation, and possibly unfairness, in test performance.
Next steps in research on examinee choice might be (a) investigations involving a variety of different sorts of tests, (b) studies varying the degree or latitude of examinee choice, (c) documentation of the bases on which examinees make choices (and validation of the extent to which these factors facilitate sound choices), and (d) further effort to assess the effects of examinee choice on test validity (when a variety of informative criteria are available).
30
References
Aschbacher, P. R. (199 1). Performance assessment: State activity, interest, and concerns. Applied Measurement in Education. 4, 275-288.
Bennett, R. E. (1993). On the meanings of constructed response. In R. E. Bennett & W. C. Ward (Eds.), Construction vs. choice in cognitive measurement: Issues in constructed response. uerformance testing. and nortfolio assessment (pp. l-27). Hillsdale, NJ: Erlbaum.
Bennett, R. E., & Rock, D. A. (1995). Generalizability, validity, and examinee perceptions of a computer-delivered formulating-hypotheses test. Journal of Educational Measurement, 32, 19-36.
Bennett, R. E., & Rock, D. A. (in press). Examining the validity of a comouter-based generating explanations test in an operational setting (GRE Report No. 93-01). Princeton, NJ: Educational Testing Service.
Breland, H. M., Camp, R., Jones, R. J., Morris, M. M., & Rock, D. A. (1987). Assessing writing skill (Research Monograph No. 11). New York: College Entrance Examination Board.
Bridgeman, B., Morgan, R., & Wang, M. (1996). Choice among essay tonics: Imnact on performance and validity (ETS Research Report 96-4). Princeton, NJ: Educational Testing Service.
Burton, N. (1993, August 3). Notes from our session on test standardization. (Unpublished memorandum.)
Cohen, J. (1977). Statistical Dower analvsis for the behavioral sciences (Rev. ed.). New York: Academic Press, Inc.
Deci, E. L., & Ryan, R. M. (1985). Intrinsic motivation and self-determination in human behavior. New York: Plenum Press.
Dunbar, S. B., Koretz, D., & Hoover, H. D. (1991). Quality control in the development and use of performance assessments. Annlied Measurement in Education. 4, 289-304.
Fitzpatrick, A. R., & Yen, W. M. (1995). The psychometric characteristics of choice items. Journal of Educational Measurement, 32(3), 243-259.
Frederiksen, N. (1959). Development of the test “Formulating Hypotheses”: A progress renort (Office of Naval Research Technical Report, Contract Number-2338[00]). Princeton, NJ: Educational Testing Service.
31

Frederiksen, N., & Ward, W. C. (1978). Measures for the study of creativity in scientific problem-solving. Anplied Psychological Measurement. 2(l), l- 14.
Gabrielson, S., Gordon, B., & Engelhard, G. (1995). The effects of task choice on the quality of writing obtained in a statewide assessment. &plied Measurement in Education. 8(4), 273-290.
Gordon, E. W. (1992). Imnlications of diversitv in human characteristics for authentic assessment. (CSE Technical Report 341). Los Angeles: National Center for Research on Evaluation, Standards, and Student Testing (CRESST), University of California, Los Angeles.
Guion, R. M. (1974). Open a new window: Validities and values in psychological measurement. American PsvcholoPist. 29, 287-296.
Gulliksen. H. 0. (1950). A theory of mental tests. New York: Wiley. (Reprinted, 1987, Hillsdale, NJ: Erlbaum).
Hidi, S., & Anderson, V. (1992). Situational interest and its imnact on reading and exnositorv writing. In R. A. Renninger, S. Hidi, & A. Krapp (Eds.), The role of interest in learning and development (pp. 215-238). Hillsdale, NJ: Erlbaum.
Linn, R. L. (1993). Educational assessment: Expanded expectations and challenges. Educational Evaluation and Policv Analvsis. 15, 1-16
Longford, N. T. (1993, June 2 1). Review of Wainer & Thissen “On examinee choice in educational testing.” Princeton, NJ: Educational Testing Service.
Masters, G. (1982). A Rasch Model for partial credit scoring. Psychometrika 47; 149-74.
Magidson, J. (1993). SPSSB for WindowsTM CHAIDTM. Chicago: SPSS Inc.
Polio, C., & Glew, M. (1996). ESL writing assessment prompts: How students choose. Journal of Second Language Writing. 5(l), 35-49.
Pomplun, M., Morgan, R., Nellikunnel, A. (1992). Choice in advanced placement tests (Unpublished Statistical Report SR-92-5 1). Princeton, NJ: Educational Testing Service.
Powers, D. E., Fowles, M. E., Farnum, M., & Gerritz, K. (1992). Giving a choice of tonics on a test of basic writing skills: Does it make any difference? (Research Report No. RR-92- 19). Princeton, NJ: Educational Testing Service.
Rocklin, T. R., O’Donnell, A. M., & Holst, P. M. (1995)Effects and underlying mechanisms of self-adapted testing. Journal of Educational Psvchologv. 87(l), 103- 116.
32

Shavelson, R. J., Baxter, G. P., & Pine, J. (1992). Performance assessments: Political rhetoric and measurement reality. Educational Researcher. 2 l(4), 22-27.
Shavelson, R. J., Mayberry, P., Li, W., & Webb, N. M. (1990). Generalizability of military performance measurements: Marine Corps riflemen. Militarv Psvcholonv. 2, 129-144.
Snow, R. E., & Jackson, D. N. (1993). Assessment of conative constructs for educational research and evaluation: A catalogue (CSE Technical Report 354). Los Angeles: National Center for Research on Evaluation, Standards, and Student Testing (CRESST), University of California, Los Angeles.
Swanson, D., Norcini, J., & Grosso, L. (1987). Assessment of clinical competence: Written and computer-based simulations. Assessment and Evaluation in Higher Education. 12, 220-246.
Wainer, H., & Thissen, D. (1994). On examinee choice in educational testing (GRE Report No. 91-17, ETS Research Report RR-94-3 1). Princeton, NJ: Educational Testing Service.
Wang, X. B. (1996, April). Investigating allowing examinees to choose constructive response items on a test Paper presented at the American Educational Research Association, -* New York City.
Wang, X. B., Wainer, H., & Thissen, D. (1993). On the viability of some untestable assumntions in eauating exams that allow examinee choice (ETS Technical Report RR-93-21). Princeton, NJ: Educational Testing Service.
Ward, W. C., Frederiksen, N., & Carlson, S. B. (1980). Construct validity of free- response and machine-storable forms of a test. Journal of Educational Measurement. 17, 1 l-29.
White, E. M. (1985). Teaching and assessing writinp: Recent advances in understandinn, evaluating. and imnroving student nerformance. San Francisco: Jossey-Bass Publishing.
White, E. M. (1994). Teaching and assessing writing;: Recent advances in understandin% evaluating. and improving student performance (2nd ed.). San Francisco: Jossey-Bass Publishing.
Wiggins, G. (1993). Assessing student performance: Exploring the purnose and limits of testing. San Francisco: Jossey-Bass Publishing.
33


![Welcome [domoca.org] · Divergent Thinking Divergent Thinking • An individual starts with one idea • Then diverges into several different idea. For most people, the right side](https://static.fdocuments.us/doc/165x107/5f57b22818a76210b8695d68/welcome-divergent-thinking-divergent-thinking-a-an-individual-starts-with.jpg)