Effects of entry of microfinance institutions on market ...
38
Effects of entry of microfinance institutions on market structure in the retail banking industry. Evidence from Colombia Laura Capera 1 a Tilburg School of Economics and Management. Warandelaan 2 5037AB Tilburg Abstract Microfinance institutions (MFIs) focus on a segment of the population that is typically unattended by mainstream banks due to lower income, lack of collateral or unreliable in- formation about payment behavior. In recent years, these institutions have undergone a transition from non profit organizations into regulated (for profit) financial establish- ments, transforming therefore their competitive interaction with formal loan providers in local markets. While the new scenario could be charactersized by increased business steal- ing between the two types of competitors, MFIs might also create positive spillovers on mainstream financial institutions, due to market expansion and information sharing. The magnitude of these spillovers may have an important impact on decisions regarding enter- ing local markets, with important implications on market power and consumer welfare. To measure these spillovers I examine entry decisions of competitors across isolated markets in Colombia and estimate a structural model that identifies their impact on the profit and the stock of loans provided by incumbents of different types, taking into account the endogeneity of the decision of entry and the observed market structure. I find that entry of MFIs has a significant impact in terms of market expansion for mainstream loan pro- viders. The magnitude of this effect turns out to be higher than the reduction associated to business stealing between the two types of financial institutions, particularly in rural locations, where mainstream banks are more likely to enter a local market if there is at least one microfinance institution. Keywords: Entry models, Credit Markets, Microfinance institutions, Discrete choice models 1. Introduction In recent decades, non profit organizations, as well as regulated financial institutions, have developed a whole set of financial services designed exclusively for potential customers who find it difficult to access traditional financial services due to lower income, lack of suitable collateral or absence of reliable information about their payment behavior. A Email address: [email protected] (Laura Capera) 1 PhD candidate at Tilburg University To be submitted to CEPR/JIE School on Applied Industrial Organisation 2019 Sunday 26 th May, 2019
Transcript of Effects of entry of microfinance institutions on market ...

Effects of entry of microfinance institutions on market structure in
the retail banking industry. Evidence from Colombia
Laura Capera1
aTilburg School of Economics and Management. Warandelaan 2 5037AB Tilburg
Abstract
Microfinance institutions (MFIs) focus on a segment of the population that is typicallyunattended by mainstream banks due to lower income, lack of collateral or unreliable in-formation about payment behavior. In recent years, these institutions have undergonea transition from non profit organizations into regulated (for profit) financial establish-ments, transforming therefore their competitive interaction with formal loan providers inlocal markets. While the new scenario could be charactersized by increased business steal-ing between the two types of competitors, MFIs might also create positive spillovers onmainstream financial institutions, due to market expansion and information sharing. Themagnitude of these spillovers may have an important impact on decisions regarding enter-ing local markets, with important implications on market power and consumer welfare. Tomeasure these spillovers I examine entry decisions of competitors across isolated marketsin Colombia and estimate a structural model that identifies their impact on the profitand the stock of loans provided by incumbents of different types, taking into account theendogeneity of the decision of entry and the observed market structure. I find that entryof MFIs has a significant impact in terms of market expansion for mainstream loan pro-viders. The magnitude of this effect turns out to be higher than the reduction associatedto business stealing between the two types of financial institutions, particularly in rurallocations, where mainstream banks are more likely to enter a local market if there is atleast one microfinance institution.
Keywords: Entry models, Credit Markets, Microfinance institutions, Discrete choicemodels
1. Introduction
In recent decades, non profit organizations, as well as regulated financial institutions,have developed a whole set of financial services designed exclusively for potential customerswho find it difficult to access traditional financial services due to lower income, lack ofsuitable collateral or absence of reliable information about their payment behavior. A
Email address: [email protected] (Laura Capera)1PhD candidate at Tilburg University
To be submitted to CEPR/JIE School on Applied Industrial Organisation 2019 Sunday 26th May, 2019

great deal of previous research has focused on the role of these specialized institutions atimproving the life conditions of their clients; Cull et al. (2014) provides an extensive reviewof empirical studies that suggest that access to credit facilitates the accumulation of capitalover time, as small entrepreneurs are able to start independent productive projects as wellas to overcome unpredictable situations that might put at risk the success of their ventures.Although evidence on long term effects of access to micro-loans is mixed (Banerjee (2013)provides a detailed review of empirical studies on the topic), governments in many countrieshave been enthusiastic at creating strategies to facilitate the provision of financial servicesfor the low-income population segments, which has resulted in an increase of the numberof non-profit private organizations and regulated financial institutions specialized in thissegment.
MFIs are broadly understood as institutions that specialize in the supply of financialservices for the poor. They operate under different regulatory settings, ranging from nonprofit informal platforms at a local level to well established banks with operations in manycountries. In recent years, some of the biggest MFIs have transformed from non profit or-ganizations depending on external subsidies into specialized banks, able to provide fundingto small entrepreneurs and lower income households, under profitability conditions requiredby investors and clients from the deposit market. Cull et al. (2009a) compile evidence froma broad set of countries on the transition of non-profit microfinance institutions into regu-lated banks, free from subsidy, and how this process has affected the supply of microcredit.They find that MFIs that have undergone this transformation tend to offer products thatare more comparable to those provided by mainstream loan providers.
As this transition allows MFIs to use deposits from the public as additional funding toexpand their loan portfolio, an increased interaction with mainstream financial institutionsis expected. On one side, the entry of a MFI can affect the profit a mainstream loan providerin a similar way as the entry of other competitor of its type, since MFIs compete to attractnew clients both in the deposits and the loans markets. On the other side, there are severalreasons why the entry of a MFI is likely to have a different effect on other competitors: first,as discussed by Banerjee (2013), the amount of learning involved in the credit relationship,both by the customer and the MFI, and the extent to which this knowledge can be used byothers competitors in the market configure a potential externality. Second, inefficienciesin the loans supply might arise if there are barriers that tie a borrower permanently to aparticular provider. Since these externalities can ultimately determine whether a financialinstitution enters or exits a market, it is worth examining whether MFIs contribute toexpand the portfolio of financial products available for consumers in local markets byfacilitating the entry of other loan providers. This question turns out to be particularlyrelevant in isolated locations where few competitors are willing to enter. Furthermore,accurately measuring these interactions among MFIs and mainstream institutions at alocal level adds to the understanding of the nature of competition in the banking industryin the aggregate.
Financial institutions are more likely to enter markets where they perceive favorabledemand conditions as well as a milder competitive response from incumbents and otherpotential entrants. This simultaneous determination of entry and market structure, as well
2

as the fact that some of the market/loan-provider characteristics that make entry profitableare likely correlated across different types of financial institutions and are often unobserv-able to the econometrician, create an endogeneity problem that needs to be addressed inorder to obtain accurate measures of the spillovers that MFIs generate on incumbent in-stitutions. In this paper I propose a structural model that allows to interpret the observedlocal market configuration as the equilibrium outcome of the competitive interaction amongdifferent types of potential entrants. Taking elements from industrial organization modelsthat have been used to examine competition in retail sectors, I propose a static entry modelwith revenue equation, similar to the one developed by Schaumans and Verboven (2015) toidentify the effects of entry on market expansion for different types of competitors in theretail banking industry. This model uses the variation in the number of competitors acrosslocations to obtain measures of effects of entry of MFIs on loan providers. Their approachextends the model proposed by Bresnahan and Reiss (1990) with information about thelocal revenues, to disentangle the effects of entry on market power and market expansion.
In this paper I extend the model proposed by Schaumans and Verboven (2015) inorder to allow for multiple type of competitors. Using an approach similar to the onedeveloped by Mazzeo (2002), I introduce heterogeneity among loan providers and evaluateempirically different assumptions on the type of strategic interactions among MFIs andmainstream financial institutions. My approach is closely related to the one developed byFernandez (2016), who investigates the presence of positive (bilateral) spillovers betweenbars and cafeterias and the consequences for urban planning. While she focuses on a casewhere firms offer complementary products, I consider a situation in which spillovers arestrictly one sided (mainstream banks benefit from the entry of MFIs, but the opposite doesnot necessarily occur). This asymmetry is explained by the possibility of MFIs clients ofaccessing cheaper funding alternatives offered by mainstream banks once they have createdinformation about their payment behavior.
Exploring the competitive interaction in the banking industry is a challenging task dueto the complex structure of the profit of financial institutions and their dual role in thedeposits and loans markets. For the purposes of this paper I abstract from some of theelements that have been recently discussed in the literature with respect to the spatialinteraction across branches in the banking industry (Aguirregabiria et al. (2012) and Hoand Ishii (2011)), by modeling the entry decisions of financial institutions as independentfrom their decisions in other locations, and restricting my empirical analysis to small,geographically isolated markets. While this assumption could be inadequate in urbancontexts where externalities among branches are significant due to greater proximity andhigher mobility of clients (Huysentruyt et al. (2013)), some studies have found that evidencein favor of the independence of geographical isolated markets in the retail banking industry(de Juan (2003) and Berger and Mester (2003)). The cost of this decision is of course,the impossibility to extend my conclusions to other types of markets, such as big urbancenters. Nevertheless, studying entry decisions in isolated geographic markets turns outto be particularly relevant from the a policy point of view, since these decisions have agreat impact on the portfolio of financial services that become available for particularlyvulnerable clients.
3

One of the advantages of my approach is that it does not rely on confidential individualdata. Instead, I estimate a structural model that captures the strategic interaction amongdifferent types of loan providers using information of the number of competitors and thecomposition of the loan portfolio across 530 small isolated markets in Colombia in 2014.This country provides an interesting setting to evaluate the effects of entry of MFIs in thelocal retail banking industry because the conditions of micro loans, such as the type ofliability, the frequency of payments and the total amount borrowed, are closer to the onesof the products offered by mainstream financial institutions. One feature of the Colombianbanking industry that is critical for the aim of this study, is that the information aboutpayment behavior of clients of these institutions is reported to credit agencies, therefore itbecomes available to other competitors.
I find that the individual demand for credit for traditional banks is affected positivelyby the entry of institutions focused in microcredit or low-income households. This findinggoes in line with the role of this type of institutions as a mechanism for consumers toovercome information problems that limit their possibilities to access cheaper funding.Furthermore, I find that spillovers towards mainstream institutions are stronger in ruralisolated markets, where mainstream banks are more likely to enter if there is at least oneMFI.
This paper continues as follows: Section 2 contains a brief review of the literature. InSection 3 outlines the important features of the MFIs and other financial institutions thatcompete in the retail banking industry in Colombia, and shortly summarize recent regula-tion changes that have had significant impact on the development of microfinance. Section4 describes the data and provides summary statistics; Section 5 provides an overview of themethodology and Section 6 presents the results of the structural model. Section 7 containsfinal remarks.
2. Literature Review
This paper contributes to the literature that studies the interaction of MFIs and otherloan providers in local markets. Furthermore, it relates to the growing number of studiesthat investigate the competitive interaction among loan providers in the retail bankingindustry.
Only in the last decade have studies directly addressed the effects of entry of microfin-ance institutions on other loan providers that participate in local loan markets. Most of theempirical studies have made use of data of non-profit institutions that offer group-liabilityloans using donations as a main source of funding; these institutions typically target thepoorest segments of the population, whose only alternative source of funding are informallenders. Therefore, a considerable number of studies have focused on the effects of MFIs onthese type of loan providers, rather than on formal financial financial institutions. Demont(2016) analyzes the effect of entry of MFIs on informal sources of lending in rural villagesin India using a model where MFIs use joint-liability contracts and informal moneylendersoffer standard individual loans. Contrasting the predictions of the model with panel house-hold survey for India he finds that MFIs can worsen the informational problems faced by
4
traditional lenders, leading them to increase the interest rate charged to low income clients.Similar evidence on the behavior of interest rate has been found by Kaboski and Townsend(2012) in Thailand, who interpret this rise as an indication of financial constraints of thehouseholds. These findings are consistent with a model where MFIs draw away better bor-rowers from the moneylender and/or where fixed costs are important in informal lending,such as the one proposed by Mookherjee and Motta (2016). Other studies have focusedon the competition among MFIs. McIntosh et al. (2005) studies the effects of rising com-petition among the incumbent MFIs by examining the dropout and repayment rates of asample of clients of one of the biggest microfinance institutions in Uganda, as it abandonsits position as local monopolist in the supply of micro-loans. The identification strategyrelies on group-level changes in outcomes that occurred subsequent to the entry of a newcompetitor in the market.
In recent years, however, the business model of many of these institutions has un-dergone structural changes that aim to achieve greater independence from donors whilemaintaining the rate of expansion of their portfolio. While the majority of MFIs today arestill NGOs, several have already transformed into banks or other kinds of regulated finan-cial institutions. Regulated MFIs include regional leaders such as Banco Compartamos inMexico, Banco FIE in Brazil or Bandhan and SKS in India, which are among the largestMFIs in the world (D’Espallier et al. (2017)). The transition process implies the adoptionof a shareholder ownership structure and most often it also includes becoming subject toprudential regulation by national banking authorities. These changes may translate intoincreased tensions between higher profit and outreach (Hermes and Lensink (2007)), as wellas tougher competition among MFIs both in terms of attracting new clients and obtainfunding from donors (Ly and Mason (2012)).
As noticed by Cull et al. (2009b), while regulated MFIs continue to provide servicesto segments of the population without access to traditional banking, their products arecloser in their characteristics to the ones offered by financial institutions. Accordingly,D’Espallier et al. (2017) and Cull et al. (2014) find that regulated MFIs increase the size oftheir loans and tend to serve a lower percentage of women, while a majority of their loanshave individual, rather than group liability. The increasing similarities have an effect onthe competitive interaction between MFIs and mainstream financial institutions that havebeen scarcely studied. Descriptive evidence is provided by Cull et al. (2009a), who examinethe effects of the presence of banks on the profitability and outreach of commerciallyoriented MFIs. They find evidence that greater bank penetration in the overall economyis associated with commercial banks specialized in microcredit (rather that microfinancenon-profit institutions) entering poorer markets.
This paper provides new insights to this question by incorporating elements from em-pirical industrial organization models that have been used to study competition in otherretail sectors. I extend the model proposed by Schaumans and Verboven (2015) to ac-count for the differences between the loan providers that interact in local markets. Thistype of model has been used to analyze the competitive interaction among firms in othersectors, such as hotels, restaurants and bakeries (Fernandez (2016)). In order to includethe possibility that competitors belong to different types, I use the framework proposed
5

by Mazzeo (2002), who analyzes product differentiation in an oligopoly context using datafrom a cross section of motel markets located along U.S. interstate highways. In later work,Cohen and Mazzeo (2010) use a similar approach to analyze competition for deposits inthe retail banking industry in the U.S.
Furthermore, this paper contributes to the growing literature that make use of meth-ods developed in empirical industrial organization to analyze competition in the bankingindustry. In particular, it relates to a number of studies that analyze the competitiveinteraction among different types of financial institutions using information from the mar-ket configuration observed across different locations. My approach is similar to the oneproposed by Cohen (2004), who tests empirically different hypothesis about competitiveinteraction among banks and thrifts.
Competition among different types of financial institutions have been studied usingspatial models that explicitly account for the consumer disutility from distance traveled asin (Ho and Ishii (2011)) and Huysentruyt et al. (2013). This approach has been used tostudy competition in the banking industry urban locations where cannibalization acrossbranches of the same bank is more likely, or when banks with large networks face com-petition from single-market financial institutions (Adams et al. (2007) and Dai and Yuan(2013)). Furthermore, other studies have tried to capture externalities among the nodesof the same branching network related with geographical diversification of risk and liquid-ity considerations (Aguirregabiria et al. (2012) and Aguirregabiria and Wang (2016)). Incontrast with these studies, I model the decision of entry in each market as independentfrom the decisions taken in other locations. Therefore, I argue that entry decisions aremotivated by the local profit of the bank, rather than the aggregate profit across markets.This assumption seems suitable to model entry in remote geographically isolated markets,where spillovers towards neighboring markets is not very likely and where financial insti-tutions tend to open only a reduced number of branches per market. Evidence in supportof the independence of sub-markets is found by de Juan (2003), who uses information fromsmall towns in Spain to conclude that banks decide to enter the markets mostly based onlocal conditions of demand.
Previous studies that have studied competition in the retail banking industry in Colom-bia, such as those by (Salamanca (2005) and Rozo et al. (2008)) have not taken into accountthe heterogeneity among loan providers, ignoring consequently, the potential spillovers thatMFIs can generate on other financial institutions in terms of market expansion. By explor-ing the competitive interaction among these loan providers, this paper offers new insightsabout the role of MFIs at facilitating access to banking services in isolated locations, thatcan be used in the design of future policy interventions. By exploiting the cross sectionalvariation of the number of competitors and the loans portfolio composition I am able toidentify the markets that might benefit the most from the entry of MFIs.
3. Background: The Colombian Banking Industry
In this section I provide a brief summary of the characteristics of MFIs and other loanproviders that interacted in the retail banking industry in Colombia as of 2014, focusing
6

first on the general economic and regulatory environment, and later on the particularcharacteristics of MFIs and other lending institutions.
Colombia experienced favorable macroeconomic conditions that were accompanied bya significant expansion of the demand for loans in the period between 2006 and 2014,particularly in the households’ sector. After a deep financial crisis at the end of the 90sthat motivated stricter regulation with respect to risks management and capital require-ments for financial institutions, the banking industry underwent a process of consolidationthat resulted in a relatively concentrated market, where commercial banks with extendedbranching networks throughout the national territory represented a significant share of themarket portfolio. The segments that experienced greater growth were the ones related withthe provision of financial services towards households and micro-entrepreneurs. The po-tential for growth in Colombia in the niche of microcredit is thought to be still high, giventhe levels of poverty, inequality and financial restrictions faced by a significant portion ofthe population. According to Estrada and Rozo (2006), these restrictions are even moreacute in rural areas, where financial services had been exclusively provided by a publicbank and often tied to the existence of a productive project in the agricultural sector.
3.1. Microfinance institutions in Colombia
Microfinance institutions in Colombia started operations at the end of 80s. Beforetheir entry, micro loans were provided exclusively by the government through developmentagencies. According to Barona (2004), during the 90s most of these institutions werenon profit organizations that funded their loan operations with donations from privateindividual donors or foreign development agencies. Only after the effects of a deep financialcrisis that country experienced at the end of the 90s attenuated, the number of non-profitorganizations that offered loans to poor clients started to increase. Between 2000 and2010 the number of institutions raised from 4 to 26. During this time, the biggest MFIstransitioned from non-profit organizations into specialized banks.
According to Banca de las Oportunidades, the government agency in charge of imple-menting the national strategy to promote financial access, in December 2014 there were18 no profit MFIs, 5 non-banks regulated financial institutions and 4 banks specialized inmicrofinance (Banca de las Oportunidades (2014)). In addition, there was one public bankthat intermediated government resources to provide funding for small productive projectsin the agricultural sector. The share of this bank in the total stock of micro loans reached42% in 2014. Among the private institutions that provided this type of loans the mostimportant institutions were banks specialized in microfinance (27%) and non profit MFIs(31%). These institutions had registered a sustained expansion in previous years, both interms of their number of clients and size of their portfolio. Between 2007 and 2014 thenumber of clients nearly tripled, raising from nearly 600.000 clients to 1,8 millions, whilethe share of the total stock of loans increased from 0.7% to 3%.
MFIs in Colombia offer different types of microloans depending on the characteristicsof the client, such as the availability of credit history and the purpose of the loan. The vastmajority of them are individual, rather than group liability loans, and they comply withthe legal definition of microcredit, introduced by the government in 2007. This definition
7

specifies i) a maximum amount that can be borrowed by a single client (around US7500),ii) a cap on the total debt that the client can have with the financial system (nearlyUS36000) and ii) all costs (different from the interest rate) and commissions that financialinstitutions can charge for the product. The average amount of a micro loan in 2014 wasnearly US2000 (PPP) and the time of repayment was nearly 2 years on average. Most ofthese loans have a monthly frequency of payments.
While some of these characteristics are similar to those observed for loans given tohigher income households by mainstream financial institutions, the interest rate of thistype of loans is significantly higher (34% e.a. for microcredits vs. 19% e.a. for otherloans). Furthermore, there are important differences in the ways that MFIs value theavailable collateral and their methods of monitoring clients. In order to maintain lowlevels of default and reduce associated loses MFIs rely on higher provisions and close mon-itoring of the productive projects of the clients, which often includes additional services forentrepreneurs, such as guidance on marketing and basic accounting. The implementationof these measures is costly and often requires a higher number of employees. Branchingnetworks are often complemented with mobile agents to reach clients in isolated locations,where there is a limited supply of financial services by mainstream institutions. In fact,microcredits are the type of loans with greater geographical diversification. In 2014, 62%of these loans where given to clients in locations different from the 13 biggest cities in thecountry, while only 5% of the loans in other categories were given to clients outside theselocations. One particular feature of regulated MFIs in Colombia as of 2014 is that they didnot capture deposits from the public. Therefore they funded their operation using externalloans almost exclusively. As a consequence, their interaction with other regulated financialinstitutions occurs only in the loans market.
A regulatory change that facilitated the expansion of microcredit in Colombia was arelaxation of the interest rate ceiling that applied for this type of loans in 2007. Figure 1shows the evolution of this cap as well as the average interest rate of microcredits suppliedby regulated financial institutions. Both rates have increased significantly in recent years,particularly after 2011. The relaxation of the interest rate ceiling, as well as favorablemacroeconomic conditions translated into higher demand for loans from households andentrepreneurs and contributed to speed the transition of several non profit MFIs into banks.
3.2. Other financial institutions
Commercial banks are the most important institutions in the loan retail market inColombia, both in terms of market share and size; the loans provided by private banksrepresented 95.3% of the total credit to the private sector, and 93.6% of the total assetsin December 2014. These institutions have a diverse portfolio that includes services forbusiness clients, households and micro-entrepreneurs. The greater share of their portfoliocorresponds to commercial loans (58% on average), followed by non-collateral loans andmortgages. Microcredits account for less than 5% of their total stock of loans. However,there is significant heterogeneity in the composition of the loan portfolio of these institu-tions, with some smaller banks focusing in non collateral loans to households or commercialloans, exclusively. Banks rely heavily on the loan activity in order to obtain their profits.
8

0
10
20
30
40
50
60
2004 2005 2006 2007 2008 2009 2010 2011 2012 2013 2014 2015 2016
Usury rate for consumption loans Usury rate for microcredit
Average Consumption loans rate Average Microcredit rate
(percentage)
Usury rate for microcredit: 1.5 times the average interest rate for microcredits charged by regulated institutions
Fixed usury rate for microcredit fixed at 34%
Same usury rate
for microcredit
and
consumption
loans
Figure 1: Effective annual usury rate 2004-20162
Loans represented 65,7% of their assets while net interest obtained from loan operationsaccounted for 62% of their total revenue.
Other institutions that compete in the retail loan market include financial institutionsregulated by the financial supervisory authority (Superintendencia Financiera de Colom-bia), and several organizations that offer loans to particular groups of the population suchas credit unions and employees associations that provide loans to their members. Theseinstitutions are more specialized, both in terms of their geographic location and the rangeof products they offer, focusing often in urban markets. Employees associations and creditunions are included in what is known as ”solidarity sector”, and are not regulated by thefinancial supervisory authority. These organizations are not allowed to capture depositsfrom the public and cannot provide loans to external members. Since most of these organ-izations are formed by individuals with formal employment, they are not considered as asource of founding for independent entrepreneurs with low income.
Figure 2 presents the evolution of the number and value of new microcredit in recentyears. As seen from the graph, after the relaxation of the usury rate that applied formicrocredit there was a significant increase in the value of new loans given by MFIs, butnot to the same extent by other financial institutions. While 11,7% of the new microcreditswere given by mainstream banks in 2008, this percentage was just 5,4% in 2014. In contrast,these institutions have increased their funding options for low income households in theform of non collateral loans such as credit cards after the relaxation of the usury rate.
9

Figure 2: Number and value of new microcredits
4. Methodology
The model I propose here is an extension of the one proposed by Schaumans andVerboven (2015) that allows to incorporate heterogeneity among competitors. This modelfollows the approach developed by Bresnahan and Reiss (1990), who uses the variationin the number of competitors across locations to obtain measures of the toughness ofcompetition. First, I examine the decisions of banks about entry, assuming that they takethe market structure in each location Nj as given. Later, I describe how the observedmarket structure can be understood as the equilibrium outcome of a game where differentcompetitors decide about entry.
4.0.1. Assumptions on banks and markets
Banks are firms able to operate in multiple markets. Their type, either mainstreambanks (b) or MFIs (m), cannot be chosen after entry in each particular market, therefore itis the same across geographic locations 3. There is a fixed number of geographic marketsM where banks can decide to enter, and banks are able to operate simultaneously in all ofthem if it is profitable. Decisions about type and entry are irrevocable.
Since I assume that there are no externalities across markets, the aggregate profit ofa bank that operates in multiple places is calculated the sum of the profit obtained ineach individual location. Entry decisions are therefore based on each particular market
3Microloans represent more than 80% of the total loan porfolio in all the markets considered in thesample, whereas this share is lower than 30% for mainstream banks.
10

conditions only. Although this assumption is difficult to hold in many retail industries,there are several arguments in support of this conjecture in the case of the Colombian retailbanking industry, particularly if we restrict our attention to small, geographically isolatedmarkets. On the demand side, clients need to approach personally to a branch in order toask for a loan, since many of them still do not have the possibility of performing this typeof operation using virtual or mobile platforms. Although internet access is possible in mostof the cities and towns in Colombia, a significant share of the population in those placesdo not have internet access at home. Furthermore, the use of virtual platforms to maketransactions is still not familiar to many customers, who prefer to approach a traditionalbranch, as they perceive this channel as safer and more reliable. A second argument isthat clients might not demand loans from nearby towns, due to higher travel expenses andlower probability to obtain funding (monitoring costs for banks also increase with distance,particularly for financial institutions offering microcredits).
On the supply side, I assume that there are not significant economies of scope acrossmarkets. Therefore, the cost of operation of a branch does not reduces if the number ofbranches in adjacent markets is bigger. In the banking industry, the costs of operationof branches is less likely to be affected by the location of other nodes of the branchingnetwork, compared to other industries such as retail chain stores, where those features cantranslate in changes in distribution and storage costs (see for example Holmes (2011)).There exists however, the possibility that the reallocation of funds obtained in the depositmarket creates interdependence across geographic locations. While I cannot rule out thispossiblity , I think it is reasonable to assume instead that financial institutions invest theexcess of deposits that are obtained in a particular market in an outside option that isindependent from the markets that are included in the sample (this can be a portfolioinvestment, providing loans in external markets or lending in the interbank market). Also,I assume that the markets are small enough such that the local market structure does nothave a significant effect on the interest rate that competitors set for each type of loan at thenational level. This an assumption consistent with the situation observed in the Colombianbanking industry, where big metropolitan areas (excluded from the sample) concentratean important share of the total loan portfolio4. Therefore, the decision of entry dependsonly on the local demand for loans and local supply of deposits.
4.0.2. Entry conditions
The profit function of a bank of type i in a market j can be written as follows:
Πij(Nj) = (rli(Nj)− rdi (Nj))Lij(Nj)+ (1)
(roi − rdi (Nj)) max{Dij(Nj)− Lij(Nj), 0}− (2)
Fij(Nj), (3)
4The sample of markets that are included in the estimation represent 6,7% of the aggregate stock ofloans and 6,1% of the total stock of deposits.
11

where Nj is a vector that contains the number of financial institutions of each type inmarket j; rli(Nj) is the ex post return obtained from the current stock of loans, Lij(Nj),and rdi (Nj) is the return of the deposits stock, Dij(Nj), that banks need to pay to theirclients.
I assume that banks can make use of deposits obtained from an outside source to providefunding for the local demand of loans in case that the local deposits are not enough. In thatcase, those resources would be remunerated at the same rate as local deposits (rdi (Nj)).When there is a local surplus of deposits, banks can invest it in an outside option thathas a return denoted by roi . Interest rates set by multimarket banks for loans and depositsare usually the same across locations, therefore they do not depend on the local marketstructure5. The ex post return rate rli(Nj), however, may vary across markets dependingon the portfolio composition and the materialization of credit risk, which in turn, may beaffected by the market structure. Entry of new competitors might lead to incumbents toshift towards a particular type of loans; similarly, greater competition among loan providersmight imply lower payments from loans if the excessive supply of credit to risky clientstranslates into higher default rates. Finally the variable Fij(Nj) captures the operativecosts of the branch, which do not depend on the scale of the operation. Again, thisvariable might be affected by market structure if the entry of new competitors generatespillovers on the development of basic infrastructure needed to attract clients, such as ATMnetworks and debit/credit card payment terminals.
I consider a competitor as active in the market if there exists at least one ”brick andmortar” branch in the market that reports non-zero stocks of deposits or loans. Therefore,Nj is a vector that contains the number of competitors per type rather than the numberof branches that each financial institution operates in each market. Hence, I’m not able tocapture the effect of competition among branches of the same competitor, or the relativeadvantage of competitors with more than one branch in the local market; this is likely notbe an important limitation since banks and other financial institutions operate just onebranch per market in most of the cases6.
The profit function can be rewritten as follows:
Πij(Nj, φij, lij) =((rli(Nj)− rdi (Nj)) + (roi − rdi (Nj)) max{φij(Nj), 0}
)lij(Nj)Sj − Fi(Nj),
(4)
5In Colombia, financial institutions do not discriminate prices across markets, therefore, interest ratesare not likely to respond to the changes in the market structure of a single small market. Evidence of thistype of pricing behaviour is also found in other countries where banks operate across different geographicmarkets (Berger and Dick (2007)
6Financial institutions have only one branch per market in 89.8% of locations. Transaction terminalssuch as post offices and retail stores that offer banking services in agreement with banks (known as bankingcorrespondents) are not taken into account to define entry because it is not possible for new clients toask for loans or opening standard saving accounts. Furthermore, since financial institutions use existingbranching networks from other firms, the decision on entry is not strictly based on the local profit for thefinancial institution.
12

where φij(Nj) =dij(Nj)
lij(Nj)− 1 is the relative surplus of deposits, lij(Nj) is the demand for
loans per capita, dij(Nj) is the local supply of deposits per capita and Sj is the populationof market j.
If a financial institution decides to enter a location where the market structure is givenby Nj, it must be that the profit of entering the market, Πij(Nj + Ii) (where the indicatorvector Ii indicates whether there is an additional competitor of type i in the market), isgreater than the outside option payment, which I normalize to zero. This condition canbe written in logarithms using equation 4 as:
ln
(µij(Nj + Ii)
Fij(Nj + Ii)
)+ ln lij(Nj + Ii) + lnSj > 0, (5)
where µij(Nj+Ii) ≡ (rli(Nj+Ii)−rdi )+(roi −rdi ) max{φij(Nj+Ii), 0} is a measure of themarkup that the financial institution obtains in market j7, while the second term, lij(Nj +Ii), refers to the local demand for loans per capita. Both terms above depend on marketstructure Nj, but they are also determined by economic and demographic characteristicsof the market such as income, distance to metropolitan areas, etc. Let Xj be a vector thatcapture all the relevant demographic characteristics of market j. I use linear functions tocapture these relations as follows:
ln lij(Nj) = Xjβi + αi(N) + εij, (6)
lnµij(Nj) = Xjλi + δi(N)− ηij, (7)
where εij and ηij are characteristics that vary across markets and types of competitors,unobservable to the econometrician.
The effects of market structure in the revenue of bank of type i in market j are capturedby the function αi(N), which is defined as follows:
αi(Nj) = αiNij. (8)
Here, Nij is the number of competitors that firm i faces in the market. For example,if there are two types, N = {Ni, Nk} the number of competitors for a firm of type i isN = {Ni − 1, Nk}. This functional form assumes that the effect of all competitors of thesame type is the same. Similarly,
7The value of the deposits is smaller than the value of the loans in most of the markets considered inthe sample.
13
δi(Nj) = δiNij. (9)
A more flexible specification of the functions α(Nb, Nm) and δ(Nb, Nm) can be definedas follows:
αb(Nb, Nm) = αb1dbb1 + αbba max{Nb − 2}+ α1mdbm1 + αbma max{Nm − 1, 0} (10)
αm(Nb, Nm) = αm1dmb1 + αbba max{Nb − 1, 0}+ α1mdmm1 + αmma max{Nm − 2, 0}, (11)
and,
δb(Nb, Nm) = δb1dbb1 + δbba max{Nb − 2, 0}+ δ1mdbm1 + δbma max{Nm − 1, 0} (12)
δm(Nb, Nm) = δm1dmb1 + δbba max{Nb − 1, 0}+ δ1mdmm1 + δmma max{Nm − 2, 0}, (13)
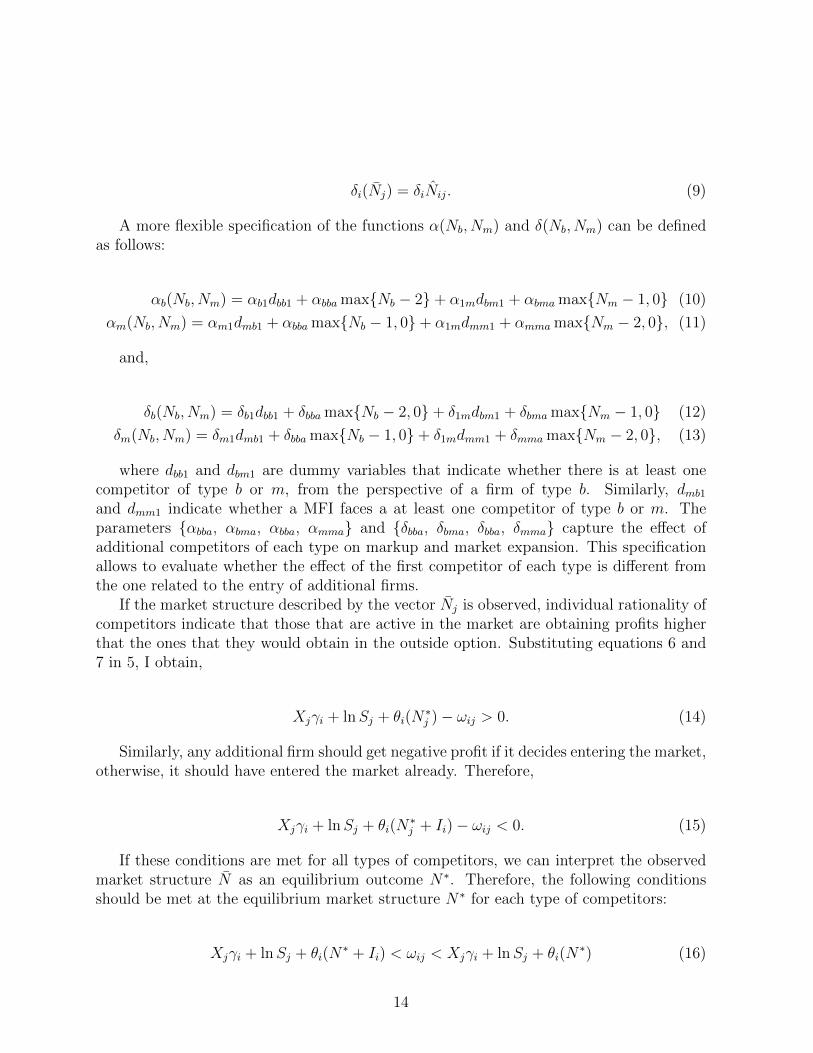
where dbb1 and dbm1 are dummy variables that indicate whether there is at least onecompetitor of type b or m, from the perspective of a firm of type b. Similarly, dmb1and dmm1 indicate whether a MFI faces a at least one competitor of type b or m. Theparameters {αbba, αbma, αbba, αmma} and {δbba, δbma, δbba, δmma} capture the effect ofadditional competitors of each type on markup and market expansion. This specificationallows to evaluate whether the effect of the first competitor of each type is different fromthe one related to the entry of additional firms.
If the market structure described by the vector Nj is observed, individual rationality ofcompetitors indicate that those that are active in the market are obtaining profits higherthat the ones that they would obtain in the outside option. Substituting equations 6 and7 in 5, I obtain,
Xjγi + lnSj + θi(N∗j )− ωij > 0. (14)
Similarly, any additional firm should get negative profit if it decides entering the market,otherwise, it should have entered the market already. Therefore,
Xjγi + lnSj + θi(N∗j + Ii)− ωij < 0. (15)
If these conditions are met for all types of competitors, we can interpret the observedmarket structure N as an equilibrium outcome N∗. Therefore, the following conditionsshould be met at the equilibrium market structure N∗ for each type of competitors:
Xjγi + lnSj + θi(N∗ + Ii) < ωij < Xjγi + lnSj + θi(N
∗) (16)
14

where,
γi = λi + βi
θi = αi + δi
ωij = ηij − εij.
This is a simultaneous ordered probit and demand model, under the assumption thatthe entry of a new competitor always reduces profit of incumbents (γi < 0). In marketswhere there are no competitors of type i (N∗i = 0), lij(Nj, Xj) is not observed; hence, onlyone inequality must hold for that type:
Xjλi + lnSj + δi(N∗ + Ik) < ωij, (17)
while when there is at least one competitor of type i (N∗(i) > 0), two conditions mustbe satisfied:
ln lij(N∗, Xj) = Xjβi + αi(N
∗) + εij (18)
Xjγi + lnSj + θi(N∗ + Ii) < ωij < Xjγi + lnSj + θi(N
∗). (19)
There is an endogeneity problem due to the fact that firms are more likely to entermarkets where they expect higher demand. Following the solution proposed by Schaumansand Verboven (2015), I use the population variable (Sj) as an exclusion restriction thathelps to achieve identification as it affects the overall profit, since firms are more likely toenter in large markets, but it does not affect per-capita demand for loans8. The model canbe estimated by maximum likelihood, provided that the distributions of the unobservableterms ηij and εij are known.
This is an extension of the entry model proposed by Bresnahan and Reiss (1990) thatallows to identify the effects of entry on credit expansion from those related to marketpower in the context of retail banking industry. This feature is particularly useful as itallows to obtain evidence about the role of this type of institutions at facilitating access toclients towards cheaper funding alternatives.
4.1. Entry game for two types of competitors
As noted by Mazzeo (2002), when there are different types of competitors in the marketit is necessary to introduce additional assumptions that allow to interpret the distributionof firms across types as the result of a rational individual decision of potential entrants.Therefore, I impose some structure on the type of interaction between financial institutions,
8An OLS regression of the stock of loans per capita on demographic characteristics of the market revealsthat after controlling for income and distance to closest market, population doesn’t contribute to explainthe variation of this variable across markets.
15

such that the observed market structure can be interpreted as the outcome of an entry gameunder complete information.
Consistent with the structure of the retail banking industry in Colombia I classify theloan providers in two categories: mainstream financial institutions (b) and institutionsspecialized in microfinance (m). The public bank is not included in any of the categoriesabove. Instead I consider its presence as an exogenous characteristic of the market 9.
Similar to the investment game proposed by Mazzeo (2002) I assume there is a pool ofpotential entrants of the two types that make irrevocable decisions about entry. Potentialentrants of the same type are identical and play in a sequential manner. Firms anticipatethat subsequent firms will make decisions about entry and product type once they havecommitted to their choice. The last firm of each product type finds entry profitable takingthe number of competitors of each type that are active in the market as given. Additionalentry, in either product type, is not profitable.
Different equilibrium market structures can be achieved depending on the type of in-teraction between mainstream institutions and MFIs. Cleeren et al. (2010) analyzes acase where competitors are substitutes, while Fernandez (2016) studies a case where firmsprovide complementary goods, so bilateral positive spillovers arise. I consider here a thirdcase, in which the relation among the two types of competitors is not symmetric, resultingin one-sided positive spillovers. To see why this can be the case in the context of MFIs andmainstream banks, notice that limited business stealing between mainstream banks andMFIs is expected, particularly from the second group towards the first, since mainstreaminstitutions offer relatively cheaper alternatives of credit for clients with lower default risk,and their share of microcredit in the loan portfolio is small. On the deposits side, manyMFIs do not capture resources from the public, funding most of their operation with ex-ternal loans. Positive spillovers for mainstream institutions, derived from the entry of aMFIs may occur instead, since MFIs’ clients might become eligible for accessing cheaperloans offered by mainstream institutions once they have build some credit history, amassedsome collateral or simply become more aware about the benefits of formal financial services.To simplify notation I will drop the sub-index j, to focus on the features of the interactionof competitors of types b and m in a given market.
4.1.1. Types are substitutes
If Πb(Nb, Nm + 1) < Πb(Nb, Nm) and Πm(Nb + 1, Nm) < Πm(Nb, Nm), then the typesare substitutes. Furthermore, if the entry of a competitor of the same type reduces theprofit of an incumbent more than the entry of a competitor of other type, then a Nashequilibrium exists and can be represented by the pair {Nb, Nm} for which the followinginequalities hold:
9The public bank is present in most of the markets included in the sample, due to its historic roleat distributing the currency in remote places. The branches of this bank started their operations yearsbefore the entry of other competitors in most of the markets, and there are no significant changes in thebranching network of this bank during the period analyzed here.
16

πb(Nb + 1, Nm) < ωb < πb(Nb, Nm) (20)
πm(Nb, Nm + 1) < ωm < πm(Nb, Nm), (21)
where πi(Nb, Nm) = Xjγi + lnSj + θi(Nb, Nm) for i = {b,m}. This equilibrium is notunique, however, as there is a sub-region of the area defined by inequalities above that isconsistent with the outcome {Nb + 1, Nm − 1}. This subregion is defined by the followinginequalities:
πb(Nb + 1, Nm) < ωb < πb(Nb + 1, Nm − 1) (22)
πm(Nb + 1, Nm) < ωm < πm(Nb, Nm). (23)
In order to obtain a unique equilibrium in terms of the number of firms of each type,Mazzeo (2002) introduces additional inequalities related to the optimal selection of typesin each market. Given that types are given in the context of this paper, I assume insteadthat potential entrants of the type b have a competitive advantage with respect to financialinstitutions that are specialized in microcredit. This means that in markets that areattractive for both types, but where at most one additional competitor can enter, theoutcome {Nb + 1, Nm − 1}, rather than {Nb, Nm} is obtained. This assumption is in linewith the fact that mainstream institutions have been active in the retail banking industryfor a longer period and are bigger in terms of assets and market share. Given theseassumptions, the resulting equilibrium is unique in terms of the number of competitor ineach category, and the likelihood contribution of a market with {Nb, Nm} competitors canbe calculated as follows:
L({Nb, Nm}) =
∫ πb(Nb,Nm)
πb(Nb+1,Nm)
∫ πm(Nb,Nm)
πm(Nb,Nm+1)
f(ωb, ωm)d(ωb, ωm)−∫ πb(Nb+1,Nm)
πb(Nb+1,Nm−1)
∫ πm(Nb,Nm)
πm(Nb+1,Nm)
f(ωb, ωm)d(ωb, ωm),
(24)
where f(ωbj, ωmj) is the distribution function of the duplet (ωb, ωm).Figure 3 presents an example with two players of each type. The delimited areas in the
plane represent the set of values of {ωb, ωm} that are consistent with each possible marketoutcome.
4.1.2. One-sided complementarity
Alternatively, if the effect of entry of MFIs on market expansion is big enough suchthat Πb(Nb, Nm + 1) > Πb(Nb, Nm) then this type of loan providers acts as complement ofmainstream institutions. I assume that positive spillovers are one-sided, therefore, MFIs donot benefit from the entry of a mainstream loan provider (Πm(Nb+1, Nm) ≤ Πm(Nb, Nm)).
17

Figure 3: Substitutes case: equilibrium outcomes
A Nash equilibrium of the game exists in this scenario under the assumption that suchspillovers on mainstream institutions are smaller than the effect of the entry of anothercompetitor of the same type: Πb(Nb + 1, Nm + 1) < Πb(Nb, Nm) for all Nm.
Figure 2 presents the predicted outcomes of the game for different values of (ωb, ωm)when there are only two competitors of each type. The outcome {Nb, Nm} = {1, 1} isobtained in the area defined by the equations 22, but also in the area where the followinginequalities hold:
πb(2, 0) < ωb < πb(2, 1) (25)
πm(2, 1) < ωm < πm(1, 1). (26)
In this area, an additional competitor of type b can enter only if there is at least oneMFI in the market. But the MFI only enters the market if the type b doesn’t enter. Sinceentry of type b reduces the profit of the MFI, an additional competitor of this type cannotenter and the result {1, 1} is obtained.
Therefore, under this scenario, the likelihood contribution of a market with {Nb, Nm}is:
18
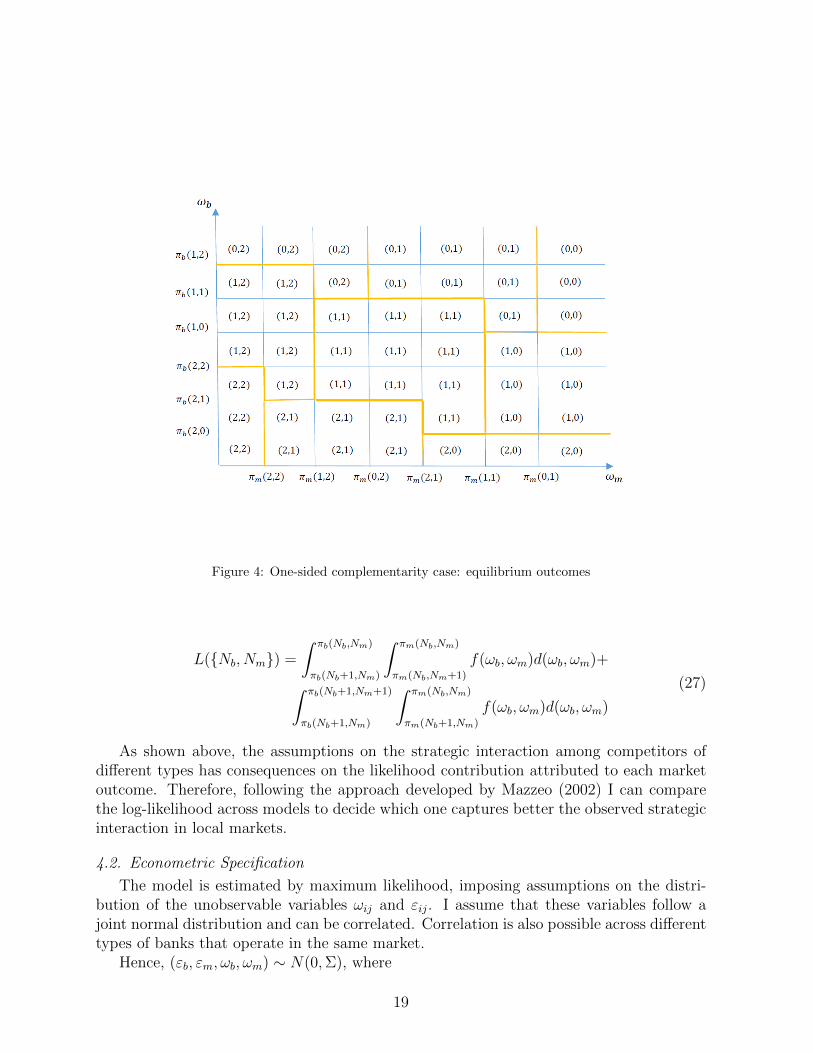
Figure 4: One-sided complementarity case: equilibrium outcomes
L({Nb, Nm}) =
∫ πb(Nb,Nm)
πb(Nb+1,Nm)
∫ πm(Nb,Nm)
πm(Nb,Nm+1)
f(ωb, ωm)d(ωb, ωm)+∫ πb(Nb+1,Nm+1)
πb(Nb+1,Nm)
∫ πm(Nb,Nm)
πm(Nb+1,Nm)
f(ωb, ωm)d(ωb, ωm)
(27)
As shown above, the assumptions on the strategic interaction among competitors ofdifferent types has consequences on the likelihood contribution attributed to each marketoutcome. Therefore, following the approach developed by Mazzeo (2002) I can comparethe log-likelihood across models to decide which one captures better the observed strategicinteraction in local markets.
4.2. Econometric Specification
The model is estimated by maximum likelihood, imposing assumptions on the distri-bution of the unobservable variables ωij and εij. I assume that these variables follow ajoint normal distribution and can be correlated. Correlation is also possible across differenttypes of banks that operate in the same market.
Hence, (εb, εm, ωb, ωm) ∼ N(0,Σ), where
19

Σ =
[Σεε Σωε
Σωε Σωω
]. (28)
The individual likelihood contribution a market j where there are no competitors inthe market is given by:
Lj(Nb, Nm) =
∫ ∞πb(1,0)
∫ ∞πm(0,1)
f(ωb, ωm)d(ωb, ωm) (29)
where the duplet {ωb, ωm} is distributed normal with zero mean and variance equal toΣωω.
If there is a competitor of type k ∈ {b,m} in the market, then the stock of loans forthis type is competitor is observed; therefore, it is necessary to calculate the likelihoodindividual contribution of the market using the joint normal distribution of the duplet{ωb, ωm}, conditional on the realization of εkj. This gives rise to four different cases forthe conditional variance matrix of the joint distribution function. As an illustration I willconsider here the case where the number of competitors is positive for all types.
When Nb > 0 and Nm > 0, the conditional distribution of the duplet ε ≡ {εbj, εmj} canbe inferred from 16, given the observed value of (lbj, lmj). Hence probability of a marketstructure described by (Nb, Nm) is given by the following expression if types are substitutes:
Lj(Nb, Nm) = f(εbjεmj)(
∫ πb(Nb,Nm)
πb(Nb+1,Nm)
∫ πm(Nb,Nm)
πm(Nb,Nm+1)
f(ωb, ωm|εb, εm)d(ωb, ωm)−∫ πb(Nb+1,Nm)
πb(Nb+1,Nm−1)
∫ πm(Nb,Nm)
πm(Nb+1,Nm)
f(ωb, ωm|εb, εm)d(ωb, ωm)),
(30)
or, in the case with one-sided complementarity,
Lj(Nb, Nm) = f(εbjεmj)(
∫ πb(Nb,Nm)
πb(Nb+1,Nm)
∫ πm(Nb,Nm)
πm(Nb,Nm+1)
f(ωb, ωm|εb, εm)d(ωb, ωm)+∫ πb(Nb+1,Nm)
πb(Nb+1,Nm+1)
∫ πm(Nb,Nm)
πm(Nb+1,Nm)
f(ωb, ωm|εb, εm)d(ωb, ωm).
(31)
The conditional probability density f(ωb, ωm|εb, εm) is a multivariate normal densitywith mean equal to:
µ(ωb, ωm|εb, εm) = µω − ΣωεΣ−1εε (ε− µε) , (32)
where µω = µε = 0, and variance Σω|ε:
20

Σω|ε = Σωω − ΣωεΣ−1εε Σωε. (33)
Identification of the elements of the variance-covariance matrix is possible given therestriction on the population coefficient, which is set to be equal to one.
4.3. Measures of competition intensity
One measure of the competitive interaction proposed by Bresnahan and Reiss (1990)is the entry thresholds ratio. This is the change in the size of market necessary to sustainan additional competitor. The changes in the entry thresholds across different marketstructures is informative about the nature of competition among the different types of loanproviders. To illustrate, consider the minimum size of market necessary to sustain a MFI,given that there is mainstream institution already in the market. For such market size,Smj the following conditions must hold:
Πmj(1, 1) = µm(1, 1)Rm(1, 1)Smj − Fm(1, 1) = 0
Smj =Fm(1, 1)
µm(1, 1)Rm(1, 1)
ln Smj = ln(Fm(1, 1)/µ(1, 1))− lnRm(1, 1).
(34)
Therefore, the entry threshold ratio for a MFI given that there is a mainstream insti-tution already operating in the market can be calculated as:
ln
(Smj(1, 1)
Smj(1, 0)
)= θm(1, 1)− θm(1, 0). (35)
Next, I calculate the changes in profit generated by the entry of a MFI as a percentage ofthe markup that the mainstream bank would have obtained as a monopolist in a market,as well as the effects on the supply of loans (market expansion). Using equation 7 themarkup drop is calculated as,
ln
((µbj(1, 1)/fij)
(µbj(1, 0))/fmj)
)= δb(1, 1)− δb(1, 0). (36)
Where δb(1, 0) = θb(1, 0)− αb(1, 0). Similarly, the effect of entry on the local supply ofloans per capita can be estimated as:
ln
(lbj(1, 1)
lbj(1, 0)
)= αb(1, 1)− θb(1, 0). (37)
21

5. Data and summary statistics
Since the public bank is the oldest institution in the market, available in almost alltowns in the country, I consider its presence as an exogenous characteristic of the market10.Therefore, I restrict my analysis to the competitive interaction among private competitors.Based on the composition of the portfolio and the regulation that applies for each financialinstitution I classify loan providers into two categories: i) mainstream banks an other regu-lated financial institutions11 and ii) MFIs. The last category includes all private regulatedinstitutions whose share of microcredit loans exceeds 60% of their loans portfolio and thetwo biggest microfinance non profit institutions that operated in Colombia in December201412.
Table 1 presents some characteristics of the loan providers of each type. There are 43mainstream financial institutions and 6 MFIs. The latest are particularly important inthe provision of microcredit. The share of the market for this type of institutions reaches40.33% of the total stock of microcredit.
MFIs have a significant number of employees and branches, consistent with theirstrategy of intense monitoring. In contrast, some of the products offered by mainstreambanks are less intensive in terms of employees and branches, as clients make use of virtualtransaction channels and monitoring is less frequent in the presence of collateral. Thedifferences in the credit risk management strategies is also shown in some indicators ofcredit risk of the microcredit portfolio of different types of competitors. The share of non-performing microcredits is higher for mainstream banks (8,06%) than for MFIs (4,47%).Similarly, the loan loss provisions ratio is higher for MFIs institutions than for mainstreambanks or the public bank, suggesting that the former institutions are better at managingcredit risk for this type of loans.
5.1. Markets
I use a cross-sectional data set that contains information from 953 cities and townsin Colombia (from a total of 1102) in December 2014. The number of branches and thevalue of the loan portfolio of all financial institutions are published by SuperintendenciaFinanciera, while the demographic variables per market are taken from the MunicipalitiesPanel Data Set from Universidad de los Andes, which contains information from severalofficial sources.
10While this institution is an important provider of microcredit in Colombia, there are important dif-ferences with respect to other MFIs. Most of its loan operations are covered by a public insurance that issubsidized by the government, which translates into significant differences between the default rate of thisbank compared to the one of other MFIs. Furthermore, these operations are mostly funded with publicresources or mandatory investments from other financial institutions
11Financial institutions that do not participate in the retail loan market are excluded, as well as gov-ernment development agencies, credit unions and other associations that provide credit.
12I include these two institutions because the size of their portfolio is similar to that of the banksspecialized in microcredit. Furthermore, these institutions share information with credit score agenciesand offer similar products to those offered by regulated institutions specialized in this niche. Otherinstitutions that are not included due to unavailability of information provide less than 8% of microcredits
22

Type/Niche Mainstream banks Microcredit Public Bank
Competitors 43 6 1Markets with at least one branch 843 271 617Employees 6573 1844 2465Total share of the market 0.9531 0.0152 0.0317Share of market - Microcredits 0.1232 0.4033 0.4735Share of microcredit - own portfolio 0.0541 0.9874 0.6781Non performing loans 0.0806 0.0447 0.0835Provisioning ratio 0.9327 0.9732 0.8534
Table 1: Descriptive Statistics of Competitors per Type
Market Definition: I define a market as a group of administrative municipalities thatfulfills two characteristics: its population is below 100.000 inhabitants, and the distance tothe closest urban center is larger than 40 kilometers13. If two or more municipalities are lessthan 25 kilometers apart from each other, they are considered as a single market, wheneverthe total population is below 130000. I obtained 538 markets, 427 of which are single townsor cities. In terms of participation in the total stock of loans and deposits in the country(including regulated institutions and non profit organizations), these markets account for6, 7% and 6, 1% respectively. Despite the limited share in the total portfolio of mainstreamfinancial institutions, this sample of markets concentrates a significant proportion of theColombian population (37.4%), as well as the majority of the stock of microcredits (59, 7%).
I include in the model some variables may help to predict the size of the market andindividual demand for credit, such as population, income per capita, distance to the closesturban center, share of population under the poverty line, share of the GDP from agriculturalactivity, and presence of the public bank. Table 2 presents summary statistics of the mainvariables in 2014. The markets included in my sample are greater than the ones used byBresnahan and Reiss (1990) and Schaumans and Verboven (2015) in terms of population;however, the number of competitors is small, which suggest that entry thresholds are higherfor this industry. Furthermore, descriptive statistics on the distance between markets andtheir closest urban center, as well as on the total number of competitors, suggest thatmarkets are mainly non-urban areas, where overlapping of markets is not very likely.
Table 3 presents descriptive statistics on the average number of competitors, branchesand portfolio composition per market for three groups of markets based on the populationsize. While the number of branches and competitors increases with market size, the loanportfolio of mainstream institutions and MFI does not change significantly as the marketsize increases. Finally, the deposits-loans ratio is higher for mainstream loan providersthan for MFIs. For the first group the stock of deposits doubles the stock of loans in twoof the markets categories, while for MFIs, the ratio is around 10%. This suggests that
13This distance corresponds to the shortest path between towns using the current road network, providedby Open Source Routing Machine Project.
23
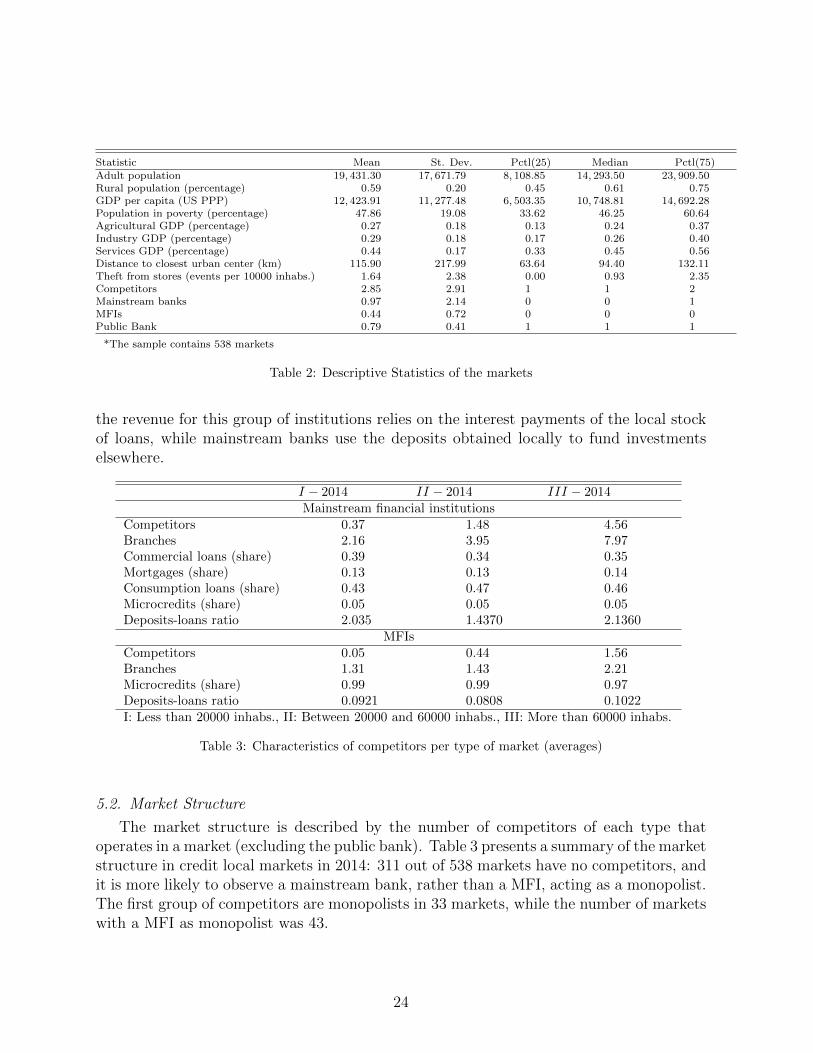
Statistic Mean St. Dev. Pctl(25) Median Pctl(75)Adult population 19, 431.30 17, 671.79 8, 108.85 14, 293.50 23, 909.50Rural population (percentage) 0.59 0.20 0.45 0.61 0.75GDP per capita (US PPP) 12, 423.91 11, 277.48 6, 503.35 10, 748.81 14, 692.28Population in poverty (percentage) 47.86 19.08 33.62 46.25 60.64Agricultural GDP (percentage) 0.27 0.18 0.13 0.24 0.37Industry GDP (percentage) 0.29 0.18 0.17 0.26 0.40Services GDP (percentage) 0.44 0.17 0.33 0.45 0.56Distance to closest urban center (km) 115.90 217.99 63.64 94.40 132.11Theft from stores (events per 10000 inhabs.) 1.64 2.38 0.00 0.93 2.35Competitors 2.85 2.91 1 1 2Mainstream banks 0.97 2.14 0 0 1MFIs 0.44 0.72 0 0 0Public Bank 0.79 0.41 1 1 1
*The sample contains 538 markets
Table 2: Descriptive Statistics of the markets
the revenue for this group of institutions relies on the interest payments of the local stockof loans, while mainstream banks use the deposits obtained locally to fund investmentselsewhere.
I − 2014 II − 2014 III − 2014Mainstream financial institutions
Competitors 0.37 1.48 4.56Branches 2.16 3.95 7.97Commercial loans (share) 0.39 0.34 0.35Mortgages (share) 0.13 0.13 0.14Consumption loans (share) 0.43 0.47 0.46Microcredits (share) 0.05 0.05 0.05Deposits-loans ratio 2.035 1.4370 2.1360
MFIsCompetitors 0.05 0.44 1.56Branches 1.31 1.43 2.21Microcredits (share) 0.99 0.99 0.97Deposits-loans ratio 0.0921 0.0808 0.1022I: Less than 20000 inhabs., II: Between 20000 and 60000 inhabs., III: More than 60000 inhabs.
Table 3: Characteristics of competitors per type of market (averages)
5.2. Market Structure
The market structure is described by the number of competitors of each type thatoperates in a market (excluding the public bank). Table 3 presents a summary of the marketstructure in credit local markets in 2014: 311 out of 538 markets have no competitors, andit is more likely to observe a mainstream bank, rather than a MFI, acting as a monopolist.The first group of competitors are monopolists in 33 markets, while the number of marketswith a MFI as monopolist was 43.
24

MFIs (Nm) / Other competitors (Nb) Nb = 0 Nb = 1 Nb > 1 Total
Nm = 0 311 43 20 374Nm = 1 33 28 74 135Nm > 1 1 2 26 29
Total 345 73 120 538
Table 4: Market Structure in 2014 (number of markets)
5.3. Government Intervention
The Colombian government has developed an extensive program aimed to increasethe access of low income population to financial services. As part of this strategy, thegovernment has offered economic or technical support to financial institutions in orderto promote entry in some small towns and low income neighborhoods in bigger cities.Therefore, I include a dummy variable that takes the value of 1 if the government hasimplemented any of these measures in the market during the period 2007-2014.
6. Results
Table 5 presents the results of the estimation of the model described in equations 15,16 and 17 under different assumptions about the competitive interaction across types14.Iinclude variables that capture the economic and demographic characteristics of the market,such as distance to closest urban center, share of the population in rural areas, income percapita, number of companies in the market in all specifications , etc. Appendix 1 containsthe full estimation results. I will focus here in the effects of entry of different types of loanproviders on the loan supply, markup and overall profit. To facilitate interpretation thecompetitive effects on markup, loan supply and profit are presented as a proportion of thevalue that would have been obtained if the institution would have been a monopolist inthe market.
The magnitude and signs of the coefficients are similar between the two specifications.However, when the types are assumed to be substitutes, I find that the effect of MFIs onthe profit of mainstream loan providers (first column) is very close to zero, i.e., the theprofit of a mainstream bank is almost the same after the entry of a MFI. In contrast, I findthat the profit of a mainstream loan provider is significantly greater when a MFI entersthe market in the model that assumes one sided complementarity across types. This resultindicate that the restriction imposed on this parameter is binding. Furthermore, the log-likelihood levels for the two models suggest that the specification that assumes one-sidedcomplementarity achieves a better fit to the data. Therefore, I will focus in the resultsfrom this later model (Columns 3 and 4 of Table 5).
14Standard errors are calculated using the delta method
25

The first section of Table 5 contains the estimated value of markup for different marketstructures, relative to the one that would have been obtained in a monopoly scenario,for the two types of competitors. The new markup of mainstream providers is 52% themonopoly level if another competitor of the same type enters the market, while in the caseof MFIs the profit after the entry of another MFI is just 24,3% the monopoly level. Thisresult indicates that MFIs’ profit is more sensitive to the entry of a competitor of the sametype, compared to mainstream banks.
Substitutes One sided complements(Mainstream Banks) (MFI) (Mainstream Banks) (MFI)
Markup after entry relative to monopolist level
Mainstream banks 0.5517∗∗ 0.9482 0.5405∗∗ 0.9583(0.018) (0.0334) (0.0162) (0.0335)
MFIs 0.9331∗∗ 0.2499∗∗ 1.0707∗∗ 0.2527∗∗
(0.0078) (0.004) (0.0074) (0.0032)
Loan supply after entry relative to monopolist level
Mainstream banks 1.0848∗∗ 1.0111 1.0809∗∗ 1.0114(0.0158) (0.0159) (0.0163) (0.0174)
MFIs 1.0716∗∗ 1.2359∗∗ 1.0682∗∗ 1.2408∗∗
(0.0185) (0.0248) (0.0222) (0.0311)
Profit after entry relative to monopolist level
Mainstream banks 0.5984∗∗ 0.9633 0.5842∗∗ 0.9696(0.0149) (0.0299) (0.0144) (0.0301)
MFIs 0.9999 0.3089∗∗ 1.1438∗∗ 0.3135∗∗
(0.0254) (0.0079) (0.0334) (0.0094)
Log-likelihood 968.5722 968.5722 925.6567 925.6567
Standard errors in brackets‘**’ and ‘*’ indicate whether the new value differs significantly from 1 (1% and 5% significance level.
Table 5: Effects of entry on profit, loan supply and markup
The second section of Table 5 presents the effect of different market structures on loansupply (measured as the value of the stock of microloans per capita). The results indicatethat the presence of competitors of both types contributes to larger loan supply, even aftercontrolling for observed and unobserved characteristics of the market. The magnitudeof this effect on the loan supply of MFIs depends of the type of competitor present themarket: there is no significant difference in the loan supply if there is one mainstreaminstitution, compared to the benchmark case of monopoly. In contrast, the loan supplyis 24,08% larger that in the benchmark scenario if there is another MFI in the market.These results indicate that the presence of mainstream institutions do not contribute tothe market expansion of the segment of clients that are relevant for MFIs. This is anexpected result, given that MFIs focus on potential clients that are often considered as noteligible by traditional banks.
26

In contrast, the loan supply of mainstream institutions is greater than in the monopolycases in market with competitors of any type. This is an interesting result, given that MFIsspecialize in a segment of the population that is not targeted by mainstream banks due tocredit risk considerations, and it is consistent with the argument that MFIs facilitate theaccess of higher risk clients to traditional banking services.
How much of this expansion is directed towards new clients is a question that deservesfurther exploration. With the data available here I can only provide an indirect answer. Ifgreater indebtedness of existing clients translates into higher materialization of credit risk,or additional costs in order to achieve expand the stocks of loans or deposits (additionaladvertising, higher remuneration for deposits or lower interest rates for loans), then themarkup of of mainstream banks should decrease after entry of MFIs. I find instead that themarkup is higher after entry of MFIs; therefore, mainstream institutions seem to be moreprofitable in markets where there is at least one microfinance institution in the market.
The results obtained under a more flexible specification for the competitive interactionacross types, defined by equations 10 and 12 are shown in Table 6. The direction of thechanges on markup and loan supply after entry are consistent with the ones presented intable 5. However, the effect of entry of the first MFI in the market on the loans supplyof mainstream banks is different from the one related to subsequent entrants. While thefirst competitor of this type generates significant market expansion, the effect of entry ofadditional competitors becomes not significant. These results are consistent with greatercompetition in markets with a higher number of competitors. As loan providers competeto attract new clients, there is an increased pressure to extend their services towards clientswith higher default risk, or to incur into higher advertising expenditures in order to achievegreater indebtedness (or deposits) from low risk clients. The higher risk may translate intolower payments from interests if it materializes, reducing the markup.
Now I look further into the competitive interaction of financial institutions in differenttypes of markets, according to population size. The effect of entry on markup and loanssupply are shown in Table 7. The results indicate that MFIs are more effective at generatingmarket expansion in small markets, while the opposite occurs in bigger markets, where loansupply expansion is greater after entry of mainstream institutions15. Furthermore, I findthat in the case of mainstream loan providers, the markup drop is smaller after entry ofcompetitors of the same in small markets. This indicates that competitive interaction isless tough than the one observed in larger markets, where the markup after entry is just0.38 times the monopolist level.
6.1. Changes in market structure after modifications of the usury rate
The modifications in the calculation of the usury rate for microcredit in 2008 and 2010translated into a significant rise of the average interest rate charged by both, mainstreaminstitutions and MFIs, for this type of loans, as shown in Figure 1. The subsequent
15In these markets, there is at most one MFI, therefore, I am not able to identify the parameters thatcapture competitive interaction among competitors of this type
27

increase of the scale of operation of MFIs, in terms of the stock of loans and the sizeof their branching network indicates that under the new interest rate cap scheme theseinstitutions have been able to cover the additional costs of reaching higher risk clients whoonly had access to informal funding sources, typically onerous. Furthermore, the increasedscale of operations have allowed them to fulfill the capital requirements needed to operateas banks, which has opened to them the possibility of capturing deposits from the publicand access to mechanisms that prevent liquidity shortages (interbank market and centralbank as lender of last resort). On the other side, mainstream loan providers have startedto offer financial services for the low income segment of the population such as microcreditsand small-amount credit cards in latest years. These changes are likely to have a significantimpact in the competitive interaction between mainstream institutions and MFI, as wellas their ability to generate market expansion. The structural model that I propose hereallows to gather evidence of the changes that the regulatory measure may have generatedon market structure.
Table 8 compares the results for 2007, one year before a new ceiling for the microcreditrate, fixed at 34%, was introduced, with those for 2010, months before the new ceilingwas removed and replaced for a cap that is calculated as 1.5 times the average interestrate charged by financial institutions16. The first two columns of Table 8 show that therewas no significant interaction among mainstream loan providers and MFIs, since boththe estimated markup and the loan supply are similar to the ones that would have beenobtained under monopoly. This result is consistent with the fact that mainstream institu-tions’ portfolio of services for low income clients was very limited. Moreover, most of theinstitutions that offered microcredit were non profit institutions that did not report pay-ment information of their clients to credit agencies, which may have made it more difficultfor mainstream institutions to have access to payment information from their clients.
There is a significant change in the competitive interaction of MFIs between 2007 and2010, after they where allowed to charge a higher interest rate for microcredits. The markupdrop after entry of another MFI was smaller than the one observed in 2007, suggesting lessintense competition than the one evidenced in 2007, while the effect of entry on loan supplyseems to be larger, indicating that MFIs where able to generate greater market expansionin this period. Comparing the results for 2010 and 2014, when the interest rate cap formicrocredit started being calculated as 1.5 times the average rate of the niche, we can seethat the estimated effect of entry of a MFI on the loan supply of other competitors of thesame type is larger for the latest year, while the markup after entry is smaller, indicatinggreater competition among this type of loan providers.
16I estimate the model that assumes sustituibility and one sided complementarity and chose the onewith the higher log-likelihood in each case. In both years, the later assumption seem to capture better theinteraction across types
28
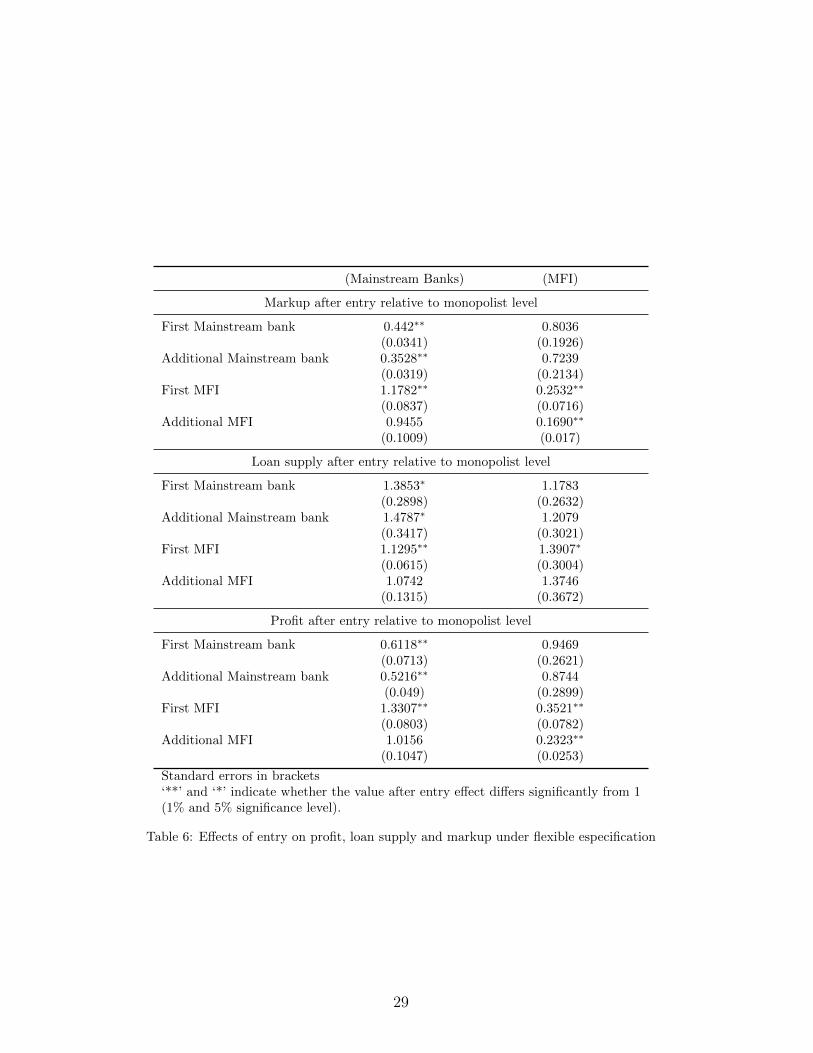
(Mainstream Banks) (MFI)
Markup after entry relative to monopolist level
First Mainstream bank 0.442∗∗ 0.8036(0.0341) (0.1926)
Additional Mainstream bank 0.3528∗∗ 0.7239(0.0319) (0.2134)
First MFI 1.1782∗∗ 0.2532∗∗
(0.0837) (0.0716)Additional MFI 0.9455 0.1690∗∗
(0.1009) (0.017)
Loan supply after entry relative to monopolist level
First Mainstream bank 1.3853∗ 1.1783(0.2898) (0.2632)
Additional Mainstream bank 1.4787∗ 1.2079(0.3417) (0.3021)
First MFI 1.1295∗∗ 1.3907∗
(0.0615) (0.3004)Additional MFI 1.0742 1.3746
(0.1315) (0.3672)
Profit after entry relative to monopolist level
First Mainstream bank 0.6118∗∗ 0.9469(0.0713) (0.2621)
Additional Mainstream bank 0.5216∗∗ 0.8744(0.049) (0.2899)
First MFI 1.3307∗∗ 0.3521∗∗
(0.0803) (0.0782)Additional MFI 1.0156 0.2323∗∗
(0.1047) (0.0253)
Standard errors in brackets‘**’ and ‘*’ indicate whether the value after entry effect differs significantly from 1(1% and 5% significance level).
Table 6: Effects of entry on profit, loan supply and markup under flexible especification
29

Less than 30000 Inhabs. More than 30000 Inhabs.Type of institution Mainstream MFI Mainstream MFI
Markup after entry relative to monopolist level
Mainstream 0.7171∗∗ 0.7396∗∗ 0.3822∗∗ 0.8082∗∗
(0.1354) (0.1258) (0.0858) (0.0673)MFI 0.9554 - 1.0607 0.6158∗∗
(0.0635) - (0.0908) (0.1251)
Loan supply after entry relative to monopolist level
Mainstream 1.1235∗∗ 1.0814 1.2768∗∗ 1.0497∗∗
(0.0415) (0.0643) (0.0278) (0.0335)MFI 1.2567∗∗ - 1.0350 1.1538∗∗
(0.0878) - (0.0265) (0.0207)
Profit after entry relative to monopolist level
Mainstream 0.8056∗∗ 0.7998∗∗ 0.4879∗∗ 0.8483∗∗
(0.1154) (0.0558) (0.0558) (0.0673)MFI 1.2006∗∗ - 1.0948 0.7105∗∗
(0.0873) - (0.0808) (0.0951)
Standard errors in brackets‘**’ and ‘*’ indicate whether the value after entry effect differs significantly from 1(1% and 5% significance level).
Table 7: Competitive interaction of loan providers in different markets
2007 2010Mainstream MFI Mainstream MFI
Markup after entry relative to monopolist level
Mainstream 0.6348∗∗ 0.9733 0.5294∗∗ 0.9775∗∗
(0.0339) (0.0431) (0.0351) (0.0171)MFI 1.0338 0.1638∗∗ 0.9873 0.3538∗∗
(0.0265) (0.0351) (0.0718) (0.0091) )
Loan supply after entry relative to monopolist level
Mainstream 1.1243∗∗ 0.9835 1.0635∗∗ 1.0575∗∗
(0.0158) (0.0458) (0.0097) (0.0211)MFI 1.0047 1.0873∗∗ 1.0385 1.1334∗∗
(0.0235) (0.0362) (0.0283) (0.0432)
Profit after entry relative to monopolist level
Mainstream 0.7137∗∗ 0.9572 0.5630∗∗ 1.0358∗∗
(0.0301) (0.0441) (0.0241) (0.0128)MFI 1.0387 0.1781∗∗ 1.0253∗∗ 0.4009∗∗
(0.0251) (0.0341) (0.0442) (0.0223)
Standard errors in brackets‘**’ and ‘*’ indicate whether the value after entry effect differs significantly from 1(1% and 5%).
Table 8: Competitive interaction of loan providers in different markets
30
7. Final Remarks
The model presented here allows to measure the impact of entry of MFIs on the profitof incumbent formal financial institutions in geographic isolated markets. The resultsindicate that these institutions are able to generate market expansion that benefits allcompetitors in the market. Furthermore, I find that size of these spillovers exceeds thebusiness stealing effect, generating therefore, an increase on the profit, particularly in ruralmarkets. If these expected gains materialize in entry of mainstream lending establishmentsin isolated markets, then MFIs would contribute to the consumer welfare by facilitatingaccess to financial products that are beyond their own portfolio. This new insight aboutthe competitive interaction among MFIs and other formal loan providers could help in thedesign of policies oriented towards financial inclusion.
The model I presented also provides insights about the toughness of competition in theretail banking industry in Colombia and how it has changed during recent years after therelaxation of the interest rate cap that applies for microcredit. I find that microfinanceinstitutions have increased their ability to generate market expansion after the relaxationof the interest rate cap applied to microcredits in 2007 and 2010. The result indicates thatthe presence of an interest rate cap hindered the possibility to offer financial services tolow income segments of the population and might have reduced competition among loanproviders. The magnitude of the effect is hard to interpret, since there have been importanttechnological and regulatory changes that might have had also an effect in the competitiveinteraction among competitors in the retail banking industry. In order to disentangle theseeffects it is necessary to introduce additional structure on the profit function of the loanproviders.
One limitation of my approach is the impossibility to identify the mechanisms behindthe positive spillovers associated to the entry of MFIs. Although they could be associatedwith the creation of information about payment behavior that becomes available for otherinstitutions, there are alternative explanations. One possibility is that the interaction withMFIs help clients to increase their levels of financial literacy and awareness or trust informal institutions, which may lead them to demand more products offered by mainstreamfinancial institutions, particularly those related with deposits. Finally, the timely access tofunding is likely to have an important impact on the rate of success of productive projects,translating into sustained improvements in the economic conditions of clients, which wouldallow them to demand other types of financial services in the future. Exploring thesealternative mechanisms requires more detailed information about the portfolio choices ofthe consumers in those markets over time, and therefore it is left for future research.
One important factor that affect the competitive interaction in the retail banking in-dustry and the supply of microcredit is technological change, in the form of virtual andmobile channels that facilitate the access to financial products without a traditional ’brickand mortar’ branch. These innovations are likely to have an important impact in the waycompetitors interact in these markets and represent a challenge for econometricians andpolicy makers, since accurate measures of competition need to take into account the poten-tial interaction of competitors across markets and platforms. In Colombia, most of these
31

innovations are still not available in small remote towns, and the presence of a traditionalbranch continues being necessary for the provision of loans, particularly in the case ofmicrocredit, since most of the specialized loan providers perform close monitoring of theclients ventures. However, important steps have been taken both by the government andthe private sector in order to facilitate access to financial services in the absence of tradi-tional branches, which highlight the need to study the strategic complementarities amongtransaction channels and their effect on the competitive interaction among loan providers.
Moreover, the use of virtual and mobile transaction channels for capturing depositsand perform transactions have important consequences on the relations between the de-posits and the loan market that I have not taken into account in this paper. So far, thebanking industry has been faster at developing interaction platforms that facilitate the useof deposits, than at implementing tools that facilitate remote monitoring of credit risk,particularly in the case of microfinance. As highlighted by Aguirregabiria et al. (2012),these differences have a significant impact in the way that loan providers obtain fundingfor their operations, exposing financial institutions to different degrees of geographical risk,and may ultimately reduce the possibility of consumers in far locations to get loans, asfinancial institutions might find it profitable to concentrate their loan operations in thebiggest markets.
32

Bibliography
Adams, R.M., Brevoors, K.P., Kiser, E.K., 2007. Who competes with whom? the caseof depository institutions. The Journal of Industrial Economics 55, 141–167. URL:http://www.jstor.org/stable/4622377.
Aguirregabiria, V., Clark, R., Wang, H., 2012. Diversification of Geographic Risk in RetailBank Networks: Evidence from Bank Expansion after the Riegle-Neal Act. WorkingPapers. University of Toronto, Department of Economics. URL: http://EconPapers.repec.org/RePEc:tor:tecipa:tecipa-465.
Aguirregabiria, V., Wang, H., 2016. The Geographic Flow of Bank Funding : BranchNetworks and Local-Market Competition. Unpublished manuscript, Toronto University.
Banca de las Oportunidades, 2014. Reporte de Inclusion Financiera. Technical Report.Banca de las Oportunidades. URL: http://bancadelasoportunidades.gov.co/es/
reportes/315.
Banerjee, A.V., 2013. Microcredit under the microscope: What have we learned in the pasttwo decades, and what do we need to know? Annual Review of Economics 5, 487–519.URL: https://doi.org/10.1146/annurev-economics-082912-110220, doi:10.1146/annurev-economics-082912-110220, arXiv:https://doi.org/10.1146/annurev-economics-082912-110220.
Barona, B., 2004. Microcredito en colombia. Estudios Gerenciales 90, 79–102. URL: http://www.scielo.org.co/scielo.php?script=sci_arttext&pid=
S0123-59232004000100004&lng=en&tlng=es.
Berger, A.N., Dick, A.A., 2007. Entry into Banking Markets and the Early-Mover Advant-age. Journal of Money, Credit and Banking 39, 775–807.
Berger, A.N., Mester, L.J., 2003. Explaining the dramatic changes in perform-ance of us banks: technological change, deregulation, and dynamic changes incompetition. Journal of Financial Intermediation 12, 57 – 95. URL: http:
//www.sciencedirect.com/science/article/pii/S1042957302000062, doi:http://dx.doi.org/10.1016/S1042-9573(02)00006-2.
Bresnahan, T.F., Reiss, P.C., 1990. Entry in monopoly markets. The Review of EconomicStudies 57, 531–553. URL: http://www.jstor.org/stable/2298085.
Cleeren, K., Verboven, F., Dekimpe, M.G., Gielens, K., 2010. Intra-and interformat com-petition among discounters and supermarkets. Marketing science 29, 456–473.
Cohen, A., 2004. Market structure and market definition: the case of small market banksand thrifts. Finance and Economics Discussion Series 2004-02. Board of Governors ofthe Federal Reserve System (U.S.). URL: https://ideas.repec.org/p/fip/fedgfe/2004-02.html.
33

Cohen, A., Mazzeo, M.J., 2010. Investment Strategies and Market Structure: An EmpiricalAnalysis of Bank Branching Decisions. Journal of Financial Services Research 38, 1–21.doi:10.1007/s10693-010-0082-7.
Cull, R., Asli Demirguc-Kunt, A., Morduch, J., 2009a. Microfinance meets the mar-ket. Journal of Economic Perspectives 23, 167–92. URL: http://www.aeaweb.org/
articles?id=10.1257/jep.23.1.167, doi:10.1257/jep.23.1.167.
Cull, R., Demirguc-Kunt, A., Morduch, J., 2009b. Microfinance Meets the Market. Journalof Economic Perspectives 23, 167–192.
Cull, R., Demirguc-Kunt, A., Morduch, J., 2014. Banks and microbanks. Journal of Finan-cial Services Research 46, 1–53. URL: https://doi.org/10.1007/s10693-013-0177-z,doi:10.1007/s10693-013-0177-z.
Dai, M., Yuan, Y., 2013. Product differentiation and efficiencies in the retail bank-ing industry. Journal of Banking & Finance 37, 4907 – 4919. URL: http://www.
sciencedirect.com/science/article/pii/S0378426613003737, doi:https://doi.org/10.1016/j.jbankfin.2013.09.005.
Demont, T., 2016. Microfinance spillovers: A model of competition in informal creditmarkets with an application to Indian villages. European Economic Review 89, 21–41. URL: http://dx.doi.org/10.1016/j.euroecorev.2016.06.003, doi:10.1016/j.euroecorev.2016.06.003.
D’Espallier, B., Goedecke, J., Hudon, M., Mersland, R., 2017. From ngos to banks: Doesinstitutional transformation alter the business model of microfinance institutions? WorldDevelopment 89, 19 – 33. URL: http://www.sciencedirect.com/science/article/pii/S0305750X16304077, doi:https://doi.org/10.1016/j.worlddev.2016.06.021.
Estrada, D., Rozo, S., 2006. Multimarket spatial competition in the Colombian depositmarket. Borradores de Economıa. Banco de la Republica 413.
Fernandez, R., 2016. Spillovers Effects and City Development. Job Market Paper - TilburgUniversity 1.
Hermes, N., Lensink, R., 2007. The empirics of microfinance: What do we know? TheEconomic Journal 117, F1–F10. URL: http://www.jstor.org/stable/4625473.
Ho, K., Ishii, J., 2011. Location and competition in retail banking. International Journalof Industrial Organization 29, 537 – 546.
Holmes, T.J., 2011. The diffusion of wal-mart and economies of dens-ity. Econometrica 79, 253–302. URL: https://onlinelibrary.
wiley.com/doi/abs/10.3982/ECTA7699, doi:10.3982/ECTA7699,arXiv:https://onlinelibrary.wiley.com/doi/pdf/10.3982/ECTA7699.
34

Huysentruyt, M., Lefevere, E., Menon, C., 2013. Dynamics of retail-bank branching inantwerp (belgium) 1991-2006: Evidence from micro-geographic data. Journal of Banking& Finance 37, 291 – 304.
de Juan, R., 2003. The independent submarkets model: an application to the span-ish retail banking market. International Journal of Industrial Organization 21, 1461–1487. URL: https://EconPapers.repec.org/RePEc:eee:indorg:v:21:y:2003:i:
10:p:1461-1487.
Kaboski, J.P., Townsend, R.M., 2012. The impact of credit on village economies. Amer-ican Economic Journal: Applied Economics 4, 98–133. URL: http://www.aeaweb.org/articles?id=10.1257/app.4.2.98, doi:10.1257/app.4.2.98.
Ly, P., Mason, G., 2012. Competition Between Microfinance NGOs: Evidence from Kiva.World Development 40, 643–655. URL: http://dx.doi.org/10.1016/j.worlddev.
2011.09.009, doi:10.1016/j.worlddev.2011.09.009.
Mazzeo, M.J., 2002. Competitive outcomes in product-differentiated oligopoly. The Reviewof Economics and Statistics 84, 716–728.
McIntosh, C., de Janvry, A., Sadoulet, E., 2005. How rising competition among mi-crofinance institutions affects incumbent lenders*. The Economic Journal 115, 987–1004. URL: http://dx.doi.org/10.1111/j.1468-0297.2005.01028.x, doi:10.1111/j.1468-0297.2005.01028.x.
Mookherjee, D., Motta, A., 2016. A theory of interactions between MFIs and informallenders. Journal of Development Economics 121, 191–200. URL: http://dx.doi.org/10.1016/j.jdeveco.2014.11.009, doi:10.1016/j.jdeveco.2014.11.009.
Rozo, S., Vasquez, D., Estrada, D., 2008. An industrial organization analysis for thecolombian banking system. Borradores de Economıa - Banco de la Republica 413.
Salamanca, D., 2005. Competencia en los Mercados de Credito y Depositos en Colombia:aplicacion de un Modelo Oligopolio Fijador de Precios. Tesis (Magıster en Economıa)Universidad de los Andes .
Schaumans, C., Verboven, F., 2015. Entry and Competition in Differentiated ProductsMarkets. The Review of Economics and Statistics 97, 195–209. URL: https://ideas.repec.org/a/tpr/restat/v97y2015i1p195-209.html.
35

Appendix
Tables 9 and 10 present the complete results of the structural model. Table 9 presentseffects on the overall profit for different types of competitors, while 10 contains the resultsfor the loan supply equation. The coefficients of market characteristics are as expectedfor the two types of financial institutions. Income per capita and the share of populationwith formal employment have a positive and significant impact on profit for both types ofloan providers, while the share of population in poverty condition has a negative impact.The share of GDP derived from agricultural activities has a negative impact on entry formainstream institutions, while positive for MFIs, suggesting that these institutions focuson providing funding for clients in this sector.
The second part of Table 10 presents the coefficients estimated for the loan supplyequation. The results suggest that there is significant market expansion after the entry ofan additional competitor of either type. For both types of loan providers the effect is greaterafter the entry of a competitor of the same type. The results in terms of demographiccharacteristics of the markets are similar to those obtained for the profit equation. In thisequation however, the coefficient obtained for the share of GDP related to agriculturalactivities, as well as the presence of a public bank, is positive for both types of loanproviders.
36
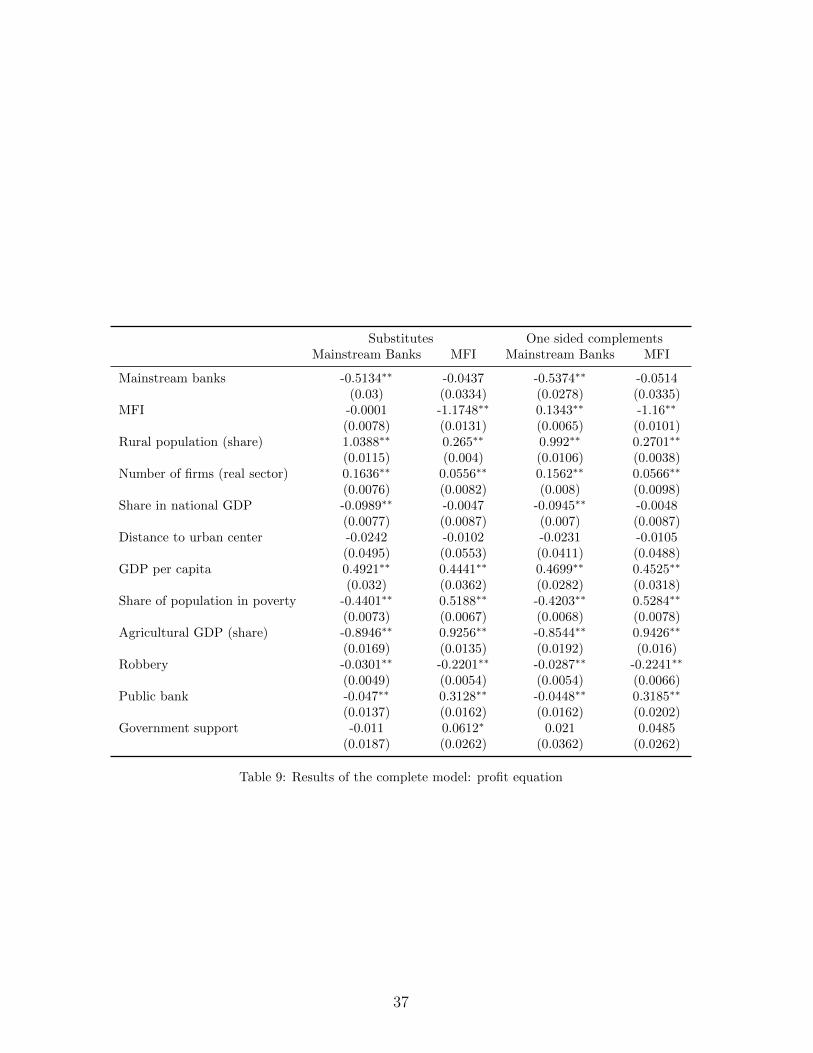
Substitutes One sided complementsMainstream Banks MFI Mainstream Banks MFI
Mainstream banks -0.5134∗∗ -0.0437 -0.5374∗∗ -0.0514(0.03) (0.0334) (0.0278) (0.0335)
MFI -0.0001 -1.1748∗∗ 0.1343∗∗ -1.16∗∗
(0.0078) (0.0131) (0.0065) (0.0101)Rural population (share) 1.0388∗∗ 0.265∗∗ 0.992∗∗ 0.2701∗∗
(0.0115) (0.004) (0.0106) (0.0038)Number of firms (real sector) 0.1636∗∗ 0.0556∗∗ 0.1562∗∗ 0.0566∗∗
(0.0076) (0.0082) (0.008) (0.0098)Share in national GDP -0.0989∗∗ -0.0047 -0.0945∗∗ -0.0048
(0.0077) (0.0087) (0.007) (0.0087)Distance to urban center -0.0242 -0.0102 -0.0231 -0.0105
(0.0495) (0.0553) (0.0411) (0.0488)GDP per capita 0.4921∗∗ 0.4441∗∗ 0.4699∗∗ 0.4525∗∗
(0.032) (0.0362) (0.0282) (0.0318)Share of population in poverty -0.4401∗∗ 0.5188∗∗ -0.4203∗∗ 0.5284∗∗
(0.0073) (0.0067) (0.0068) (0.0078)Agricultural GDP (share) -0.8946∗∗ 0.9256∗∗ -0.8544∗∗ 0.9426∗∗
(0.0169) (0.0135) (0.0192) (0.016)Robbery -0.0301∗∗ -0.2201∗∗ -0.0287∗∗ -0.2241∗∗
(0.0049) (0.0054) (0.0054) (0.0066)Public bank -0.047∗∗ 0.3128∗∗ -0.0448∗∗ 0.3185∗∗
(0.0137) (0.0162) (0.0162) (0.0202)Government support -0.011 0.0612∗ 0.021 0.0485
(0.0187) (0.0262) (0.0362) (0.0262)
Table 9: Results of the complete model: profit equation
37

Substitutes One sided complementsMainstream Banks MFI Mainstream Banks MFI
Mainstream banks 0.0814∗∗ 0.0111∗∗ 0.0778∗∗ 0.0113∗
(0.0054) (0.0058) (0.0058) (0.0073)MFI 0.0692∗∗ 0.2118∗∗ 0.066∗∗ 0.2158∗∗
(0.0173) (0.0201) (0.0208) (0.0251)
Rural population (share) -1.9332∗∗ -1.7113∗∗ -1.893∗∗ -1.6776∗∗
(0.0333) (0.0343) (0.0319) (0.0329)Number of firms (real sector) 0.6814∗∗ 0.298∗∗ 0.6851∗∗ 0.295∗∗
(0.0121) (0.0142) (0.0121) (0.0158)Share in national GDP 0.0878∗∗ 0.1659∗∗ 0.0828∗∗ 0.1741∗∗
(0.0032) (0.0036) (0.0031) (0.0038)Distance to urban center -0.1268∗∗ -0.2278∗∗ -0.1174∗∗ -0.2387∗∗
(0.0074) (0.0083) (0.0064) (0.0077)GDP per capita -0.5013∗∗ -0.7437∗∗ -0.4807∗∗ -0.7628∗∗
(0.0068) (0.0071) (0.0063) (0.0074)Share of population in poverty -6.9591∗∗ -2.2988∗∗ -7.0173∗∗ -2.2846∗∗
(0.0797) (0.0759) (0.0821) (0.0839)Agricultural GDP (share) -0.3058∗∗ -0.7602∗∗ -0.2846∗∗ -0.8165∗∗
(0.0267) (0.0298) (0.0236) (0.0288)Robbery 0.1057∗∗ 0.0895∗∗ 0.1032∗∗ 0.0889∗∗
(0.0055) (0.0061) (0.0054) (0.0063)Public bank -0.4433∗∗ 0.3569∗∗ -0.4693∗∗ 0.3865∗∗
(0.0106) (0.0116) (0.0097) (0.012)Population 0.4009∗∗ 0.4473∗∗ 0.3829∗∗ 0.4556∗∗
(0.0156) (0.017) (0.016) (0.0183)Government support 0.091 0.1312∗ 0.0871 0.1148∗∗
(0.0287) (0.0571) (0.0393) (0.0427)
Log-likelihood -968.5722 -968.5722 -925.6567 -925.6567
Table 10: Results of the complete model: Loan supply equation
38