EFFECTS OF ENTERPRISE RESOURCE PLANNING...
58
i EFFECTS OF ENTERPRISE RESOURCE PLANNING SYSTEM ON STAKEHOLDERS PERFORMANCE: A CASE STUDY OF SAFARICOM LIMITED MEROKA, ENOS NYASIMI A RESEARCH PROJECT SUBMITTED TO THE SCHOOL OF MANAGEMENT AND LEADERSHIP IN PARTIAL FULFILMENT FOR THE AWARD OF DEGREE IN EXECUTIVE MASTERS IN BUSINESS ADMINISTRATION OF THE MANAGEMENT UNIVERSITY OF AFRICA OCTOBER, 2015
Transcript of EFFECTS OF ENTERPRISE RESOURCE PLANNING...

i
EFFECTS OF ENTERPRISE RESOURCE PLANNING SYSTEM ON STAKEHOLDERS
PERFORMANCE: A CASE STUDY OF SAFARICOM LIMITED
MEROKA, ENOS NYASIMI
A RESEARCH PROJECT SUBMITTED TO THE SCHOOL OF MANAGEMENT AND
LEADERSHIP IN PARTIAL FULFILMENT FOR THE AWARD OF DEGREE IN
EXECUTIVE MASTERS IN BUSINESS ADMINISTRATION OF THE MANAGEMENT
UNIVERSITY OF AFRICA
OCTOBER, 2015

ii
DECLARATION
This project is my original work and has not been presented for a degree in any other University
------------------------------------------ ----------------------------------
Signature Date
Meroka, Enos Nyasimi
EMBA/8/00123/3/2014
This project has been submitted for examination with my approval as University Supervisor
------------------------------------------ ----------------------------------
Signature Date
Christine Obare
For and Behalf of The Management University of Africa

iii
DEDICATION
This work is dedicated to God, who is everything to me. I owe all my academic achievements to
Him. I also dedicate it to my family and my parents for their support and bearing with me during
this process. Your love, support and encouragement has seen me through this journey.
iv
ACKNOWLEDGEMENT
My sincere gratitude goes to Almighty God for the much needed strength, courage and health He
has given me to carry out my research. I am very grateful to my supervisor Christine Obare for
the intellectual advice and encouragement that she has given me. I also thank the entire
administration and management of the Management University of Africa for their co-operation
and all those who have sacrificed their time towards the contribution of this noble duty. I would
also like to thank all the respondents at Safaricom limited who took time to respond to my
interview questions thus making this study successful. I am deeply indebted to many others
whom I have consulted in the course of preparing this project. I thank them for being supportive
and co-operative in various ways.
v
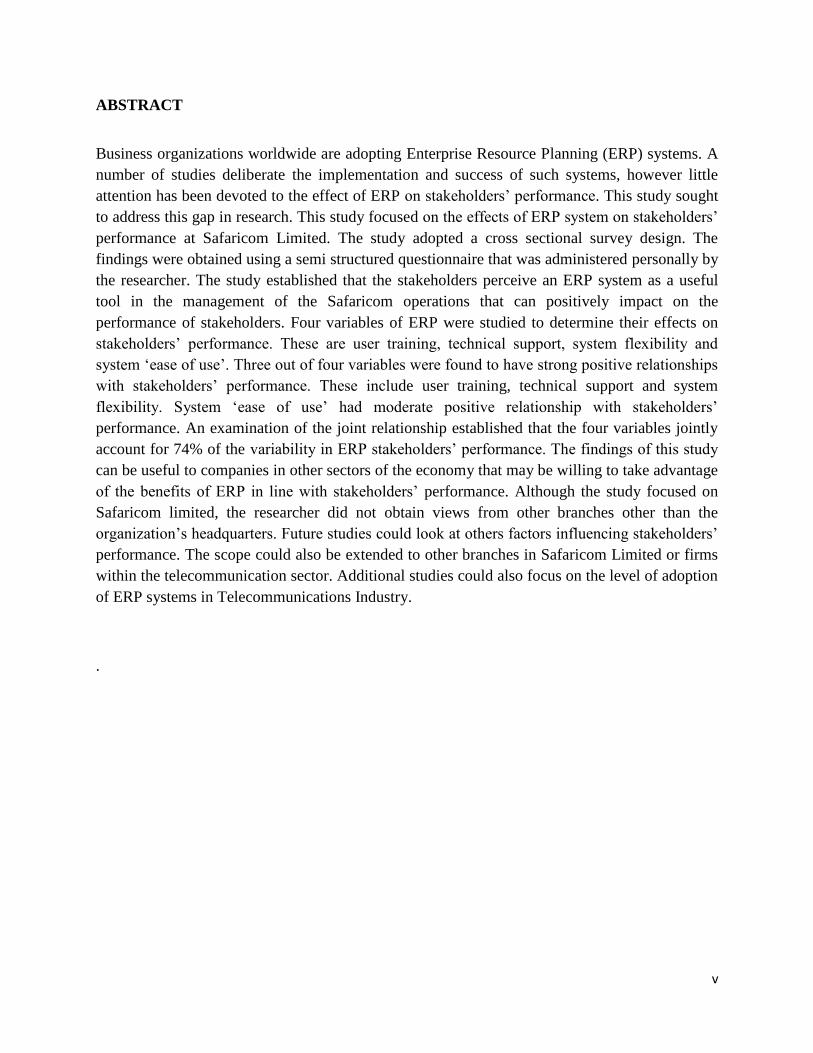
ABSTRACT
Business organizations worldwide are adopting Enterprise Resource Planning (ERP) systems. A
number of studies deliberate the implementation and success of such systems, however little
attention has been devoted to the effect of ERP on stakeholders‟ performance. This study sought
to address this gap in research. This study focused on the effects of ERP system on stakeholders‟
performance at Safaricom Limited. The study adopted a cross sectional survey design. The
findings were obtained using a semi structured questionnaire that was administered personally by
the researcher. The study established that the stakeholders perceive an ERP system as a useful
tool in the management of the Safaricom operations that can positively impact on the
performance of stakeholders. Four variables of ERP were studied to determine their effects on
stakeholders‟ performance. These are user training, technical support, system flexibility and
system „ease of use‟. Three out of four variables were found to have strong positive relationships
with stakeholders‟ performance. These include user training, technical support and system
flexibility. System „ease of use‟ had moderate positive relationship with stakeholders‟
performance. An examination of the joint relationship established that the four variables jointly
account for 74% of the variability in ERP stakeholders‟ performance. The findings of this study
can be useful to companies in other sectors of the economy that may be willing to take advantage
of the benefits of ERP in line with stakeholders‟ performance. Although the study focused on
Safaricom limited, the researcher did not obtain views from other branches other than the
organization‟s headquarters. Future studies could look at others factors influencing stakeholders‟
performance. The scope could also be extended to other branches in Safaricom Limited or firms
within the telecommunication sector. Additional studies could also focus on the level of adoption
of ERP systems in Telecommunications Industry.
.

vi
TABLE OF CONTENTS
DECLARATION .......................................................................................................................................... ii
DEDICATION ............................................................................................................................................. iii
ACKNOWLEDGEMENT ........................................................................................................................... iv
ABSTRACT .................................................................................................................................................. v
LIST OF TABLES ....................................................................................................................................... ix
LIST OF FIGURES ...................................................................................................................................... x
CHAPTER ONE: INTRODUCTION ....................................................................................................... 1
1.0 INTRODUCTION ........................................................................................................................ 1
1.1 Background Information ............................................................................................................... 1
1.2 Enterprise Resource Planning (ERP) ............................................................................................ 2
1.2.1 ERP Stakeholders ...................................................................................................................... 3
1.2.2 Stakeholders Performance ......................................................................................................... 3
1.3 Overview of Safaricom Limited ............................................................................................... 4
1.4 Statement of the Problem .............................................................................................................. 5
1.5 Objectives of the Study ................................................................................................................ 6
1.5.1 General Research Objective .................................................................................................. 6
1.5.2 Specific Objectives ............................................................................................................... 6
1.6 Research Questions ...................................................................................................................... 6
1.7 Significance of the Study ............................................................................................................. 7
1.8 Scope of the Study ....................................................................................................................... 8
CHAPTER TWO: LITERATURE REVIEW ......................................................................................... 9
2.0 Introduction ................................................................................................................................... 9
2.1 Theoretical Literature .................................................................................................................... 9
2.1.1 Stakeholder Theory ................................................................................................................... 9
2.1.2 Contingency Theory ................................................................................................................ 10
2.2 Empirical Literature .................................................................................................................... 11
2.2.1 ERP System ............................................................................................................................ 11
2.2.2 Stakeholders ........................................................................................................................ 12
2.2.3 Performance ........................................................................................................................ 14
2.2.4 Enterprise Resource Planning (ERP) System and Stakeholders‟ Performance .................. 15

vii
2.3 Conceptual Framework of Research ........................................................................................... 17
2.4 Operationalization of variables ................................................................................................... 18
2.5 Research Gap .............................................................................................................................. 20
CHAPTER 3: RESEARCH METHODOLOGY ....................................................................................... 21
3.1 Introduction ................................................................................................................................. 21
3.2 Research Design .......................................................................................................................... 21
3.3 The Target Population and Sample ............................................................................................. 21
3.3.1 The Target Population ............................................................................................................. 21
3.3.2 Sample Size and Sampling Procedures ................................................................................... 22
3.4 Data Collection Methods ............................................................................................................ 23
3.4.1 Techniques and Instruments .................................................................................................... 23
3.4.2 Pre-Testing the Research Instruments ..................................................................................... 23
3.4.3 Research Procedure ................................................................................................................. 23
3.5 Data Analysis Methods ............................................................................................................... 23
3.6 Ethical Considerations ................................................................................................................ 24
CHAPTER FOUR: DATA ANALYSIS, FINDINDS AND DISCUSSION ......................................... 25
4.1 Introduction ..................................................................................................................................... 25
4.2 Demographic Profiles ..................................................................................................................... 25
4.3 User Training ........................................................................................................................................ 28
4.3.1 Perception on User Training .......................................................................................................... 28
4.4 System „Ease of Use‟ ............................................................................................................................ 29
4.4.1 Perception on System „Ease of Use‟ .............................................................................................. 29
4.5 System Flexibility ........................................................................................................................... 31
4.5.1 Perception on System „Ease of Use‟ ....................................................................................... 31
4.6 Technical Support .......................................................................................................................... 32
4.6.1 Perception on Technical Support ................................................................................................... 32
4.7 Stakeholders‟ Performance ................................................................................................................... 34
4.7.1 Perception on Stakeholders‟ Performance ..................................................................................... 34
4.8 Inferential statistics on effects of ERP on stakeholders performance ............................................. 35
4.8.1 Regression Analysis ........................................................................................................................... 37
CHAPTER FIVE: CONCLUSIONS AND RECOMMENDATIONS ................................................... 38
5.1 Introduction ....................................................................................................................................... 38
viii
5.2 Summary of the findings ................................................................................................................... 38
5.3 Conclusions ....................................................................................................................................... 38
5.4 Recommendations ............................................................................................................................. 39
5.5 Limitations of the study .................................................................................................................... 40
5.6 Suggestion for Further Research ....................................................................................................... 40
APPENDICES ............................................................................................................................................ 43
Appendix I: Letter of Introduction .......................................................................................................... 43
Appendix II: Research Study Questionnaire ........................................................................................... 44
Appendix III: Research Study Work plan ............................................................................................... 48

ix
LIST OF TABLES
Table 3.1: Target Population-------------------------------------------------------------- 22
Table 3.2: Sample Size -------------------------------------------------------------------- 22
Table 4.1: Response Rate ----------------------------------------------------------------- 25
Table 4.2: Gender of respondents ------------------------------------------------------- 26
Table 4.3: Age of respondents ----------------------------------------------------------- 26
Table 4.4: Level of Education of respondents------------------------------------------------ 27
Table 4.5: Category of respondents ---------------------------------------------------------- 28
Table 4.6: Extent of user training ---------------------------------------------------------- 28
Table 4.7: Extent of „ease of use‟ ---------------------------------------------------------- 30
Table 4.8: Extent of flexibility ---------------------------------------------------------- 31
Table 4.9: Extent of technical support ----------------------------------------------- 33
Table 4.10: Extent of stakeholders‟ performance------------------------------------------ 34
Table 4.11: Correlation of variables -------------------------------------------------------- 36
Table 4.12: Goodness of Fit Model --------------------------------------------- 37
x
LIST OF FIGURES
Figure 2.1: The Stakeholders Groups, (Hitt, M, Duane R, 2005) –-------------------------- 12
Figure 2.2: Diagram depicting the relationship between the dependent and independent variables
----------------------------------------------------------------------------------------------------- 17
1
CHAPTER ONE: INTRODUCTION
1.0 INTRODUCTION
This chapter entails background of the study, Enterprise Resource Planning, Stakeholders, the
profile of Safaricom Limited, the problem statement, objectives of the study, research questions,
significance of the stud, scope of the study.
1.1 Background Information
Enterprise resource planning (ERP) systems are complex and comprehensive software packages
designed to integrate business processes and functions (Chen and Lin, 2008). Despite the
difficulties and risk involved in their adoption, their use is expanding rapidly. Many
organizations are adopting ERP systems for different reasons, including legacy systems
replacement, cost reductions and faster information transactions (Ifinedo and Nahar, 2006).
ERP systems can help a company achieve competitive advantage. Enterprise systems provide
value both by increasing operational efficiency and by providing firm wide information to help
managers make better decisions (Laudon & Laudon, 2013). Some of the important attributes of
ERP are its abilities to: automate and integrate an organization‟s business processes; produce and
access information in real time environment and share common data and practices across the
entire enterprise. Most organizations expect ERP systems to reduce their operating cost, increase
process efficiency, improve customer responsiveness and provide information for decision
making (Elgaral & Al-Serafi), 2011).
ERP system designers consider priorities and expectations on one hand, and different
stakeholders react differently to the new system on the other, by welcoming, rejecting or
adopting the new system in their organization (Boonstra, 2006). This interaction between the
systems and humans could act as an indicator to evaluate the post-implementation performance.
2
Albeit the post-implementation effectiveness of ERP systems is an essential indicator of success,
organizations do not discuss whether an ERP system is needed; instead, they focus on how to
establish an effective one (Son Yu, 2005). From this viewpoint, ERP post-implementation
effectiveness in organizations can be explained by studying the stakeholders‟ performance and
whether the newly adopted systems meet their needs and expectations.
1.2 Enterprise Resource Planning (ERP)
According to Ghazanfari (2008), Enterprise Resource planning can be defined as a phrase
consisting of three terms of Enterprise (a large enterprise/organization), resources (all resources
available to the organization) and planning (looking at the future with a long-term view rather
than looking at the current situation). The ERP systems are computerized systems that have been
designed for corporate transactions and facilitating planning, production and customer response
in an integrated and immediate form.
ERP systems are software suites that help organizations integrate their information flow and
business processes. They typically support the different processes, departments and functions in
the organization by using a single repository that collects and stores data in real time. When ERP
systems are fully realized in a business organization, they can yield many benefits: reduce cycle
time, enable faster information transactions, facilitate better financial management, lay
groundwork for e-commerce, and make tacit knowledge explicit (Davenport, 2011).
An ERP system can be characterized as an information system made up of different modules,
each supporting the business processes. The modules are integrated and all gathered data are
stored in a central database. The fact that all data are centrally stored makes it possible to extract
data into information. (Aeronauts, Boom, Pijl, and Vosselman, 2005).
Theoretically, many more data and indirect information become available to the organization and
to the people within the organization. Due to this effect business advantages can be expected.
Because data become widely available, it is possible to use these data in order to control an
organization. An example of this mechanism is the possibility of single storage of data, which
can prevent unwished redundancy. Other advantages are the real-time storage of business
3
process data and the business wide availability of data. These assumed advantages are the main
reasons for organizations to implement such ERP systems. In an environment where
organizations more and more depend on information technology, they want to remain
competitive (Spathis and Constantinides, 2004).
1.2.1 ERP Stakeholders
All information system projects have stakeholders and it is important to define who they are.
Boonstra (2009) defines stakeholders as “any group or individual who can affect or is affected by
the achievement of the organization‟s objectives”.
The individual or group of stakeholders will have different expectations, attitudes, levels of
interest and degrees of power and influence (Flower and Gilfillan, 2003). Stakeholders play a
significant role in the success of information systems and evidence has shown that failure by
stakeholders in the development of an IS can lead directly to system failure (Blyth, 1999). As
with any software project, stakeholders are required to make an active contribution, based on
their analysis and communication of requirements, since they acquire significant knowledge of
the organization and of the new system (Ballejos and Monagna, 2008).
In the organization context, identifying the stakeholders is important because there is generally a
lack of provision for their requirements (Wagner and Newell, 2004). Companies have varied
ERP systems users, from different backgrounds, with different goals, education levels and ability
to use the system. Seng and Leoid (2003) identify the stakeholders of ERP systems in
organizations as government bodies, administrative and support staff, industry and society.
1.2.2 Stakeholders Performance
Organizations expect that ERP will create competitive advantages. In assuming that ERP create
advantages, it is necessary to know what effects it has on an organization, its stakeholders and
their performance. A lot of research is conducted into implementation issues and success and fail
factors of ERP. ERP systems support business processes and can be used as a tool to help to
4
realize other goals. It is interesting to see what the effects of ERP systems are on the organization
or what relations exist between ERP and stakeholders‟ performance. ERP systems store all
process data in a single database, so we could assume that ERP systems offer opportunities for
better stakeholders‟ engagement and collaboration.
Shields (2001) observes that organization should select the ERP package, which: fit
organization; provide industry functionality; support changing business environment; easy
integrate with other information systems in organizations; support vendor by implementation;
must be complete; are stable and have good support after implementation; have availability of
implementation accelerators such as training materials, user procedures, help text, process
models; etc.
1.3 Overview of Safaricom Limited
Safaricom Limited started in 1993 as a department of the former stated-owned Kenya Post and
Telecommunication Corporation. In 1997 Safaricom was incorporated as a private limited
company. In 2000, the Vodafone Group of the United Kingdom acquired a 40% stake and
management responsibility for the company. In 2002, it converted to a public company while the
government held 60% of the shares, 25% was listed in an initial public offer in 2008. (Safaricom,
2015)
As of March 2015, Safaricom had a total subscriber base of 21.6 Million, making it the leading
mobile network operators in Kenya. It employs over 4000 employees mainly stationed in Nairobi
and other big cities in Kenya in which it manages its retail outlets. Its headquarters are located in
Safaricom house, Waiyaki Way, Westlands, Nairobi.
Safaricom offers a wide range of products and services to its customers. These range from
mobile telephone services for both its prepay and post-pay customers, international calling and
roaming services, value-added services, Bonga Loyalty services, data services and mobile
money transfer service (M-PESA). Safaricom has a market share of about 71%. Its main
competitor is Airtel Kenya. Other rivals include Orange Kenya, Essar‟s YU and other Data
Service providers. (Safaricom, 2015)
5
In its early existence, 1993 to 2002, there were many discrete systems in Safaricom. Many of the
systems were manual, with only a few being semi-automated or fully-automated. Each
department had its own system; a scenario that led to systems being in the following departments
of Finance, Supply Chain, Procurement, Billing, Human Resources, just to name a few.
(Safaricom, 2015)
The company, through its management took deliberate steps to use information technology as an
enabler of its processes. In response to the realization that processes are inter-related and the
need for efficiency, the company invested in the first ERP in 2003. Its implementation was done
in phases and took more than 3 years to have all the modules fully deployed. Due to changes in
the internal and external environment, a second re-implementation was done in 2014. The
company has not been able to garner all the envisioned and promised benefits that come with the
implementation of the ERP Systems.
1.4 Statement of the Problem
Business organizations are under pressure to ensure continuity of strategic operations with fewer
resources. Such organizations look to their ERP systems to find efficiencies, improve processes,
reduce complexity, integrate systems, and eliminate redundancy.
Prior to the implementation of ERP in organizations, most processes are standalone, with
discrete systems supporting them. The information flow from one system to another is not
automated, requiring lots of manual intervention, tedious long hours, not to mention error-prone
human activities. Interaction, communication, collaboration among the stakeholders is not
automated. The communication process, in most cases is through electronic mail and memos that
need to be uploaded into the discrete systems supporting these stakeholders. It is common to
have redundancy, duplication of roles and responsibilities when using many discrete systems.
The order fulfillment cycles are long, lead times long and the customer response times are not
encouraging.

6
ERP systems affect organizations and are implemented to enhance stakeholders‟ performance. A
lot of research has been done to show the effect of ERP on organization performance, however
little attention has been devoted to measuring the effects of ERP on the organization‟s
stakeholders. This lacuna of knowledge is unjustifiable because the implementation of ERP is a
source of increasing cost and concern to management. It is against this background that the goal
of this study will be to find out the effects of ERP systems implementation on stakeholders‟
performance by measuring the effects of ERP on stakeholders in Safaricom Limited.
1.5 Objectives of the Study
1.5.1 General Research Objective
The main objective of this study was to establish the effects of Enterprise Resource Planning
System on Safaricom Limited stakeholders.
1.5.2 Specific Objectives
The specific objectives of the study were:
i. To determine the effects of ERP Users‟ training on stakeholders performance.
ii. To examine the effects of ERP ease of use on stakeholders‟ performance.
iii. To find out the effects of ERP system flexibility on stakeholders performance.
iv. To investigate the effects of ERP technical support on stakeholders performance.
1.6 Research Questions
This study sought to answer the following research questions
i. What are the effects of ERP users training on stakeholders‟ performance at Safaricom
Limited?

7
ii. What are the effects of ERP ease of use on stakeholders‟ performance at Safaricom
Limited?
iii. What are the effects of ERP system flexibility on stakeholders‟ performance at Safaricom
Limited?
iv. What are the effects of ERP technical support on stakeholders‟ performance at Safaricom
Limited?
1.7 Significance of the Study
The study would be important to the management and employees of Safaricom Limited,
customers, suppliers and other researchers and academicians.
1.7.1 Management and employees of Safaricom Limited
The management of Safaricom Limited would benefit from the study in that they will acquire
information on the way to better engage the key stakeholders of their organization using the ERP
systems and its capabilities. This information will be shared to employees who will engage better
with management, suppliers and customers for competitive advantage.
1.7.2 Customers
To the customers of Safaricom Limited, the study would provide valuable information on how
the ERP system can enable them interact with the organization (Safaricom and other
organizations) to ensure products and services they receive are of good quality and at
competitive prices.
1.7.3 Suppliers
To the suppliers, the study would provide information on how effective use of ERP will enhance
collaboration with the firms they operate with, leading to efficiency and cost reduction

8
1.7.4 Other Researchers
To other researchers, the study would add more information to the body of knowledge on the
effects of ERP on Stakeholders‟ performance. The study will also provide a base upon which
further studies can be conducted on ERP and Stakeholders‟ performance.
1.8 Scope of the Study
The scope of the study was to assess the relationship between Enterprise Resource Planning
(ERP) and stakeholders‟ performance. The study will use Safaricom Limited as the case study.
The study is limited to employees, suppliers and customers of Safaricom Limited that interact
with the ERP system, that are located at the firm‟s headquarters.

9
CHAPTER TWO: LITERATURE REVIEW
2.0 Introduction
This chapter looks at the issues related to the influence of ERP on stakeholders‟ performance.
The chapter develops a theoretical framework to justify the need for the current study,
conceptual framework to guide the study discussion and the empirical review on the relationship
between Enterprise Resource Planning (ERP) and stakeholders‟ performance. The chapter also
looks at the research gaps.
2.1 Theoretical Literature
2.1.1 Stakeholder Theory
With respect to the research framework, another theoretical base that can arguably be considered
relevant is the Stakeholder Theory (ST) that was proposed by Freeman (1984). ST posits that
sustainable success rests upon a systematic consideration of the views of all key stakeholders of
which organizations are made up (Pouloudi & Whitley, 1997; Lyytinen et al., 1998). The
Stakeholder Theory considers two perspectives: inside-in (employees, managers) and inside-out
(others: shareholders, partners). In the extent IS literature, stakeholders have been identified
based on a particular research purpose. For example, Lyytinen et al (1998) describe stakeholders
as actors that can set forward claims or benefit from IT systems development issues. Singletary
et al. (2003) identified stakeholders as managers, IT professionals, and end users. Thus, ST could
facilitate insights when ERP success is to be discussed from the point of view of differing
organizational stakeholder groups, which appear to be similar to the dictates of the organizational
performance literature in which “the perspective of the evaluator” is esteemed (Cameron, 1986).
However, there are shortcomings in ST as well.
Due to its origins, it tends to focus more on control and governance structures in corporations
than on how organizational actors relate with each other. In discussing the cracks in ST, Weiss
(2006, p.5) asserts that “ST grounds its view of the moral issues surrounding the enterprise in the
issue of the control and governance of large corporations.” Phillips (2004) sums the limitations

10
of ST by noting that historically ST has been plagued by questions on how to allocate
management resources, including time, energy, etc. to other stakeholder groups in the
corporation. He adds “While there is no determinate algorithm, ST can provide some broad
direction on making these decisions”
2.1.2 Contingency Theory
The study will be guided by contingency theory. In this study, as the two levels in the research
framework are composed of contextual factors or contingencies such as size, culture, structure,
and so forth. The researcher asserts that the Contingency Theory (CT) developed by Lawrence
and Lorsch (1967) is particularly relevant to this study. The Contingency Theory posits that
organizational effectiveness (in this instance ERP effectiveness or success) can result from the
matching of organizational characteristics with contingency factors. About a decade ago and
earlier, this theory was the most dominant in the IS and Management Science literature. Weill
and Olson, (1989, p.59) note “Of the 177 articles during the period studied, 59 percent were
empirical and over 70 percent of these were judged to follow a contingency model.” The authors
also highlighted the shortcomings in CT; these include its limitations in explaining interactions
between variables, which at best it merely describes. CT assumes the existence of rational actors
and often researchers using it narrow their focus to deterministic models (i.e., only the arrows
representing a required association are shown and the effects of other factors are ignored) (Weill
& Olson, 1989). Due to the limitations in CT and its gradually diminishing influence among
researchers in IS and related field, Weill and Olson (1989) encourage the use of other theories to
explain aspects of organizational behavior.

11
2.2 Empirical Literature
2.2.1 ERP System
This research adopts an explanation of an information system that supports the basic concepts of
what constitutes an ERP system. In the view of Iiavari (1991) an Information System is a
collection of subsystems defined by either functional or organizational parameters that support
decision making and control the organization. Lucas (1981) highlights the fact that information
technology is used to capture, transmit, store, retrieve, manipulate, or display information in one
or more businesses. An Information system in an organization provides processes and
information useful to its members and clients. It helps it to operate more effectively. The
information concerns its customers, suppliers, products, procedures, operations and so on
(Avison and Fitzgerald, 2006). The role of IS in an organization are increasing and
encompassing all the various activities and the developments approaches have to take these
growing considerations into account. According to Chang and King (2005), the Information
Systems can be defined as an integration of hardware, software, human skills and management
processes that enhance IS performance to maximize the returns on investment. Furthermore,
Information systems combine people, hardware, software, data and networks to perform input,
processing, output and control activates (O‟Brien, 2004).
The ERP implementation and integration is a very complex process and broad systems are
employed to their organizational structure for transformation. Jarvinen (1991) found the IS field
is very broad, with a number of different definitions depending on the researchers point of view
and an ERP system is considered as that vast information system that integrates all the
information that runs through the organization into a uniform system (Davenport, 2008).In
addition to this, the material relevant to IS frameworks and methodologies and its consequent
outcomes has also been reviewed and the best methodology selected based on the desired
outcome of this research study.
Technology plays a key role in today's business environment. Many companies greatly rely on
computers and software to provide accurate information to effectively manage their business. It
is becoming increasingly necessary for all businesses to incorporate information technology
solutions to operate successfully. One way that many corporations have adopted information

12
technology on a large scale is by installing Enterprise Resource Planning (ERP) systems to
accomplish their business transaction and data processing needs. Enterprise Resource Planning
(ERP) systems are software packages that use relational database technology to integrate various
units of an organization's information system. ERP systems provide several separate, but
integrated modules, which can be installed as a package for any organization (Scapens and
Jazayeri 1998).
Many large corporations use several different and separate information systems, often because
they have merged with and/or acquired other companies with varied systems. An ERP system
integrates these separate information systems and results in improved data reliability and
processing efficiency. ERP systems quickly became popular with large corporations that needed
a seamless integration of their business, but are now frequently used by small to mid-sized
companies. The excellent ability of ERP systems to simplify business transaction processing,
eliminate work that adds little or no value, and simultaneously improve customer service are the
main reasons for the outstanding success and popularity of these systems (Gibbs 1997). ERP
systems have made legacy systems outdated and obsolete for many companies.
ERP systems have enabled organizations to connect all business processes from the primary
process of planning up to the final process such as after sale services to customers and made
preparing integrated reports possible. Effective use of ERP systems in combining and integrating
various information including accounting, production, distribution and human resources
management has developed an integrated system of information which guarantees that the
reserved information could be accessible at any time and in any stage of the business process that
the staff and directors need them. In addition, ERP can facilitate the automation of processes and
increase business efficiency, improve quality and reduce administrative costs.
2.2.2 Stakeholders
Every organization involves a system of primary stakeholder groups with whom it establishes
and manages relationships. Stakeholders are individuals, groups or organizations who can affect
the firm‟s vision and mission, are affected by the strategic outcomes achieved, and have
enforceable claims on the firm‟s performance. Claims on the firm‟s performance are enforced

13
through the stakeholder‟s ability to withhold participation essential to the organization‟s survival,
competitiveness, and profitability (Hitt, M and Duane R, 2005).
Stakeholders can be divided into at least three groups, as shown in the figure 1 below. These
groups are the capital market stakeholders, the product market stakeholders and the
organizational stakeholders.
Each stakeholder group expects those making strategic decisions in a firm to provide leadership
through which its valued objectives will be reached.
Figure 2.1: The Stakeholders Groups, (Hitt, M, Duane R, 2005)
Capital Market Stakeholders
Shareholders
Major Suppliers of Capital( e.g. Banks)
Product Market Stakeholders
Customers
Suppliers
Host Communities
Unions
Organizational Stakeholders
Employees
Managers
14
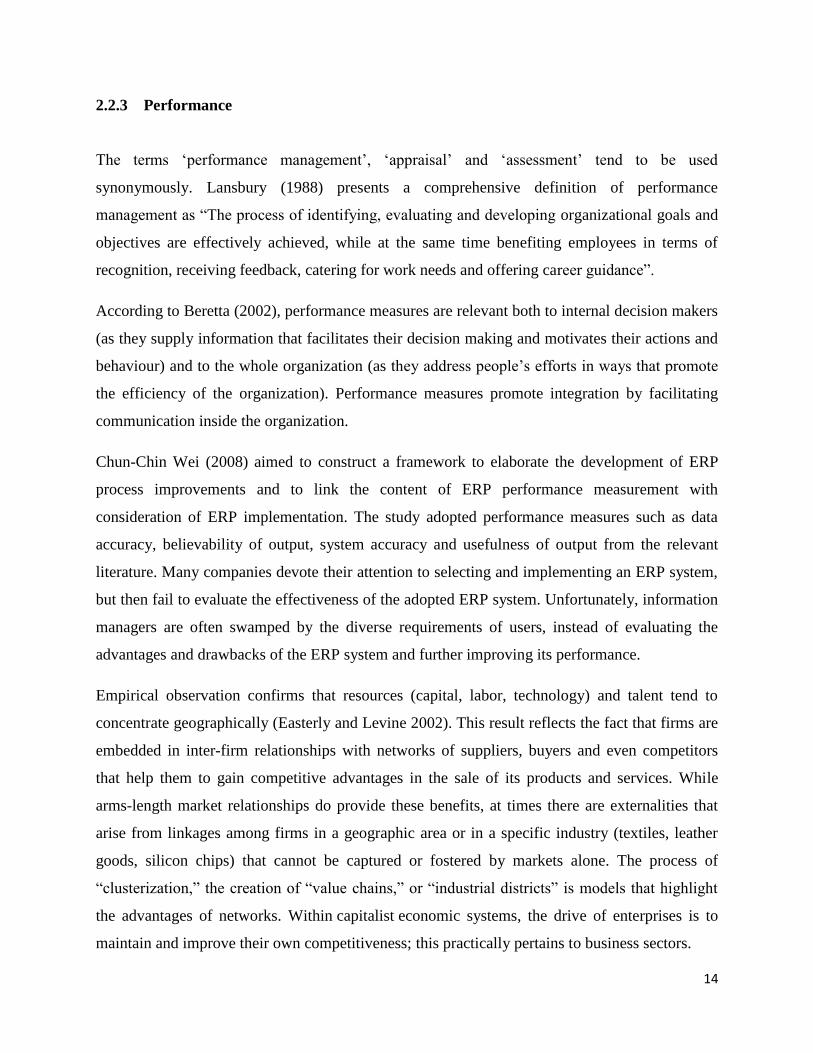
2.2.3 Performance
The terms „performance management‟, „appraisal‟ and „assessment‟ tend to be used
synonymously. Lansbury (1988) presents a comprehensive definition of performance
management as “The process of identifying, evaluating and developing organizational goals and
objectives are effectively achieved, while at the same time benefiting employees in terms of
recognition, receiving feedback, catering for work needs and offering career guidance”.
According to Beretta (2002), performance measures are relevant both to internal decision makers
(as they supply information that facilitates their decision making and motivates their actions and
behaviour) and to the whole organization (as they address people‟s efforts in ways that promote
the efficiency of the organization). Performance measures promote integration by facilitating
communication inside the organization.
Chun-Chin Wei (2008) aimed to construct a framework to elaborate the development of ERP
process improvements and to link the content of ERP performance measurement with
consideration of ERP implementation. The study adopted performance measures such as data
accuracy, believability of output, system accuracy and usefulness of output from the relevant
literature. Many companies devote their attention to selecting and implementing an ERP system,
but then fail to evaluate the effectiveness of the adopted ERP system. Unfortunately, information
managers are often swamped by the diverse requirements of users, instead of evaluating the
advantages and drawbacks of the ERP system and further improving its performance.
Empirical observation confirms that resources (capital, labor, technology) and talent tend to
concentrate geographically (Easterly and Levine 2002). This result reflects the fact that firms are
embedded in inter-firm relationships with networks of suppliers, buyers and even competitors
that help them to gain competitive advantages in the sale of its products and services. While
arms-length market relationships do provide these benefits, at times there are externalities that
arise from linkages among firms in a geographic area or in a specific industry (textiles, leather
goods, silicon chips) that cannot be captured or fostered by markets alone. The process of
“clusterization,” the creation of “value chains,” or “industrial districts” is models that highlight
the advantages of networks. Within capitalist economic systems, the drive of enterprises is to
maintain and improve their own competitiveness; this practically pertains to business sectors.

15
2.2.4 Enterprise Resource Planning (ERP) System and Stakeholders’ Performance
ERP software integrates information used by the accounting, process, distribution, and human
resources departments into a seamless computing system (Jaidep Motwani, etal 2005). The
business world‟s embrace of enterprise systems may in fact be the most important development
in the corporate use of information technology in the 2000s. ERP systems specifically address
the need for integration of application programs for various business functions or processes in a
processing firm, such as sales, accounting and process. Different business applications can all
use a common database that serves as the integrating mechanism (John Olhager, et al, 2003).
ERP systems are expected to provide at least in theory, seamless integration of processes across
functional areas with improved workflow, standardization of various business practices,
improved order management, accurate accounting of inventory, and better supply chain
management (Mabert, et al, 2000). ERP arrived at a time when process improvement and
accuracy of information became critical strategic issues. The emphasis on supply chain
management and the advancement of information technology created a need for enterprise- wide
integration. In the past few years, ERP has become a „„must have‟‟ system for almost every firm
to improve competitiveness. Today, over 60% of companies have installed or plan to install a
packaged ERP system (Hsiuju Rebecca Yen, Chewn Sheu, 2003).
Evidence from a survey on companies who have adopted ERP systems and their impact on
management practice confirms a number of such benefits. The most highly-rated perceived
benefits involve increased flexibility in information generation, improved quality of reports,
increased integration of accounts applications and improved decisions based on timely and
reliable accounting information. Evidence suggests that businesses expect ERP systems to
deliver improved company performance (Charalambos Spathis, et al, 2005). Therefore, it is
highly unlikely that any two implementations will have identical requirements or consequences,
even if they are based on the same generic software packages. While the potential benefits might
be articulated, determination of the actual benefits from implementing an ERP system is difficult
to foresee.

16
Many managers doubt to gaining value and competitive advantages from ERP systems (Keng
Siau, 2002). The main reason of organizations is objectives and acquires effectiveness (Daft,
2003). ERP systems are by many regarded as a dream come true and are in most cases
implemented in order to improve organizational effectiveness. Some studies also described cases
where the implementation failed and the impact had the opposite effect on organizational
performance. However, ERP systems are huge and complex and have a different implementation
results. In the other hand, the effectiveness is multi-concept and complicated to measurement.
(S.C. Lenny Koh, 2006).It includes strategic, operational, human resource and structural
properties of organization.
The literature points that assessment of benefits and risks of ERP has remained of strategic
interest to the adopting organizations. Achieving stakeholders‟ performance, efficiencies such as
improvements in productivity, optimizing inventory and data integration capabilities are some of
the prime benefits being sought by ERP adopters (Kamhawi 2008). In investigating adoption
motives, Raymond and Uwizeyemungu (2007) conclude in their study of Canadian Small &
Medium enterprises (SMEs), that the firms with significant organizational capacities,
commercial dependence on major customers and tendency of bringing innovative products are
internally predisposed to ERP adoption, whereas those firms which are focused on networking
and partnerships with other firms are externally pre-disposed towards adoption of ERP.
Unfavourably disposed firms are profiled as having less conducive environmental, organizational
and technological tendencies towards the adoption of ERP.
Given the considerable investment of time, money and resources in ERP projects, the researchers
have looked at the stakeholders‟ performance of ERP in a post adoption scenario. Conducting a
survey of Hong Kong based firms, Law and Ngai (2007) find that user satisfaction of ERP and
business process improvement positively impacts the stakeholders‟ performance and ultimately
the firm‟s performance. They claim positive empirical relationship between the strategic intent
behind the adoption of ERP and organizational performance.

17
2.3 Conceptual Framework of Research
A conceptual framework is a tool researchers use to guide their inquiry; it is a set of ideas used to
structure the research, a sort of a map (Kothari, 2004). It is the researcher‟s own position on the
problem and gives direction to the study. It may be an adaptation of a model used in a previous
study, with modifications to suit the inquiry. Aside from showing the direction of the study,
through the conceptual framework, the researcher can be able to show the relationships of the
different constructs that he wants to investigate. The study will be guided by the following
conceptual framework.
Independent Variables Dependent Variables
User
Figure 2.2: Diagram depicting the relationship between the dependent and independent
variables
User Training
Technical Support
System Flexibility
System ‘ease of use’
Stakeholders’
Performance
18
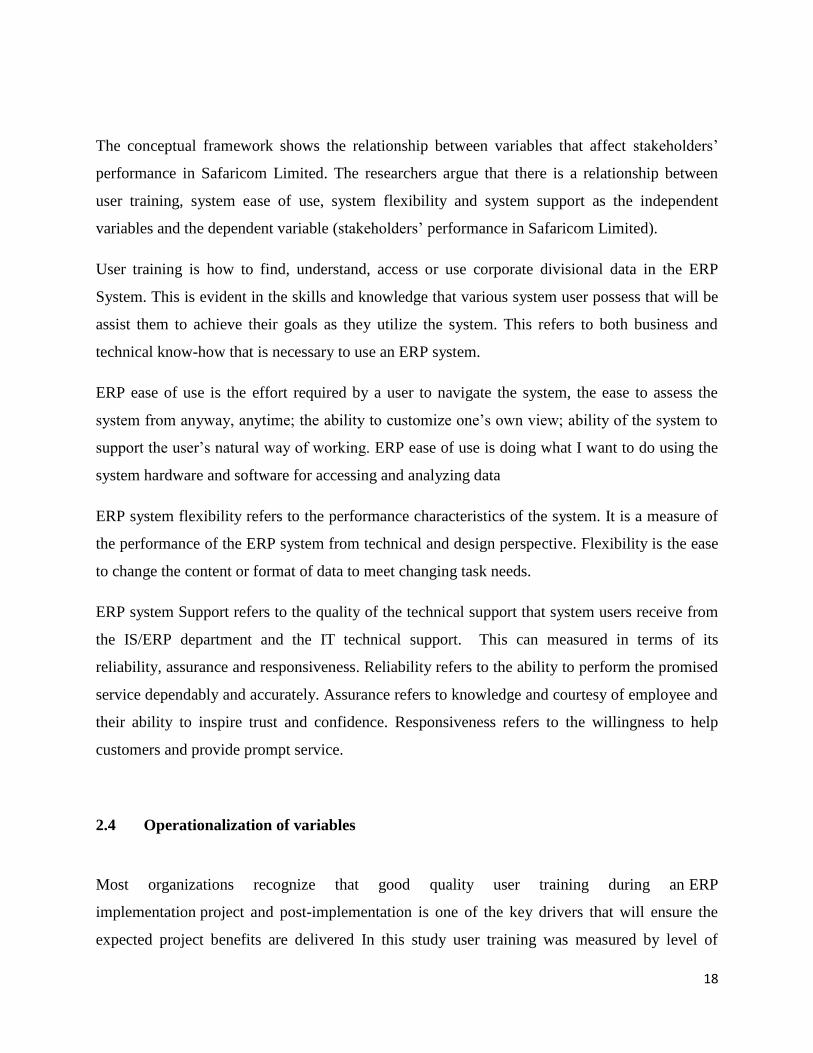
The conceptual framework shows the relationship between variables that affect stakeholders‟
performance in Safaricom Limited. The researchers argue that there is a relationship between
user training, system ease of use, system flexibility and system support as the independent
variables and the dependent variable (stakeholders‟ performance in Safaricom Limited).
User training is how to find, understand, access or use corporate divisional data in the ERP
System. This is evident in the skills and knowledge that various system user possess that will be
assist them to achieve their goals as they utilize the system. This refers to both business and
technical know-how that is necessary to use an ERP system.
ERP ease of use is the effort required by a user to navigate the system, the ease to assess the
system from anyway, anytime; the ability to customize one‟s own view; ability of the system to
support the user‟s natural way of working. ERP ease of use is doing what I want to do using the
system hardware and software for accessing and analyzing data
ERP system flexibility refers to the performance characteristics of the system. It is a measure of
the performance of the ERP system from technical and design perspective. Flexibility is the ease
to change the content or format of data to meet changing task needs.
ERP system Support refers to the quality of the technical support that system users receive from
the IS/ERP department and the IT technical support. This can measured in terms of its
reliability, assurance and responsiveness. Reliability refers to the ability to perform the promised
service dependably and accurately. Assurance refers to knowledge and courtesy of employee and
their ability to inspire trust and confidence. Responsiveness refers to the willingness to help
customers and provide prompt service.
2.4 Operationalization of variables
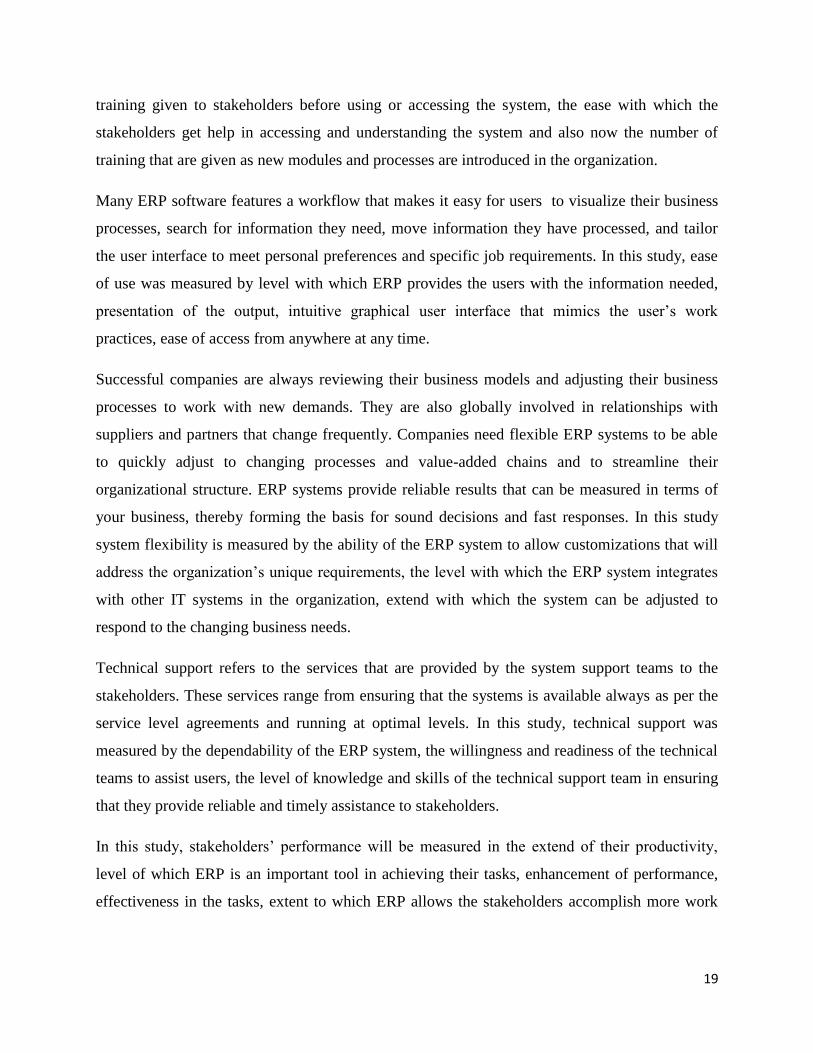
Most organizations recognize that good quality user training during an ERP
implementation project and post-implementation is one of the key drivers that will ensure the
expected project benefits are delivered In this study user training was measured by level of
19
training given to stakeholders before using or accessing the system, the ease with which the
stakeholders get help in accessing and understanding the system and also now the number of
training that are given as new modules and processes are introduced in the organization.
Many ERP software features a workflow that makes it easy for users to visualize their business
processes, search for information they need, move information they have processed, and tailor
the user interface to meet personal preferences and specific job requirements. In this study, ease
of use was measured by level with which ERP provides the users with the information needed,
presentation of the output, intuitive graphical user interface that mimics the user‟s work
practices, ease of access from anywhere at any time.
Successful companies are always reviewing their business models and adjusting their business
processes to work with new demands. They are also globally involved in relationships with
suppliers and partners that change frequently. Companies need flexible ERP systems to be able
to quickly adjust to changing processes and value-added chains and to streamline their
organizational structure. ERP systems provide reliable results that can be measured in terms of
your business, thereby forming the basis for sound decisions and fast responses. In this study
system flexibility is measured by the ability of the ERP system to allow customizations that will
address the organization‟s unique requirements, the level with which the ERP system integrates
with other IT systems in the organization, extend with which the system can be adjusted to
respond to the changing business needs.
Technical support refers to the services that are provided by the system support teams to the
stakeholders. These services range from ensuring that the systems is available always as per the
service level agreements and running at optimal levels. In this study, technical support was
measured by the dependability of the ERP system, the willingness and readiness of the technical
teams to assist users, the level of knowledge and skills of the technical support team in ensuring
that they provide reliable and timely assistance to stakeholders.
In this study, stakeholders‟ performance will be measured in the extend of their productivity,
level of which ERP is an important tool in achieving their tasks, enhancement of performance,
effectiveness in the tasks, extent to which ERP allows the stakeholders accomplish more work

20
than would otherwise be possible and extend to which their transactional and operational costs
are reduced.
2.5 Research Gap
Researchers have investigated many issues related to ERPs ranging from pre-implementation
requirements to successfully implement ERP projects with minimum costs. More specifically, to
date, lots of studies have been conducted about critical success factors of ERPs, their various
implementation steps, related problems, conditions of success and reasons of failure (Basoglu et
al. 2007; Botta-Genoulaz and Millet 2006; Botta- Genoulaz et al. 2005; Somers et al. 2000).
Among these studies user adoption and system use also have been investigated (Gyampah 2004;
Calisir and Calisir 2004). Within the streams of several previous studies user aspects have been
mentioned as a crucial factor when studying IS, particularly in terms of ERP systems. The
studies however failed to critically assess the effect of ERP on organizational performance.
In another research conducted by Ketter C.K (2013), factors contributing to ERP readiness in
organizations were examined, while Koech G.M (2014) explored the factors affecting ERP
performance within the agro-processing industry. Munyoruko S.M in 2014 also examined the
factors influencing implementation of ERP within the mobile industry in Kenya.
Empirical evidence reveals that little research attention has been devoted to measuring the effects
of ERP on stakeholders‟ performance. This lacuna of knowledge is unjustifiable because the
implementation of ERP is a source of increasing cost and concern to management. It is against
this background that the goal of this study will be to discover the effects of ERP systems
implementation on stakeholders‟ performance by measuring the effects of ERP on stakeholders
in Safaricom Limited.
21
CHAPTER 3: RESEARCH METHODOLOGY
3.1 Introduction
This chapter describes the research design and methodology that will be employed in the study.
This includes the study design, target population, sampling for the study, data collection
instruments and procedures and data analysis.
3.2 Research Design
The study will adopt a descriptive research design to establish and investigate the effects of ERP
on stakeholders‟ performance‟ in Safaricom Limited. Descriptive research studies are designed
to obtain pertinent and precise information concerning the current status of a phenomena and
draw valid general conclusions from the facts discovered ( Lokesh, 1994). A case study is a
strategy for doing research which involves an empirical investigation of a particular
contemporary phenomenon within its real life context using multiple sources of evidence
(Robson, 2002 as quoted by Saunders et al, 2003 9.93). The researcher wishes to gain a rich
understanding of the phenomenon in the contest and holistically.
3.3 The Target Population and Sample
3.3.1 The Target Population
Mugenda and Mugenda (2003) defined population as the whole group of people or items under
reflection in any field of investigation and have a common element. The target population for the
study will be the employees of Safaricom Limited, its key suppliers and customers who interact
with the ERP system totaling to about 1042. These are the stakeholders that are located at
Safaricom Limited headquarters

22
Table 3.1 Target Population
Category Population
Employees 684
Suppliers 232
Customers 126
Total 1042
. *Customers – These are the customers that interact with the ERP in Safaricom Limited, also
known as Dealers.
3.3.2 Sample Size and Sampling Procedures
The word sample is defined as the section of the population chosen for study to stand for the
entire population. This research will employ a stratified random sampling to choose 10% of the
entire target population. In line with Cooper and Schindler (2003) an excellent representation of
the entire target population is a sample size of between 10% and 30%. In accordance to Yin,
(2008), random samples of an entire population come from the whole population. The population
is first categorized into different strata, and a random sample is then selected randomly from
each stratum. In this study, the strata will be various categories of stakeholders of Safaricom
Limited.
Table 3.2 Sample Size
Category Target Population Sample Size(10%)
Employees 684 68
Suppliers 232 23
Customers 126 13
Total 1042 104
23
3.4 Data Collection Methods
3.4.1 Techniques and Instruments
Data for the study will be collected using three techniques: Document Analysis, Interviews and
questionnaires. Questionnaires will be used to collect data from managers. Questionnaires will be
preferred because, as Kiess and Bloomquist (1985) observes, it offers considerable advantages in
administration; it presents an even stimulus potentially to large number of people simultaneously
and provides the investigation with an easy accumulation of data.
3.4.2 Pre-Testing the Research Instruments
Prior to carrying out the actual study, the researcher will conduct a pilot study using three section
managers of Safaricom Limited, who will not be included in the final study and their responses
not incorporated in the final analysis.
3.4.3 Research Procedure
The research will seek an introduction letter from the Management University of Africa. After
this, the researcher will book an appointment with the various directors to request for permission
to collect data. The researcher then will visit various respondents‟ offices to administer the
questionnaires himself.
3.5 Data Analysis Methods
Quantitative data will be analyzed using descriptive statistics including percentages and
frequency counts. Bell (1993) maintains that when making results known to a variety of readers,
simple descriptive statistics such as percentages have a considerable advantage over more
complex statistics. Borg and Gall (1983) also holds that the most widely used and understood
standard proportion is the percentage. The results of the data analysis will be presented in
frequency tables, bar charts, line graphs and pie charts.
24
3.6 Ethical Considerations
Ethical issues were put into consideration by the researcher in this study to avoid the loss of
credibility of the study. There was acknowledgement of all ideas that were borrowed from other
authors in an effort to avoid plagiarism. Furthermore, the personnel who were willing to take part
in the study were given questionnaires to fill. Those who did not wish to take part in the study
were not compelled to participate in any way.
The respondents who participated in the study voluntarily were required to have a written
informed consent. Generally, this indicated that potential research respondents were fully aware
of the procedures to be involved in the research. Thus, they gave their consent to take part in the
study. To this effect, all the respondents were fully aware of the intentions of the study and were
given the assurance that this study will entirely be for academic purposes. Strict confidentiality
was adhered to, where no information was given to any person who is not authorized. In case the
anonymity of a respondent was necessary, assurance was given to respondents on the integrity of
their confidentiality.

25
CHAPTER FOUR: DATA ANALYSIS, FINDINDS AND DISCUSSION
4.1 Introduction
This chapter presents the data analysis results, as well as interpretation and discussion of findings
in line with the specific objectives of the study.
4.1.1 Overview of analyzed data
The data was collected using questionnaire method comprising of close ended and open ended
questions. The questionnaires were self-administered to the respondents and a drop and pick later
method was preferred for the exercise. Out of the 104 questionnaires that were issued 91
questionnaires were returned. This represents a response rate of 87% which is significant to give
reliable findings for this study. According to McBurney (2001), a low response rate could have a
potentially biasing effect on the study results. However, a 70% and above response rate is
acceptable for the study. The table 4.1 below shows the response rate:
Table 4.1: Response Rate
Frequency Percentage
Non Respondents 13 12.5
Actual Respondents 91 87.5
Target Population 104 100
4.2 Demographic Profiles
Majority of the questionnaires distributed were filled and returned representing 87% response
rate. The demographic statistics used here sought to unearth background information of
individual respondents. The profiles checked were, age, gender, level of education and the
category of stakeholder.

26
4.2.1 Gender of the respondents
The study sought to find out the gender of the respondents, the findings are presented in Table
4.2
Table 4.2 Gender of the respondents
Frequency Percentage Valid
Percentage
Cumulative
Percentage
Valid Female 44 48.4 48.4 48.4
Male 47 51.6 51.6 100
Total 91 100.0 100.0
It is very clear that majority of the respondents were male with 52% ,while female respondents
were 48%. This suggests a near equal distribution of respondents by gender.
4.2.2 Age of the respondents
The study sought to find out the gender of the respondents, as presented in Table 4.2
Table 4.3 Age of the respondents
Frequency Percentage Valid
Percentage
Cumulative
Percentage
Valid 20-30 years 26 28.6 28.6 28.6
31-40 years 47 51.6 51.6 80.2
41-50 years 14 15.3 15.3 95.6
51 and above 4 4.4 4.4 100
Total 91 100.0 100.0
27
From table 4.3 above, it is clear that majority of the respondents were between 31-40 years with
51%, 20-30 years with 28%, 41-50 years with 15% while 50 and above years with 4%.
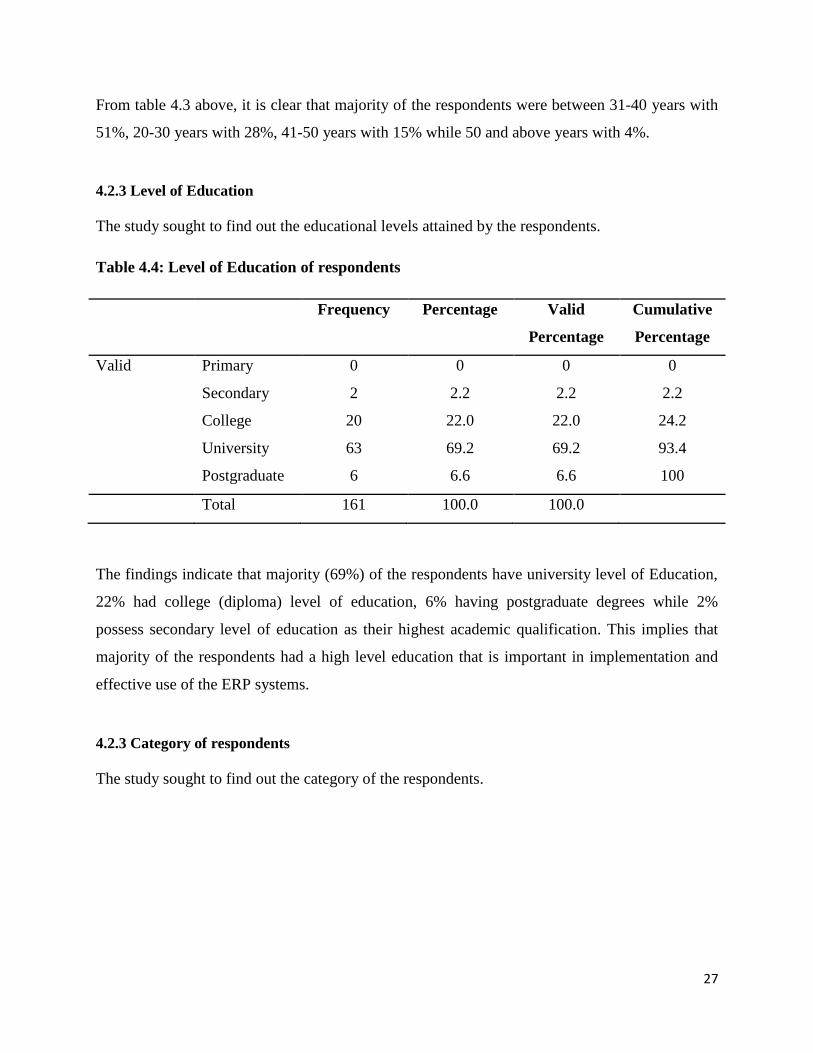
4.2.3 Level of Education
The study sought to find out the educational levels attained by the respondents.
Table 4.4: Level of Education of respondents
Frequency Percentage Valid
Percentage
Cumulative
Percentage
Valid Primary 0 0 0 0
Secondary 2 2.2 2.2 2.2
College 20 22.0 22.0 24.2
University 63 69.2 69.2 93.4
Postgraduate 6 6.6 6.6 100
Total 161 100.0 100.0
The findings indicate that majority (69%) of the respondents have university level of Education,
22% had college (diploma) level of education, 6% having postgraduate degrees while 2%
possess secondary level of education as their highest academic qualification. This implies that
majority of the respondents had a high level education that is important in implementation and
effective use of the ERP systems.
4.2.3 Category of respondents
The study sought to find out the category of the respondents.
28
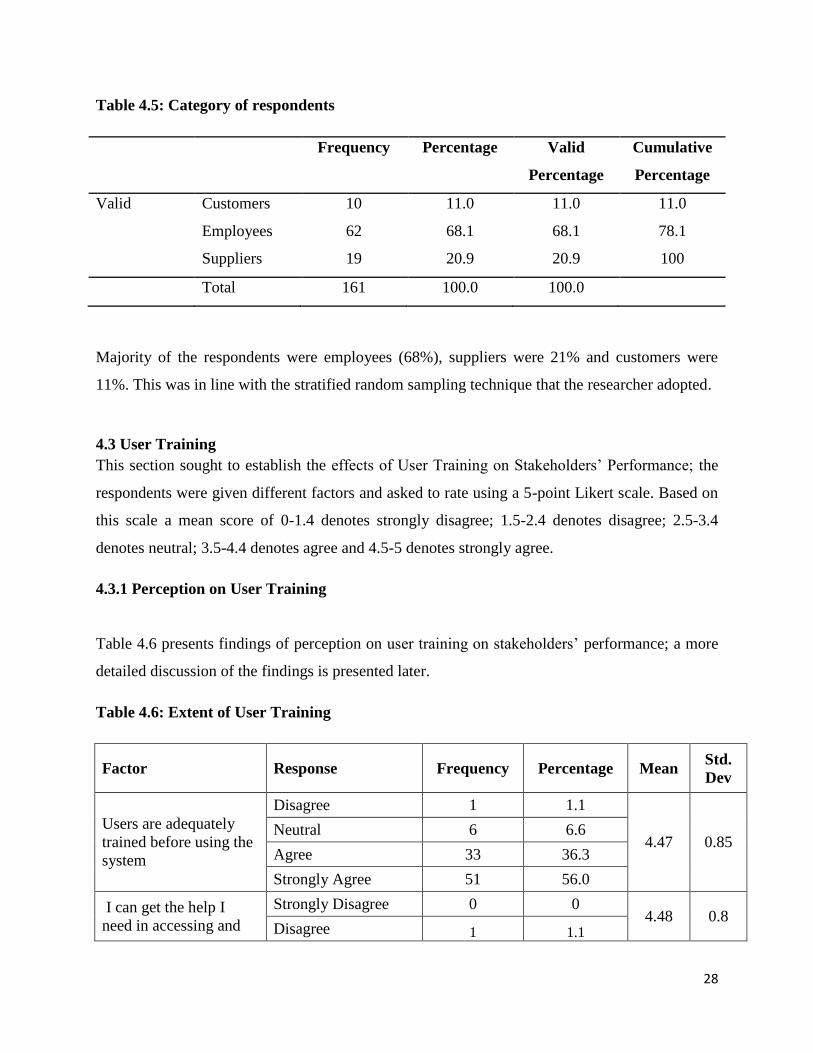
Table 4.5: Category of respondents
Frequency Percentage Valid
Percentage
Cumulative
Percentage
Valid Customers 10 11.0 11.0 11.0
Employees 62 68.1 68.1 78.1
Suppliers 19 20.9 20.9 100
Total 161 100.0 100.0
Majority of the respondents were employees (68%), suppliers were 21% and customers were
11%. This was in line with the stratified random sampling technique that the researcher adopted.
4.3 User Training
This section sought to establish the effects of User Training on Stakeholders‟ Performance; the
respondents were given different factors and asked to rate using a 5-point Likert scale. Based on
this scale a mean score of 0-1.4 denotes strongly disagree; 1.5-2.4 denotes disagree; 2.5-3.4
denotes neutral; 3.5-4.4 denotes agree and 4.5-5 denotes strongly agree.
4.3.1 Perception on User Training
Table 4.6 presents findings of perception on user training on stakeholders‟ performance; a more
detailed discussion of the findings is presented later.
Table 4.6: Extent of User Training
Factor Response Frequency Percentage Mean Std.
Dev
Users are adequately
trained before using the
system
Disagree 1 1.1
4.47 0.85 Neutral 6 6.6
Agree 33 36.3
Strongly Agree 51 56.0
I can get the help I
need in accessing and
Strongly Disagree 0 0 4.48 0.8
Disagree 1 1.1

29
understanding the data Neutral 4 4.4
Agree 36 39.6
Strongly Agree 50 54.9
There is enough training
on how to find,
understand, access or
use data and navigate
the system
Strongly Disagree 0 0.0
4.50 0.76
Disagree 1 1.1
Neutral 6 6.6
Agree 30 33.0
Strongly Agree 54 59.3
From the findings presented in Table 4.4, the respondents strongly agreed that users are
adequately trained before accessing the ERP system as expressed by 56.0% in agreement. This is
line with fact that training the users first before handing the system to them will make them more
efficient in their work. The respondents were also asked to rate whether they get help in
accessing and understanding the data therein the ERP system. They strongly agreed that indeed
with 54.9% rating; coupled with training, stakeholders perform better when they get help in
understating and accessing the system data. Asked whether there is enough training on how to
find, understand, access or use date and navigate the system, 59.3% of the respondents strongly
agree. This is in line with earlier questions on user training.
4.4 System ‘Ease of Use’
This section sought to establish the effects of system „Ease of Use‟ on Stakeholders‟
Performance; the respondents were given different factors and asked to rate using a 5-point
Likert scale. Based on this scale a mean score of 0-1.4 denotes strongly disagree; 1.5-2.4 denotes
disagree; 2.5-3.4 denotes neutral; 3.5-4.4 denotes agree and 4.5-5 denotes strongly agree.
4.4.1 Perception on System ‘Ease of Use’
Table 4.7 presents findings of perception on „Ease of Use‟ on stakeholders‟ performance; a more
detailed discussion of the findings is presented later.

30
Table 4.7: Extent of ‘Ease of Use’
Factor Response Frequency Percentage Mean Std.
Dev
The ERP system
provides me with
information that I need
Disagree 1 1.1
4.15 0.58 Neutral 17 18.7
Agree 40 43.9
Strongly Agree 33 36.2
The output is presented
in a usual format
Strongly Disagree 0 0
4.17 1.1
Disagree 4 4.4
Neutral 15 16.5
Agree 33 36.3
Strongly Agree 39 42.8
I can get the information
I need in time
Strongly Disagree 0 0.0
4.43 0.61
Disagree 1 1.1
Neutral 4 4.4
Agree 41 45.0
Strongly Agree 45 49.5
Our ERP has good
features
Strongly Disagree 0 0
3.99 1.21
Disagree 8 8.8
Neutral 13 14.2
Agree 42 46.2
Strongly Agree 28 30.7
The ERP system
facilitates quick
information retrieval
Strongly Disagree 0 0
3.93 1.21
Disagree 3 3.3
Neutral 29 31.8
Agree 30 33.0
Strongly Agree 29 31.8
It is easy to access the
ERP from anywhere,
anytime
Strongly Disagree 0 0
4.10 0.67
Disagree 5 5.5
Neutral 15 16.5
Agree 37 40.6
Strongly Agree 34 37.4
From the findings presented in Table 4.7, the respondents agreed that the ERP provides them
with the information they need as expressed by 44% in agreement. Asked whether the output is
presented in the usual format, the respondents strongly agree with 42%. The respondents
strongly agreed (49.5%) that they can get the information they want in time. When asked
31
whether the ERP has good features, the respondents agreed with 46%. This is an interesting
observation, with the advancement of computing, it is almost a given that any system will
provide good features to its users. The respondents agreed (33%) that the ERP facilitates quick
information retrieval. When asked whether it is easy to access the ERP from anywhere, anytime,
the majority respondents agreed with 40.6%
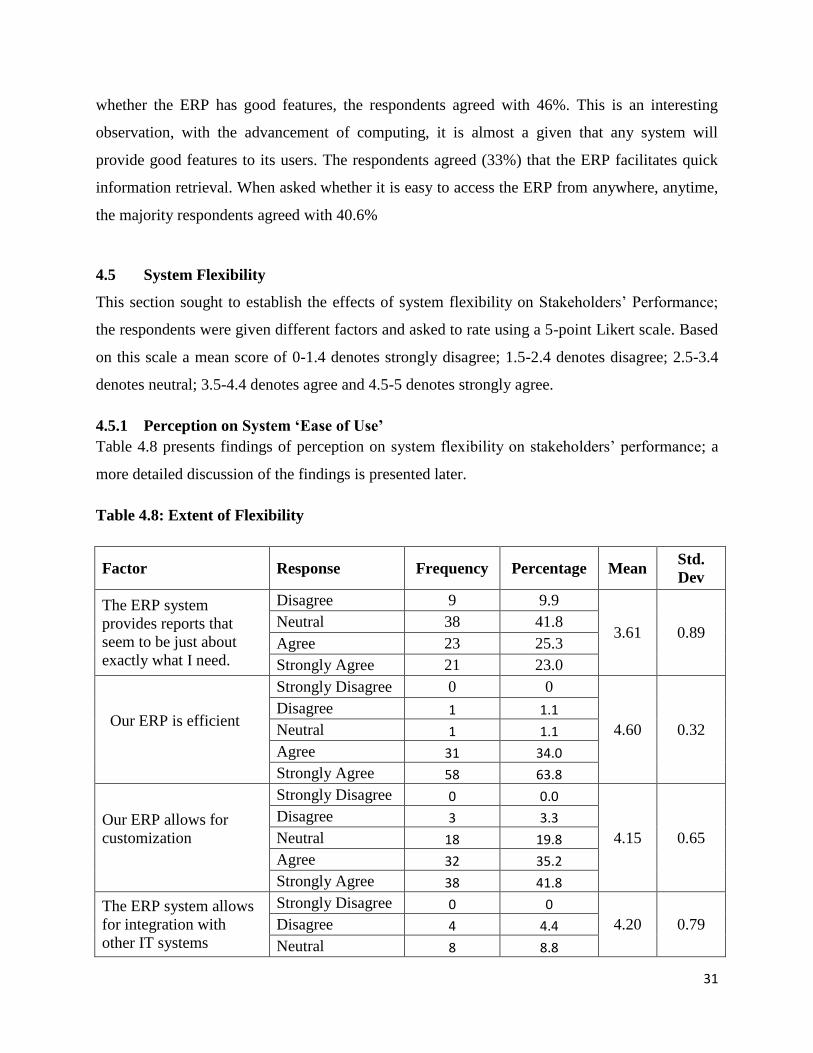
4.5 System Flexibility
This section sought to establish the effects of system flexibility on Stakeholders‟ Performance;
the respondents were given different factors and asked to rate using a 5-point Likert scale. Based
on this scale a mean score of 0-1.4 denotes strongly disagree; 1.5-2.4 denotes disagree; 2.5-3.4
denotes neutral; 3.5-4.4 denotes agree and 4.5-5 denotes strongly agree.
4.5.1 Perception on System ‘Ease of Use’
Table 4.8 presents findings of perception on system flexibility on stakeholders‟ performance; a
more detailed discussion of the findings is presented later.
Table 4.8: Extent of Flexibility
Factor Response Frequency Percentage Mean Std.
Dev
The ERP system
provides reports that
seem to be just about
exactly what I need.
Disagree 9 9.9
3.61 0.89 Neutral 38 41.8
Agree 23 25.3
Strongly Agree 21 23.0
Our ERP is efficient
Strongly Disagree 0 0
4.60 0.32
Disagree 1 1.1
Neutral 1 1.1
Agree 31 34.0
Strongly Agree 58 63.8
Our ERP allows for
customization
Strongly Disagree 0 0.0
4.15 0.65
Disagree 3 3.3
Neutral 18 19.8
Agree 32 35.2
Strongly Agree 38 41.8
The ERP system allows
for integration with
other IT systems
Strongly Disagree 0 0
4.20 0.79 Disagree 4 4.4
Neutral 8 8.8

32
Agree 44 48.4
Strongly Agree 35 38.5
The ERP system is
flexible to be able to
respond to my need for
changing data.
Strongly Disagree 0 0
4.10 0.43
Disagree 1 1.1
Neutral 7 7.7
Agree 65 71.4
Strongly Agree 18 19.8
From the findings presented in Table 4.8, the respondents were neutral as to whether the ERP
provides them with reports that seem to be just about exactly what they need as expressed by
41.8% in neutral. Asked whether the ERP system is efficient, the respondents strongly agree with
64%, this is evident with current trend of ERP systems. The respondents strongly agreed (41.8%)
that the ERP system allows for integration with other IT systems. In many organizations, there
are many upstream systems that feed into the ERP system; there may also several downstream
systems that get data from the ERP system. Thus the ERP system interfaces and integrates with
both the downstream and upstream systems. When asked whether the ERP is flexible to respond
to the changing data needs of stakeholders, the respondents agreed with 71%.
4.6 Technical Support
This section sought to establish the effects of technical support on Stakeholders‟ Performance;
the respondents were given different factors and asked to rate using a 5-point Likert scale. Based
on this scale a mean score of 0-1.4 denotes strongly disagree; 1.5-2.4 denotes disagree; 2.5-3.4
denotes neutral; 3.5-4.4 denotes agree and 4.5-5 denotes strongly agree.
4.6.1 Perception on Technical Support
Table 4.9 presents findings of perception on technical support on stakeholders‟ performance; a
more detailed discussion of the findings is presented later.

33
Table 4.9: Extent of Technical Support
Factor Response Frequency Percentage Mean Std.
Dev
The ERP system has up
–to date hardware and
software
Disagree 1 1.1
4.47 0.58 Neutral 4 4.4
Agree 37 40.7
Strongly Agree 49 53.8
The ERP technical
support team is
dependable
Strongly Disagree 0 0
4.53 0.56
Disagree 1 1.1
Neutral 2 2.2
Agree 36 39.5
Strongly Agree 53 58.2
The ERP technical
support team gives
prompt service to user
Strongly Disagree 0 0.0
4.49 0.57
Disagree 1 1.1
Neutral 2 6.6
Agree 39 42.9
Strongly Agree 49 53.8
The ERP system
technical support team
have the knowledge to
do their job well
Strongly Disagree 0 0.0
4.46 0.51
Disagree 1 1.1
Neutral 3 3.3
Agree 40 43.9
Strongly Agree 47 51.6
From the findings presented in Table 4.9, the respondents strongly agreed that the ERP system
has up to-date hardware and software as expressed by 53% in agreement. This is line with fact
that for a system be operational, there is need to perform regular updates on its components. The
respondents were the quality of technical support they receive is dependable. They strongly
agreed that indeed with 58% rating; even with a good system, they is need to have dependable
technical support who are available to address the issues raised by the stakeholders. Asked
whether the technical support team provides prompt timely service to the users, 53.8% of the
respondents strongly agree. The respondents were asked whether the ERP technical support team
have the knowledge to do their work well and 51.6% of the respondents strongly agreed.
34
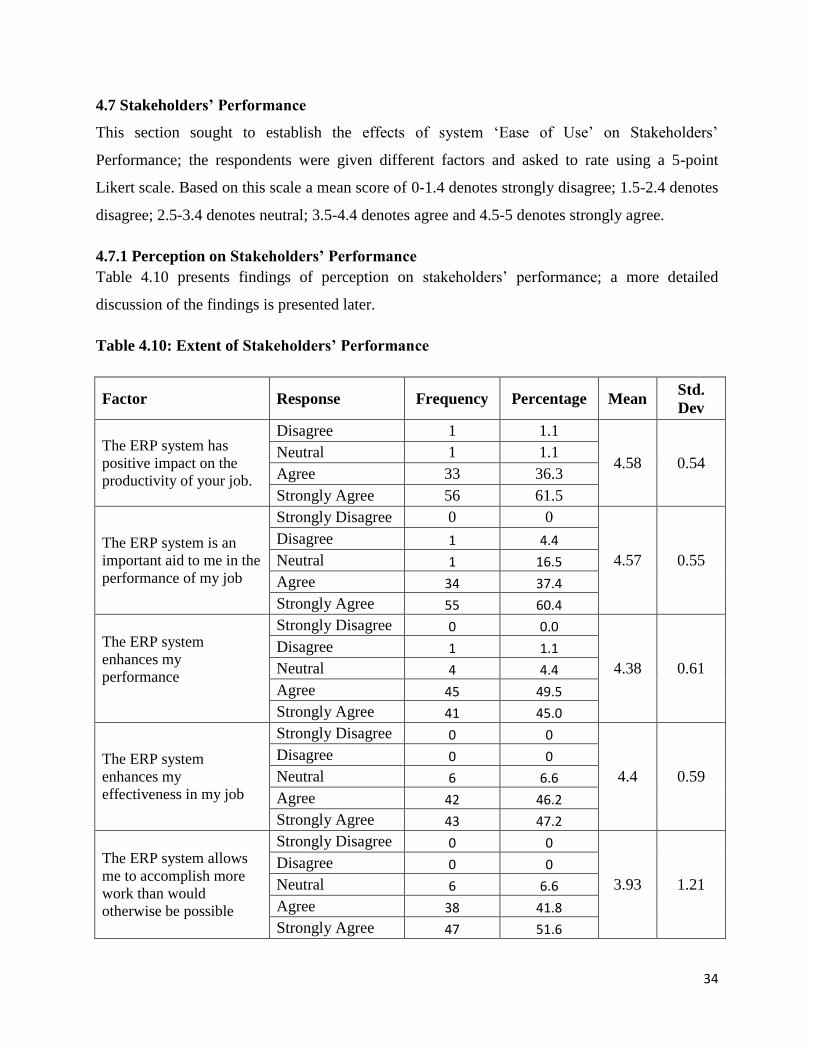
4.7 Stakeholders’ Performance
This section sought to establish the effects of system „Ease of Use‟ on Stakeholders‟
Performance; the respondents were given different factors and asked to rate using a 5-point
Likert scale. Based on this scale a mean score of 0-1.4 denotes strongly disagree; 1.5-2.4 denotes
disagree; 2.5-3.4 denotes neutral; 3.5-4.4 denotes agree and 4.5-5 denotes strongly agree.
4.7.1 Perception on Stakeholders’ Performance
Table 4.10 presents findings of perception on stakeholders‟ performance; a more detailed
discussion of the findings is presented later.
Table 4.10: Extent of Stakeholders’ Performance
Factor Response Frequency Percentage Mean Std.
Dev
The ERP system has
positive impact on the
productivity of your job.
Disagree 1 1.1
4.58 0.54 Neutral 1 1.1
Agree 33 36.3
Strongly Agree 56 61.5
The ERP system is an
important aid to me in the
performance of my job
Strongly Disagree 0 0
4.57 0.55
Disagree 1 4.4
Neutral 1 16.5
Agree 34 37.4
Strongly Agree 55 60.4
The ERP system
enhances my
performance
Strongly Disagree 0 0.0
4.38 0.61
Disagree 1 1.1
Neutral 4 4.4
Agree 45 49.5
Strongly Agree 41 45.0
The ERP system
enhances my
effectiveness in my job
Strongly Disagree 0 0
4.4 0.59
Disagree 0 0
Neutral 6 6.6
Agree 42 46.2
Strongly Agree 43 47.2
The ERP system allows
me to accomplish more
work than would
otherwise be possible
Strongly Disagree 0 0
3.93 1.21
Disagree 0 0
Neutral 6 6.6
Agree 38 41.8
Strongly Agree 47 51.6
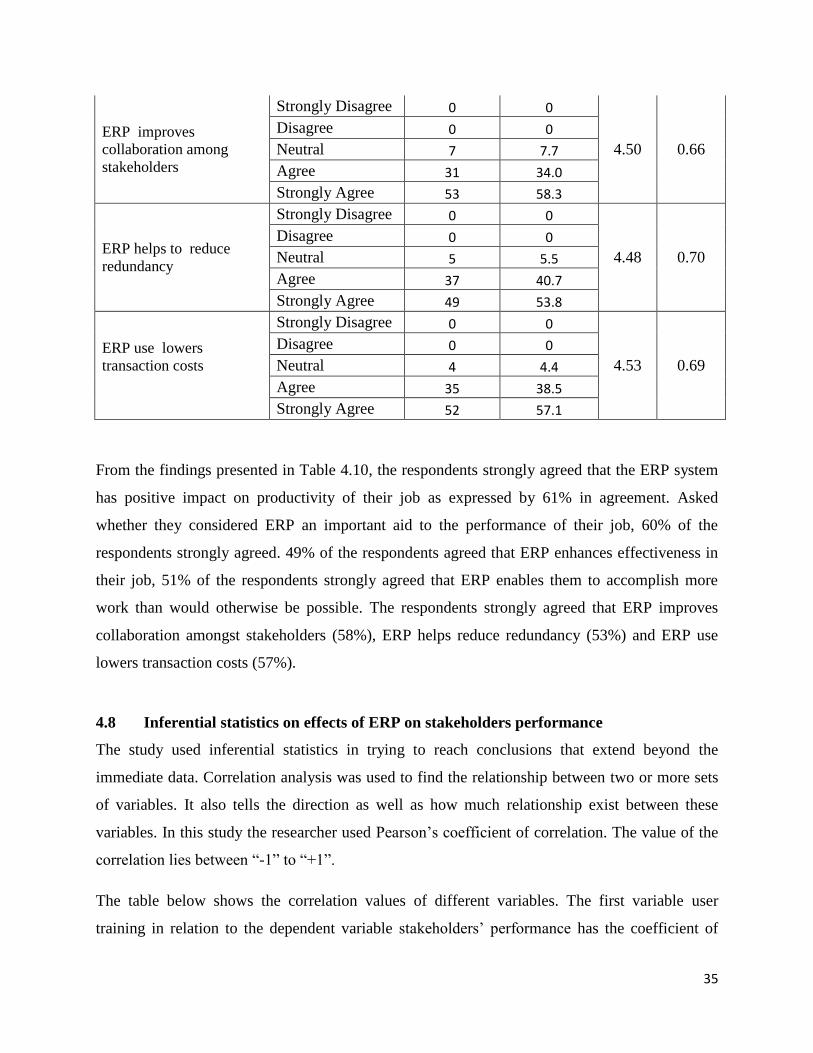
35
ERP improves
collaboration among
stakeholders
Strongly Disagree 0 0
4.50 0.66
Disagree 0 0
Neutral 7 7.7
Agree 31 34.0
Strongly Agree 53 58.3
ERP helps to reduce
redundancy
Strongly Disagree 0 0
4.48 0.70
Disagree 0 0
Neutral 5 5.5
Agree 37 40.7
Strongly Agree 49 53.8
ERP use lowers
transaction costs
Strongly Disagree 0 0
4.53 0.69
Disagree 0 0
Neutral 4 4.4
Agree 35 38.5
Strongly Agree 52 57.1
From the findings presented in Table 4.10, the respondents strongly agreed that the ERP system
has positive impact on productivity of their job as expressed by 61% in agreement. Asked
whether they considered ERP an important aid to the performance of their job, 60% of the
respondents strongly agreed. 49% of the respondents agreed that ERP enhances effectiveness in
their job, 51% of the respondents strongly agreed that ERP enables them to accomplish more
work than would otherwise be possible. The respondents strongly agreed that ERP improves
collaboration amongst stakeholders (58%), ERP helps reduce redundancy (53%) and ERP use
lowers transaction costs (57%).
4.8 Inferential statistics on effects of ERP on stakeholders performance
The study used inferential statistics in trying to reach conclusions that extend beyond the
immediate data. Correlation analysis was used to find the relationship between two or more sets
of variables. It also tells the direction as well as how much relationship exist between these
variables. In this study the researcher used Pearson‟s coefficient of correlation. The value of the
correlation lies between “-1” to “+1”.
The table below shows the correlation values of different variables. The first variable user
training in relation to the dependent variable stakeholders‟ performance has the coefficient of

36
correlation of “0.768 *” which shows a strong positive relationship between the two variables.
This implies the better the user training provided to the stakeholders the higher the performance
of the stakeholders. Similarly, the second independent variable of technical support also has a
positive correlation of “0.709” with stakeholders‟ performance. System flexibility also has a
positive relationship with stakeholders‟ performance with the value of 0.685. System „Ease of
Use‟ has moderate but positive relationship with implementation of ERP with the value of 0.562.
All the independent variables used in the study have a positive relationship with dependent
variable which shows that they significantly affect the dependent variable.
Table 4.11: Correlation of variables
Variable Title Stakeholders‟
Performance
User
Training
Technical
Support
System
Flexibility
Ease of Use
Stakeholders‟
Performance
Pearson
correlation
(2 tailed)
1.00 .768
.000
.709 *
.020
.685
.016
.562
.004
User Training Pearson
correlation
(2 tailed)
.762
.004
1.00 .467
.058
.651*
.062
.614
.000
Technical
Support
Pearson
correlation
(2 tailed)
. 705*
.002
.425
.003
1.00 .681 *
.001
.621
.001
System
Flexibility
Pearson
correlation
(2 tailed)
.654
.000
0.632
.006
.673
.005
1.00
.016
.514
.000
Ease of Use Pearson
correlation
(2 tailed)
.862
.000
.514
.005
.612
.001
.517
.000
1.00
.000
*Correlation is significant at the 0.05 level (2-tailed)

37
4.8.1 Regression Analysis
The researcher conducted regression analysis to determine the effects of user training, technical
support, system flexibility and system „Ease of Use‟ on stakeholders‟ performance in Safaricom
limited.
The following regression equation was derived:
Y =α0+ α1 X1+α2 X2+ α3 X3 +α4 X4 +e
Whereby α0 is the regression constant, α 1….. α 4 are regression coefficients,
Y= stakeholders‟ performance in Safaricom limited
X1 = user training
X2 = technical support
X3= system flexibility
X4 = system „Ease of Use‟
Whereas e = Error term
Table 4.12 Goodness of Fit Model
R R Square Adjusted R Square Std. Error of the
Estimate
.784* .740 .700 .271
Source: Research Data (2015)
The findings show a correlation value of 0.784 as this illustrates a linear relationship between the
dependent and independent variables. An R-square value of 0.740 was established and adjusted
to 0.700. This coefficient of determination shows that all independent variables affect
stakeholders‟ performance at a rate of 74.0% the remaining 26% of variations are brought about
by factors not captured in the objectives.
38
CHAPTER FIVE: CONCLUSIONS AND RECOMMENDATIONS
5.1 Introduction
This chapter presents conclusions from the findings highlighted and recommendations made. The
conclusions and recommendations were drawn with the aim of achieving the research objectives
of establishing the effects of Enterprise Resource Planning Systems on Stakeholders‟
performance.
5.2 Summary of the findings
In regard to the demographic information about the respondents, the findings indicated that there
was an 87% response rate. Majorities of the respondents were men and a big percentage of the
respondents possessed an undergraduate degree as their highest academic qualification. In
addition, majority of the respondents were in the employees category and were aged between 31
and 40 years old.
The four variables of User training, technical support, system flexibility and system „ease of use‟
were found to have an effect on the stakeholders‟ performance in Safaricom Limited. Three out
of the four variables were found to have strong positive relationships with Stakeholders‟
performance. These include: user training, technical support and system flexibility. System „ease
of use‟ had a moderate positive relationship with stakeholders‟ performance. An examination of
the joint relationship established that the four variables jointly account for 74% of the variability
in stakeholders‟ performance.
5.3 Conclusions
The findings show a strong positive relationship between user training and stakeholders‟
performance. The two variables have a positive correlation of 0.768. This indicates that
39
investment in user training that includes all stakeholders will raise the performance of ERP
stakeholders.
Similarly, there is a positive correlation of 0.709 between technical support and stakeholders‟
performance. This shows that the technical support staff and the service they provide are an
important component in stakeholders‟ performance. The technical support team should strive to
provide effective, timely and dependable service to ERP stakeholders to improve their
performance.
ERP System Flexibility is also a very important factor in the stakeholders‟ performance. ERP
System Flexibility has a positive relationship with stakeholders‟ performance with a correlation
of coefficient of 0.685. It can therefore be concluded that having a flexible ERP System that is
adaptable to the stakeholders‟ needs is important in improving their performance.
The findings of the study also show that ERP system „ease of use‟ has a moderate positive
relationship with the stakeholders‟ performance having a correlation of 0.562. This implies for
an ERP implementation project to be successful it must be in line with the business goals and
objectives of the organization otherwise the implementation mail fail. This implies for improved
stakeholders‟ performance, the ERP system should be easy to use, navigate, have an intuitive
graphical user interface that mimics the daily operational tasks of the stakeholders.
5.4 Recommendations
The following recommendations can be made from the findings of this study:
The organization‟s management must strive to improve stakeholders‟ knowledge and skills to
effectively use the system. This can be done through user training before the system goes live
and continuous training post implementation to fill the knowledge gaps. This will ensure that all
stakeholders are conversant with the ERP system and develop ownership of the system.
The organization‟s top management should build capacity of the technical support team. This
team interfaces with the stakeholders and the level of service they offer plays an important part
40
the in performance of the stakeholders. The technical support team needs to be facilitated and
equipped to provide effective, timely and dependable service.
In addition, a positive organizational culture needs to in place and the management should foster
better collaboration amongst the stakeholders for improved performance.
5.5 Limitations of the study
The study focused effects of ERP on stakeholders at Safaricom limited that are concentrated at
their headquarters. The views of the stakeholders on the other branches were not sought. The
study did not consider other firms. The results may not be applicable to other organizations. The
findings may not reflect the stakeholders‟ perceptions of ERP in the entire telecommunication
sector. Perceptions also change with time and future studies will gauge how perception of
stakeholders at Safaricom Limited has changed. The study focused on ERP post-implementation
phase, it does address the effects of ERP on stakeholders‟ performance in the pre-implementation
and implementation phases.
5.6 Suggestion for Further Research
There is bound to be different views on effects of ERP on stakeholders‟ performance in other
firms. It is therefore important to carry out research with regards to perceptions in the
telecommunications sector. Since the study was only focused at one point in time, a more
intensive longitudinal study should be done to establish how stakeholders‟ perception has
changed over time. The study was also concentrated at Safaricom Limited headquarters, further
studies should be conducted to determine if the same views are valid at the firms‟ branches
spread countrywide. While the respondents of this study perceive user training, technical support
and system flexibility being instrumental in determining the effects of ERP on stakeholders‟
performance, further research should be conducted to establish where there is a correlation of
ERP effectiveness on liquidity of firms.

41
REFERENCES
Aernoudts, R.K, Boom, T. V., Pijl, G. V., & Vosselman, E.A. (2005). Management Accounting Change
and ERP, an assessment of Research.Rotterdam
Avison, D. E. & Fitzgerald, G. (2006). Information Systems Development, Methodologies, Techniques
and Tools, 4th ed., London, McGraw-Hill.
Benjafaar S., 2002. Modeling and Analysis of Congestion in the Design of Facility Layouts.
Management Science, 48, pp. 679-704.
Borg, W.R., & Gall, M.D. (1989). Educational Research: An Introduction 5th Ed. London: Longman.
Bradford, M., Florin, J. (2003) “Examining the role of innovation diffusion factors on the implementation
success of enterprise resource planning systems”, International Journal of Accounting
Information Systems, Volume 4, Issue 3, September 2003, pp. 205-225, ISSN 1467-0895
Buonanno, G., Faverio, P., Pigni, F., Ravarini, A., Sciuto, D., and Tagliavini, M. (2005). Factors
Affecting ERP System Adoption. Management. 18(4), 384-426.
Chang, J.C. & King, W.R. (2005). “Measuring the Performance of the Information Systems: A Functional
Scorecard”, Journal of Management Information System, 1(22): 85-115.
Chen, S-G. and Lin, Y-K., (2008) „An Evaluation method for enterprise resource planning systems‟,
Journal of the Operations Research Society of Japan, 51 (4), pp. 299-309.
Churchill, G.A. and Iacobucci, D. (2002). Marketing research: Methodological foundations, 8th ed.
Orlando: Harcourt College Publishers.
Davenport, T.H., (2011). Mission Critical: Realizing the Promise of Enterprise Systems. Harvard
Business School Press, Boston.
Eriksson, P., & Kovalainen, A. (2008). Qualitative Methods in Business Research, 1st Ed. London:
SAGE Publications Ltd.
Ehie, I. C., & Madsen, M. (2005). Identifying critical issues in enterprise resource planning (ERP)
implementation. Computers in Industry, 56(6), 545-557.
Ful Hoon N.F., and Delgado S., Critical success factors for enterprise resource planning implementation
and upgrade, Journal of Computer Information System, Special Issue (2006)
Ghazanfari M., Jaafari M., Taqavi-fard M.T. and Rouhani S., Requirements for the Assessment of
Business Intelligence in ERP: (Case Study, Trade Promotion Organization of Iran), Journal of
Eqtesad va Tejarat Novin, 13, 22-45 (2008)
Gupta M. and Kohli A., Enterprise resource planning systems and its implications for
operations function,Technovation journal, 26(5-6), 687-696 (2006)
Huang, Z., and Palvia, P. (2001). ERP Implementation Issues in Advanced and Developing Countries

42
Business Process Management Journal. 7(3), 276-284.
Hunton, J. E., Lippincott, B., Reck, J. L. (2003) “Enterprise resource planning systems: comparing firm
performance of adopters and nonadopters”, International Journal of Accounting
Information Systems, Volume 4, Issue 3, September 2003, pp. 165-184, ISSN 1467-0895
Järvinen, P. (1991). 'On Approaches in Information Systems Research', in Proceedings of the
14th Information Systems Research In Scandinavia, Umeå, Sweden, 91:1-13.
Jiang Yingjie, Critical Success Factors in (ERP) Implementation in Finland, The Swedish School of
Economics and Business Administration (2005)
Kamhawi, E.M. (2008). Enterprise Resource-Planning Systems Adoption in Bahrain: Motives, Benefits,
and Barriers. Journal of Enterprise Information Management. (21).
Law, C.C.H., and Ngai, E.W.T. (2007). ERP Systems Adoption: An Exploratory Study of the
Organizational Factors and Impacts of ERP Success. Information & Mgt. (44:4), pp 418-432.
Lucas, H. (1981). Implementation, the key to successful information systems. New York: Columbia
University Press.
Martisons, M. G., Hempel, P.S. (2011) Chinese business process reengineering, International Journal of
Information Management, Vol. 18 No.. 6, pp. 393-407.
Momoh, A., Roy, R., Shehab, E., (2010) Challenges in enterprise resource planning implementation:
state-of-the-art. Business Process Management Journal, Vol. 16 No. 4, 2010, pp 537-565.
Mugenda, O. M., & Mugenda, A. G. (2003).Research methods: Quantitative and qualitative approaches.
Nairobi: Acts Press.
Nah F.F., Lau J.L. and Kuang J., Critical factors for successful implementation of enterprise systems.
Business Process Management Journal, 7(3), 285-296 (2003)
Ngai E.W.T., Law C.C.H. and Wat F.K.T., Examining critical success factors in the adoption of
enterprise resource planning, Computers in Industry journal, 59, 548-564 (2008)
Safaricom Limited, Safaricom Annual report 2015 available at
http://www.safaricom.co.ke/images/Downloads/Resources_Downloads/annual_report_2015.pdf
Spathis, C.J, & Constantinides, S.M (2004). Enterprise resource planning systems' impact on accounting
processes. Business Process Management Journal, 10(2), 234-247.
Wali. A. Ayoob, Deshmukh G. S And Gupta D. A, (2003) “Critical Success Factors of TQM.”
Production Planning & Control, Vol. 14, No. 1, pp. 3-14.
Wieder, B., Booth, P., Matolcsy, Z. and Ossimitz, M.L. (2006) „The impact of ERP systems on firm and
business process performance‟, journal of Enterprise Information Managements‟, 19 (1), pp.13-
29.

43
APPENDICES
Appendix I: Letter of Introduction
TO WHOM IT MAY CONCERN
Dear Sir/Madam,
REF: REQUEST FOR PARTICIPATION IN A RESEARCH STUDY
I am a student at the Management University of Africa pursuing a degree in Executive Masters in
Business Administration. As part of the course requirements, I am carrying out a research project
on the effects of ERP on Stakeholders‟ performance with specific reference to Safaricom
Limited.
The findings will be strictly confidential and will only be used for academic purposes and at no
time will your name be mentioned anywhere in the report. Yours honest participation will be
highly appreciated.
Yours faithfully
Enos Nyasimi Meroka

44
Appendix II: Research Study Questionnaire
I‟m kindly requesting for your support in terms of time, and by responding to the attached
questionnaire. Your accuracy and candid response will be critical in ensuring objective research.
Kind tick appropriately.
General Information
1. Please indicate your gender
Female [ ] Male [ ]
2. Indicate your age bracket
20-30 years [ ] 31-40 years [ ]
41-50 years [ ] 51 and above [ ]
3. State your highest level of education
Primary level [ ] Secondary level [ ]
College [ ] University [ ]
Postgraduate [ ]
4. Category
Employee [ ]
Supplier [ ]
Customer [ ]
ERP
5. Your organization has a Headquarters (HQ) somewhere that coordinates your activities?
Yes [ ] No [ ]
6. How many years has your organization been using the ERP System?
1-3 years [ ] 4-7 years. [ ] Over 7 years [ ]
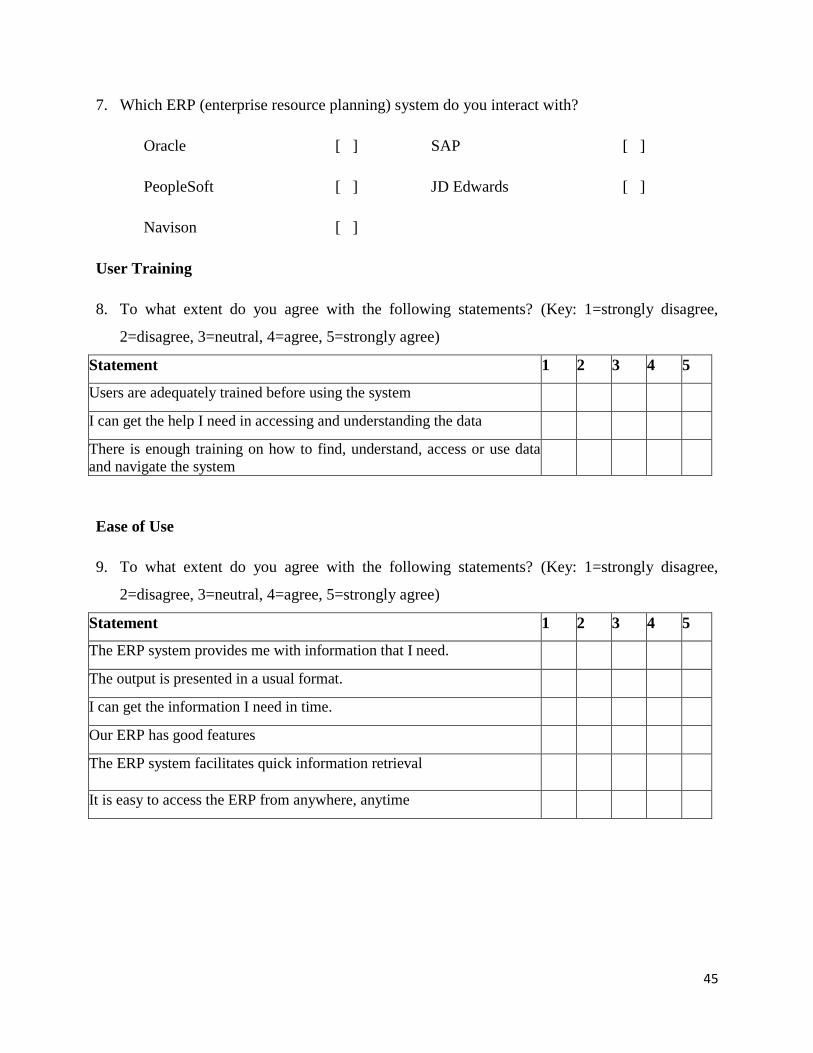
45
7. Which ERP (enterprise resource planning) system do you interact with?
Oracle [ ] SAP [ ]
PeopleSoft [ ] JD Edwards [ ]
Navison [ ]
User Training
8. To what extent do you agree with the following statements? (Key: 1=strongly disagree,
2=disagree, 3=neutral, 4=agree, 5=strongly agree)
Statement 1 2 3 4 5
Users are adequately trained before using the system
I can get the help I need in accessing and understanding the data
There is enough training on how to find, understand, access or use data
and navigate the system
Ease of Use
9. To what extent do you agree with the following statements? (Key: 1=strongly disagree,
2=disagree, 3=neutral, 4=agree, 5=strongly agree)
Statement 1 2 3 4 5
The ERP system provides me with information that I need.
The output is presented in a usual format.
I can get the information I need in time.
Our ERP has good features
The ERP system facilitates quick information retrieval
It is easy to access the ERP from anywhere, anytime
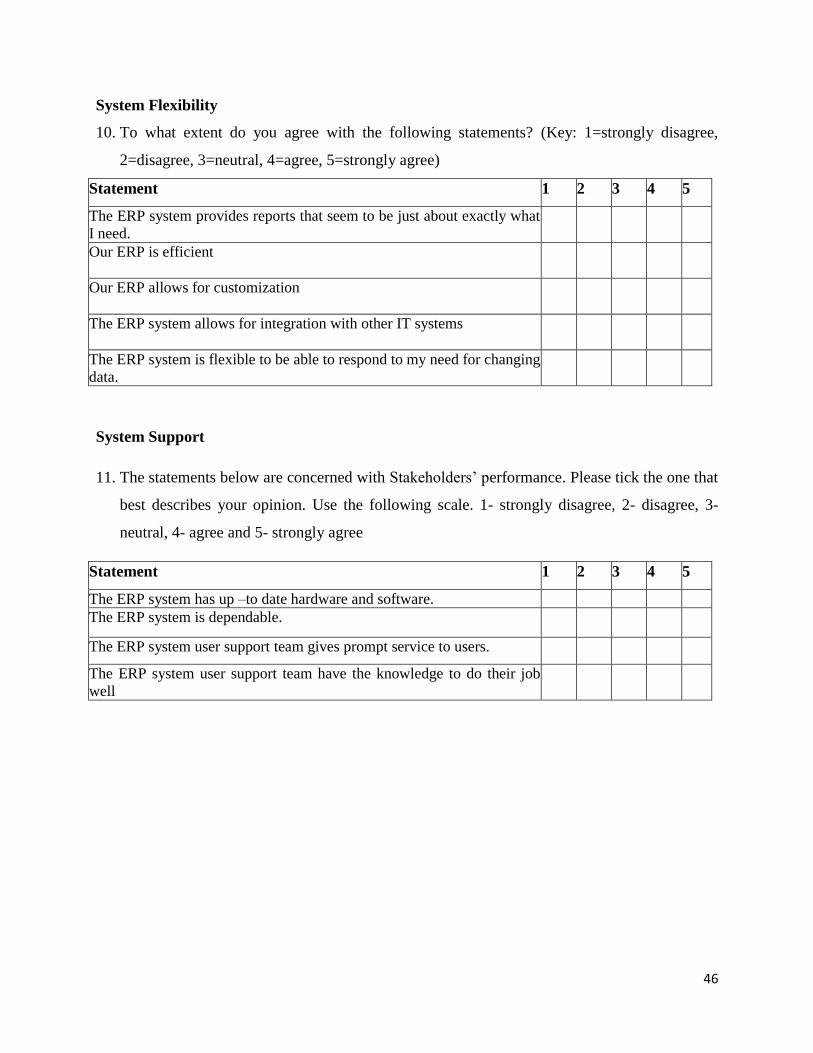
46
System Flexibility
10. To what extent do you agree with the following statements? (Key: 1=strongly disagree,
2=disagree, 3=neutral, 4=agree, 5=strongly agree)
Statement 1 2 3 4 5
The ERP system provides reports that seem to be just about exactly what
I need.
Our ERP is efficient
Our ERP allows for customization
The ERP system allows for integration with other IT systems
The ERP system is flexible to be able to respond to my need for changing
data.
System Support
11. The statements below are concerned with Stakeholders‟ performance. Please tick the one that
best describes your opinion. Use the following scale. 1- strongly disagree, 2- disagree, 3-
neutral, 4- agree and 5- strongly agree
Statement 1 2 3 4 5
The ERP system has up –to date hardware and software.
The ERP system is dependable.
The ERP system user support team gives prompt service to users.
The ERP system user support team have the knowledge to do their job
well

47
Stakeholders’ Performance
12. The statements below are concerned with Stakeholders‟ performance. Please tick the one that
best describes your opinion. Use the following scale. 1- strongly disagree, 2- disagree, 3-
neutral, 4- agree and 5- strongly agree
Statement 1 2 3 4 5
The ERP system has positive impact on the productivity of your job.
The ERP system is an important aid to me in the performance of my job
The ERP system enhances my performance
The ERP system enhances my effectiveness in my job
The ERP system allows me to accomplish more work than would
otherwise be possible
ERP improves collaboration among stakeholders
ERP helps to reduce redundancy
ERP use lowers transaction costs

48
Appendix III: Research Study Work plan
Description Feb March April May June July Aug Sept Nov
Concept
Development
Proposal
development
Instruments
development
Proposal defense
Data collection
Data analysis
Report writing
Project Defense
Compilation and
Submission