Effects of Electroless Nickel Process - GPO...
54
NBSIR 75-720 Effects of Electroless Nickel Process Variables on Quality Requirements Fielding Ogburn and Christian E. Johnson Corrosion and Eiectrodeposition Section Metallurgy Division Institute for Materials Research National Bureau of Standards Washington, D. C. 20234 December 1974 Final Report Prepared for Research Directorate Thomas J. Rodman Laboratory Rock Island Arsenal Rock Island, Illinois 60201 1
Transcript of Effects of Electroless Nickel Process - GPO...

NBSIR 75-720
Effects of Electroless Nickel Process
Variables on Quality Requirements
Fielding Ogburn and Christian E. Johnson
Corrosion and Eiectrodeposition Section
Metallurgy Division
Institute for Materials Research
National Bureau of Standards
Washington, D. C. 20234
December 1974
Final Report
Prepared for
Research Directorate
Thomas J. Rodman Laboratory
Rock Island Arsenal
Rock Island, Illinois 60201
1


NBSIR 75-720
EFFECTS OF ELECTROLESS NICKEL PROCESS
VARIABLES ON QUALITY REQUIREMENTS
Fielding Ogburn and Christian E. Johnson
Corrosion and Electrodeposition Section
Metallurgy Division
Institute for Materials Research
National Bureau of Standards
Washington, D. C. 20234
December 1974
Final Report
Prepared for
Research Directorate
Thomas J. Rodman Latwratory
Rock Island Arsenal
Rock Island, Illinois 60201
U.S. DEPARTMENT OF COMMERCE, Rogers C.B. Morton, Secretary
John K. Tabor, Under Secretary
Dr. Betsy Ancker-Johnson, Assistartt Secretary for Science and Technology
NATIONAL BUREAU OF STANDARDS, Ernest Ambler, Acting Director

ABSTRACT
The project objective was to determine the effects of productionprocedures on the characteristics of electroless nickel coatings. Depo-sition rate, pix)sphorus content, hardness, appearance, and nietal dis-tribution are reported for deposits from several hypophosphite type electro-less nickel baths, both proprietary and non-proprietary. The baths wereoperated under a variety of conditions with variations of composition.Extensive data are given on the relation of deposit hardness to phosphoruscontent and to heat treatment at 100, 200, and ^OO^C. Some data are givenrelative to electroless Ni-B, Ni-P-Cu, and Ni-P-Mi alloys.


EFFECTS OF EI£CTBDIESS NICKEL PROCESS VARIABLES CN
QUALITY EEWJEEmrrS
Objective
The general objective of the project under which this work was done was
to determine how characteristics of electroless nickel coatings are in-
fluenced by the operating variables of the process. The operating
variables were to extend to levels outside the nonnal operating ranges.
In this report we include deposits from non-proprietary baths and threeproprietary baths. Appearance, structure, plating rate, phosphoruscontent, hardness, heat treatment, and thickness uniformity of the de-posits are discussed. The- hardness data in conjunction with heat treat-ment is fairly extensive.
Solutions Used
Many of the electroless nickel (Ni-P) deposits were obtained from asolution similar to those reported by Brenner [1];
As prepared, this solution has a pH of abojut 6,6; but. with use, the_pHquickly drops to the buffered range of about ^.0-^,5. Normally the pro-cess was operated at or close to 96°C.
A modification of this Brenner bath was used to obtain deposits with lesthan ^% phosphorus:
NiCl2 • 6H2OSodium hypophosphiteSodium hydroxyacetate
30 g/110 g/l50 g/l
NiCl2 • 6H2OSodium hypophosphiteSodium hydroxyacetateTemperaturepH
60 g/l
1 g/l75-100 g/l
95°C6.0-6.5
A few deposits were obtained from five (5) sulfamate baths:
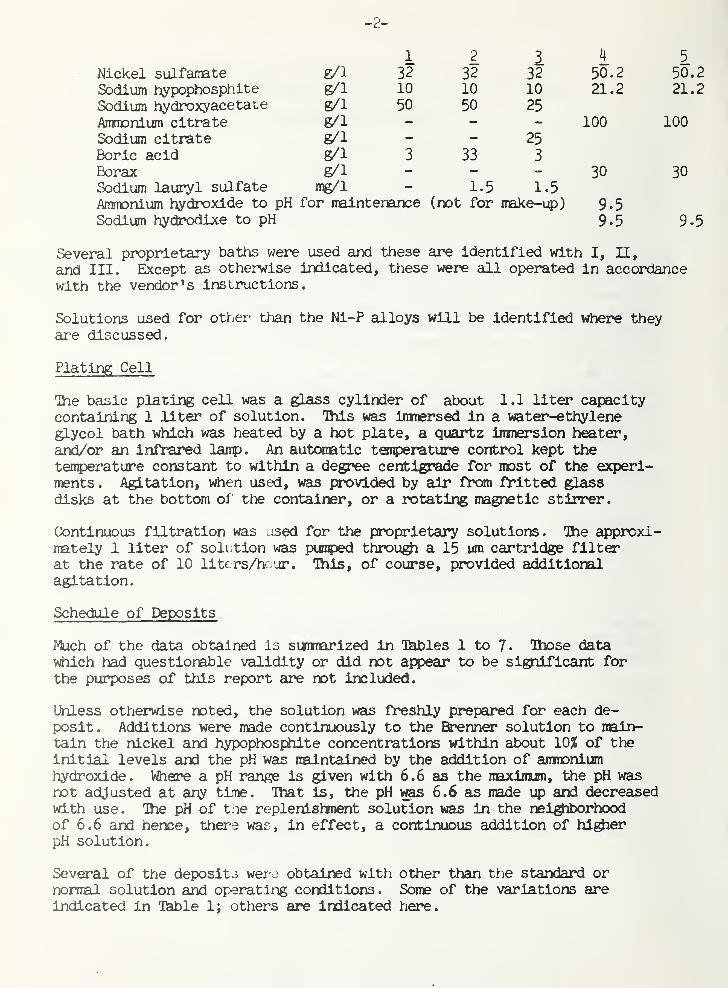
-2-
Nickel sulfamte g/1 32 32Sodium hypophosphlte g/1 10 10
Sodium hydroxyacetate g/1 50 50
ArmDnlum citrate g/1
Sodium citrate g/1 - -
Boric acid g/1 3 33Borax g/1
Sodium lauryl sulfate mg/1 - 1.5Amrronium hydroxide to pH for maintenance (not for
Sodium hydrodlxe to pH
1 2 13210
25
4
50.221.2
5
50.221.2
100 100
25
3
30 301.5
make-up) 9.59.5 9.5
Several proprietary baths were used and these are identified with I, II,
and III. Except as otherwise indicated, these were all operated in accordancewith the vendor's instructions.
Solutions used for other than the Ni-P alloys will be identified where theyare discussed.
Plating Cell
Ihe basic plating cell was a glass cylinder of about 1.1 liter capacitycontaining 1 liter of solution. This was immersed in a water-ethyleneglycol bath which was heated by a hot plate, a quartz iitmerslon heater,and/or an infrared lanp. An autcanatic tenqperature control kept thetenperature constant to within a degree centigrade for most of the experi-ments. Agitation, vihen used, was provided by air from fritted glassdisks at the bottom of the container, or a rotating magnetic stirrer.
Continuous filtration was used for the proprietary solutions. Ihe ^proxi-mately 1 liter of solution was punped through a 15 um cartridge filterat the rate of 10 liters/hour. This, of course, provided additioralagitation.
Schedule of Deposits
Much of the data obtained is sunmarized in I^les 1 to 7. Ihose datawhich had questionable validity or did not appear to be significant forthe purposes of this report cu:^ not Included.
Unless otherwise noted, the solution was freshly prepared for each de-posit. Additions were made continuously to the Et^nner solution to main-tain the nickel and hypophosphlte concentrations within about 10% of theinitial levels and the pH was maintained by the addition of anmoniumhydroxide. Where a pH range is given with 6.6 as the maxluum, the pH wasnot adjusted at any time. Ihat is, the pH ms 6.6 as made up and decreasedwith use. Ihe pH of the replenishment solution was in the nei^Tborhoodof 6.6 and hence, there was, in effect, a continuous addition of hi^erpH solution.
Several of the deposits were obtained with other than the standard ornormal solution and operating conditions. Some of the variations areIndicated in Table 1; others are indicated here.
-3-
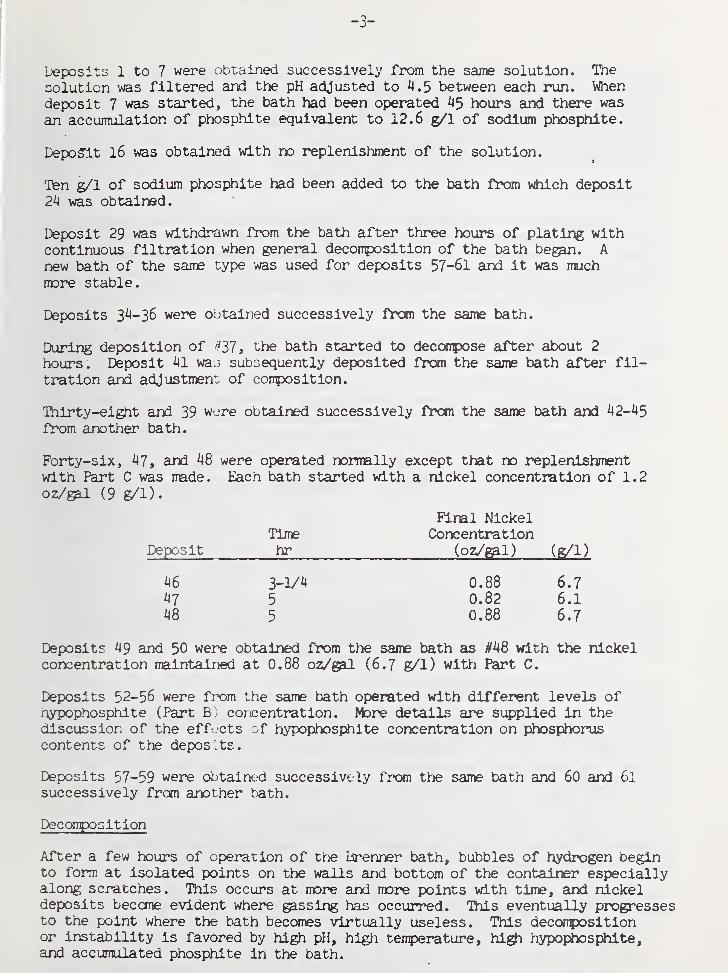
Deposits 1 to 7 were obtained successively from the same solution. The
solution was filtered and the pH adjusted to ^.5 between each run. Whendeposit 7 was started, the bath had been operated ^5 hours and there was
an accumulation of phosphite equivalent to 12.6 g/1 of sodium phosphite.
Deposit l6 was obtained with no replenishment of the solution.
Ten g/1 of sodium phosphite had been added to the bath from vrtilch deposit2^ was obtained.
Deposit 29 was withdrawn from the bath after three hours of plating withcontinuous filtration when general decomposition of the bath began. Anew bath of the same type was used for deposits 57-61 and it was muchmore stable.
Deposits 3^-36 were obtained successively fran the same bath.
During deposition of f^37 , the bath started to decarpose after about 2
hours. Deposit ^1 wa.^ subsequently deposited from the same bath after fil-
tration and adjustment of composition.
Thirty-eight and 39 were obtained successively from the same bath ajid ^2-^5
from another bath.
Forty-six, ^7, and ^8 were operated normally except that no replenisl-ment
with Part C was made. Each bath started with a nickel concentration of 1.2oz/gal (9 g/1).
Pinal NickelTime Concentration
Deposit hr (oz/^1) (g/1)
i46 3-V^ 0.88 6.7
^7 5 0.82 6.148 5 0.88 6.7
Deposits 49 and 50 were obtained from the same bath as #48 with the nickelconcentration maintained at 0.88 oz/gal (6.7 g/1) with Part C.
Deposits 52-56 were from the same bath operated with different levels ofhypophosphlte (Part B) coricentration. More details are supplied in thediscussion of the efft^'cts of hypophosphlte concentration on phosphoruscontents of the deposits.
Deposits 57-59 were obtained successively from the same bath and 60 and 61
successively fron another bath.
DeconpoGltlon
After a few hours of operation of the Brenner bath, bubbles of hydrogen beginto form at Isolated points on the walls and bottc«n of the container especiallyalong scratches. This occurs at more and more points with time, and nickeldeposits become evident where gassing has occurred. This eventually progressesto the point where the bath becc«nes virtually useless. This decojipDSitionor Instability is favored by high pH, high temperature, hl^ hypophosphlte,and accumulated phosphite in the bath.

Stabilizers are usually added to proprietary baths to prevent or retardthis process. With bath I the instability showed up as rapid fonnationof finely divided particles throu^iout the bath. This occurred afterseveral hours of operation with filtration but without replenishment ofPart C containing stabilizers and nickel salts. It also started to occurafter two hours of operation of bath I at a hlgheJ* than nomal pH of ^.2.
Plating Rate
It is well known that the plating rate is dependent on the solution con>-
position and pH and on the solution torperature. A decrease in nickel
concentration, hypophosphite concentration, pH, or tenperature will de-crease the deposition rate. Such decreases are noxrrally expected as aplating bath is used unless steps are taken to replenish the solutionor to maintain its tenperature.
Rate data is given in Table 1. Ihese were estimated from micrometermeasurements or from weight changes assuming a density of 7.85 g/cm^ [2].
In the literature [3] there is a rule of thunob for the acid type ofelectroless nickel solution that a 10°C change of tenperature will changethe plating rate by a factor of 2. This was essentially substantiated bya series of rate measurements during deposition from the Brenner solution.
Specimen Tenperature Plating Wei^t of Rate of Deposition*nine Deposit
20 50°C 71 hr 2.051 g 0.71 m/hr 0.028 miVhr22 60 ^^ 2.593 1.45 0.05721 70 21 2,^21 2.85 0.1123 80 10 2.237 5.3 0.2213 95 ^-V2 2.855 15.7 0.62
For each of these measurements a ft^sh bath was used and continuousadditions of hypophosphite and nickel chloride were made to maintain thecomposition within 10^ of the original nickel and hypophosphite concentra-tions. The initial pH was 6.6 and the final was 4.3-^.5.
Appearance and Surface Roughness
With prolonged operation of a Brenner solution without continuous filtra-tion, the upward facing surfaces of a deposit beccmie rougji. Apparently,microscopic particles or sediment form in the solution and settle out onthe work surfaces causing rou^iness. Eventually nickel particles are ob-served on the walls of the container and the nickel deposition slowlygets out of hand
.
This rou^ening is the only detrimental change in appearance that has beenobserved for deposits from the Brenner bath. Rou^iness could probablybe prevented by continous filtration.
*Density assuned to be 7.85 [2].
-5-
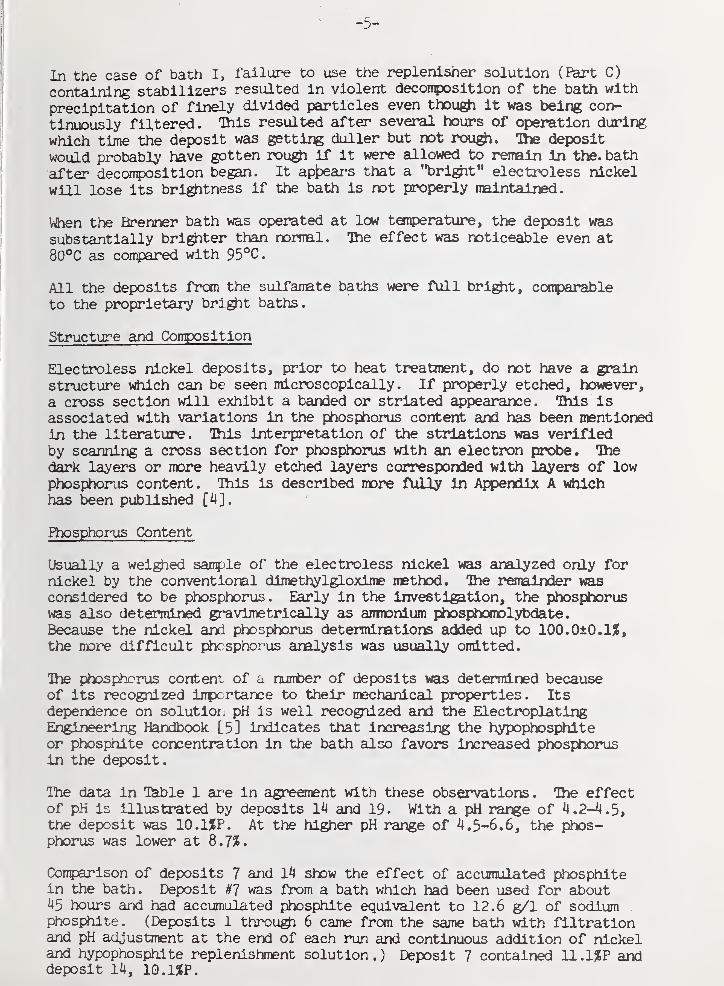
In the case of bath I, failure to use the replenisher solution (Part C)
containing stabilizers resulted in violent deconposltion of the bath with
precipitation of finely divided particles even though it was being con-
tinuously filtered. This resulted after several hours of operation during
which time the deposit was getting duller but not rougji. The deposit
would probably have gotten rou^ if it were allowed to reirain In the. bath
after deconposition began. It appears that a "bri^t" electroless nickel
will lose its brightness if the bath is not properly maintained.
When the Brenner bath was operated at low temperature, the deposit wassubstantially bri^ter than nomHl. The effect was noticeable even at
80°C as compared with 95°C.
All the deposits from the sulfamate baths were full bri^t, conparableto the proprietary bright baths.
Structure and Composition
Electroless nickel deposits, prior to heat treatment, do not have a grainstructure which can be seen microscopically. If properly etched, however,
a cross section will exhibit a banded or striated appearance. Ihls isassociated with variations in the phosphorus content and has been mentionedin the literature. This interpretation of the strlatlons was verifiedby scanning a cross section for phosphorus with an electron probe. Thedark layers or more heavily etched layers corresponded with layers of lowphosphor-Lis content. Ihis is described more fully In Appendix A whichhas been published [^].
Fhosphorois Content
Usually a wei^ied sample of the electroless nickel was analyzed only fornickel by the conventional dlmethylgloxime method. Ihe r^ralnder wasconsidered to be phosphorus. Early in the investigation, tl^ phospiiorus
was also determined gravimetrically as anmonlum phosphomolybdate.Because the nickel and phosphorus determinations added up to lOO.OtO.lJS,
the more difficult phosphorus analysis was usually omitted.
Ihe ptos{±iorus content of a number of deposits was determined becauseof its recognized inportance to their mechanical properties. Itsdependence on solution pH is well reco^iized smd the ElectroplatingEngineering Handbook [5] indicates that increasing the hypophospdilteor phosphite concentration in the bath also favors increased phosphorusin the deposit.
The data in Table 1 are in agreanent with these observations. Ihe effectof pH is Ulustrated by deposits m and 19. With a pH rarge of ^.2-^.5,the deposit was 10.1$P. At the higher pH range of ^.5-6.6, the phos-phorus was lower at 8.7%.
Comparison of deposits 7 and 1^ show the effect of accumulated phosphitein the bath. Deposit #7 was from a bath which had been used for about^5 hours and had accumulated phosphite equivalent to 12.6 g/1 of sodium .
phosphite. (Deposits 1 through 6 came from the same bath with filtrationand pH adjustment at the end of each run and continuous addition of nickeland hypophosphite replenishment solution.) Deposit 7 contained ll.l^P anddeposit 14, 10.1$P.
-6-
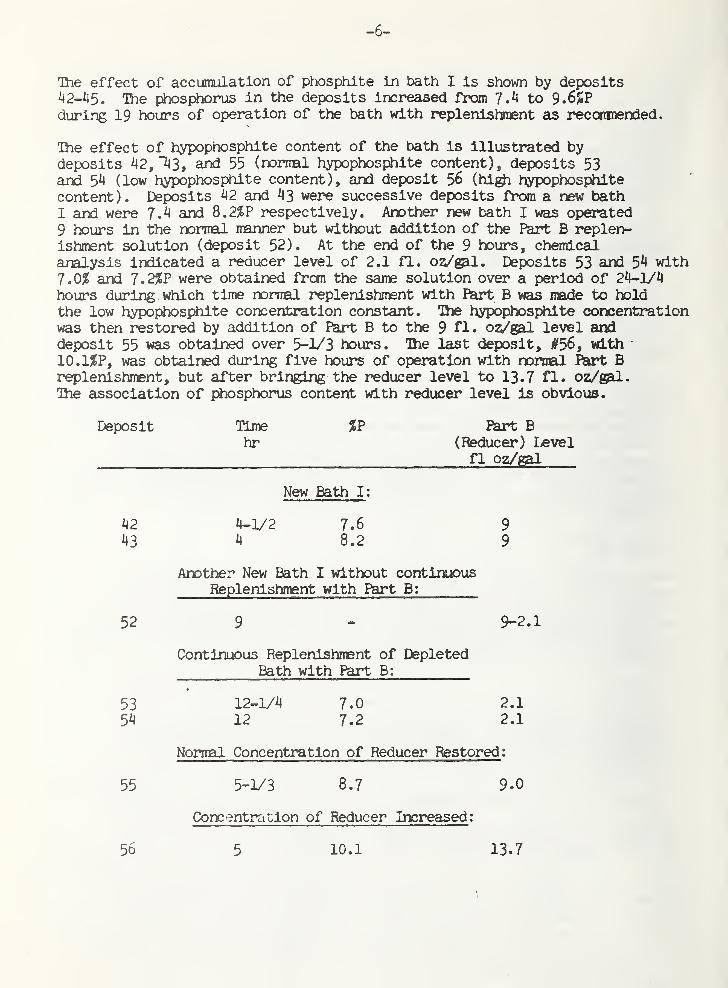
The effect of accunmlation of phosphite in bath I Is shown by deposits^2-^15. The phosphorus in the deposits increased from 7.^ to 9,6%?during 19 hours of operation of ths bath with replenishment as j?ecc3iTinended.
The effect of hypophosphite content of the bath is illustrated bydeposits ^2,'k3, and 55 (norml hypophosphite content), deposits 53and 5^ (low hypophosphite content), and deposit 56 (hi^ hypophosphitecontent). Deposits 42 and ^3 were successive deposits from a new bathI and were 7.4 and 8.2%P respectively. Another new bath I was operated
9 hours in the normal manner but without addition of the Part B replen-ishment solution (deposit 52). At the end of the 9 hours, chemicalanalysis indicated a reducer level of 2.1 fl. oi/gal. Deposits 53 and 54 with7.0% and 7.2%? were obtained from the same solution over a period of 24-1/4
hours during vriiLch time normal replenishment with Part B was made to holdthe low hypophosphite concentration constant. The hypophos^iite concentrationwas then restored by addition of Part B to the 9 H.. oz/gal level anddeposit 55 was obtained over 5-1/3 hours. The last deposit, #56, with10.1%?, was obtained during five hours of operation with nonnal ftirt Breplenishment, but after bringing the reducer level to 13.7 fl. oz/gal.The association of phosphorus content with reducer level is obvious.
Deposit TlJiie %? Rart Bhr (Reducer) Level
fl oz/gal
New Bath I :
42 4-1/2 7.6 943 4 8.2 9
Another New Bath I without continuousReplenishHTient with fart B:
52 9 - 9-2.1
Continuous Replenishment of DepletedBath with Part B:
53 12-1/4 7.0 2.1
54 12 7.2 2.1
Normal Concentration of Reducer Restored :
55 5-V3 8.7 9.0
Concentration of Reducer Increased :
56 5 10.1 13.7
/

-7-
The relation of phospnorus to tenperature of deposition is also of interest.
Deposit Bath Deposition Rate of Deposition %FTemperature Tljne mils/hr
_fC hr
20 50 71 0.03 12.522 60 0.06 11.9
21 70 21 0.1 . 11.1
23 80 9-1/2 0.2 10.0
19 96 5-1/2 0.5 8.7
Ihe deposition time was selected so that the deposit thickness for eachwould be about the same. It is apparent that the phosphorus content is
related to the deposition tenperature. Part of the effect mi^t be dueto build up of phosphite during the longer runs at low tenperature, but
this seems unlikely. The amount of nickel deposited would not. havediffered much fran run to run and the phosphite build-i^ would probablybe about the same each tijne.
For each of these measurements, a fresh bath was used and continuousaddition of a replenishment solution was made to maintain the solutionccrg:osition within 10% of the original nickel and hypophosphite concen-trations. Ihe initial pH was 6.6 and the final was ^.3-4.5.
Low Rx)SFhorus Alloy
Baths II and III were obtained because the vendors advertised a low ptfiosphorus
content for the deposits, 2% or less. Both baths were operated in accordancewith the vendor's instructions, but deposits frcn both were hi^ in phos-phorus, 12% and 12.33». Boti^i vendors were contacted and informed of ourexperience. One vendor said they had replaced the low phosphorus bathwith a high phosphorus bath without charging the trade name or designation.Ihey promised to send us more of the old phosphorus bath, but never did.Ihe other vendor sent us more of their bath which gave us the sazne results.We sent them a sairple of our deposit frc«n this second lot and they confirmedour analysis of phosphorus 12. 3?, and sent us still more of their bath, butwe did not use the last lot.
One reason for using the alkaline sulfamate bath was the report that depositsfrom it were 2 to 3? phosphorus [6]. Our deposits, nuirbers 80-82 5 were 5.2,
5.5, and 6.5XP. To obtain deposits with low phosphorus content we usedthe modified Brenner bath with hl^ nickel and low hypophosphite contentand a pH of 6.0-6.6. This gave deposits with 2.8^ amd 3.7X phosphorus andthey were relatively ductile.
Hardness Measurement
All hardness measurements were made with a Knoop indenter using a Tukonmicrohardness tester. Ihe indentations were made on cross sections withthe long axis parallel to tne substrate. Ihe location of the Inctentationwas such that it was not influenced by the proximity of either boundary

-8-
of the deposit or of another indentation. Some indentations led to the
formation of microcracks particularly with loads of 500 g. These were notmeasured for hardness values and new indentations were made with a ligjiter
load
.
Ihe specimens for hardness measurement were mounted In an epoxy cementcured at room temperature so as to avoid any heat effects. Ihe heat in-volved in nomal mounting in Bakelite or Lucite would have had seriouseffects on the subsequent hardness measurements. After grinding and polish-ing, the specimens were etched Just sufficiently to bring out indicationsof the usual striations. Heavier etching leads to low hardness values andcan be seriously misleading. Even such a light etch has significant effects.Unfortunately this was not realized until after a nLBiber of the raeasurementsreported here had been made. Light polishing aTter the light etch may in-crease the measured hardness by about 35 units vdien a load of 100 g Isused. This technique was followed for deposit 3^ and all subsequent deposits.The hardness values reported for all preceding deposits have been increasedby 35 units.
Each hardness value reported is the average of one measurement of eachsix indentations. Ihe cross sectional specimen was about 1/2 inch longand three indentations were made near either end. All measurements weremade after the operator had checked his technique with a standard hard-ness block. The precision of the operator's measurements was the subjectof a brief evaluation. The stimdard deviation for a single measurementwas 1.^^ and for an average of six measurements it was 0.57% based on^30 degrees of freedom. Ihis precision is meaningful only for measure-ments on a single specimen such as measur«nents before and after variousheat treatments. It is not a measure of the reproducibility of specimensand is not applicable when coirparing one specimen with another.
Also the measur«nent precision is undoubtedly much poorer at low loads of25 and 50 g.
Ihe hardress of an electroless nickel deposit is not uniform. It variesfrom place to place, presumably as the canposition or phosphorus contentvaries. This was evident when the hardness of a li^tly etched specimenwas jneasured on both a dark (etched) band and on a light band. The etchedband measured 526 HKp^Q and the light band measured ^83 ^OQO' ^'^^^^fbut significant differences were also noted between the two ends ofseveral mounted specin^ns. As noted earlier, three measuranents were madeat either end of each specimen and the indentations were made in the sameposition relative to the banded etch pattern.
Initially, hardness measurements were made with a 500 g load_. Later itwas found that some of the specimens which had been heat treated at ^OO^Ccracked when the indentation was made. It was found that with a 100 gload cracking was not a problem and all subsequent measurements were madewith a 100 g load.
In order to convert our own data from one load to another, a nmtoer ofspecimens in several different hardness ranges were measured with 25, 50,100, 200, and 500 g loads. This data was ccmbined to produce a gr^hwhich could be used to convert data for one load to values
-9-
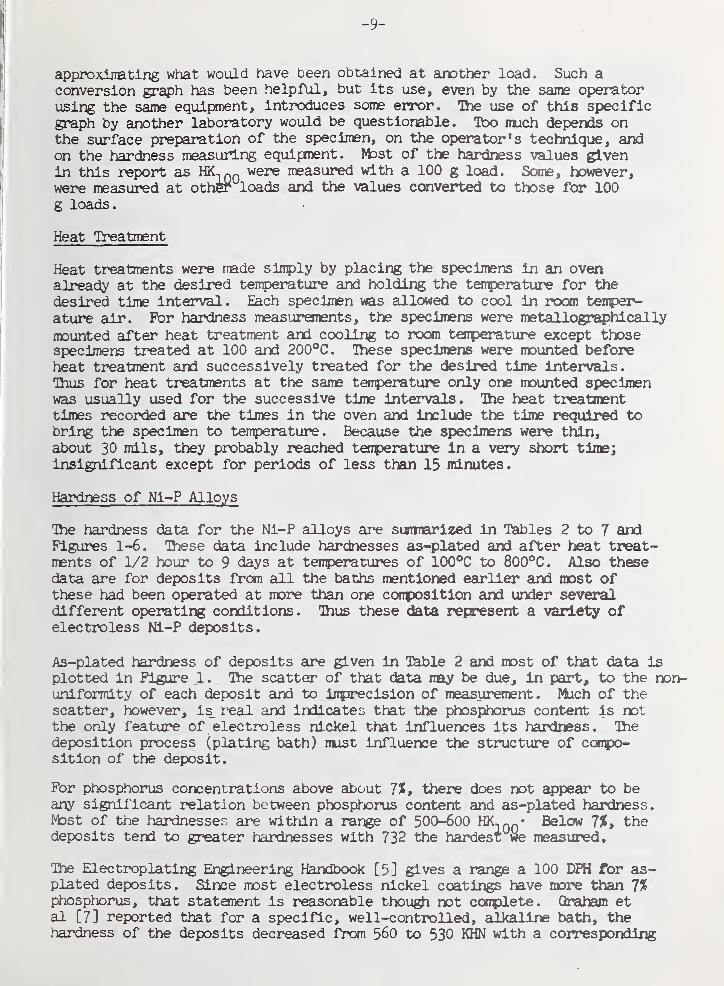
approximting what would have been obtained at another load. Such aconversion graph has been helpful, but its use, even by the same operatorusing the same equipment, introduces some error. The use of this specificgraph by another laboratory would be questionable. Tbo much depends onthe surface preparation of the specimen, on the operator's technique, andon the hardness measuring equipment, ftost of the hardness values givenin this report as HK,qq were measured with a 100 g load. Some, however,were measured at other loads and the values convei*ted to those for 100
g loads. "
Heat Treatment
Heat treatments were made sijrply by placing the specimens in an ovenalready at the desired teirperature and holding the tenperature for the
desired tiine interval. Each specimen was allowed to cool in room tenpeivature air. For hardness measurements, the specimens were metallographlcally
mounted after heat treatment and cooling to room tenperature exc^t thosespecimens treated at 100 and 200°C. Ihese speclinens were mounted beforeheat treatment and successively treated for the desired time intervals.Thus for heat treatments at the same tenperature only one mounted specimenwas usually used for the successive time intervals. Ihe heat treatmenttijnes recorded are the times in the oven and include the tljne required tobring the specimen to tenperature. Because the specimens were thin,about 30 mils, they probably reached tenperature in a very short tljie;
insignificant except for periods of less them 15 minutes.
Hardness of Ni-P Alloys
Ihe hardness data for the Ni-P alloys are sunwarlzed in 'Tables 2 to 7 andFigures 1-6. Ihese data Include hardnesses as-plated and after heat treat-ments of 1/2 hour to 9 days at tenperatures of 100**C to 800°C. Also thesedata are for deposits frcm all the baths mentioned earlier and roost ofthese had been operated at more than one conposition and under severaldifferent operating conditions. Ihus these data represent a variety ofelectroless Ni-P deposits.
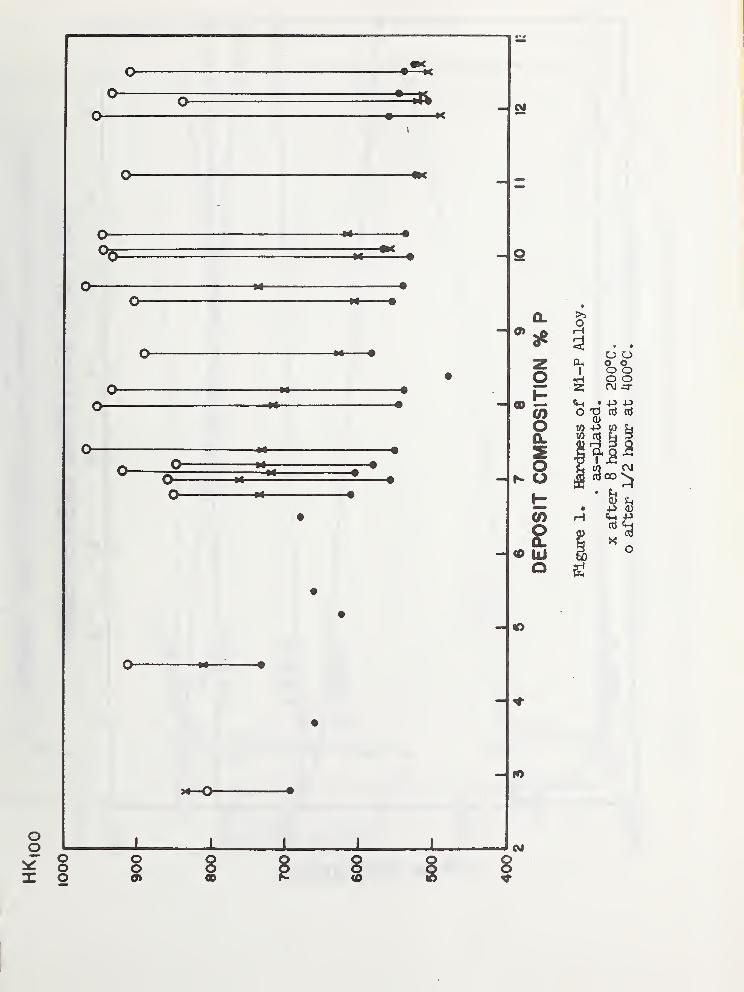
As-plated hardness of deposits are given in I^le 2 and most of that data isplotted in Figure J . Ihe scatter of that data may be due^ in part, to the non-uniformity of each deposit and to inpreclslon of measurement. Much of thescatter, however, is real and indicates that the phosptorus content is notthe only feature of electroless nickel that Influences its hardness. Ihedeposition process (plating bath) must influence the structure of caipo-sition of the deposit.
For phosphorus concentrations above about 73», there does not appear to beany significant relation between phosphorus content and as-plated hardness.Most of the hardnesses are within a range of 500-600 HK,qq- Below 7%, thedeposits tend to greater hardnesses with 732 the hardest we measured.
The Electroplating Engineering Handbook [5] gives a range a 100 DPH Ibr as-plated deposits. Since most electroless nickel coatings have more than 7%phosphorus, that statement is reasonable though not conplete. Qraham etal [7] reported that for a specific, well-controlled, alkaline bath, thehardness of the deposits decreased from 560 to 530 KHN with a corresponding
-10-
phosphiorus increase from ^.5 to 9.555. Any such trend in our deposits wouldbe obscured by other variables . Randin and Hinteman [ 8] using an acidsolution show a pronounced minimum in hardness at about 6.3$ phosphorus.Ihis miniinum does not appear in our data. Iheir data, when con^jared withours, eirphasize that hardness is influenced by more than Just j*iosphoruscontent
.
Table 2 and Figure 1 also give data for hardness after heat treatments ofeight hours at 200°C and 1/2 hour at ^00°C. In Figure 1, the points onany one vertical line are for the same deposit. Fbr the 200**C heat treat-ment there is a clear trend to lower hardness with increasing phosip^ruscontent. Generally the 200°C treatment increases the hardness, but forsome of the deposits with 10% or more of phosphorus, the hardness decreased.During the ^00®C heat treatment, the hardness increased to 8^0 to 1001_HK,qq.One exception was the specimen with 2,8% with a hardness of 812 HK,
qq^^ lessthan after the 200°C heat treatment. No trend of hardness with phoSpooruscontent was evident.
The data of Table 2 and Figure 1 raise the question of what would the datalook like after different heat treatment times. Was the hardening processconplete? Consequently, data on hardness changes with heat treatment withtime wer-e obtained. Starting with storage at room tenperature, 19-23®C,for two years, a decrease in hardness was c*)served for one low phosphorusspecimen and no significant change for two others.
%P As-Plated After 2 Years
7.1 602 60712.5 536 5^2
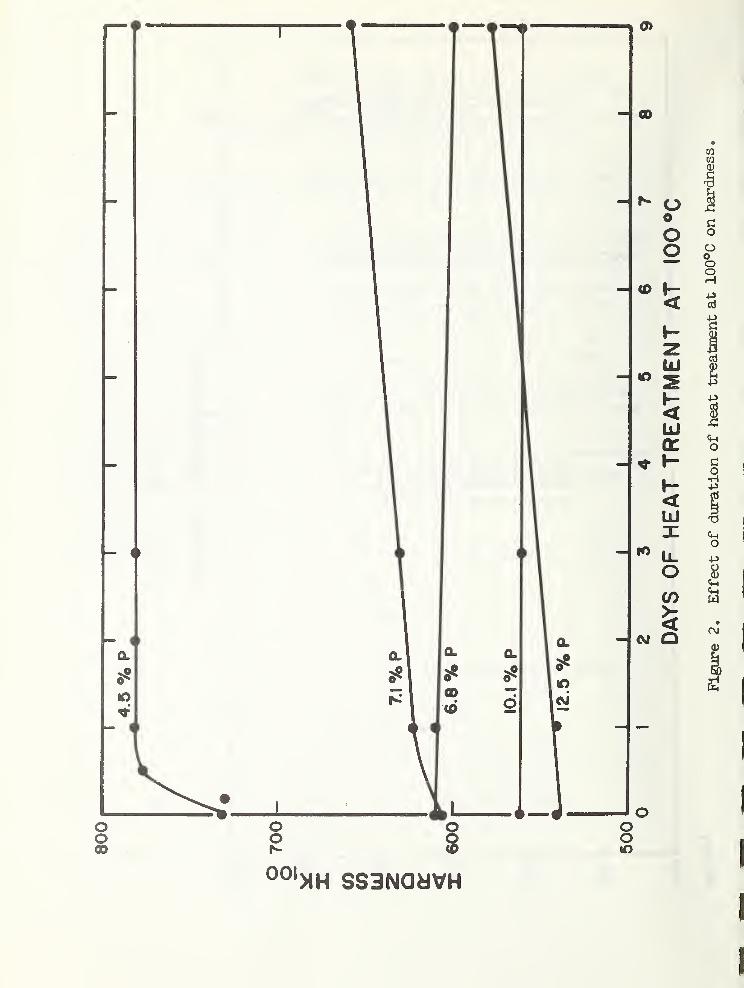
At 100°C, measurements were made over periods of iq? to nine days. Ihesedata are in Ikble 3 and Figure 2. Significant changes occur at that tenper-ature, but at greatly varying rates. A specimen with 4.5$P has canpletedthe hardening process in one day. Those with 7,1% and 12.5$ took muchlonger and may not have ccaipletely hardened after nine days. One specimendecreased in hardness and another showed no change. Our data is notsufficient to establish any pattern or correlation.
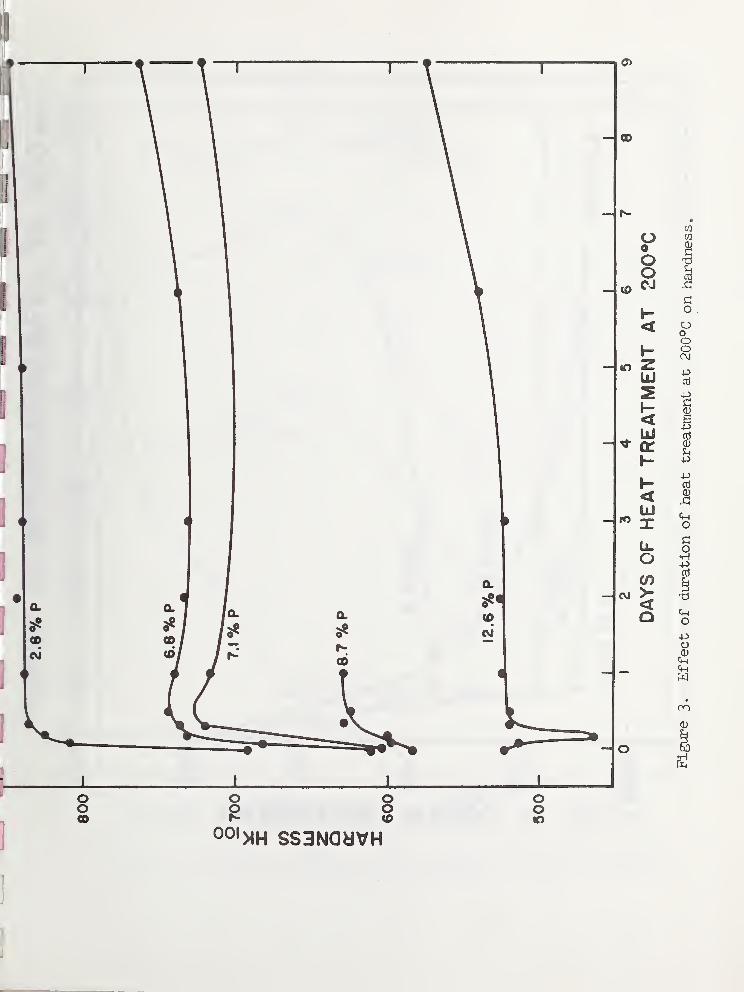
Heat treatments at 200°C were also conducted for periods up to nine days.Most of the hardness changes took places within one day, but it is not clearthat the changes were corplete within the nine days. See 'jfeble ^ and Figure3. Of interest are the four specimens with 12.2$ or more phosphorus.Initially these decreased in hardness reaching a minimum between two andei^t hours and then recovering to a hardness which was sometimes more andSOTietlmes less than the initial hardness. Ihis dip in hardness correspondsto the decrease in hardness recorded in Table 2 and Figure 1.
Figure 3 shows a small dip in hardness between one and nine days of heattreatment at 200**C. Ihe dip is very shallow; but because the hardnessmeasurements for each deposit were made on identical specimens, bythe same operator, with the same equipment; we believe the dips to bereal.
Data for hardness vs. time at HOO°C are given in Table 5 and some of them are

-11-
used to construct Figure ^. In Figure ^, where the 0 and 1/H hour points areconnected by straight lines, the hardness rapidly increases and then abruptlylevels off or slowly decreases. We do not know vriiere the break occurs.
Higgs [9] observed that this break occurred within five minutes or perhapseven one minute. IW0 of the deposits with ^.5 and 6.8$P did not show that
abrupt change, but continued to increase in hardness for at least two hours.
Again it is apparent that the properties of electroless nickel do not dependsolely on phosf^rus content.
The data in lable 6 and Figure 5 show hardness changes with duration of heattreatment at 600°C. IXiring the first 1/^ hour, the hardness increases quiterapidly and then abruptly levels off or decreases. As with the ^00°C heattreatment, we do not know Just when this break occurs. Specimens frandeposit 56 with 10.1$P, heated for two and four minutes, had hardnesses of9^8 and 89^ respectively. Ihese heating times are not to be takentoo seriously as they include an unknown time for brirging the specimens upto tenperature. They suggest, however, a very rapid rise and fall ofhardness during the first few minutes of heating.
Subsequent to the period of rapid change, the hardness of most of thespecimens changed slowly and went througji a raaxlmLm alter about one hour.The low, 2.Q%, phosphorus specimen quickly softened initially and thenshowed no further change.
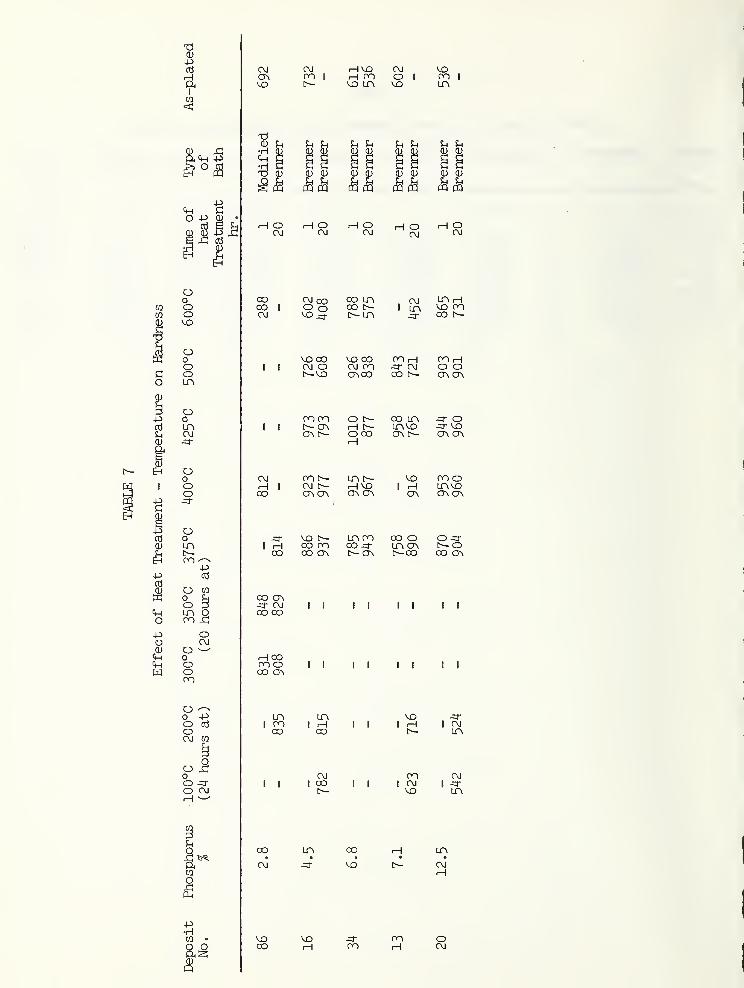
In Figure 6, hardness is plotted against the temperature of a 20 hourheat treatment for specimens with several different phosphorus contents.'Table 7 gives the data for these curves and also gives equivalent data forone hour heat treatments. The two sets of data are sufficiently similarthat preparing a graph for the one hour data is not helpful. With Inter-mediate percentages of phosphorus, the hardness Increases with tenperatureof heat treatment until a maxlmtBi Is reached near ^00°C. Above 4(X)°C thereis a sharp drop in hardness. Ftar the 12.5JP, the drop is much less fortenperatures above ^00**C. With 2.8JP, the maxlmnn comes somewhere between250 and 350®C.
The curves of Figure 6 are reminiscent of, but substantially differentfrom,those published by Gutzelt and Mapp [10], Baldwin and Such [10],and Higgs [9] for one hour heat treatments of specimens with 8 to 9?phosphorus. The differences are attributable to the duration of heattreatment, phosphorus content, and, more importantly, the conditions ofdeposition. Of practical significance Is the tenperature of maximumhardness and how critical the tenperature is. Gutzelt and Mapp [10]and Higgs [9] gives the teirperature for naxlmum hardness at ^00°C.Baldwin and Such [10] found it to be nearer 350°C. Our data shows a maximumnearer 300°C for 2.8$P, but within ^10 ± 15^C for deposits of the hl^rphosphorus contents. The sharp drop off of hardness with tenperatures couldchange the hardness substantially. With one hour treatments, this hardnessdecrease seems to be less severe, but still could be sigiifleant. If theheat treatment tenperature is to be designated in procurement specifications,the danger of going to too high a tenperature should be considered. Itwould be advisable to determine the minimum tenperature at v^ch a sharpdrop can occur.

-12-
The hardening of the nickel-phosphorus alloy when it is heated to ^00°Cis attributed to a phase change from a solid solution of phosplx>rus in thenickel to a finely di^d-ded precipitate of a nickel-phosphorus ccwnpound(usually considered to be Ni3P) in a nickel matrix or to the fonnatlon ofnickel particles within a matrix of the nickel-phosphorus conpound.Subsequent softening aTter further high tenperatures is attributed to growthof the nickel grains with segregation of the conpound. It is unlikely thatthese processes are responsible for all the hardness maxima and minima thatappear in the plots of hardr^ss vs. heat treatment time and tenperature.What other processes are involved is not known, but possible ones arestress relief, expelling of hydrogen, and interaction with other iirpurities.
Adhesion
Ik) systematic investigation of adhesion was made. A nuni>er of test specimenswere prepared according to the schedule in l^le 8. These test specimenswere 1/8 inch steel rod, plated with about 1 mil (25 pm) of electroless nickel.Ihey were sent to Rock Island Arsenal to be tested by the Beams high-speedrotor method.
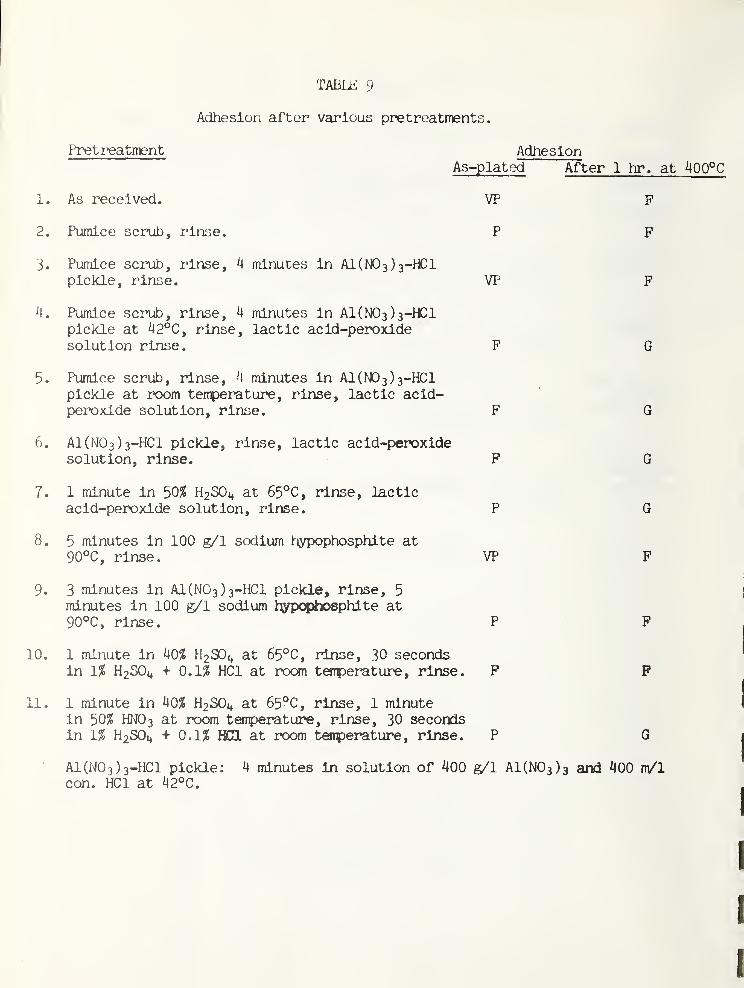
lb find conditions for obtaining adhesion of electroless nickel to Cr-Mo-Vasteel (gun stock), 10 wafers of the steel were prepared according to theschedule in Table 9 and plated with electroless nickel from solution I
.
One half of each wafer was tested as-plated for adhesion and one half afterone hour at ^00°C. The test consisted of making a rl^t angle bend around aV8 inch diameter mandrel and visual examination for separation of the coatingTrom the steel. The results are tabulated in Table 9. The best adhesionwas obtained with an A1(N03)3-HC1 pickle at ^2!°C [11] followed by a lacticacld-peroxlde^desnLitter at room tenperature [11]_. Usually one hour at ^OO^CInproved the adhesion and never did it result lri"poorer~adhesion.
If such pretreatments are to be used for gun bores, one should know theamount of metal removed. Ihls proved to be close to 0.^ mil (10 pm).When the pickle and desmutter were used at roan tenperature for the sametime periods, the metal removed was 0,005 mil (1.2 um) and subsequent adhesionof a deposit from bath I was not adversely affected.
Wear Tests
A few wear tests were made to conpare chroinlum (standard bath at 30 A/dm^and 55°C) with nickel-8.^? phosphorus from bath I. The data from thesetests with a Taber Abraser are summarized in Table 10.
These wear tests were made with CS-17 and CS-10 vdieels with a load of 1000 g.
A track was worn into each specimen prior to the test runs by making severalruns of 2500 cycles each. Several test runs were then made on each specimenand the average weight loss or thickness loss is reported. CS-17 wheels wereused initially. Subsequently we found that the CS-10 wheels were less proneto load-up with metal px)wder and gave more consistent data.
The data in Table 10 indicate that the ^00°C heat treatment inproved thewear resistance of the electroless nickel-phosphorus. Electrodeposltedchromium, however, was still more wear resistant. Ihls may be indicativeof service perfonnance, but we do not know how this test correlates withservice life.
-13-
Platlng of Gun Bores
Prior to plating 177 caliber gun bores, the bore of a 20 inch length of 3/l6
inch I.D. steel tube was plated with 0.7 mil (l8 m) electroless nickel from
bath I to detemine what metal distribution problems there mi^t be. Frommicroscopical examination of cross-sections of the deposit, it was determined
that there was' no significant variation of coating thickness from end to end
or circumferentially
.
Ihe set-up used for plating the gun bores is indicated in Figure 7. Oncethe barrel was in place, the ccrplete plating cycle was carried out byappropriate manipulation of stof>-cocks and pumps. Continuous additionswere made to the electroless nickel bath in a 2 liter reservoir whereautomatic tenperature control was maintained. The plating solution wascontinuously filtered.
Initially the bore was swabbed with benzene soaked gun patches and then it
was put in place. Ihe A1(N03)3-HC1 pickle was punped throu^ the barrel forfour minutes, cold tap water for one minute, and lactic acid-peroxide desrautter
for two minutes, all at room tenperature. A cold water rinse for one minutewas then followed by the electroless plating bath.
Four barrels were plated using bath I at 89**C with the pH at ^.8. They weredelivered to Rock Island Arsenal. Attenpts to plate barrels from bath IIIwere ccnpletely unsuccessful. No deposit at all was obtained. This bath wasoperated at a pH of 5.8 at 90°C and two widely different flow rates weretried. Because barrels could be plated with another proprietary process, noreal attoipt was made to find suitable operating ccaiditions for this bath.Presumably this is an exanple of the detrimental affects of excess agitationof electroless nickel-phosphorus baths with catalytic-^ison stabilizers [12].
Electroless Ni-P-Cu Alloy
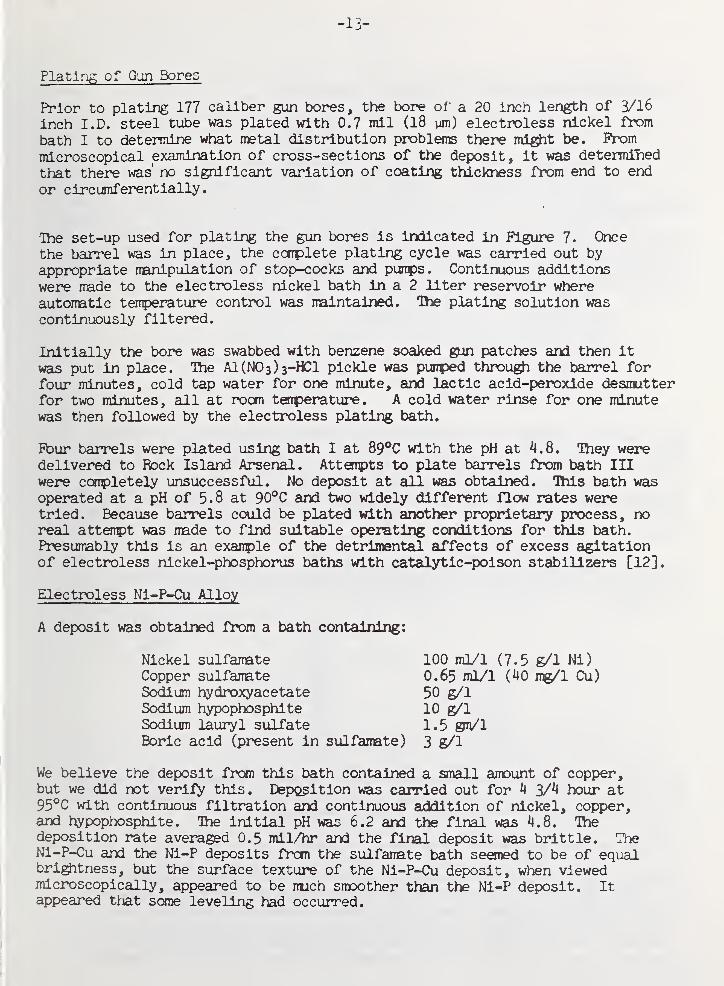
A deposit was obtained from a bath containing:
We believe the deposit fran this bath contained a small amount of copper,but we did not verifV this. Deposition was carried out for k 3/^ hour at95°C with continuous filtration and continuous addition of nickel, copper,and hypophosphite . Ihe initial pH was 6.2 and the final was ^.8. Ihedeposition rate averaged 0.5 mil/hr and the final deposit was brittle. TheNi-P-Cu and the Ni-P deposits frcm the sulfamate bath seemed to be of equalbri^tness, but the surface texture of the Ni-P-Cu deposit, when viewedmicroscopically, appeared to be nuch smoother than the Ni-P deposit. Itappeared that seme leveling had occurred.
Nickel sulfamateCopper sulfamate
ICQ ml/1 (7.5 g/1 Ni)0.65 ml/1 (^0 n^l Cu)
Boric acid (present in sulfamate)
Sodium hydroxyacetateSodium hypophosphiteSodium lauryl sulfate
50 g/110 g/11.5 ©n/l
3 g/1
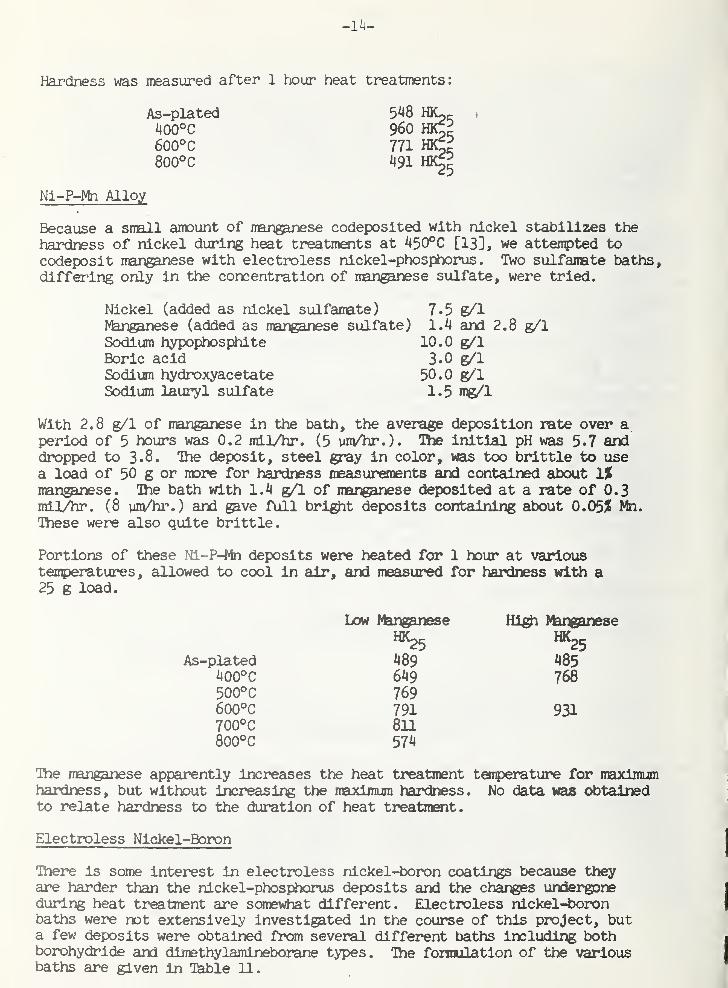
Hardness was measured after 1 hour heat treatments:
As-plated400°C600°C800°C
Nl-P-Mn Alloy
Because a small amount of manganese codeposited with nickel stabilizes the
hardness of nickel during heat treatments at ^30°C [13], we attejipted to
codeposit manganese with electroless nickel-phosphorus. Two sulfamate baths,differing only in the concentration of manganese sulfate, were tried.
Nickel (added as nickel sulfanate) 7.5 g/1Nknganese (added as manganese sulfate) 1.4 and 2.8 g/1Sodium hypophosphite 10.0 g/1Boric acid 3.0 g/1Sodium hydroxyacetate 50.0 g^lSodium lauryl sulfate 1.5 mg/l
With 2.8 g/1 of manganese in the bath, the average deposition rate over aperiod of 5 hours was 0.2 rail/hr. (5 vm/hr.). The initial pH was 5.7 anddropped to 3.8. Hie deposit, steel gray in color, was too brittle to usea load of 50 g or more for hardness measurements and contained about 1%manganese. The bath with 1.4 g/1 of manganese deposited at a rate of 0.3mil/hr. (8 um/hr.) and gave full bright deposits containing about 0.05? Mn.These were also quite brittle.
Portions of these Ni~P-Mn deposits were heated for 1 hour at varioustenperatures, allowed to cool in air, and measured for hardness with a25 g load.
Low Manganese High ManganeseHK25 ^
As-plated 489 485400°C 649 768500°C 769600°C 791 931700**C 811800°C 574
The manganese apparently increases the heat treatment tejiperature for maximumhardness, but without increasing the maximum hardness. No data was obtainedto relate hardness to the duration of heat treatment.
Electroless Nickel-Boron
There is some interest in electroless nickel-boron coatings because theyare harder than the nickel-phosphorus deposits and the changes undergoneduring heat treatment are somewhat different. Electroless nickel-boronbaths were not extensively investigated in the course of this project, buta few deposits were obtained frc»n several different baths including bothborohydride and dimethylamineborane types. The fonnulation of the variousbaths are given In T^le 11.

-15-
Bath 1 proved to be rather unstable. At 90° it deconposed spontar^uslybut slowly with the formation of metallic particles. At 80**, vd.th continuous
filtration throu^ a 1-3 pni polypropylene filter, deconposition became
evident after one hour of operation.
Bath 2 was used by Gorbunova et ^ [1^]: It differs from bath 1 by an
increase of thallium nitrate from 7 to 100 mg/1. Deposits were obtained
from this bath at 80, 90 and 95°C. At the lower tenperature they were
dark gray with some roughness and the plating rate was 0.5 mll/hr (13 ym/hr.).
At 95°C the plating rate was 1 mil/hr (25 unvOir.) and the deposits were asilvery gray and smooth. The hardnesses tabulated belcw were measured as-
plated and after a single heat treatment at each of several tenperatures
.
Deposited Depositedat 95^*0 at BO^C
HK^Q HK25 HK23
As-plated 76^ 8^2 85^i\00°C 979 1272 12^15
600**C 907 983800°C 976
We found that when this hig^i pH bath was operated at 90° or 95**C, the internalbushings of our punp would swell and seize. At 80°, this was not a problem.
Bath 3. This bath ceased to function after about five minutes. It Is
possible that it was poisoned by the stop-off used on the steel work pieceor the lead ion concentration was too high.
Bath ^ was given in a technical bulletin of the Gallery Chemical Ccnpany.Uils bath operated 1 1/2 hours and then stopped plating. Vfe did notattenpt to determine the reason plating stopped or to make up a new bath.The plating rate was 0.7 mll/hr (17 ym/hr.) and the deposit was a silverygray, stressed, and quite brittle.
HardnessAs-plated 777 HK^j,
1 hr. at U00°C II981 hr. at 600°C 1095
Bath 5 is given in U.S. Patent 3,738,8^49 (June 12, 1973), H.E. Belllsassi©Tor to E.I. Du Pont de Nemours and Co. The plating rate measured 0.^
mil/hr (10 ym/hr.). Surface rou^iness began to appear after 3 1/2 hours ofoperation. Hie deposit was dull gray and was analyzed at 95 Ni. Itshardness was 75^ ^^0* ^~P^^^*
This sampling of electroless nickel-borcn is not conprehensive, but It doessuggest that as-plated the hardness is more than nickel-phosphorus depositswith the possible exception of some with 2-4 X/2% phosphorus. After onehour at 400°C, the hardnesses of the two types of electroless nickel do notdiffer significantly. After one hour at 600°C, however, the boron alloyretains a much greater hardness than the phosphorus alloy. Gorbunova et alshow that a plot of hardness vs tenperature of heat treatment has twonaxima, at 300°C and 600°C, with a minimum at 400°C for alloys of 5.7 and6,^% boron. ^.3% boron has one maximum at 300°C.

-16-
Ihlckness Uniformity
Ihe Electroplating Engineering Handbook [5J states: "Electroless plating Is
of uniform thickness on all areas of the solid part, regardless of its shapeor geometry." In the context of electroplating this may be a reasonablestatement, but it is misleading. Just how misleading was the subject ofsome consideration.
The rate of deposition is a function of tenperature and solution composi-tion. A systematic variation in either will usually lead to a correspond-ing variation in thickness. This means that to achieve a uniforro depositthickness, the average solution cojiposition and temperature everywhereover the surface must be kept the same. Since this can be very difficultto achieve, it raises the question of how noninlfonn a deposit is likelyto be. Ihe results of a few experiments made duriJTg the course of thisproject will give a feel of the sort of nonunlformity to expect.
The exterior of a one inch diameter brass tube plated 2 hours withoutagitation, while suspended in a horizontal position well off the bottcmof the container. The plated tube was sectioned near its center andexamined microscopically around the circumference. At the bottom thedeposit thickness was 0.68 mil. at the sides it was 0.75 mil, and at thetop it varied from 0.52 to 0.88 mil. This variation at the top wasassociated with deposit rou^mess presumably caused by settling ofmicroscopical sediment formed in the bath. The lower value of 0.52 rail
probably represents the thickness that would have prevailed if there hadbeen no sediment.
Figure 8 is a ptotomicrograph of a section of one of two brass boltsplated for 2 hours in the EQ?enner bath without agitation and whilesuspended by a wire. The plating rate was about 0.6 miVhr. Theelectroless nickel deposit is the layer between the brass substrate andan overplate of electroplated nickel. The deposit thickness was measuredat the top and bottom of the thread at six different "threads" (12locations). There was a 6% variation between peaks conpared to a 71%variation between valleys. The average peak to valley thickness ratiowas 2.1. Obviously solution replenishment in the valleys was not asgood nor as uniform as at the peaks.
Figure 9 is a section of another bolt plated 2 hours in bath I at aslower rate, about 1/3 that of the bolt In Figure 8, 0.2 mlVhr. Sixvalleys varied fi-om 0.38 to 0.^0 rail. Six peaks varied from 0.^^ to0.50 mil. The ratio of the two averages was 1.2. The lnproved throw-ing power may have been influenced by the bath ccirposition, but it mayalso be due to the slower rate of deposition v*iich pennitted f&stersolution replenishment relative to deposition of nickel.
Figure 10 is of a bolt plated near the faster rate in bath I withagitation frcsn a magnetic stirrer and frc«n solution punped in and outof the tank. The thickness ratio of peak to valley is 1.013, hardlysl@Tifleant. This good throwing power is attributable to appropriateagitation.
-17-
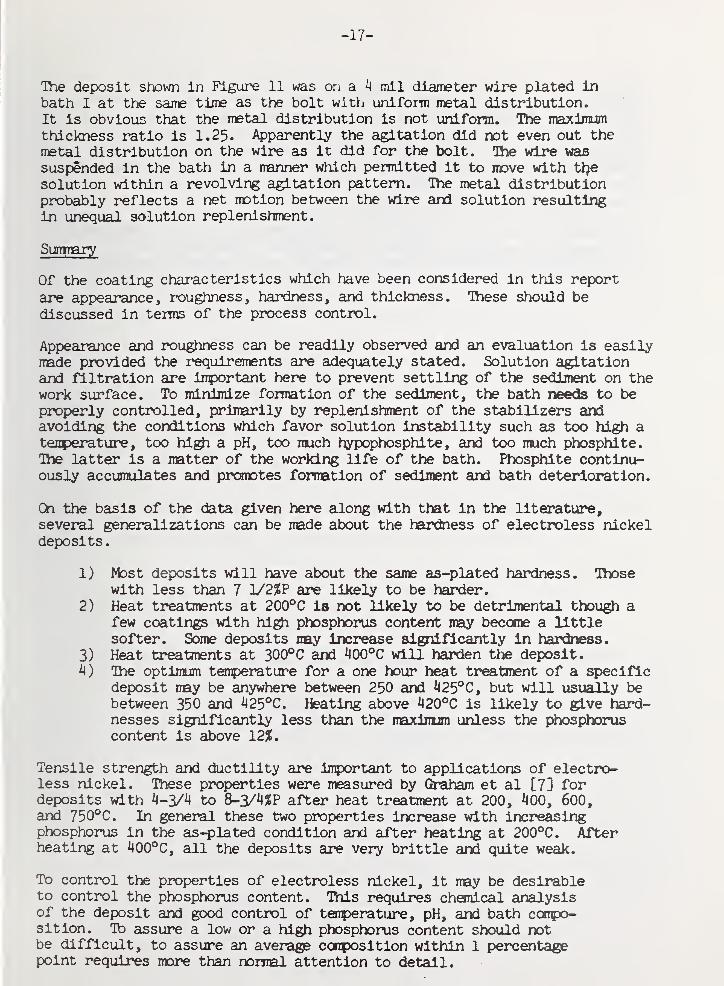
The deposit shown in Figure 11 was on a ^ mil diameter wire plated inbath I at the same time as the bolt with uniform metal distribution.It is obvious that the metal distribution is not uniform. The maximumthickness ratio is 1.25. Apparently the agitation did not even out themetal distribution on the wire as it did for the bolt. The wire wassuspended in the bath in a manner which pemitted it to move with tl7e
solution within a revolving agitation pattern. The metal distributionprobably reflects a net motion between the wire and solution resultingin unequal solution replenishment.
SUTTITBjy
Of the coating characteristics which have been considered in this report
are appearance, roughness, hardness, and thickness. Ihese should be
discussed in terns of the process control.
Appearance and roughness can be readily observed and an evaluation is easilymade provided the requirements are adequately stated. Solution agitationand filtration are inportant here to prevent settling of the sediment on thework surface. To minimize formation of the sediment, the bath needs to beproperly controlled, primarily by replenishment of the stabilizers andavoiding the conditions which favor solution instability such as too high atenperature, too hi^ a pH, too much hypophosphite, and too much phosphite.Tine latter is a matter of the working life of the bath. Phosphite continu-ously accumulates and promotes formation of sediment and bath deterioration.
On the basis of the data given here along with that in the literature,several generalizations can be made about the hardness of electroless nickeldeposits.
1) Most deposits will have about the same as-plated hardness. Ihosewith less than 7 1/2%? are likely to be harder.
2) Heat treatments at 200*^0 is not likely to be detrimental though afew coatings with hi0i phosphorus content may become a littlesofter. Some deposits may Increase significantly in hardness.
3) Heat treatments at 300°C and ^00°C will harden the deposit.
^) Ihe optimum tenperature for a one hour heat treatment of a sp>ecific
deposit may be anywhere between 250 and ^25°C, but will usually bebetween 350 and ^25°C. Heating above ^20°C is likely to give hard-nesses significantly less than the maximum unless the pdiosphoruscontent is above 12%.
Tensile strength and ductility are inportant to applications of electro-less nickel. These properties were measured by Graham et al [7] fordeposits with 4-3/^ to 8-3/^?P after heat treatment at 200, ^00, 600,and 750°C. In general these two properties increase with increasingphosphorus in the as-plated condition and after heating at 200°C. Afterheating at 400°C, all the deposits are very brittle and quite weak.
To control the properties of electroless nickel, it may be desirableto control the phosphorus content. This requires chemical analysisof the deposit and good control of tenperature, pH, and bath conpo-sition. To assure a low or a high phosphorus content should notbe difficult, to assure an average conposition within 1 pjercentagepoint requires more than normal attention to detail.
-18-
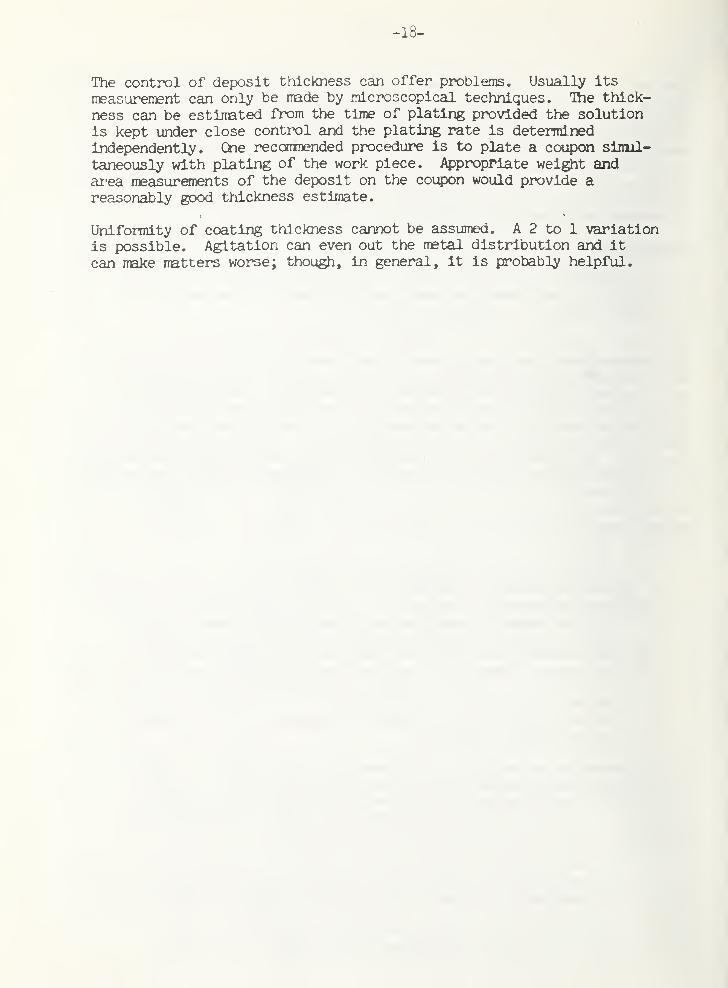
The control of deposit thickness can offer problems. Usually its
meas'areraent can only be made by microscopical techniques. The thick-
ness can be estimated from the time of plating provided the solutionis kept under close control and the plating rate is determinedIndependently. Cne reconmended procedure is to plate a coupon simul-
taneously with plating of the work piece. Appropriate wei^t andarea measuranents of the deposit on the coupon would provide areasonably good thickness estimate.
Uniformity of coating thickness cannot be assumed. A 2 to 1 variationis possible. Agitation can even out the metal distribution and it
can make matters worse; though, in general, it is probably helpful.
/
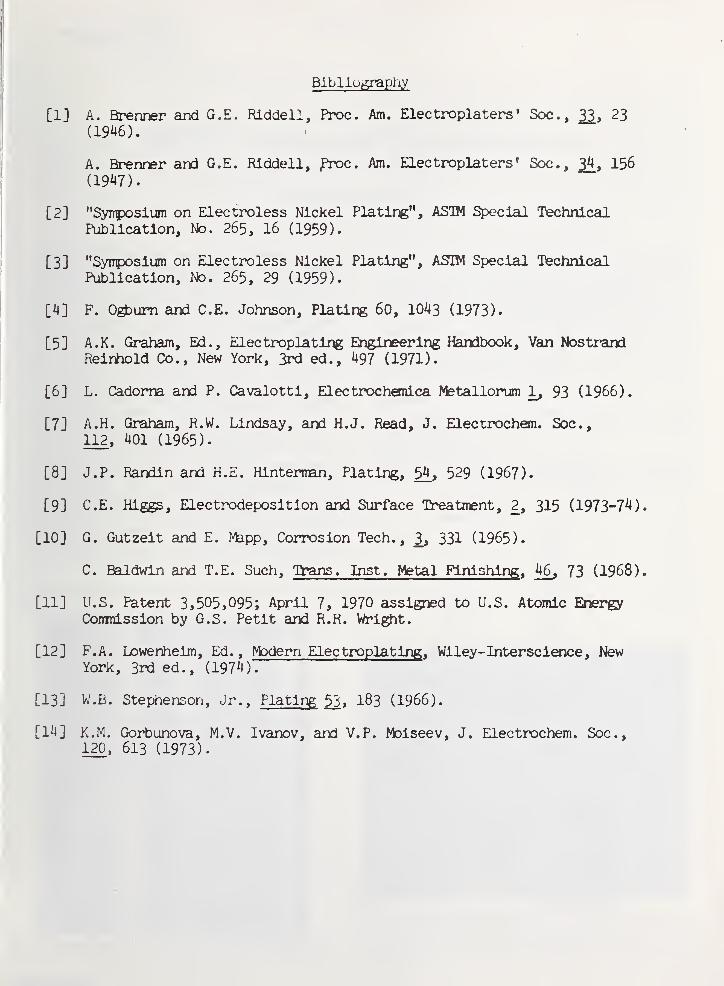
Bibliography
[1] A. Brenner and G.E. Rlddell, Proc. Am. Electroplaters' Soc., 23
(19^6).
A. Brenner and G.E. Rlddell, ^c. Am. Electroplaters' Soc., 156(IW).
[2] "Syirposium on Electroless Nickel Platir«", AS1M Special TechnicalPublication, No. 265, I6 (1959).
[3] "Symposium on Electroless Nickel Plating", ASIM Special TechnicalPublication, No. 265, 29 (1959).
[4] F. Ogbum and C.E. Johnson, PlaUng 60, 10^3 (1973).
[5] A.K. Graham, Ed., Electroplating Engineering Handbook, Van NostrandReir*iold Co., New York, 3rd ed., ^97 (1971).
[6] L. Cadoma and P. Cavalotti, Electrochemica Metallorum 1, 93 (1966).
[7] A.H. Graham, R.W. Lindsay, and H.J. Read, J. Electrochem. Soc.,
112, ^01 (1965).
[8] J. P. Randin and H.E. Hinterman, Plating, 5i, 529 (1967).
[9] C.E. Higgs, Electrodeposition and Surface Treatment, 2, 315 (1973-7^)
[10] G. Gutzeit and E. Mapp, Corrosion Tech., ^ 331 (1965).
C. Baldwin and T.E. Such, Trans. Inst. Metal Finishing , ^ 73 (1968)
[11] U.S. Patent 3,505,095; April 7, 1970 assigned to U.S. Atomic EnergyCorrmission by G.S. Petit and R.R. Wright.
[12] F.A. Lowenheim, Ed. , Modern Electroplating , Wiley-Interscience, NewYork, 3rd ed., (197^).
[13] W.B. Stephenson, Jr., Plating 53. I83 (1966).
[1^] K.M. Gorbunova, M.V. Ivanov, and V.P. Moiseev, J. Electrochem. Soc,120, 613 (1973).


TECHNICAL BRIEFAPPENDIX A
Banded Structure of Electroless Nickel
F. Ogburn and C. E. Johnson*
THE ETCHED CROSS SECTION of an elcctroless nickel
(Ni-P) deposit generally is characterized by narrowor wide striations formed by variations in the degree ofetching. These are usually attributed to variations in the
phosphorus content of the deposit.' The evidence cited,
^
however, is meager and is based on appearance after
treatment at 700°C for 1 hr and on potential variations
during attack by red fuming nitric acid. Some of the heat-
treated deposits show striations caused by variations of
the population of dark particles, which were presumedto be NijP precipitated during the heat treatment. Thereis no reason to doubt this explanation of the striations,
but it would be more satisfying to have more direct
evidence. Such evidence is given here.
Figure 1 is a photomicrograph of the etched cross sec-
tion of an electroless nickel deposit, as plated, of the Ni-Ptype having wide striations. The 150 /im thick depositwas obtained at 96°C from an acid bath containing hy-droxyacetic acid, similar to the original formulation of
Brenner and Riddell.^ The etching solution was 1 partnitric acid and 3 parts acetic acid. The Knoop diamondindentations were used as index marks for the electron
probe analyses. Figure 2 is a photomicrograph of the
same area with an electron probe trace of the phosphorus
'Metallurgy Division, National Bureau of Standards, Washington, D C.20234.
Fig. 1. Photomicrograph of cross section of electroless nickel deposit.
Knoop indentations were mode for indexing purposes.
OCTOBER, 1973
content superimposed. (Note the Knoop diamond in-
dentations visible in Fig. 2.) Each dot in the row across
the center indicates the location of a measurement bythe electron probe. The beam size is actually about 0.5
in diameter and the measured x-rays are emitted froman area two or three times that diameter. The curve madeup of dots on the upper part of the micrograph is a plot
of the phosphorus content. A linear scale for the phos-
phorus content is on the ordinate with the maximumconcentration on the curve at about 8 wt per cent. Zeroper cent level is indicated by the row of dots in the lowerleft corner.
Comparison of the two figures indicates a reasonable
inverse correlation between phosphorus content and the
degree of etching.
More precise measurements were made on either side
of the lower tips of the four indentations. From left to
right, the measurements at each location are as follows:
Wl Per Cent
Location Ni p
1 92.4 6.6
2 92.1 7.1
3 92.8 7.8
4 93.8 7.0
5 93.0 7.6
6 94.1 6.7
7 93.3 7.3
8 93.0 7.5
Fig. 2. Electron probe trace of phosphorus content across cross sec-
tion of electroless nickel deposit. Zero per cent phosphorus is indicated
by white dots in lower left corner. Maximum value is about 8 wt per
cent phosphorus. Row of dots across center indicates position of each
measurement.
1043
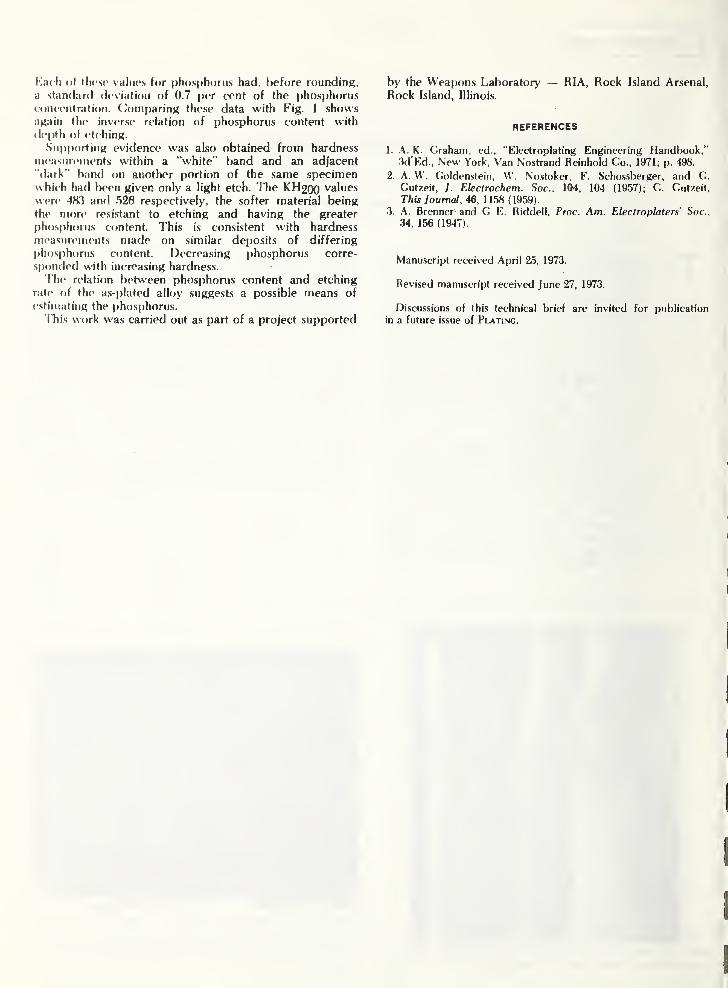
Kach o( flicsc values for |)h<)si)horiis had, before rounding,
a standard deviation of 0.7 per cent of the phosphorusconcentration. (>oinparinK these data with F"ig. 1 showsagain the inverse relation of phosphorus content with
de|)th of etching.
Siipi)orting evidence was also obtained from hardness
ineasiirernents within a "white" band and an adjacent
"dark" band on another portion of the same specimen« hich had been given only a light etch. The KH200 values
were 4H3 anfl 526 respectively, the softer material being
the more resistant to etching and having the greater
phosphorus content. This is consistent with hardnessmeasurements made on similar deposits of differing
phosphorus content. Decreasing phosphorus corre-
sponded with increasing hardness.
The relation between phosphorus content and etching
rate of the a.s-|)lated alloy suggests a possible means of
estimating the phosphorus.This work was carried out as part of a project supported
by the Weapons Laboratory — RIA, Rock Island Arsenal,
Rock Island, Illinois.
REFERENCES
1. A. K. Graham, ed., "Electroplating Engineering Handbook,"3d'Ed., New York, Van Nostrand Reinhold Co., 1971; p. 498.
2. A. V\'. Coldenstein, W. Nosfoker, F. Schossberger, and G.
Gutzeif, ;. Electrochem. Soc, 104, 104 (1957); G. Giitzeit,
This Journal, 46, 1158 (1959).
3. A. Brenner and G. E. Riddell, Proc. Am. Electroplaters Soc,
34,156(1947).
Manuscript received April 25, 1973,
Revised manuscript received June 27, 1973.
Discussions of this technical brief are invited for publication
in a future issue of Plating.

TABLE 1
Operating Conditions for Electroless Nickel Deposits
Deposit lype of pH Tenp. Deposition Deposition Phosphorus PageNo. Solution - °C Time Rate* Content Reference
Hours mil/hr of DepositPer Cent
1 Brenner 6.6-4.2 96 0.65 3»52 ti 4.5-4.2 96 3i53
u 4.5-4.2 96 3,54 It 4.5-4.2 96 0.6 M 3»5
5!l 4.5-4.2 96 0.75-0.51 3,5
6 tl 4.5-4.2 96 3,5
7tl 4.5-4.2 96 11.1 5
8 tt 6.6-4.3 96 6 0.95-0.6313 tl 6.6-4.5 95 5 0.5 M 7.1 4
14 It 4.5-4.2 96 6 0.78-0.45 10.1 515 tt 6 . 6-5 .
0
96 5 0.8 M 7.116 tt 6.6-5.5 98 6 4.5 3
18 tt 6.6-4.2 4-1/2 0.6 M 9.4
19 tt 6.6-4.5 96 5-1/2 0.5 M 8.7 5,720 tt 6.6-4.4 50 71 0.03 M 12.
5
4,721 tt 6.6-4.3 70 21 0.1 M 11.1 4,722 tt 6.6-4.4 60 44 0.06 M 11.9 4,723 tl 6.6-4.3 80 9-1/2 0.2 M 10. 0 4,724 tt 5.6_4.5 96 7-1/2 0.5 M 9.4 3
27 tt 6.6 96 4
29 Bath II 6.0 90 9.6 3
34 Bath I 4.6 85 7 0.54 6.8 3tl 4 6 85 6 0.52 3
36 II 4.6 85 g 0.54 7.2 3
37 tt 5.2 87 2 0.78 3
38 Brenner 4.5 95 6 0.36 9.7 3
39II 4.0 95 9 0.22 11.4 3
40 tt 6.6-3.8 50 136 0.022 12.241 tt 4.6 86 5 0.54 342 Bath I 4.7' 86 4-1/2 0.57 7.4 3,643 tt 4.7 86 4 0.55 8.2 3,644 tt 4.6 86 5 0.54 8.0 3,645 tt 4.7 86 5-1/2 0.57 9.6 3,646 tt 4.8 86 3-1/4 0.65 3
47 tt 4.5 86 . 5 0.50 348 It 4.5 85 5 0.47 3
49 It 4.5 86 5 0.39 10.3 .3
50 tt 4.8 86 5 0.43 10.0 3
52 It 4.7 86 9 0.54-0.29 3,653
It 4.7 86 12-1/4 0.28 7.0 3,654 tt 4.7 86 12 0.27 7.2 3,655
It 4.7 86 5-V3 0.56 8.7 3,656 It 4.7 86 5 0.60 10.1 3,6

TABLE 1 (Con't.)
lype ofSolution
PH Temp. Deposition°C Time
Hours
DepositionRate*
mll/hr
PhosphorusContent
of DepositPer Cent
PageReference
PiTTJ L QD h 1 ? 8 0
58 II 5.8 90 4 0.37 3TT 6 1 QO J 0 9fi n 2 1
60 II 5.8 90 0.55 12.661 II 5.8 90 0.3362 Sulfamate 6.7-3.5 95 5 0.48 8.4
63 tt 5-3.5 95 5-1/4 0.4564 II 6-3.9 95 6 0.4865 If 4-3.7 95 6 0.3266 II 6.7-4.2 94 6 0.4
71 Bath IIIAlkaline
5.8 ^. 90 0.54 12.1
80 Sulfamate 9.5 •
.•- 75 0.5 6.5 7
81 II
9.5 80 0.5 5.5 7
82 II
Brenner9.5 90 0.67 5.2 7
86 ModifiedBrenner
6.0-6.6 95 0.25 2.8
88 Modified 6.0 95 5 0.2 3.7
* - Micrometer measurements are Indicated by an M. Other thickness valueswere determined from weight and area measurements.
\

TABLE 2
Hardnesses of Nl-P AlloysAs-Plated and After Heat Treatment
Deposit Phosphorus - As-Plated 8 hr. 1/2 hr. 1 hr. TypeNo. % HK^ 200°C 400°C ^00°C of
HK^QQ HK^OO ^100
60 12.6 524 520 - 855 II
57 12.6 518 523 - .845 II20 12.5 536 508 961 - Brenner40 12.2 548 515 936 - Brenner71 12.1 509 521 840 766 III22 11.9 561 491 957 - Brenner21 11.1 525 515 916 - Brenner
7 11.1 554 560 883 - Brenner49 10.3 539 616 950 - I
14 10.1 566 557 944 - Brenner56 10.1 544 639 948 - I
23 10.0 512 491 957 - Brenner50 10.0 532 602 935 - I
29 9.6 541 737 969 - II45 9.6 547 709 1001 - I18 9.4 547 - 936 - Brenner24 9.4 556 608 905 - Brenner19 8.7 584 628 890 893 Brenner55 8.7 549 - - - I
62 8.4 480 - - - Sulfamate43 8.2 540 702 934 - I44 8.0 546 717 953 I42 7.4 551 731 969 I
36 7.2 539 767 940 I54 7.2 576 735 847 I
13 7.1 602 720 921 Brenner15 7.1 592 Brenner53 7.0 569 762 858 134 6.8 611 736 852 I80 6.5 679 Alkaline
81Sulfamate
5.5 660 Alkaline
82Sulfamate
5.2 624 Alkaline
16Sulfamate
4.5 732 811 911 923 Brenner88 3.7 660 8261 829 Modified
86Brenner
2.8 692 835 , 812 ModifiedBrenner
48 hrs. at 200°C.

•
. TABLE 3
Effect of Duration of Heat Treatment at 100°C on Hardness (HK^qq)
Deposit Phosphorus As-Plated 4 hours 12 hours 1 day 2 days 3 days 9 days TypeNo. of
Bath
16 4.5 732 732 111 782 783 783 785 Brenner34
' ....
611 610 602 1
13 7.1 602 623 631 671 Brenner15 7.1 592 651 667 Brenner14 10.1 566 563 565 Brenner
7 11.1 554 558 572 566 Brenner20 12.5 i; 536 542 580 Brenner

oo
wCO
oooooC\J
-p
-p
-p
Cmo
o•H-Pct3
CmOCD -P
to
>3
CM
>3
CM
CO
o
O
o-pcdHI
CO
Qa
-p•HCO •
a
cu•HCm
0) OJ
cu cu cu cu
CQ
0 CU
CQ PQ
inVD^ ^ OO CTA rH MD
CO cot^t— Lo Lr\ Lr\ LPv Lr\
ooo
CT\
oo
oo
ooenoo
LPvmoo
o on
t- rHo m
O CY^
CO >-
^ rH C\J CM
LPv LO LH LO LPV
O H MD LO CM^ ^ CM CM CMin in LO Lnin
o CM cJ^ CV-) i>-CY-) on CM CM CMLTMn LPv Lr\ in
HCY-)MfMrMCMCMrHCM00 [>_[>^v£) LnLnLnLnin
LTvCO LTi -=3- t>- O ^ iHH-^ ICMCMHrHCMCMcot— \o ir\ Lr\ Lr\ ir\ Lr\
r-woocor-its^oocncorHCV^CMCMCMiHOCMCMCO i>-i>-vo LPiLnLP\Lr\Ln
I I I
CMI rH
LPi
LPv t-I C^ rHLO LA
LPi rH ^CM rH COCO CO
Cm CO
Oh COP o o o\co
O oo
cSCmw
T3
O CO Li^ CJMi^ rHO ^- rH CO I^MD
CO rH CTN O Ol COCT\CU rH O H Hun LP\ in Lnin LPv
CM CM rH CM ^ CTN CO VO CO ^CTN OOrHOOOO-=rOOrHCVj\jo ir—vo vD LPv LfMXMn in Lr\
LncOrHf-rHCMLTWOMOCM ^VOD—COCMCMCMCMCM
r-\ r-i H <-{ r-^
VJ^^cv^c^^rHoo^~oCO iH OOrH H OJ Lf^V£>

;.
•
..TABLE 5
Effect of Duration of Heat Treatment at 400°C on HarcSness (HK,„„)
3positNo,
Phosphorus
%
As-Plated 1/4 hr. 1/2 hr. 1 hr. 2 hrs. 20 hrs. Typeof
Bath
86 2.8 692 821 812 773 ModifiedBrenner
16 . 4.5 732 811; 911 923 951 977 Brenner
34 6.8 611 .782' 852 915 957 967 I
13- 7.1 - 602 921 916 Brenner19 • 8.7 584 863 890 893 913 Brenner71 '. 12.1
. 509 845 827 890 766 III20 ..•12.5 536 959 961 953 961 960 Brenner57 12.6 568 874 837 845 834 II60 12.6 524 •862 835 855 831 II
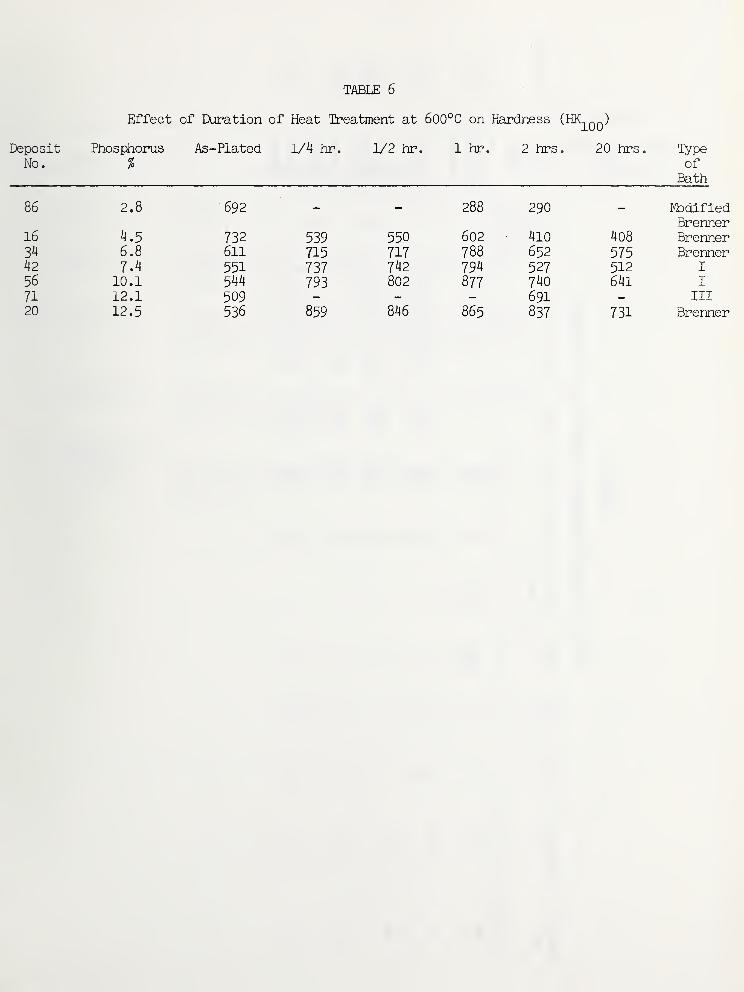
TABLE 6
Effect of Duration of Heat Treatment at 600°C on Hardness (HK,„„)
Deposit Phosphorus As-Plated 1/4 hr. 1/2 hr. 1 hr. 2 hrs. 20 hrs. lypeNo . ^ of
Bath
86 2.8 "692 - - 288 290 - ModifiedBrenner
16 4.5 732 539 550 602 4lO 408 Brenner34 6.8 611 715 717 788 652 575 Brenner42 7.4 551 737 742 794 527 512 I
56 10.1 544 793 802 877 740 64l 1
71 12.1 509 - - 691 - III
20 12.5 536 859 846 865 837 731 Brenner
730)PcdHCuI
a<M -P
OJ (u -p S
oooo
O0oo
o in
§ o-p 0
LPvC\J
(U ^WEH
ooo
ooLA
-P
o w
LOi Oon ^oCM
o •
ooocn
O 4Jo cdoCM ra
oo ^O CM
Q
CO
p•HCO •
CM
rH OCM
COCX5 I
CM
I I
I I
CMrHCO
HOO
CO C7^^ CMCO CO
H OOm oCO cn
LPvOOCO
I I
CO
CM
OO
CMon
H VO CMrH on o
CU (U (U 0)
rH OCM
o o
COCM O
on on
on i>-CMa^ o^
vo t—CO onCO o^
H oCM
CO LPvCO t>-
MD OOCM onCTvOO
o c—
O OO
rH VD
in onCX) ^
I I
rHOO
CMI CO1^
OO
on
1
on rH^ CMCO
CO LTv
i H
CO oLr\ C7^l>--CO
I I
onI CM
on I
in
u
(D CD CU
H O H oCM CM
LPl rHvo onOO ir-
on Ho o
^ o^ MDC7N CTN
on O
o oCO
I I
rH I CM
CMI ^
in
CMrH
OCM

I'ABLE 8
Specimens Prepared for Bearre High-Speed Rotor Method of Measuring Adhesion
Substratel^bterial
1. 1018 Steel^1^0 "
2. 1018 Steel^140 "
3. 1018 Steel4141 "
A1(N03)3-HCl pickle
Lactic acid-peroxidesolution
Preplate I'reatment
pumice scrub, rinse, A1(N0_^)^-HC1 pickle,rinse.
pumice scrub, rinse, 1 minute in 50% HpSO^
at 65°C, rinse, 2 minutes in lactic acid-peroxide solution at room temperature, rinse.
pumice scrub, rinse, 4 minutes in Al(NO--)^-HCl
pickle at 42°C, rinse, 2 minutes in lactic acid-peroxide solution at room tenperature , rinse.
4 minutes in solution of 400 g/1 Al(NO^)^ and
Electroless NickelBath
400 ml/1 cone. HCl.3^3
15% lactic acid and 80 ml/1 of 30% hiydrogen
peroxide
.
TABii:: 9
Adhesion after various pretreatments.
Pretreatment AdhesionAs-plated After 1 hr. at 400°C
1. As received. VP p
2. Pumice scrub, rinse. P F
3. Pumice scrub, rinse, ^ minutes In A1(N03)3-HC1pickle, rinse. VP F
4. Pumice scrub, rinse, ^ minutes In A1(N03)3-HC1pickle at ^2°C, rinse, lactic acid-peroxidesolution rinse. F G
5. Pumice scrub, rinse, H minutes in A1(^D3)3-HC1pickle at room temperature, rinse, lactic acid-peroxide solution, rinse. F G
6. A1(N03)3-HC1 pickle, rinse, lactic acid-peroxidesolution, rinse. F G
7. 1 minute in 50% Hz^i^ at 65°C, rinse, lacticacid-peroxide solution, rinse. P G
8. 5 minutes in 100 g/1 sodium J-iypxDphosphite at90°C, rinse. VP F
9. 3 minutes in A1(N03)3-HC1 pickle, rinse, 5
minutes in 100 g/1 sodium Iiypophosphite at90°C, rinse. P F
10. 1 minute in 40^ H29di, at 65°C, rinse, 30 secondsin 1% HzSOi^ + 0.1^ HCl at room tenperature, rinse. F P
11. 1 minute in W H2SO4 at 65°C, rinse, 1 minutein 50% HNO3 at room temperature, rinse, 30 secondsin 1% H2S04 + 0.1^ Hd at room tenperature, rinse. P G
' A1(N03)3-HC1 pickle: 4 minutes In solution of 400 g/1 A1(N03)3 and 400 m/1con. HCl at 42°C.
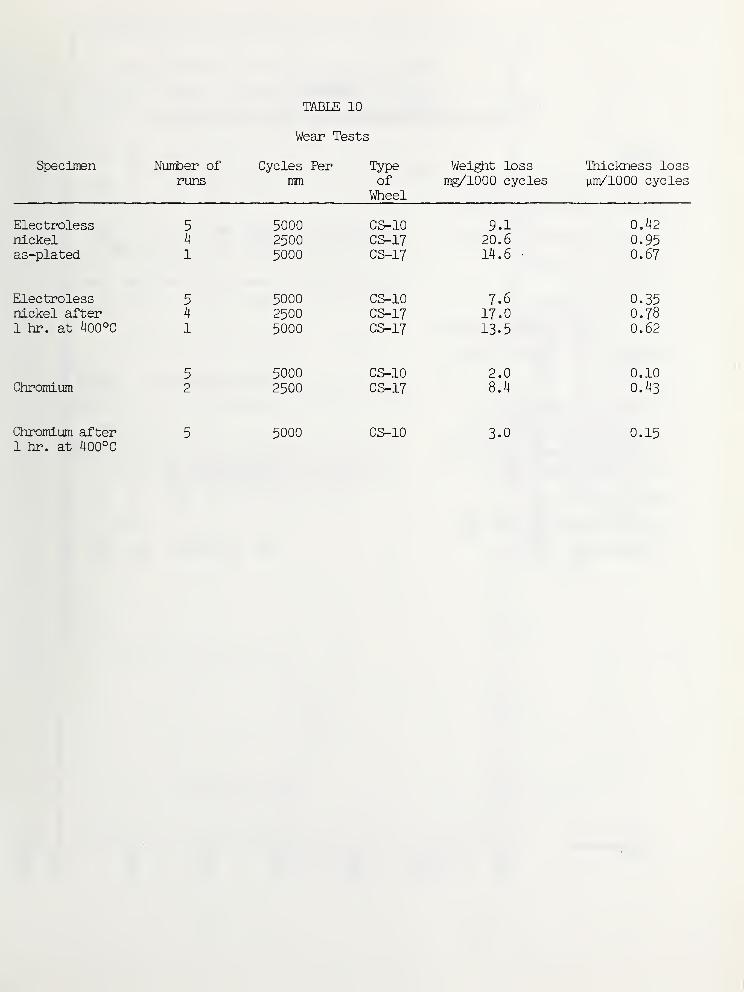
TABLE 10
Wear Tests
Specimen Number ofruns
Cycles Permm
Typeof
Wheel
Weight lossmg/1000 cycles
Thickness lossym/lOOO cycles
Electrolessnickelas-plated
500025005000
CS-10CS-17CS-17
9.120.614.6
0.420.950.67
Electrolessnickel after1 hr. at 400°C
500025005000
CS-10CS-17CS-17
7.617.013.5
0.350.780.62
Chromium50002500
CS-10CS-17
2.08.4
0.100.43
Chromium after1 hr. at 400°C
5000 CS-10 3.0 0.15

TABI£ 11
. Composition of Electroless
BATH:
Nickel Chloride {6H^0) ^1Nickel Sulfate (SH^O) g/1
Ethylenedlamine (92%) ml/1
Glycollc Acid g/1
Citric Acid
Sodium Hydroxide g/1
Cone. Hydrochloric Acid ml/1
Amnonium Hydroxide to pH:
pH
Sodium Borohydride g/1
Dimethylajnine Borane g/1
Sodium Cyanoborohydride g/1
lhallium Nitrate mg/1
Lead Acetate mg/1
Mercaptobenzothiozole mg/l
Temperature °C
Nickel-Boron Baths
1 2 3 i 5
30 30 30 - 30
- - - 20 -
65 65 - - 65
- 11.7 -
- - - 10 -
i^O ^0 - - 40
- 25 -
13-14 13-14 5-6 - 13-14
1.0 1.0 - - 0.5
1.0 2,75 -
- - - - 0.15
7.0 100 -
- - 20 - -
1.0 -
80 80-95 65 70 90
USCOMM-NBS-OC
Q.
CO
.— 2:
22O
tCO
go
lO
c3 Cm
CM

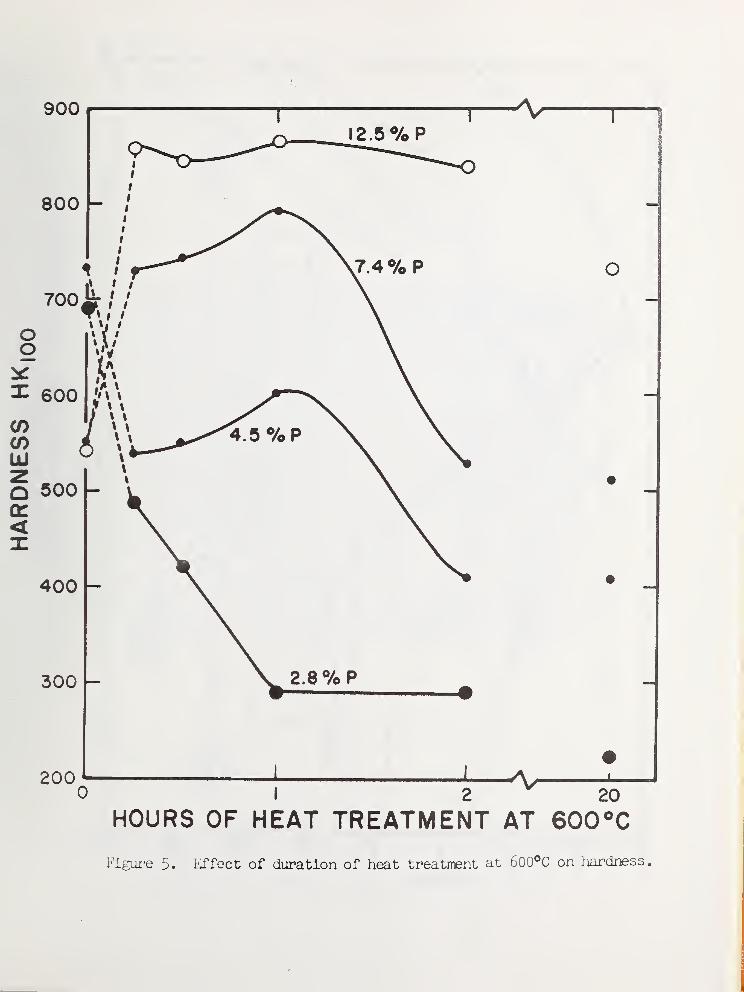
Flg^-e 5. Effect of duration of heat treatment at GOO°C on hardness

001 >,H


Figure 8 - Photomicrograph of cross section of brass bolt plated with
electroless nickel in Brenner bath without agitation at
0.6 mil/hr. Overplated with nickel. 90X
Peak to valley thickness ratio is 2.

Figure. 9 - Photomicrograph of cross section of brass bolt plated withelectroless nickel in Bath A without agitation at 0.2 mil/hr.
Overplated with nickel. 90XPeak to valley thickness ratio is 1.2.
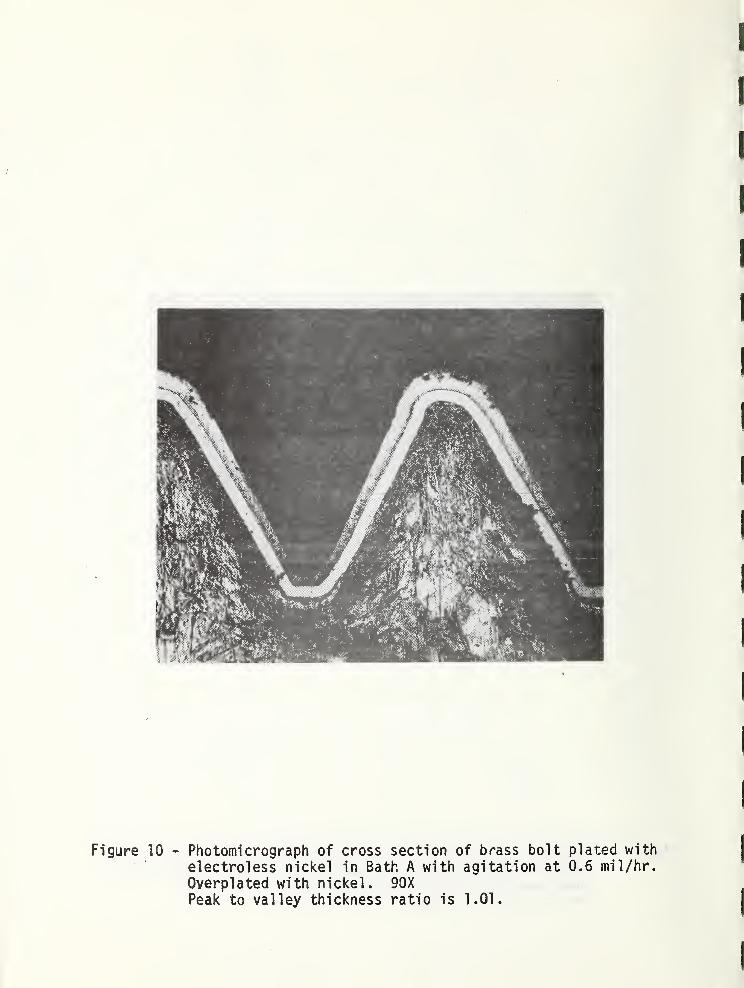
Figure 10 - Photomicrograph of cross section of brass bolt plated with
electroless nickel in Bath A with agitation at 0.6 mil/hr.
Overplated with nickel. 90X
Peak to valley thickness ratio is 1.01.

Figure 11 - Photomicrograph of cross section of 4 mil copper wire platedwith electroless nickel in Bath A with agitation at 0.6 mil/hr.Overplated with nickel. 470XMaximum thickness ratio is 1.25.
NBS-114A (REV. 7-73)
U.S. DEPT. OF COMM.BIBLIOGRAPHIC DATA
SHEET
1. PUBLICATION OR REPORT NO.
NBSIR 75-720
2. Gov't AccessionNo.
3. Recipient's Accession No.
4. TITLE AND SUBTITLE
Effects of Electroless Nickel Process Variables onQuality Requirements
5. Publication Date
December 1974
6. Performing Organization Code
7. AUTHOR(S)
Fieldinp; Ogburn and Christian E. Johnson8. Performing Organ. Report No.
9. PERFORMING ORGANIZATION NAME AND ADDRESS
NATIONAL BUREAU OF STANDARDSDEPARTMENT OF COMMERCEWASHINGTON, D.C. 20234
10. Proiect/Task/Work Unit No.
.3120^6711. Contract/Grant No.
12. Sponsoring Organization Name and Complete Address (Street, City, State, ZIP)
Research DirectorateThomas J. Rodman LaboratoryRock Island ArsenalRock Island, Illinois 60201
13. Type of Report & PeriodCovered
FINAL REPORT14. Sponsoring Agency Code
15. SUPPLEMENTARY NOTES
16. ABSTRACT (A 200-word or less {actual summary of most si^ilicant intormation. It document includes a significant
bibliography or literature survey, mention it here.)
Deposition rate, phosphorus content, hardness, appearance, and metaldistribution are reported for deposits from several hypophosphite typeelectroless nickel baths, both proprietary and non-proprietary. The bathswere operated under a variety of conditions with variations of composition.Extensive data is given on the relation of deposit hardness to phosphoruscontent and to heat treatment at 100, 200, and 400°C. Some data is givenrelative to electroless Ni-B, Ni-P-Cu, and Ni-P-Mn alloys.
17. KEY WORDS (six to twelve entries; alphabetical order; capitalize only the first letter of the first key word unless a proper
name; separated by semicolons) Autocatalytic nickel ; oloctroless nlckol ; electroless nickelcomposition; electroless nickel hardness; electroless nickel properties; electralessplating; hardness of electroless nickel; and nickel-phosphorus alloy.
18. AVAILABILITY [^Unlimited 19. SECURITY CLASS(THIS REPORT)
21. NO. OF PAGES
1 1For Official Distribution. Do Not Release to NTIS
UNCL ASSIFIED47
1 1Order From Sup. of Doc, U.S. Government Printing OfficeWashington. D.C. 20402. SD Cat. No. C13
20. SECURITY CLASS(THIS PAGE)
22. Price
\X.!Order From National Technical Information Service (NTIS)Springfield, Virginia 22151 UNCLASSIFIED $3.75
USCOMM-DC 29042-P74