Effects of Dispersants on Oil-SPM Aggregation and Fate … · Effects of Dispersants on Oil-SPM...
57
Effects of Dispersants on Oil-SPM Aggregation and Fate in US Coastal Waters A Final Report Submitted to The Coastal Response Research Center Submitted by Dr. Ali Khelifa Dr. Merv Fingas Dr. Carl Brown Emergencies Science and Technology Division Environmental Technology Centre Science and Technology Branch Environment Canada 335 River Road Ottawa, Ontario, K1A 0H3, Canada Project Period, 2006-2007 March 28, 2008 Revised July 17, 2008 This project was funded by a grant from NOAA/UNH Coastal Response Research Center. NOAA Grant Number: NA04NOS4190063. Project Number: 06-090
Transcript of Effects of Dispersants on Oil-SPM Aggregation and Fate … · Effects of Dispersants on Oil-SPM...

Effects of Dispersants on Oil-SPM Aggregation and Fate in US Coastal Waters
A Final Report Submitted to
The Coastal Response Research Center
Submitted by
Dr. Ali Khelifa Dr. Merv Fingas Dr. Carl Brown
Emergencies Science and Technology Division Environmental Technology Centre
Science and Technology Branch Environment Canada
335 River Road Ottawa, Ontario, K1A 0H3, Canada
Project Period, 2006-2007
March 28, 2008
Revised July 17, 2008
This project was funded by a grant from NOAA/UNH Coastal Response Research Center. NOAA Grant Number: NA04NOS4190063. Project Number: 06-090
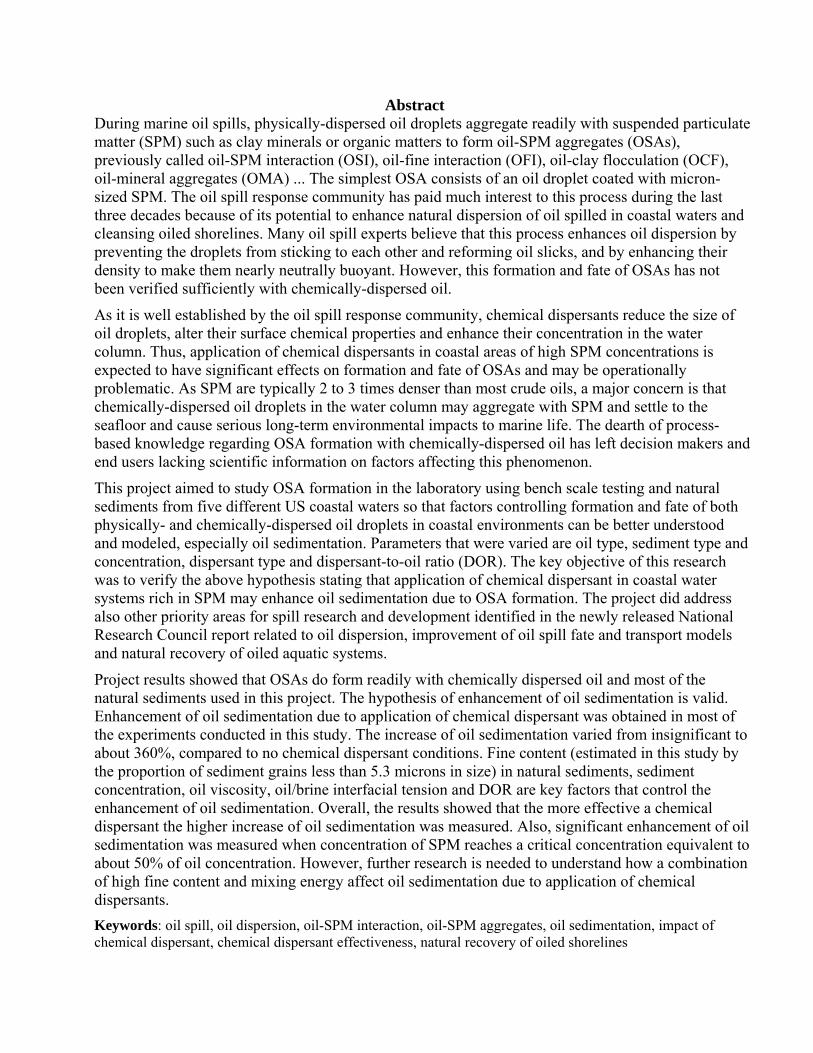
Abstract During marine oil spills, physically-dispersed oil droplets aggregate readily with suspended particulate matter (SPM) such as clay minerals or organic matters to form oil-SPM aggregates (OSAs), previously called oil-SPM interaction (OSI), oil-fine interaction (OFI), oil-clay flocculation (OCF), oil-mineral aggregates (OMA) ... The simplest OSA consists of an oil droplet coated with micron-sized SPM. The oil spill response community has paid much interest to this process during the last three decades because of its potential to enhance natural dispersion of oil spilled in coastal waters and cleansing oiled shorelines. Many oil spill experts believe that this process enhances oil dispersion by preventing the droplets from sticking to each other and reforming oil slicks, and by enhancing their density to make them nearly neutrally buoyant. However, this formation and fate of OSAs has not been verified sufficiently with chemically-dispersed oil.
As it is well established by the oil spill response community, chemical dispersants reduce the size of oil droplets, alter their surface chemical properties and enhance their concentration in the water column. Thus, application of chemical dispersants in coastal areas of high SPM concentrations is expected to have significant effects on formation and fate of OSAs and may be operationally problematic. As SPM are typically 2 to 3 times denser than most crude oils, a major concern is that chemically-dispersed oil droplets in the water column may aggregate with SPM and settle to the seafloor and cause serious long-term environmental impacts to marine life. The dearth of process-based knowledge regarding OSA formation with chemically-dispersed oil has left decision makers and end users lacking scientific information on factors affecting this phenomenon.
This project aimed to study OSA formation in the laboratory using bench scale testing and natural sediments from five different US coastal waters so that factors controlling formation and fate of both physically- and chemically-dispersed oil droplets in coastal environments can be better understood and modeled, especially oil sedimentation. Parameters that were varied are oil type, sediment type and concentration, dispersant type and dispersant-to-oil ratio (DOR). The key objective of this research was to verify the above hypothesis stating that application of chemical dispersant in coastal water systems rich in SPM may enhance oil sedimentation due to OSA formation. The project did address also other priority areas for spill research and development identified in the newly released National Research Council report related to oil dispersion, improvement of oil spill fate and transport models and natural recovery of oiled aquatic systems.
Project results showed that OSAs do form readily with chemically dispersed oil and most of the natural sediments used in this project. The hypothesis of enhancement of oil sedimentation is valid. Enhancement of oil sedimentation due to application of chemical dispersant was obtained in most of the experiments conducted in this study. The increase of oil sedimentation varied from insignificant to about 360%, compared to no chemical dispersant conditions. Fine content (estimated in this study by the proportion of sediment grains less than 5.3 microns in size) in natural sediments, sediment concentration, oil viscosity, oil/brine interfacial tension and DOR are key factors that control the enhancement of oil sedimentation. Overall, the results showed that the more effective a chemical dispersant the higher increase of oil sedimentation was measured. Also, significant enhancement of oil sedimentation was measured when concentration of SPM reaches a critical concentration equivalent to about 50% of oil concentration. However, further research is needed to understand how a combination of high fine content and mixing energy affect oil sedimentation due to application of chemical dispersants. Keywords: oil spill, oil dispersion, oil-SPM interaction, oil-SPM aggregates, oil sedimentation, impact of chemical dispersant, chemical dispersant effectiveness, natural recovery of oiled shorelines
Acknowledgements Funding for this project was provided by the NOAA/UNH Coastal Response Research Center (Grant number NA04NOS4190063).
We would like to thank Dr. James R. Payne (PEC, Encinitas, CA), Dr. Deborah French McCay (ASA, Narragansett, RI) and Mr. William Driskell (MBCC, Seattle, WA) from whom we received valuable inputs during the preparation of the proposal. We especially would like to thank Dr. Gary Shigenaka (NOAA, Seattle, WA), Dr. Amy Merten (NOAA, Seattle, WA), Mr. Bennett Anderson (Delaware Dept. of Nat. Res. & Env. Control, Delaware, DL) and Ms. Susan Saupe (Cook Inlet RCAC, AL) for their good support for sampling natural sediments used in this study. Many thanks for Mr. Timothy Milligan (BIO/DFO, Dartmouth, NS) for his kind help to performing size distributions of the sediment samples. We would like to thank Mr. Ron Hartree (University of Ottawa, Ottawa, ON) for his kind support to performing mineralogy and elemental analyses for all the sediment types used in this project. Dr. Zhendi Wang (ESTD/ESTC/EC, Ottawa, ON) was the scientific authority for all the chemical analyses conducted in this project. We thank him very much for his huge contribution in this project. We would like to thank Dr. Chun Yang (ESTD/ESTC/EC, Ottawa, ON) and Mr. Mike Landriault (ESTD/ESTC/EC, Ottawa, ON) for their continuous support with Gas Chromatography analysis. Special thank goes to Mr. Ben Fieldhouse who made significant contribution in the development of the analytical method used for oil extraction from OSAs and in the development of the sediment filtration protocol. He ran most of the experiments and made valuable suggestions that helped conducting the project efficiently. Special thank goes also to Dr. Bruce Hollebone (ESTD/ESTC/EC, Ottawa, ON) for his valuable help to measuring oil properties. Many thanks for Mr. Lloyd Gamble for his valuable support on literature search conducted for this project. We benefited also from kind supports from Mr. Dave Roy (ESTD/ESTC/EC, Ottawa, ON) and Ms Debi Gribbon (ESTD/ESTC/EC, Ottawa, ON) to dealing with inevitable administrative issues all along the realization of the project. Finally, achievement of this project was made possible with the tremendous help of undergraduate students Dominc Pjontek (University of Ottawa, Ottawa, ON), Jonathan Eubank (University of Waterloo, Waterloo, ON) and Michelle Chun (University of Waterloo, Waterloo, ON). We thank them very much for their quick learning and their determination to learn and help in the same time.
Finally, we would like to remind the reader that this work is ours and we are responsible for any mistakes, mis-interpretations or confusions that may contain.

Table of Contents 1.0 Introduction ....................................................................................................................................9 1.0 Introduction ....................................................................................................................................9
1.1 Scope of the problem..................................................................................................................9 1.2 State-of-Knowledge .................................................................................................................10 1.3 Justification for the research ....................................................................................................12 1.4 National significance of the project .........................................................................................12 1.5 Areas of oil spill research and development addressed by the project.....................................13
2.0 Objectives.....................................................................................................................................14 3.0 Methods........................................................................................................................................14
3.1 Natural sediment characterisation ............................................................................................14 3.1.1 Sampling............................................................................................................................14 3.1.2 Treatment and conservation ..............................................................................................14 3.1.3 Elemental and mineralogy analyses ..................................................................................15 3.1.4 Grain size distribution and density....................................................................................15 3.1.5 Organic matter content ......................................................................................................16 3.1.6 Chemical analysis..............................................................................................................16
3.2 Oil characterisation ..................................................................................................................17 3.3 Chemical dispersant .................................................................................................................17
3.3.1 Effects of chemical dispersant on oil properties and dispersion .......................................17 3.3.2 Effects of chemical dispersants on oil-SPM interaction ...................................................17
3.4 Oil-SPM interaction and OSA formation.................................................................................18 3.5 Mixing energy characterisation................................................................................................18
4.0 Results .........................................................................................................................................19 4.1 Effects of chemical dispersant on oil dispersion......................................................................19
4.1.1 Effects of chemical dispersant on oil properties ...............................................................19 4.1.2 Effects of chemical dispersant on oil droplet formation ...................................................20
4.2 Effects of sediment and oil types on oil sedimentation............................................................24 4.2.1 Results from UV-epi fluorescence microscopy ................................................................24 4.2.2 Results obtained without chemical dispersant ..................................................................24 4.2.3 Results obtained with chemical dispersant........................................................................30
4.3 Effects of chemical dispersants on oil sedimentation ..............................................................31 4.3.1 Results obtained with DOR=1:10 .....................................................................................31 4.3.2 Results obtained with various DOR..................................................................................36
4.4 Physical properties of OSAs ....................................................................................................39 4.4.1 OSA’s size distribution .....................................................................................................39 4.4.2 OSA’s settling velocity .....................................................................................................39 4.4.3 OSA’s density ...................................................................................................................41
5.0 Discussion and Importance to Oil Spill Response .......................................................................45 5.1 Oil Dispersion ..........................................................................................................................46 5.2 Oil-SPM Interaction .................................................................................................................46 5.3 Oil Sedimentation.....................................................................................................................47 5.4 Application of Chemical Dispersant in Coastal Waters...........................................................47 5.5 Oil Spill Modelling...................................................................................................................50 5.6 Natural Recovery of Oiled Shorelines .....................................................................................51
6.0 Technology Transfer ....................................................................................................................51

7.0 Achievement and Dissemination..................................................................................................52 8.0 References ....................................................................................................................................53

List of Figures Figure 1: Photomicrographs of OSAs obtained with Heidrun oil and chalk using epi-fluorescence (left) and transmitted light (right). Oil droplets are transparent particles (left) surrounded by dark sediment flocs (right). From Khelifa et al. (2005c). ............................................9 Figure 2: Schematic description of the problem related to effects of chemical dispersant on formation and fate of OSAs in SPM-rich water systems. ..................................................................10 Figure 3: Example showing variations of OSA formation with the sediment-concentration-to- oil-concentration ratio. OSA formation is expressed here by the percentage of initial oil stabilized by OSAs. The solid line represents experimental results obtained by Guyomarch et al. (1999) and the red and blue symbols are results from numerical simulations using MCOSA model (Khelifa et al., 2003a, 2004a, 2005b) for size ratios (size of sediment grains/size of oil droplets) of 0.1 and 0.4, respectively. One notes the rapid increase of OSA formation when the concentration ratio increases between about 0.3 and 1. ...............................................................13 Figure 4. Measured vertical profiles of turbulent kinetic energy. ..................................................18 Figure 5. Vertical profiles of kinetic energy dissipation rate estimated from the data on fig 4. .........................................................................................................................................19 Figure 6. Measured water splash heights generated by the reciprocating shaker...........................19 Figure 7. Measured variations of oil viscosity with dispersant to oil ratio.....................................21 Figure 8: Photomicrographs of oil droplets measured after 90 minutes while shaking using UV epi-fluorescence microscopy, Alaska North Slope crude and Corexit 9500 at various DOR: no dispersant (a), 1:10 (b), 1:20 (c), 1:40 (d), 1:100 (e), 1:200 (f). .........................................21 Figure 9: Water samples from different reaction chambers after overnight settling period. The ratios shown on this figure represent DOR values. The experiment was conducted with Alaska North Slope crude, Corexit 9500 and a shaking period of 90 minutes. Clear water samples showed that most of the dispersed oil initially dispersed in the water column has resurfaced in the reaction chamber during the settling period. ..........................................................22 Figure 10: Measured droplet size distributions using UV epi-fluorescence microscopy, Alaska North Slope crude and Corexit 9500 at various DOR after 90 minutes shaking (a), 90 minutes settling (b), and overnight settling (c). .................................................................................23 Figure 11. Measured variations of median droplet size with dispersant to oil ratio (DOR).............24 Figure 12. Photomicrographs of sinking OSAs formed with Alaska North Slope oil and SRM-1941B sediment at 200 mg/L without chemical dispersant (a), with Corexit 9500 at 1:10 ratio (b) and with Corexit 9527 at 1:10 ratio (c). The scales in the pictures are identical. ................25 Figure 13. Measured oil sedimentation (TPH in sinking OSAs) from experiments using the Unalaska sediment and the three crude oils. Normalized by the mass of oil used in the experiment (a) and by the mass of sediment forming sinking OSAs (b). ..........................................25 Figure 14. Measured oil sedimentation (TPH in sinking OSAs) from experiments using the four sediments, the Arabian Medium crude oil and the two chemical dispersants. Normalized by the mass of oil used in the experiment (a,c,e) and by the mass of sediment forming OSAs (b,d,f). .........................................................................................................................................27 Figure 15. Measured oil sedimentation (TPH in sinking OSAs) from experiments using the four sediments, the Alaska North Slope crude oil and the two chemical dispersants. Normalized by the mass of oil used in the experiment (a,c,e) and by the mass of sediment forming OSAs (b,d,f). ........................................................................................................................28 Figure 16. Measured oil sedimentation (TPH in sinking OSAs) from experiments using the four sediments, the South Louisiana crude oil and the two chemical dispersants. Normalized

by the mass of oil used in the experiment (a,c,e) and by the mass of sediment forming sinking OSAs (b,d,f). ......................................................................................................................................29 Figure 17. Comparison between oil sedimentation (TPH in sinking OSAs) measured without and with chemical dispersants using Cook Inlet sediment and the three crude oils. Normalized by the mass of oil used in the experiment (a,c,e) and by the mass of trapping sediment in OSAs (b,d,f). ......................................................................................................................................32 Figure 18. Comparison between oil sedimentation (TPH in sinking OSAs) measured without and with chemical dispersants using Columbia River Delta sediment and the three crude oils. Normalized by the mass of oil used in the experiment (a,c,e) and by the mass of trapping sediment in sinking OSAs (b,d,f). ......................................................................................................33 Figure 19. Comparison between oil sedimentation (TPH in sinking OSAs) measured without and with chemical dispersants using Mississippi River Delta sediment and the three crude oils. Normalized by the mass of oil used in the experiment (a,c,e) and by the mass of trapping sediment in sinking OSAs (b,d,f). ......................................................................................................34 Figure 20. Comparison between oil sedimentation (TPH in sinking OSAs) measured without and with chemical dispersants using SRM-1941b sediment and the three crude oils. Normalized by the mass of oil used in the experiment (a,c,e) and by the mass of trapping sediment in OSAs (b,d,f)....................................................................................................................35 Figure 21. Measured variations of oil sedimentation (TPH in sinking OSAs) with DOR. These results were obtained from experiments with Corexit 9500 at various DORs and using a constant sediment concentration of 200 mg/L. Values of the measured TPH were normalized by the mass (50 mg) of the oil used in the experiments .....................................................................37 Figure 22. Measured increase of oil sedimentation due to application of chemical dispersant. Values of the “Increase of Oil Sedimentation” were calculated using the data shown on Figure 21 and the following formula: 100*(TPHCD-TPHNoCD)/TPHNoCD, where TPHCD and TPHNoCD represent TPH (oil) measured in sinking OSAs formed with and without application chemical dispersant, respectively. ...................................................................................38 Figure 23. Measured size distributions of OSAs formed with the four sediments at 100 mg/L concentration and the Arabian Medium oil without and with Corexit 9500 at 1:10 DOR. ...............40 Figure 24. Measured size distributions of OSAs formed with the four sediments at 100 mg/L concentration and the South Louisiana oil without and with Corexit 9500 at 1:10 DOR..................41 Figure 25. Measured settling velocities of OSAs formed with the four sediments at 100 mg/L concentration and the Arabian Medium oil without and with Corexit 9500 at 1:10 DOR. The data are compared to those obtained without oil (sediment flocs) and without chemical dispersant (black dots)........................................................................................................................42 Figure 26. Measured settling velocities of OSAs formed with the four sediments at 100 mg/L concentration and the South Louisiana oil without and with Corexit 9500 at 1:10 DOR. The data are compared to those obtained without oil (sediment flocs) and without chemical dispersant (black dots)........................................................................................................................43 Figure 27. Measured effective density of OSAs formed with the four sediments at 100 mg/L concentration and the Arabian Medium oil without and with Corexit 9500 at 1:10 DOR. The data are compared to those obtained without oil (sediment flocs) and without chemical dispersant (black dots). Effective density of an object in seawater = density of the object – density of the seawater. ......................................................................................................................44 Figure 28. Measured effective density of OSAs formed with the four sediments at 100 mg/L concentration and the South Louisiana oil without and with Corexit 9500 at 1:10 DOR. The
data are compared to those obtained without oil (sediment flocs) and without chemical dispersant (black dots). Effective density of an object in seawater = density of the object – density of the seawater. ......................................................................................................................45
List of Tables Table 1: Organic matter and fine contents in the five natural sediment samples and their density .........................................................................................................................................15 Table 2: TPH concentration in the natural sediment samples .......................................................16 Table 3: Oil physical properties and asphaltenes/resins contents..................................................17 Table 4: Effects of chemical dispersant on oil viscosity ...............................................................20 Table 5. Maximum measured percentage of oil sedimentation.....................................................30 Table 6. Measured maximum and median sizes of OSAs.............................................................39 Table 7 Summary of the study results on oil sedimentation. .......................................................49 Table 8 Estimated increase* of oil sedimentation due to application of chemical dispersant as a function of fine content** and sediment concentration assuming: 1) mixing energy equivalent to breaking wave conditions, 2) an oil thickness of 2 mm, 3) oil density of 850 g/L, and 3) an upper mixing layer of 10m. Results presented in % of spilled oil. ....................................50 Table 9 Estimated increase* of oil sedimentation due to application of chemical dispersant as a function of fine content** and sediment concentration assuming: 1) mixing energy equivalent to breaking wave conditions, 2) an oil thickness of 2 mm, 3) oil density of 850 g/L, and 3) an upper mixing layer of 10m. Results presented in % of no chemical dispersant conditions .........................................................................................................................................50

1.0 Introduction
1.1 Scope of the problem During oil spills, physically-dispersed oil droplets aggregate readily with suspended particulate matter (SPM) such as clay minerals or organic matters to form oil-SPM aggregates (OSAs) (Figure 1). The simplest aggregate consists of an oil droplet coated with micron-sized solid grains. This process enhances dispersion of spilled oils by preventing the droplets from sticking to each other and reforming oil slicks. However, formation of OSAs with chemically-dispersed oil is poorly understood. Application of chemical dispersants in areas of high SPM concentrations is expected to have significant effects on formation and fate of OSAs because: 1) chemical dispersants are known to alter surface properties of oil droplets and, hence, they may change the bonding forces making solid fines stick to oil droplets; 2) smaller chemically-dispersed droplets require less solid fines in suspension to form OSAs than larger physically-dispersed droplets; and 3) application of chemical dispersant enhances concentration of oil droplets in the water column (Figure 2). More importantly, in areas with high SPM, OSAs formed with small and numerically-abundant, chemically-dispersed droplets may be expected to sink to the seafloor because the small droplets get coated with large quantities of denser solid fines and thus increase their in situ density. Natural solid particles in marine waters commonly have specific gravities 2 to 3 times higher than the density of most crude oils. The conditions (concentration and type of sediment, oil type, dispersant-to-oil ratios, mixing energy, etc.) under which this process of oil transfer from water surface to the bottom occurs are not known. As such, the problem this study addresses relates to application of chemical dispersant in any water systems rich in SPM. Many US coastal waters showed high level of SPM concentrations and thus, enhancement of oil sedimentation may be a problem if chemical dispersants are used as an oil spill countermeasure.
Figure 1: Photomicrographs of OSAs obtained with Heidrun oil and chalk using epi-fluorescence (left) and transmitted light (right). Oil droplets are transparent particles (left) surrounded by dark sediment flocs (right). From Khelifa et al. (2005c).

Figure 2: Schematic description of the problem related to effects of chemical dispersant on formation and fate of OSAs in SPM-rich water systems.
1.2 State-of-Knowledge Naturally-dispersed oil droplets aggregate readily with suspended particulate material (SPM) such as clay minerals or organic matter to form oil-SPM aggregates (OSAs). Terminologies such as oil-clay flocculation, oil-SPM interactions, oil-mineral aggregates, and oil-fine interactions have been used to describe this natural process (Ajijolaiya, 2004; Khelifa et al. 2002, 2005a; Muschenheim and Lee, 2002; Omotoso et al., 2002; Owens, 1999; Owens and Lee, 2003; Payne et al., 2003 for a review). The simplest form of OSA consists of an oil droplet coated with micrometer-sized solid grains. Figure 1 shows an example of observed OSA using epi-fluorescence microscopy where the OSA contains many droplets coated with sediment grains and/or sediment flocs. This process is recognized to enhance oil dispersion by preventing the droplets from sticking to each other and reforming oil slicks, enhancing their density to make them neutrally (to slightly negatively) buoyant, and from sticking to shoreline structures (Owens 1999; Sergy et al. 1998, 1999, 2003; Le Floch et al., 2002; Owens and Lee, 2003).
In contrast, formation and fate of OSA with chemically-dispersed oil are poorly understood. The few studies conducted on OSA formation with chemical dispersants showed conflicting results. Mackay and Hussain (1982) found that chemically-dispersed oil tends to associate less with mineral matter than naturally dispersed oil, while Guyomarch et al. (1999, 2002) measured high amounts of oil trapped in OSA when various oils and Inipol IP90 chemical dispersant were mixed with clay minerals using Warren Spring Laboratory (WSL) and Institut Francais du Petrole (IFP) test methods. Additional experiments performed in the Polludrome facility (the wave flume facility at CERDE, http://www.le-cedre.fr/) to validate the bench scale (flask) tests showed that 30 minutes of wave action on a chemically-treated oil were sufficient to disperse the oil. Almost 80 % of this oil was trapped as OSA and settled to the bottom of the flume (Guyomarch et al., 1999). Moreover, OSA formation was closely related to the efficiency of treating chemical dispersant. Guyomarch et al. (2002) concluded that formation and transport of OSA must be studied further to determine whether it is beneficial to apply oil dispersant in coastal regions loaded with mineral particles. Previously, Mackay and Hussain (1980) found from their laboratory experiments that presence of suspended clay particles at moderate concentration accelerates sedimentation of chemically
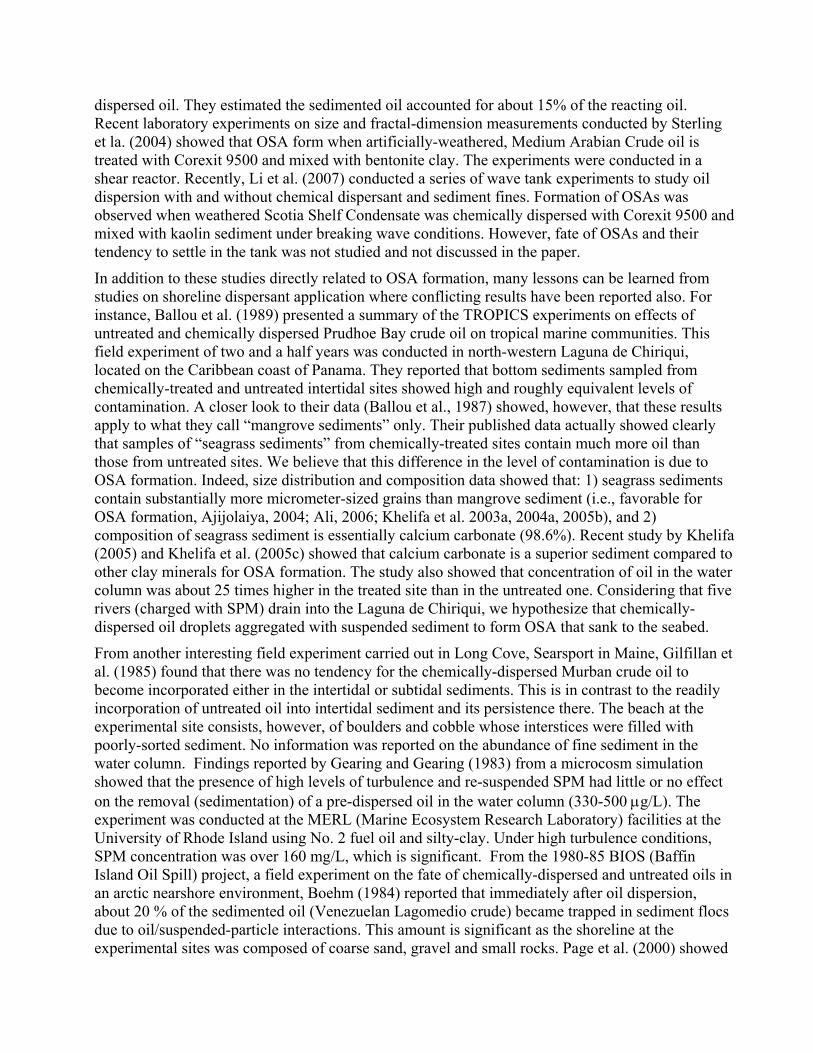
dispersed oil. They estimated the sedimented oil accounted for about 15% of the reacting oil. Recent laboratory experiments on size and fractal-dimension measurements conducted by Sterling et la. (2004) showed that OSA form when artificially-weathered, Medium Arabian Crude oil is treated with Corexit 9500 and mixed with bentonite clay. The experiments were conducted in a shear reactor. Recently, Li et al. (2007) conducted a series of wave tank experiments to study oil dispersion with and without chemical dispersant and sediment fines. Formation of OSAs was observed when weathered Scotia Shelf Condensate was chemically dispersed with Corexit 9500 and mixed with kaolin sediment under breaking wave conditions. However, fate of OSAs and their tendency to settle in the tank was not studied and not discussed in the paper.
In addition to these studies directly related to OSA formation, many lessons can be learned from studies on shoreline dispersant application where conflicting results have been reported also. For instance, Ballou et al. (1989) presented a summary of the TROPICS experiments on effects of untreated and chemically dispersed Prudhoe Bay crude oil on tropical marine communities. This field experiment of two and a half years was conducted in north-western Laguna de Chiriqui, located on the Caribbean coast of Panama. They reported that bottom sediments sampled from chemically-treated and untreated intertidal sites showed high and roughly equivalent levels of contamination. A closer look to their data (Ballou et al., 1987) showed, however, that these results apply to what they call “mangrove sediments” only. Their published data actually showed clearly that samples of “seagrass sediments” from chemically-treated sites contain much more oil than those from untreated sites. We believe that this difference in the level of contamination is due to OSA formation. Indeed, size distribution and composition data showed that: 1) seagrass sediments contain substantially more micrometer-sized grains than mangrove sediment (i.e., favorable for OSA formation, Ajijolaiya, 2004; Ali, 2006; Khelifa et al. 2003a, 2004a, 2005b), and 2) composition of seagrass sediment is essentially calcium carbonate (98.6%). Recent study by Khelifa (2005) and Khelifa et al. (2005c) showed that calcium carbonate is a superior sediment compared to other clay minerals for OSA formation. The study also showed that concentration of oil in the water column was about 25 times higher in the treated site than in the untreated one. Considering that five rivers (charged with SPM) drain into the Laguna de Chiriqui, we hypothesize that chemically-dispersed oil droplets aggregated with suspended sediment to form OSA that sank to the seabed.
From another interesting field experiment carried out in Long Cove, Searsport in Maine, Gilfillan et al. (1985) found that there was no tendency for the chemically-dispersed Murban crude oil to become incorporated either in the intertidal or subtidal sediments. This is in contrast to the readily incorporation of untreated oil into intertidal sediment and its persistence there. The beach at the experimental site consists, however, of boulders and cobble whose interstices were filled with poorly-sorted sediment. No information was reported on the abundance of fine sediment in the water column. Findings reported by Gearing and Gearing (1983) from a microcosm simulation showed that the presence of high levels of turbulence and re-suspended SPM had little or no effect on the removal (sedimentation) of a pre-dispersed oil in the water column (330-500 μg/L). The experiment was conducted at the MERL (Marine Ecosystem Research Laboratory) facilities at the University of Rhode Island using No. 2 fuel oil and silty-clay. Under high turbulence conditions, SPM concentration was over 160 mg/L, which is significant. From the 1980-85 BIOS (Baffin Island Oil Spill) project, a field experiment on the fate of chemically-dispersed and untreated oils in an arctic nearshore environment, Boehm (1984) reported that immediately after oil dispersion, about 20 % of the sedimented oil (Venezuelan Lagomedio crude) became trapped in sediment flocs due to oil/suspended-particle interactions. This amount is significant as the shoreline at the experimental sites was composed of coarse sand, gravel and small rocks. Page et al. (2000) showed

from a series of meso-scale nearshore dispersant tests using SERF (Shoreline Environmental Research Facility) wave tanks partially filled with fine-grain sand that almost no chemically-dispersed oil (Arabian medium crude) remained on the sediments when a 200 L/min flushing rate was applied to simulate flow due to tides. In contrast about 49 % of untreated oil remained in the tanks sorbed to sediments or other surfaces.
In terms of oil components preferentially retained in OSAs, results from previous studies (Gearing et al., 1979, 1980; Gearing and Gearing, 1983; Wade and Quinn, 1980) showed that sedimented oil contains mostly saturated hydrocarbons (insoluble) and lower concentrations of aromatic hydrocarbons (more soluble).
1.3 Justification for the research From the extensive literature review conducted in this project, we conclude that results from previous studies are conflicting. The results demonstrated, however, that OSAs do form with chemically-dispersed oils, contrary to what Reed et al. (2001) have reported. We believe that the variability in the results from previous works is more likely due to the variety of experimental conditions including concentration and type of SPM, oil type, dispersant type and control of the experimental protocols. None of the previous studies have systematically investigated OSA formation with chemically-dispersed oils and compared the results related to oil sedimentation, for instance, with those obtained with the same untreated oils. This lack of knowledge has left decision makers ignorant of the risk of enhancement of oil sedimentation when chemical dispersants are applied in coast water systems. The proposed study aims to fill this knowledge gap to better understand the dynamics and environmental impacts from chemical dispersant applications in coastal ecosystems.
Theoretically, chemical dispersants affect formation and fate of OSAs because: 1) chemical dispersants alter surface chemical properties of oil droplets and, hence, they may change the bonding forces making solid fines stick to oil droplets; 2) application of chemical dispersant enhances the concentration of oil droplets in the water column; 3) small and abundant chemically-dispersed droplets require fewer solid fines in suspension to form negatively buoyant OSAs than larger naturally-dispersed droplets. More importantly, in areas with high SPM, OSAs formed with small and numerically-abundant, chemically-dispersed droplets may be expected to sink to the seafloor because the small droplets get coated with large quantities of denser solid fines and thus increase their in-situ density. Natural solid particles in marine waters commonly have specific gravities 2 to 3 times higher than the density of most crude oils. The conditions (concentration and type of sediment, oil type, dispersant-to-oil ratios, mixing energy, etc.) under which this process of oil transfer from water surface to the bottom occurs are not known. Recent laboratory and numerical simulations studies showed that a critical range of sediment concentration exists were formation of OSA with naturally-dispersed oil increases rapidly (Guyomarch et al., 1999; Khelifa et al. 2003a, 2004a; Ajijolaiya, 2004; Ajijolaiya et al., 2006), as shown in Figure 3. Within this range and at higher sediment concentration, sedimentation of dispersed oil is expected to increase rapidly also. No research has been conducted with chemically dispersed oil to this regard.
1.4 National significance of the project OSA formation is one of the key processes controlling dispersion and sedimentation of oil in coastal environments and rivers. Quantitative understanding of this process is fundamental for risk assessment and planning when dealing with chemical-dispersant application. It is also crucial for development of accurate oil-spill models. For regional and national relevance, OSA formation is

significant in several coastal areas with relatively high SPM loads and risk for oil spills such as Delaware Bay, Gulf of Mexico, Cook Inlet, Alaska, (where SPM loadings can reach 2,000 mg/L–Burbank, 1977; Dames & Moore, 1978) and near the mouths or deltas of major rivers such as the Yukon River in Norton Sound, Alaska, the Columbia River in Washington/Oregon, or the Mississippi River in the Gulf of Mexico (Boehm et al., 1987). Sediments used in this project to study OSA formation are natural sediment sampled from the following US coastal waters: Baltimore Harbor (Baltimore), Mississippi River delta (Gulf of Mexico), Columbia River delta (Washington/Oregon), Cook Inlet (Alaska), and Unalaska Island (Alaska).
Figure 3: Example showing variations of OSA formation with the sediment-concentration-to- oil-concentration ratio. OSA formation is expressed here by the percentage of initial oil stabilized by OSAs. The solid line represents experimental results obtained by Guyomarch et al. (1999) and the red and blue symbols are results from numerical simulations using MCOSA model (Khelifa et al., 2003a, 2004a, 2005b) for size ratios (size of sediment grains/size of oil droplets) of 0.1 and 0.4, respectively. One notes the rapid increase of OSA formation when the concentration ratio increases between about 0.3 and 1.
1.5 Areas of oil spill research and development addressed by the project The project consists of conducting bench scale laboratory study on the effects of chemical dispersant effects on formation and fate of OSAs using various concentrations and types of natural sediments from different US coastal regions, different crude oils frequently shipped or produced in US waters, and two types of dispersants frequently used in oil spill response, at different concentrations. The results of this study constitute fundamental matter to upgrade oil spill models, such as those used by NOAA for technical support of spill response efforts in the US. As such, this project will address various priority areas for spill research and development identified in the newly released National Research Council report (NRC 2005). Specifically, these areas include:
• Oil/suspended-particle-matter interaction. • Oil sedimentation • Oil dispersion • Application of chemical dispersant in coastal environments • Oil-spill fate-and-transport modelling • Natural recovery of oiled shorelines.
2.0 Objectives Three main objectives targeted in this project are to:
1. Quantify how oil type, dispersant type and concentration, and sediment type and concentration affect formation and fate of OSAs with chemically-dispersed oil versus physically-dispersed oil.
2. Provide the data to the oil spill response community to support decision makers developing guidelines for application of chemical dispersants in coastal water systems.
3. Provide the data to the oil spill response community to improve its modeling capabilities for OSA formation with chemically- and physically-dispersed oil and of oil sedimentation.
Specific goals of the project are to measure under various oil/sediment/dispersant conditions: • effects of chemical dispersants on oil sedimentation • effects of oil type on OSA formation • effects of sediment type on OSA formation • effects of dispersant to oil ratio (DOR) on OSA formation • effects of chemical dispersant on physical properties of crude oils • size distribution of OSAs • settling velocity and density of OSAs
This research addresses one of the priority research topics identified in the NRC’s 2005 oil-dispersion report: “…there is still insufficient information on which to determine how chemically-dispersed oil interacts with a wide variety of suspended sediment types, both short- and long-term, compared to physically-dispersed oil.” Furthermore, the study will provide additional information on the ultimate fate of chemically- and physically-dispersed oil droplets. The resulting data can enhance oil-spill-response decisions regarding dispersant applications in near-shore waters.
3.0 Methods
3.1 Natural sediment characterisation Five types of natural sediments were used in this study. These are:
1. Standard Reference Material 1941b (SRM-1941b) originally sampled from Baltimore Harbor, Maryland, USA
2. Natural sediment from the coasts of Mississippi Rover Delta, Gulf of Mexico, USA. 3. Natural sediment from the coasts of Columbia River Delta, Washington, USA. 4. Natural sediment from the coasts of Cook Inlet, Alaska, USA. 5. Natural sediment from Unalaska Island, Alaska, USA. This sediment was included in the
project at the request of Dr. Gary Shigenaka from NOAA. It was sampled from a Selendang Ayu spill-affected beach.
3.1.1 Sampling Except for SRM-1941b sediment, all natural sediments were sampled using sampling protocol shown in Appendix A. Detailed information about the sampling locations is also presented in Appendix A.
3.1.2 Treatment and conservation Natural sediments were received wet, except for SRM sediment which was supplied dry. Wet sediments were wet sieved to eliminate coarse grains that do not participate in OSA formation.
Sediment-distilled water suspensions were passed through a stainless steel filter (Spectra/Mesh Woven Filter 104μm from Spectrum Laboratories, Inc.). The SRM sediment was passed dry through the same filter. The resulting sediment suspensions (and dry sieved SRM sediment) were kept in suspension in a cold room at a controlled temperature of 5 oC. The UNA sediment was also dry sieved as it contains no sediment fine less than 104μm in diameter.
3.1.3 Elemental and mineralogy analyses Elemental analysis is performed using X-Ray Fluorescence method. One (1.0000) gram of sample is mixed with 3.1412 grams of Li-tetraborate ( Li2B4O7 ) and 0.8588 grams of Li-metaborate ( LiBO2 ) in a Pt crucible and heated to ~ 1050 oC . The resulting fused glass bead is cast in a Pt mold and analyzed in a Philips PW2400 XRAY Spectrometer using SUPERQ (ver. 2.1d ) quantitative software for the 28 elements reported. The reported elements are quantified with calibrations using ~50 fusions of international rock standards. Results are shown in Table B-1 in Appendix B. Comparison between the sediment samples is shown in Figure B.1 where abundance of the main elements is plotted.
Mineralogy analysis is performed using Powder X-Ray Diffraction method. This is done on powdered material using a Philips X’Pert XRayY Diffraction system. Mineralogical determination of a sample is done using the SEARCH/MATCH capability of the X’PERT software. The mineral content of sample is for presence only; no estimate of the amount of a particular mineral was made. Only the major minerals are determined. Results are summarized in Table B.2 in Appendix B.
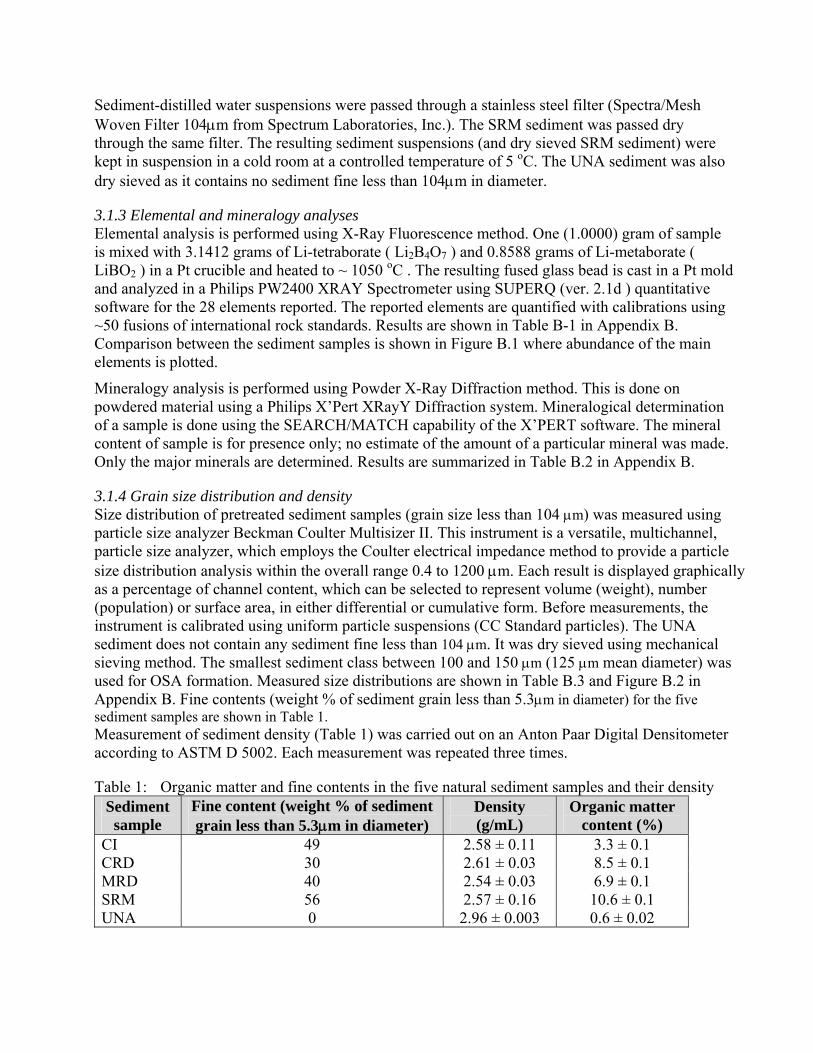
3.1.4 Grain size distribution and density Size distribution of pretreated sediment samples (grain size less than 104 μm) was measured using particle size analyzer Beckman Coulter Multisizer II. This instrument is a versatile, multichannel, particle size analyzer, which employs the Coulter electrical impedance method to provide a particle size distribution analysis within the overall range 0.4 to 1200 μm. Each result is displayed graphically as a percentage of channel content, which can be selected to represent volume (weight), number (population) or surface area, in either differential or cumulative form. Before measurements, the instrument is calibrated using uniform particle suspensions (CC Standard particles). The UNA sediment does not contain any sediment fine less than 104 μm. It was dry sieved using mechanical sieving method. The smallest sediment class between 100 and 150 μm (125 μm mean diameter) was used for OSA formation. Measured size distributions are shown in Table B.3 and Figure B.2 in Appendix B. Fine contents (weight % of sediment grain less than 5.3μm in diameter) for the five sediment samples are shown in Table 1. Measurement of sediment density (Table 1) was carried out on an Anton Paar Digital Densitometer according to ASTM D 5002. Each measurement was repeated three times.
Table 1: Organic matter and fine contents in the five natural sediment samples and their density Sediment sample
Fine content (weight % of sediment grain less than 5.3μm in diameter)
Density (g/mL)
Organic matter content (%)
CI 49 2.58 ± 0.11 3.3 ± 0.1 CRD 30 2.61 ± 0.03 8.5 ± 0.1 MRD 40 2.54 ± 0.03 6.9 ± 0.1 SRM 56 2.57 ± 0.16 10.6 ± 0.1 UNA 0 2.96 ± 0.003 0.6 ± 0.02

3.1.5 Organic matter content Organic matter content (OMC) measurements were performed using the Loss-on-Ignition (LOI) method. For each sediment type, three samples of about 3 g each were burned at 550 oC. The difference of weight represents the mass of OMC. Results are shown in Table 1.
3.1.6 Chemical analysis The five sediment types used in the project were analyzed for identification and quantification of oil-characteristic PAHs (including 16 EPA priority PAHs and 5 target alkylated (C0- to C4-) homologous series of naphthalene, phenanthrene, dibenzothiophene, fluorine, and chrysene) in these samples.
Sediment samples were accurately weighed, spiked with appropriate surrogates (100 μL 200 ppm of o-terphenyl and 100 μL of mixture of deuterated acenaphthene, phenanthrene, benz[a]anthracene, and perylene, 10 ppm each), then extracted using ultra-sonication with dichloromethane (DCM) three times (50 mL DCM each time, 15 min of sonication each extraction). Extracts were combined, dried by passage through anhydrous sodium sulphate, and concentrated to small volumes by rotary evaporation. The concentrated extracts were quantitatively transferred to calibration centrifuge tubes, spiked with appropriate amount of the internal standard 5α-androstane (for TPH and n-alkane determination) and d14-terphenyl (for PAH determination), and then made up to an accurate pre-injection volume of 1.00 mL for GC-MS analyses to determine the PAH compounds. For estimation of analysis precision, the CI and CRD sediments were analyzed in duplicate.
Analyses of target PAH compounds (including 5 alkylated PAH homologous groups and other EPA priority PAHs) were performed on an HP 6890 GC equipped with a HP 5973 mass selective detector (MSD). System control and data acquisition were achieved with an HP G1701 BA MSD ChemStation. An HP-5 fused silica column (30m x 0.25 mm id, 0.25 μm film thickness) was used. The carrier gas was Helium (1.0 mL/min). The injector and detector temperature were set at 290 and 300 oC. The concentrations of the individual PAH and isomeric PAH groups were determined using the internal standard method. Measurement quality was controlled by charting the instrument response of the calibration standards and the response of the internal standard.
Table C.1 in Appendix C summarizes quantitation results of 5 petroleum-characteristic alkylated PAH homologous series (alkylated naphthalene, phenanthrene, dibenzothiophene, fluorene, and chrysene series) and other EPA priority PAHs. Figures C.1-C.3 in Appendix graphically depict the distribution of these target PAH compounds.
Total Petroleum Hydrocarbon (TPH) in the natural sediment samples was measured using GC/FID analysis as described in Appendix D. Measured concentration are shown in Table 2. They served as baselines to calculate TPH in OSA.
Table 2: TPH concentration in the natural sediment samples Sediment sample TPH concentration in mg/mg of sediment
CI 0.09E-03 CRD 5.04E-03 MRD 0.66E-03 SRM 0.53E-03 UNA 0

3.2 Oil characterisation Three types of crude oils were used in this study. These are:
1. Arabian Medium (hereafter referred by “AM”) 2. Alaska North Slope (hereafter referred by “ANS”) 3. South Louisiana (hereafter referred by “SL”)
Measurements of density, viscosity, surface tension, and brine/oil interfacial tension (IFT) were performed for the three oils. Oil density is measured using an Anton Parr DMA 5000 digital density meter in g/mL. Oil dynamic viscosity is measured with a Thermo-Haake VT550 viscometer using NV cup-and-spindle sensors. Surface and oil-water interfacial tensions, in mN/m, are measured using a Krüss K10 Tensiometer by the Du Noüy ring method. All measurements were performed at a controlled temperature of 15.0 °C. Results, including asphaltenes/resins contents, are shown in Tables 3.
Table 3: Oil physical properties and asphaltenes/resins contents Fresh Oil Surface Tension
(mN/m) Brine/Oil Interfacial
Tension (mN/m) Density (g/mL)
Viscosity (mPa s)
Asphaltenes/Resins contents (weight %)
ANS 26.4 19.0 0.873 17.0 6/7 AM 26.5 20.0 0.876 28.1 4/6.1 SL 26.5 16.2 0.859 13.3 0.8/5.9
3.3 Chemical dispersant Chemical dispersant used in this project are Corexit 9500 and Corexit 9527.
3.3.1 Effects of chemical dispersant on oil properties and dispersion
Effects of chemical dispersant on oil viscosity and IFT, main factors that control oil droplet formation, were studies for the three oils for six dispersant-to-oil ratios (DOR=0, 1:40, 1:20, 1:10, 1:5 and pure chemical dispersant).
Effects of chemical dispersant on oil dispersion were studied monitoring size distribution of oil droplets formed under various conditions and using UV-epi fluorescence microscopy. The objective is to measure the effects of IFT reduction on oil droplet size distribution. About 50 mg of ANS oil were mixed with 250 mL of brine (33‰) in a reciprocating shaker for 90 minutes. Corexit 9500 was used at DOR of 0, 1:200, 1:100, 1:40, 1:20, and 1:10. While shaking, water samples were collected from the center of the suspension after 90 minutes shaking. Each sample was analyzed immediately using UV-epi fluorescence microscopy equipped with a high resolution digital camera. The imaging setup is designed to detect oil droplets up to 0.1 μm in size.
3.3.2 Effects of chemical dispersants on oil-SPM interaction Effects of chemical dispersants on oil-SPM interaction were studied by premixing oil and dispersant at a desired DOR. The total volume of the resulting oil-dispersant mixture to use in the experiments was adjusted according to the DOR value, the type of dispersant and the type of oil in order to use the same amount of oil (50 mg) in all experiments. Oil-dispersant mixtures were prepared daily when the experiments are performed. The UV-epi fluorescence microscopy method discussed above was used to investigate the effects of chemical dispersant on the size and shape of OSAs and on the size of oil droplets forming OSAs.

3.4 Oil-SPM interaction and OSA formation The procedure used to study Oil-SPM interaction that leads to OSA formation includes several steps. Its development took into consideration the performances and weaknesses of previous methods used to study OSA formation in the laboratory. As the study focuses on oil sedimentation, only negatively buoyant OSAs were measured in this project. The steps of the experimental protocol include OSA preparation, isolation of negatively buoyant OSAs, oil extraction from OSAs, sediment filtration from OSAs, measurement of size and settling velocity of OSAs, calculation of the density of OSAs and microscopic investigation of OSAs using UV epi-fluorescence technique. Detailed description of the procedure is presented in Appendix E.
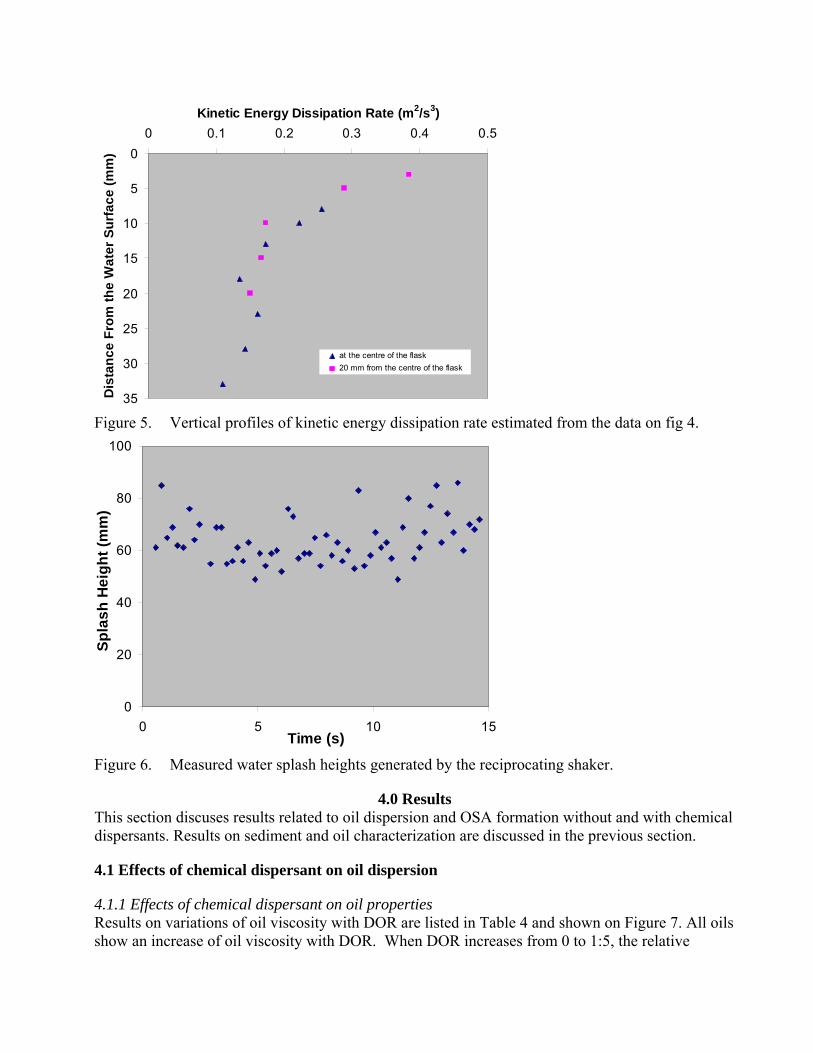
3.5 Mixing energy characterisation Mixing energy in the reaction vessel (Erlenmeyer) was measured using TSI IFA300 hotwire anemometer and image analysis. The procedure is explained in details in Appendix E. Vertical profiles of turbulent kinetic energy (TKE) measured at the centre of the vessel and 20 mm away from the centre are shown on Figure 4. Related profiles of kinetic energy dissipation rate (KEDR) are shown on Figure 5. High turbulent mixing and dissipation close to the water surface was expected, as reciprocating shaking produces periodic splashes on the water surface.
Compared to real conditions, the measured values of KEDR are comparable to those observed at upper mixing layer, but are smaller than those observed under breaking wave conditions (Delvigne and Sweeney, 1988; NRC 2005). The maximum value of KEDR measured in the reaction vessel is about 0.4 m2/s3. However, our observations suggest that mixing in the reaction vessel is high and is dominated by periodic water splashes generated by the reciprocating movement of the shaker. It is the periodic falling of these splashes that dominates the mixing at the water surface, very similar to the action of breaking waves. Variations of the height of the periodic splashes with time were measured and are shown on Figure 6. The average height is 64 mm. A splash of this height generates potential energy that gets dissipate once it heats the water surface. According to the procedure described in Appendix E, splash of 64 mm height causes an energy dissipation of about 2.6 m2/s3 in this study. This value is much higher that the 0.4 m2/s3 caused by turbulent kinetic energy. It falls within the range of breaking wave conditions (Delvigne and Sweeney, 1988; NRC 2005).
0
5
10
15
20
25
30
35
0 0.02 0.04 0.06 0.08 0.1 0.12Turbulent Kinetic Energy (m2/s2)
Dis
tanc
e Fr
om th
e W
ater
Sur
face
(mm
)
at the centre of the flask 20 mm from the centre of the flask
Figure 4. Measured vertical profiles of turbulent kinetic energy.
0
5
10
15
20
25
30
35
0 0.1 0.2 0.3 0.4 0.5Kinetic Energy Dissipation Rate (m2/s3)
Dis
tanc
e Fr
om th
e W
ater
Sur
face
(mm
)
at the centre of the flask 20 mm from the centre of the flask
Figure 5. Vertical profiles of kinetic energy dissipation rate estimated from the data on fig 4.
0
20
40
60
80
100
0 5 10 15Time (s)
Spla
sh H
eigh
t (m
m)
Figure 6. Measured water splash heights generated by the reciprocating shaker.
4.0 Results This section discuses results related to oil dispersion and OSA formation without and with chemical dispersants. Results on sediment and oil characterization are discussed in the previous section.
4.1 Effects of chemical dispersant on oil dispersion
4.1.1 Effects of chemical dispersant on oil properties Results on variations of oil viscosity with DOR are listed in Table 4 and shown on Figure 7. All oils show an increase of oil viscosity with DOR. When DOR increases from 0 to 1:5, the relative

increases ranged from about 15% with Arabian Medium and Corexit 9500 to about 43 % with South Louisiana crude and Corexit 9527 over the crude oil viscosities. The linear trend in viscosity increases with DOR suggests that the viscosity of the mixture is related to a linear proportion of the less viscous crude oils and the more viscous dispersants. Corexit 9500 and Corexit 9527 produced similar increases to oil viscosity with DOR.
Table 4: Effects of chemical dispersant on oil viscosity Oil/Dispersant Mixture Viscosity (mPa s) for DOR by weight:
Fresh Oil 0 1:40 1:20 1:10 1:5 dispersant only Alaska North Slope 17.0 Arabian Medium 28.1 South Louisiana 13.3
Fresh Oil + Corexit 9500
Alaska North Slope 17.8 18.0 20.0 23.7 Arabian Medium 29.4 28.1 29.8 32.4 South Louisiana 13.7 14.7 16.0 18.2
Fresh Oil + Corexit 9527
Alaska North Slope 17.7 17.8 20.3 22.5 Arabian Medium 28.1 28.4 29.5 33.5 South Louisiana 13.8 14.4 15.1 19.0
Corexit 9500 92.9
Corexit 9527 67.5
Oil/brine interfacial tensions (IFTs) for oils mixed with dispersants were below the detection limit of the Krüss K10 Tensiometer (which is based on the Du Noüy ring method), i.e. <3.6 mN/m, for all DOR values and for both dispersants (Corexit 9500 and Corexit 9527). Additional diluted mixtures with DOR of 1:200 were prepared for both dispersants and for all three oils to test further the observed effects of dispersants. No measurements of brine/oil interfacial tension could be determined even for these more dilute mixtures. Reduction of IFTs has direct effects on formation of oil droplets as discussed below.
4.1.2 Effects of chemical dispersant on oil droplet formation Examples of photomicrographs obtained from the UV epi fluorescence microscopy setup are shown on Figure 8. These photomicrographs showed interesting results about oil dispersion. The first one is that for DOR of 1:100 or less, the chemical dispersant has less effect on oil droplet size (compare Figures 8e & f to 8a). The second one relates to the fact that the smallest oil droplet size distributions (generally used as an indicator of dispersant effectiveness) are not obtained at the highest DOR of 1:10 (Figure 8b), but at a DOR equal to 1:20 (Figure 8c). The third observation is that there is a good similarity between oil droplet populations obtained with DOR of 1:10 (Figure 8b) and 1:40 (Figure 8d). These observations were qualitatively confirmed by visual evaluation of water turbidity (Figure 9) and quantitatively by measurements of droplet size distributions. Visual diagnosis of the six samples shown on Figure 9 clearly confirm that the 1:20 DOR provided the highest oil dispersion (highest stable turbidity). Water samples for DOR equal to 1:100 and less are clear and comparable to water sample without dispersant. This is further confirmation of what was

noted from Figure 8. Large oil droplets resurface faster than small droplets, which makes the water samples at low DOR look cleaner than at higher DOR.
Figure 7. Measured variations of oil viscosity with dispersant to oil ratio.
e f d
ca b
Figure 8: Photomicrographs of oil droplets measured after 90 minutes while shaking using UV epi-fluorescence microscopy, Alaska North Slope crude and Corexit 9500 at various DOR: no dispersant (a), 1:10 (b), 1:20 (c), 1:40 (d), 1:100 (e), 1:200 (f).

Figure 9: Water samples from different reaction chambers after overnight settling period. The ratios shown on this figure represent DOR values. The experiment was conducted with Alaska North Slope crude, Corexit 9500 and a shaking period of 90 minutes. Clear water samples showed that most of the dispersed oil initially dispersed in the water column has resurfaced in the reaction chamber during the settling period.
One way to quantitatively investigate the observations discussed above is to measure droplet size distributions during shaking and after different settling periods. This is shown on Figure 10. All measured size distributions are shown in number concentration. Results shown on Figure 10a confirm observations made above from Figure 8. The highest concentration of small oil droplets are obtained with DOR 1:20 during shaking and after the two settling periods. Size distributions measured with DOR 1:10 and 1:40 are very similar. For small DOR, size distributions measured while shaking are comparable to no dispersant conditions and include the largest droplets of about 25 μm (Figure 10a). Comparison between droplet concentration in Figures 10a and 10b revealed that coalescence between chemically dispersed oil droplets does occur, as more large droplets (up to about 50 μm in size) and less small droplets were measured at small values of DOR and after 90 minutes settling time. After overnight settling period, during which large droplets have reached the water surface (Fingas and Decola, 2006), almost all size distributions are within the same size range between 0.3 and 7 μm. The high concentration of small droplets shown in Figure 10c for DOR=1:20 (higher than during shaking, Figure 10a) was not expected and is probably due to a contamination of the syringe during the sampling process.
Overall, the measured droplet size distributions confirm the visual observations discussed above. Further confirmation is also provided in the measured variations of median droplet size with DOR (Figure 11). The smallest median diameter slightly less than 2 μm was obtained with DOR=1:20. At the highest DOR of 1:10, measured median droplet size is about 3.2 μm during shaking and after 90 minutes settling period. After overnight settling, the median size was almost constant at about 2 μm regardless of DOR. The significant increases (about double) of the median size observed when the DOR increased from 0 to 1:200 during shaking and from 0 to 1:100 after 90 minutes settling are due to high coalescence rate between suspended droplets, as noted from Figure 10b. For no dispersant conditions (DOR=0), the median size of oil droplets after 90 minutes shaking is about 6 mm. this value is comparable to 5 mm reported by Khelifa et al. (2003b) for the median of oil droplets forming OSAs and formed with different oils types.
It is interesting to note that the results obtained in this study are also in agreement with laboratory measurements discussed by Liu et al. (1995). Both visual and quantitative investigations obtained in

the present study showed that Corexit 9500 is more effective in dispersing Alaska North Slope crude at DOR 1:20 (or 5%) than at a higher DOR of 1:10. For the two different types of chemical dispersants used in their study (noted No. 2 and No. 4 in their manuscript), Liu et al. (1995) measured a maximum reduction of the oil/brine interfacial tension (IFT) at a DOR of 6% (or 1:17), while for the two other chemical dispersants they studied (No. 1 and No. 2), they measured a monotonous decrease of IFT with DOR. The DOR value at which the IFT reached a maximum reduction (1:20 in the present study and about 1:17 in Liu et al, 1995) is considered as the approximate critical micelle concentration (CMC) of chemical dispersant. Apparently, this concentration is a function of the type and solubility of chemical dispersant, oil type, and oil to water ratio, but very little is known about this concentration. Further discussion on effects of chemical dispersants on oil physical properties and dispersion was provided by Khelifa et al. (2007b). We concluded from this study that more laboratory measurements are needed to fully understand the effect of this parameter on oil dispersion and dispersant effectiveness, especially.
Figure 10: Measured droplet size distributions using UV epi-fluorescence microscopy, Alaska North Slope crude and Corexit 9500 at various DOR after 90 minutes shaking (a), 90 minutes settling (b), and overnight settling (c).

Figure 11. Measured variations of median droplet size with dispersant to oil ratio (DOR)
4.2 Effects of sediment and oil types on oil sedimentation
4.2.1 Results from UV-epi fluorescence microscopy Results from UV-epi fluorescence microscopy showed that OSAs form readily with both physically and chemically dispersed oils. Figure 12 showed an example of photomicrographs of sinking OSAs observed under the microscope and combined transmitted and UV lights. Neither Corexit 9500 nor Corexit 9527 seem to form any type of surface barrier for oil-SPM aggregation. Compared to those obtained with physically dispersed oil (Figure 12a), OSAs formed with chemically dispersed oil include smaller droplets (Figures 12b,c). This relates to the effects of chemical dispersants on droplet formation and properties discussed above.
4.2.2 Results obtained without chemical dispersant Variations of measured concentrations of physically dispersed oil (TPH) in negatively buoyant OSAs are shown on Figures 13a-16a. Values for the maximum percentage of oil sedimentation shown on these Figures are summarized in Table 5. Very little oil sedimentation is obtained with the Unalaska sediment, even at a high sediment concentration of 300 mg/L. This was expected as size distribution analysis showed total absence of fines (sediment grain in the silt and clay ranges) in this sediment. The smallest size of the Unalaska sediment is larger than 100 μm. In fact the very small quantity of oil that was measured in the sunken phase is due, perhaps, to adhesion of oil to the large sediment grains that had a chance (get suspended) to collide with suspended oil droplets. As shown on Figure 13b, the efficiency of such trapping process decreases significantly with sediment concentration, which contradicts the well established variations of OSA formation with sediment concentration.

a: ANS/SRM-1941B, 200mg/L, No dispersant b: ANS/SRM-1941B, 200mg/L, Corexit 9500 @ 1:10
c: ANS/SRM-1941B, 200mg/L, Corexit 9527 @ 1:10 Figure 12. Photomicrographs of sinking OSAs formed with Alaska North Slope oil and SRM-1941B sediment at 200 mg/L without chemical dispersant (a), with Corexit 9500 at 1:10 ratio (b) and with Corexit 9527 at 1:10 ratio (c). The scales in the pictures are identical.
Figure 13. Measured oil sedimentation (TPH in sinking OSAs) from experiments using the Unalaska sediment and the three crude oils. Normalized by the mass of oil used in the experiment (a) and by the mass of sediment forming sinking OSAs (b).
However, variations of measured concentrations of physically dispersed oil trapped in negatively buoyant OSAs formed with the other four types of sediments (CI, CRD, MRD and SRM) presented typical trends for the three oils (Figure 14a-16a), as reported in previous studies (Guyomarch et al.,
0.01
0.1
1
0 50 100 150 200 250 300 350
Sediment Concentration (mg/L)
TPH
in O
SAs
(%)
0.01
0.1
1
10
0 50 100 150 200 250 300 350
Sediment Concentration (mg/L)
TPH
/Sed
imen
t in
OSA
s (%
)
South LouisianaArabian MediumAlaska North Slope
a
South LouisianaArabian MediumAlaska North Slope
b

1999; Khelifa et al. 2004a, 2005a,b, 2007a, 2008a; Ajijolaiya, 2004, Khelifa, 2005; Ajijolaiya et al., 2006). The typical trend is characterized by a rapid increase in oil content when sediment concentration increases from 25 to 100 or 200 mg/L. Further increase of sediment concentnot increase significantly sedimentation of oil trapped in negatively buoyant OSAs. This is due to the fact that oil amount used in all the experiments was kept constant to 50 mg.
Among the five types of sediments studied, SRM appears to be the best sedim
ration does
ent to form OSAs and
rols on
, except
anic
ntration
s. n
produces the highest sedimentation of physically dispersed oil. CRD sediment forms much less OSAsand produces much less oil sedimentation than the three other sediments. Results obtained with the CI and MRD sediments are intermediate, but produced much higher oil sedimentation than CRD sediment. These observations were noted with the three types of oils. A closer review of the measured sediment properties suggests that fine and organic matter contents have strong contOSA formation and oil sedimentation. The more a sediment sample has abundant fines and organic matter, the highest the efficiency of this sediment to form OSAs that leads to higher oil sedimentation. As shown in Table 1, all sediments have a typical density of about 2.6 g/LUNA sediment which has the highest density of about 3.0 g/L. However, there are significant variations of fine and organic contents in the five sediments. SRM has the highest fine and orgmatter contents and was observed to produce the highest oil sedimentation. CRD sediment has the least fine content, but has the second high content of organic matter. As much less oil sedimentationwas measured with this sediment than with SRM, MRD and CI sediments, it appears that fine contentis much more important for OSA formation than organic matter content. This observation is confirmed also by the results obtained with CI sediment, which has the second smallest conceof organic matter and the second high concentration of fine among the five sediments studied. MRD sediment has a combination of both high fine content and organic matter content that make it second superior sediment for OSA formation and sedimentation of physically dispersed oil in this study.
Among the three oils, South Louisiana seems to cause higher oil sedimentation than the two otherThis is because South Louisiana oil disperses much more readily than the other two oils. As shown iTable 3, South Louisiana oil has a much lower viscosity and oil/brine interfacial tension than the Arabian Medium oil and slightly less than the Alaska North Slope oil. These two parameters are known to have strong control on droplet formation, which in turn affect the formation of OSAs.

Figure 14. Measured oil sedimentation (TPH in sinking OSAs) from experiments using the four sediments, the Arabian Medium crude oil and the two chemical dispersants. Normalized by the mass of oil used in the experiment (a,c,e) and by the mass of sediment forming OSAs (b,d,f).
Arabian Medium - Corexit 95000.1
1
10
100
0 50 100 150 200 250 300 350
Sediment Concentration (mg/L)
TPH
in O
SAs
(%)
Cook Inlet
Columbia River Delta
Mississippi River Delta
SRM-1941B
c
Arabian Medium - Corexit 95270.1
1
10
100
0 50 100 150 200 250 300 350
Sediment Concentration (mg/L)
TPH
in O
SAs
(%)
Cook Inlet
Columbia River Delta
Mississippi River Delta
SRM-1941B
e
Arabian Medium - Corexit 95001
10
100
0 50 100 150 200 250 300 350
Sediment Concentration (mg/L)
TPH
/Sed
imen
t in
OSA
s (%
)
Cook InletColumbia River DeltaMississippi River Delta
SRM-1941B
d
Arabian Medium - Corexit 95271
10
100
0 50 100 150 200 250 300 350
Sediment Concentration (mg/L)
TPH
/Sed
imen
t in
OSA
s (%
)
Cook Inlet
Columbia River Delta
Mississippi River Delta
SRM-1941B
f
Arabian Medium - No CD0.1
1
10
100
0 50 100 150 200 250 300 350
Sediment Concentration (mg/L)
TPH
in O
SAs
(%)
Cook Inlet
Columbia River Delta
Mississippi River Delta
SRM-1941B
a
Arabian Medium - No CD1
10
100
0 50 100 150 200 250 300 350
Sediment Concentration (mg/L)
TPH
/Sed
imen
t in
OSA
s (%
)
Cook Inlet
Columbia River Delta
Mississippi River Delta
SRM-1941B
b

Figure 15. Measured oil sedimentation (TPH in sinking OSAs) from experiments using the four sediments, the Alaska North Slope crude oil and the two chemical dispersants. Normalized by the mass of oil used in the experiment (a,c,e) and by the mass of sediment forming OSAs (b,d,f).
Alaska North Slope - Corexit 95000.1
1
10
100
0 50 100 150 200 250 300 350
Sediment Concentration (mg/L)
TPH
in O
SAs
(%)
Cook Inlet
Columbia River DeltaMississippi River Delta
SRM-1941B
c
Alaska North Slope - Corexit 95270.1
1
10
100
0 50 100 150 200 250 300 350
Sediment Concentration (mg/L)
TPH
in O
SAs
(%)
Cook InletColumbia River Delta
Mississippi River Delta
SRM-1941B
e
Alaska North Slope - Corexit 95001
10
100
0 50 100 150 200 250 300 350
Sediment Concentration (mg/L)
TPH
/Sed
imen
t in
OSA
s (%
)
Cook Inlet
Columbia River DeltaMississippi River Delta
SRM-1941B
d
Alaska North Slope - Corexit 95271
10
100
0 50 100 150 200 250 300 350
Sediment Concentration (mg/L)
TPH
/Sed
imen
t in
OSA
s (%
)
Cook InletColumbia River Delta
Mississippi River Delta
SRM-1941B
f
Alaska North Slope - No CD0.1
1
10
100
0 50 100 150 200 250 300 350
Sediment Concentration (mg/L)
TPH
in O
SAs
(%)
Cook InletColumbia River Delta
Mississippi River Delta
SRM-1941B
a
Alaska North Slope - No CD1
10
100
0 50 100 150 200 250 300 350
Sediment Concentration (mg/L)
TPH
/Sed
imen
t in
OSA
s (%
)
Cook InletColumbia River Delta
Mississippi River Delta
SRM-1941B
b

Figure 16. Measured oil sedimentation (TPH in sinking OSAs) from experiments using the four sediments, the South Louisiana crude oil and the two chemical dispersants. Normalized by the mass of oil used in the experiment (a,c,e) and by the mass of sediment forming sinking OSAs (b,d,f).
South Louisiana - Corexit 95000.1
1
10
100
0 50 100 150 200 250 300 350
Sediment Concentration (mg/L)
TPH
in O
SAs
(%)
Cook Inlet
Columbia River DeltaMississippi River Delta
SRM-1941B
c
South Louisiana - Corexit 95270.1
1
10
100
0 50 100 150 200 250 300 350
Sediment Concentration (mg/L)
TPH
in O
SAs
(%)
Cook Inlet
Columbia River DeltaMississippi River DeltaSRM-1941B
e
South Louisiana - Corexit 95001
10
100
1000
0 50 100 150 200 250 300 350
Sediment Concentration (mg/L)
TPH
/Sed
imen
t in
OSA
s (%
)
Cook Inlet
Columbia River DeltaMississippi River Delta
SRM-1941B
d
South Louisiana - Corexit 95271
10
100
0 50 100 150 200 250 300 350
Sediment Concentration (mg/L)
TPH
/Sed
imen
t in
OSA
s (%
)
Cook Inlet
Columbia River DeltaMississippi River DeltaSRM-1941B
f
South Louisiana - No CD0.1
1
10
100
0 50 100 150 200 250 300 350
Sediment Concentration (mg/L)
TPH
in O
SAs
(%)
Cook Inlet
Columbia River DeltaMississippi River DeltaSRM-1941B
a
South Louisiana - No CD1
10
100
0 50 100 150 200 250 300 350
Sediment Concentration (mg/L)
TPH
/Sed
imen
t in
OSA
s (%
)
Cook InletColumbia River Delta
Mississippi River DeltaSRM-1941B
b

Table 5. Maximum measured percentage of oil sedimentation.
Oil Type Sediment Type Dispersant Type
AM ANS SL
UNA No Chemical DispersantCorexit 9500 Corexit 9527
0.16--
0.13--
0.17 - -
CI No Chemical DispersantCorexit 9500 Corexit 9527
13.639.336.0
24.044.938.8
36.5 40.1 43.2
CRD No Chemical DispersantCorexit 9500 Corexit 9527
3.017.99.0
6.816.012.4
7.1 7.3 6.8
MRD No Chemical DispersantCorexit 9500 Corexit 9527
15.156.459.5
23.558.234.2
47.5 64.8 55.9
SRM No Chemical DispersantCorexit 9500 Corexit 9527
42.856.536.7
36.849.235.2
51.4 58.4 37.7
Data on oil sedimentation (mass of TPH) shown on Figures 13a-16a were normalized by the mass of the trapping sediments that formed negatively buoyant OSAs. Results are shown on Figures 13b-16b. Except for the UNA and CRD sediments, most of the data showed the presence of a maximum around sediment concentration of 100 mg/L, which is equivalent to ½ the concentration of oil used in this project. This is considered as a critical sediment concentration at which significant oil sedimentation is expected to occur. Data from the present study were compared with the data published by Guyomarch et al. (1999) and analysed further. We found that the so-called critical sediment concentration is a function of the oil density and concentration. The following empirical relationship was proposed to estimate the critical sediment concentration for oil sedimentation (Khelifa et al. 2007a):
Csor = 1367 exp(-9.5 ρoil/ ρseawater) (1)
where Csor represent the ratio between the critical sediment concentration and the concentration of oil, ρoil the density of oil and ρseawater the density of the seawater where the spill occurs.
Sediment density is expected to affect Csor. This was not shown in the data and in the proposed relationship (equation 1), simply because all the experiments considered in the analysis were natural sediments that have typical density of about 2.6 g/L.
4.2.3 Results obtained with chemical dispersant Variations of measured concentrations of chemically dispersed oil (TPH) in negatively buoyant OSAs are shown on Figures 13c-16c for Corexit 9500 and 13e-16e for Corexit 9527 obtained with CI, CRD, MRD and SRM sediments. The same data normalized by the mass of the trapping sediments that formed negatively buoyant OSAs are shown on Figures 13d-16d for Corexit 9500 and 13f-16f for Corexit 9527. No experiments were conducted with UNA sediment and chemically dispersed oils. Values of the maximum percentage of oil sedimentation obtained with chemical dispersants are summarized in Table 5.
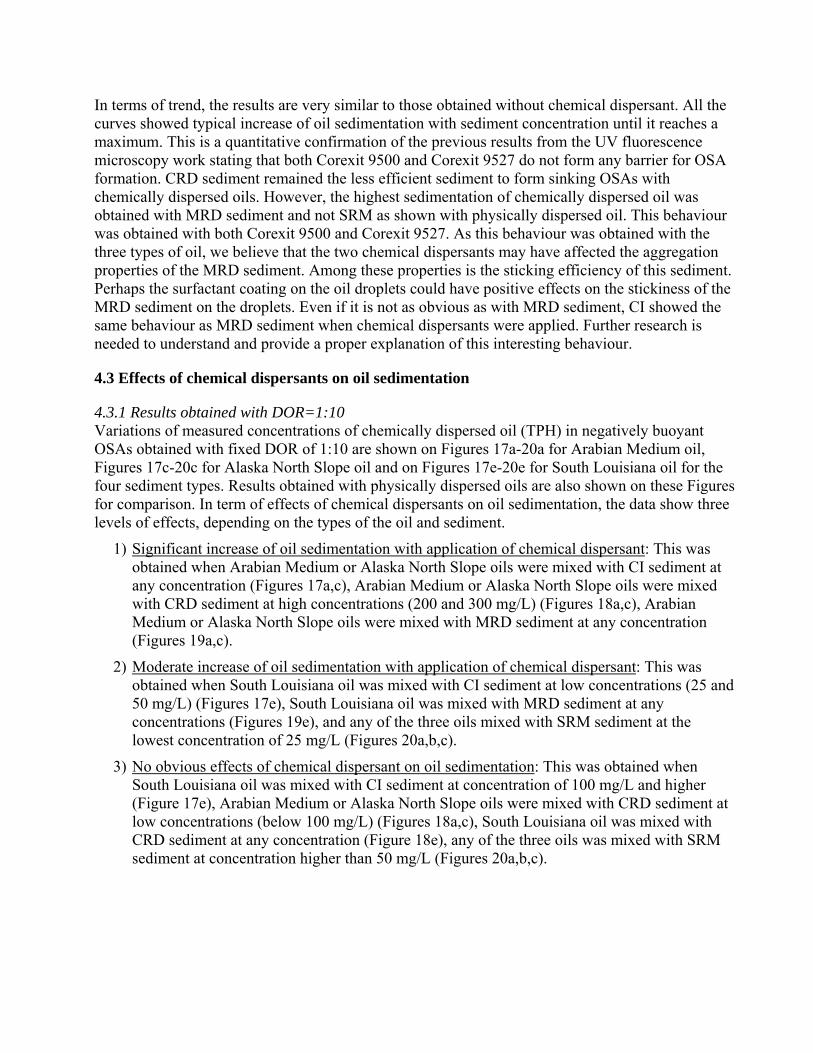
In terms of trend, the results are very similar to those obtained without chemical dispersant. All the curves showed typical increase of oil sedimentation with sediment concentration until it reaches a maximum. This is a quantitative confirmation of the previous results from the UV fluorescence microscopy work stating that both Corexit 9500 and Corexit 9527 do not form any barrier for OSA formation. CRD sediment remained the less efficient sediment to form sinking OSAs with chemically dispersed oils. However, the highest sedimentation of chemically dispersed oil was obtained with MRD sediment and not SRM as shown with physically dispersed oil. This behaviour was obtained with both Corexit 9500 and Corexit 9527. As this behaviour was obtained with the three types of oil, we believe that the two chemical dispersants may have affected the aggregation properties of the MRD sediment. Among these properties is the sticking efficiency of this sediment. Perhaps the surfactant coating on the oil droplets could have positive effects on the stickiness of the MRD sediment on the droplets. Even if it is not as obvious as with MRD sediment, CI showed the same behaviour as MRD sediment when chemical dispersants were applied. Further research is needed to understand and provide a proper explanation of this interesting behaviour.
4.3 Effects of chemical dispersants on oil sedimentation
4.3.1 Results obtained with DOR=1:10 Variations of measured concentrations of chemically dispersed oil (TPH) in negatively buoyant OSAs obtained with fixed DOR of 1:10 are shown on Figures 17a-20a for Arabian Medium oil, Figures 17c-20c for Alaska North Slope oil and on Figures 17e-20e for South Louisiana oil for the four sediment types. Results obtained with physically dispersed oils are also shown on these Figures for comparison. In term of effects of chemical dispersants on oil sedimentation, the data show three levels of effects, depending on the types of the oil and sediment.
1) Significant increase of oil sedimentation with application of chemical dispersant: This was obtained when Arabian Medium or Alaska North Slope oils were mixed with CI sediment at any concentration (Figures 17a,c), Arabian Medium or Alaska North Slope oils were mixed with CRD sediment at high concentrations (200 and 300 mg/L) (Figures 18a,c), Arabian Medium or Alaska North Slope oils were mixed with MRD sediment at any concentration (Figures 19a,c).
2) Moderate increase of oil sedimentation with application of chemical dispersant: This was obtained when South Louisiana oil was mixed with CI sediment at low concentrations (25 and 50 mg/L) (Figures 17e), South Louisiana oil was mixed with MRD sediment at any concentrations (Figures 19e), and any of the three oils mixed with SRM sediment at the lowest concentration of 25 mg/L (Figures 20a,b,c).
3) No obvious effects of chemical dispersant on oil sedimentation: This was obtained when South Louisiana oil was mixed with CI sediment at concentration of 100 mg/L and higher (Figure 17e), Arabian Medium or Alaska North Slope oils were mixed with CRD sediment at low concentrations (below 100 mg/L) (Figures 18a,c), South Louisiana oil was mixed with CRD sediment at any concentration (Figure 18e), any of the three oils was mixed with SRM sediment at concentration higher than 50 mg/L (Figures 20a,b,c).

Figure 17. Comparison between oil sedimentation (TPH in sinking OSAs) measured without and with chemical dispersants using Cook Inlet sediment and the three crude oils. Normalized by the mass of oil used in the experiment (a,c,e) and by the mass of trapping sediment in OSAs (b,d,f).
Arabian Medium/CI0.1
1
10
100
0 50 100 150 200 250 300 350
Sediment Concentration (mg/L)
TPH
in O
SAs
(%)
No DispersantCorexit 9500Corexit 9527
a
Alaska North Slope/CI0.1
1
10
100
0 50 100 150 200 250 300 350
Sediment Concentration (mg/L)
TPH
in O
SAs
(%)
No DispersantCorexit 9500Corexit 9527
c
South Louisiana/CI0.1
1
10
100
0 50 100 150 200 250 300 350
Sediment Concentration (mg/L)
TPH
in O
SAs(
%)
No DispersantCorexit 9500Corexit 9527
e
Arabian Medium/CI1
10
100
0 50 100 150 200 250 300 350
Sediment Concentration (mg/L)
TPH
/Sed
imen
t in
OSA
s (%
)
No DispersantCorexit 9500Corexit 9527
b
Alaska North Slope/CI1
10
100
0 50 100 150 200 250 300 350
Sediment Concentration (mg/L)
TPH
/Sed
imen
t in
OSA
s (%
)
No DispersantCorexit 9500Corexit 9527
d
South Louisiana/CI1
10
100
0 50 100 150 200 250 300 350
Sediment Concentration (mg/L)
TPH
/Sed
imen
t in
OSA
s (%
)
No DispersantCorexit 9500Corexit 9527
f

Figure 18. Comparison between oil sedimentation (TPH in sinking OSAs) measured without and with chemical dispersants using Columbia River Delta sediment and the three crude oils. Normalized by the mass of oil used in the experiment (a,c,e) and by the mass of trapping sediment in sinking OSAs (b,d,f).
Arabian Medium/CRD0.1
1
10
100
0 50 100 150 200 250 300 350
Sediment Concentration (mg/L)
TPH
in O
SAs
(%)
No DispersantCorexit 9500Corexit 9527
a
Alaska North Slope/CRD0.1
1
10
100
0 50 100 150 200 250 300 350
Sediment Concentration (mg/L)
TPH
in O
SAs
(%)
No DispersantCorexit 9500Corexit 9527
c
South Louisiana/CRD0.1
1
10
100
0 50 100 150 200 250 300 350
Sediment Concentration (mg/L)
TPH
in O
SAs
(%)
No DispersantCorexit 9500Corexit 9527
e
Arabian Medium/CRD1
10
100
0 50 100 150 200 250 300 350
Sediment Concentration (mg/L)
TPH
/Sed
imen
t in
OSA
s (%
)
No DispersantCorexit 9500Corexit 9527
b
Alaska North Slope/CRD1
10
100
0 50 100 150 200 250 300 350
Sediment Concentration (mg/L)
TPH
/Sed
imen
t in
OSA
s (%
)
No DispersantCorexit 9500Corexit 9527
d
South Louisiana/CRD1
10
100
0 50 100 150 200 250 300 350
Sediment Concentration (mg/L)
TPH
/Sed
imen
t in
OSA
s (%
)
No DispersantCorexit 9500Corexit 9527
f
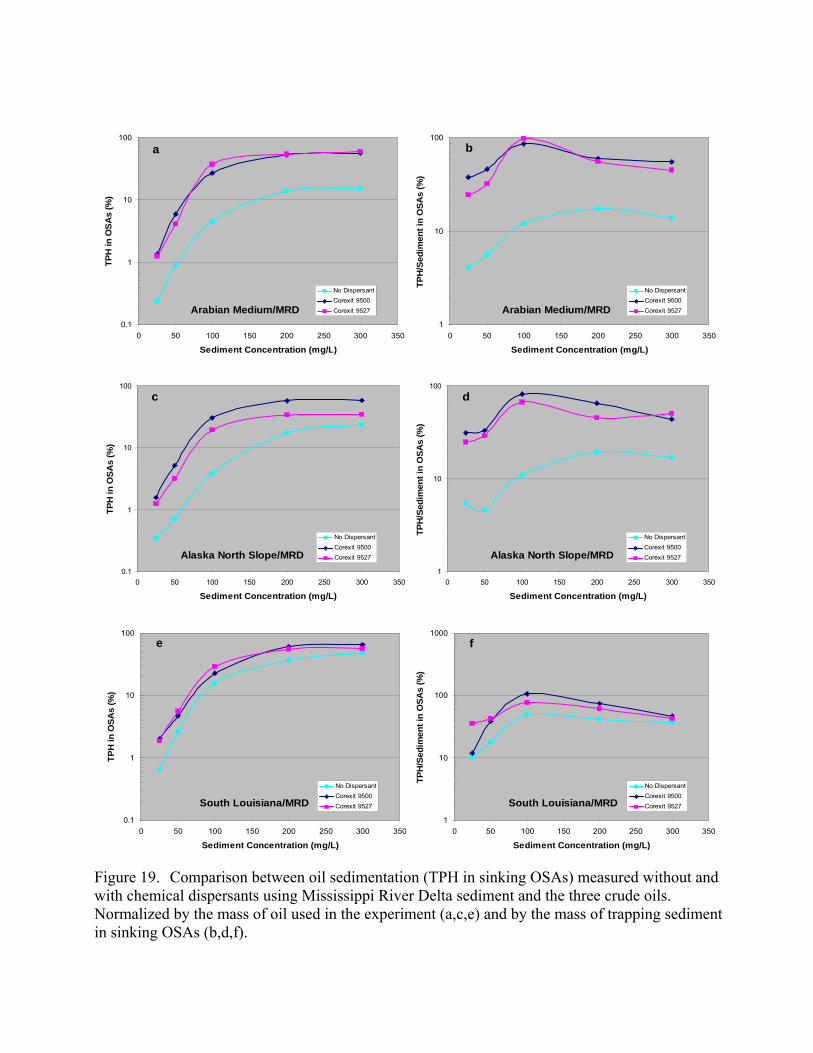
Figure 19. Comparison between oil sedimentation (TPH in sinking OSAs) measured without and with chemical dispersants using Mississippi River Delta sediment and the three crude oils. Normalized by the mass of oil used in the experiment (a,c,e) and by the mass of trapping sediment in sinking OSAs (b,d,f).
Arabian Medium/MRD0.1
1
10
100
0 50 100 150 200 250 300 350
Sediment Concentration (mg/L)
TPH
in O
SAs
(%)
No DispersantCorexit 9500Corexit 9527
a
Alaska North Slope/MRD0.1
1
10
100
0 50 100 150 200 250 300 350
Sediment Concentration (mg/L)
TPH
in O
SAs
(%)
No DispersantCorexit 9500Corexit 9527
c
South Louisiana/MRD0.1
1
10
100
0 50 100 150 200 250 300 350
Sediment Concentration (mg/L)
TPH
in O
SAs
(%)
No DispersantCorexit 9500Corexit 9527
e
Arabian Medium/MRD1
10
100
0 50 100 150 200 250 300 350
Sediment Concentration (mg/L)
TPH
/Sed
imen
t in
OSA
s (%
)
No DispersantCorexit 9500Corexit 9527
b
Alaska North Slope/MRD1
10
100
0 50 100 150 200 250 300 350
Sediment Concentration (mg/L)
TPH
/Sed
imen
t in
OSA
s (%
)
No DispersantCorexit 9500Corexit 9527
d
South Louisiana/MRD1
10
100
1000
0 50 100 150 200 250 300 350
Sediment Concentration (mg/L)
TPH
/Sed
imen
t in
OSA
s (%
)
No DispersantCorexit 9500Corexit 9527
f

Figure 20. Comparison between oil sedimentation (TPH in sinking OSAs) measured without and with chemical dispersants using SRM-1941b sediment and the three crude oils. Normalized by the mass of oil used in the experiment (a,c,e) and by the mass of trapping sediment in OSAs (b,d,f).
Arabian Medium/SRM-1941B0.1
1
10
100
0 50 100 150 200 250 300 350
Sediment Concentration (mg/L)
TPH
in O
SAs
(%)
No DispersantCorexit 9500Corexit 9527
a
Alaska North Slope/SRM-1941B0.1
1
10
100
0 50 100 150 200 250 300 350
Sediment Concentration (mg/L)
TPH
in O
SAs
(%)
No DispersantCorexit 9500Corexit 9527
c
South Louisiana/SRM-1941B0.1
1
10
100
0 50 100 150 200 250 300 350
Sediment Concentration (mg/L)
TPH
in O
SAs
(%)
No DispersantCorexit 9500Corexit 9527
e
Arabian Medium/SRM-1941B1
10
100
0 50 100 150 200 250 300 350
Sediment Concentration (mg/L)
TPH
/Sed
imen
t in
OSA
s (%
)
No DispersantCorexit 9500Corexit 9527
b
Alaska North Slope/SRM-1941B1
10
100
0 50 100 150 200 250 300 350
Sediment Concentration (mg/L)
TPH
/Sed
imen
t in
OSA
s (%
)
No DispersantCorexit 9500Corexit 9527
d
South Louisiana/SRM-1941B1
10
100
0 50 100 150 200 250 300 350
Sediment Concentration (mg/L)
TPH
/Sed
imen
t in
OSA
s (%
)
No DispersantCorexit 9500Corexit 9527
f

These three observations are valid for results obtained with Corexit 9500 and Corexit 9527. Overall, enhancement of oil sedimentation due to application of chemical dispersant was observed with CI, CRD and MRD sediments mixed with viscous oils. None or moderate effects of chemical dispersant on oil sedimentation was observed with these three sediments and the less viscous South Louisiana oil, or SRM sediment and any of the studied oils.
While enhancement of oil sedimentation with chemically dispersed oil was expected due to enhancement of oil dispersion, the small or no obvious difference found between results obtained with and without chemical dispersant was not expected, especially for those obtained with SRM sediment which is superior sediment for OSA formation, as discussed in the previous section. Deeper examination of the data suggests that the observed no effect of chemical dispersant on oil sedimentation is due, possibly, to the three following factors:
• the high mixing energy used in this study. The high mixing energy helps formation of small oil droplets without chemical dispersant. This was discussed in section 4.1.2 and is shown on Figures 10 and 11. The droplets are not as small as those obtained with chemical dispersant, but there are small enough to be dispersed in the water column. This step of droplet formation is essential for OSA formation and, hence, oil sedimentation,
• the abundance of fine grains and organic matter in the SRM sediment (56% and 10.6% in weight, respectively). If oil droplets are formed due to high mixing energy and not to application of chemical dispersants, the remaining key factor that controls formation of sinking OSAs is the abundance (concentration) of sediment fines in suspension. Several studies have shown that sediment fines less than about 5 microns in size are superior candidates for OSA formation (Payne et al., 1987, 1989, 2003; Ajijolaiya, 2004; Khelifa et al., 2004, 2005c; Ali, 2006). Results obtained with SRM sediment (Figure 20) suggest that at sediment concentration higher than 50 mg/L, there are enough fines in the reaction chambers to sink the suspended oil droplets. The same remark applies for the CI sediment (Figure 17e).
• enhancement of aggregation properties of MRD and CI sediments due to application of chemical dispersants. Among these properties is the sticking efficiency of these sediments following sediment-sediment and/or sediment-oil droplet collisions. Perhaps the surfactant coating on the oil droplets could have positive effects on the stickiness of the grains of the MRD and CI sediments to the droplets. However, as discussed in the previous section, further research is needed to confirm this explanation.
4.3.2 Results obtained with various DOR Measured variations of oil sedimentation (TPH in negatively buoyant OSAs) with DOR are shown on Figure 21. The experiments were performed with Alaska North Slope, Corexit 9500 and the four sediment types at a constant concentration of 200 mg/L. Experiments with SRM sediment were repeated with the three oil types. Results obtained with CI, CRD and MRD sediments show significant increases of oil sedimentation when chemical dispersant were applied at the three DOR values (Figures 21d,e,f). Enhancement of oil sedimentation with SRM sediment was obtained at DOR of 1:40 and 1:20. Overall, the data show that oil sedimentation is maximal at a DOR value of 1:20. For better illustration, increase of oil sedimentation due to application of chemical dispersant was calculated using the following expression:
Increase of oil sedimentation = 100*(TPHCD-TPHNoCD)/TPHNoCD (2)

where TPHCD and TPHNoCD represent TPH (oil) trapped in negatively buoyant OSAs formed with and without chemical dispersant, respectively. The results are shown in Figure 22.
Figure 21. Measured variations of oil sedimentation (TPH in sinking OSAs) with DOR. These results were obtained from experiments with Corexit 9500 at various DORs and using a constant sediment concentration of 200 mg/L. Values of the measured TPH were normalized by the mass (50 mg) of the oil used in the experiments
In contrast to what was obtained with the SRM sediment at DOR 1:10 and discussed in the previous section, data on Figures 22a,b,c showed significant increases (up to about 60 %) of oil sedimentation with this sediment at DOR 1:20 and 1:40. The slight decrease obtained at 1:10 DOR is small and is within the error limits. Much higher increases of oil sedimentation were measured with MRD (between 217 and 230%, Figure 22d), CI (175 and 301%, Figure 22e) and CRD sediment (314 and 360%, Figure 22f). All data showed that oil sedimentation is maximal when
a: SRM/Arabian Medium
0
10
20
30
40
50
60
70
No CD 1:40 1:20 1:10
Dispersant-to-Oil Ratio
TPH
in O
SAs
(%)
b: SRM/Alaska North Slope
0
10
20
30
40
50
60
70
No CD 1:40 1:20 1:10
Dispersant-to-Oil Ratio
TPH
in O
SAs
(%)
c: SRM/South Louisiana
0
10
20
30
40
50
60
70
No CD 1:40 1:20 1:10
Dispersant-to-Oil Ratio
TPH
in O
SAs
(%)
d: MRD/Alaska North Slope
0
10
20
30
40
50
60
70
No CD 1:40 1:20 1:10
Dispersant-to-Oil Ratio
TPH
in O
SAs
(%)
e: CI/Alaska North Slope
0
10
20
30
40
50
60
70
No CD 1:40 1:20 1:10
Dispersant-to-Oil Ratio
TPH
in O
SAs
(%)
f: CRD/Alaska North Slope
0
10
20
30
40
50
60
70
No CD 1:40 1:20 1:10
Dispersant-to-Oil Ratio
TPH
in O
SAs
(%)

DOR is 1:20, except for MRD where oil sedimentation is slightly (within the uncertainty range) higher at 1:10 than at 1:20.
These observations correlate very well with those made on formation of oil droplets discussed in section 4.1.2 above and illustrated on Figures 8-11. It was found that the DOR affects size distribution of chemically dispersed droplets. The smallest droplets were obtained at DOR of 1:20. As such, this finding is a strong support to the initial hypothesis of the project where oil sedimentation was expected to increase with chemically dispersed oil due to the decrease of oil droplet size. In other word, the more effective the chemical dispersant the more oil sedimentation is expected if sufficient sediment fines and mixing energy are available in the water column.
Figure 22. Measured increase of oil sedimentation due to application of chemical dispersant. Values of the “Increase of Oil Sedimentation” were calculated using the data shown on Figure 21 and the following formula: 100*(TPHCD-TPHNoCD)/TPHNoCD, where TPHCD and TPHNoCD represent TPH (oil) measured in sinking OSAs formed with and without application chemical dispersant, respectively.
a: SRM/Arabian Medium
-15
0
15
30
45
60
1:40 1:20 1:10
Dispersant-to-Oil Ratio
Incr
ease
of O
il Se
dim
enta
tion
(%)
b: SRM/Alaska North Slope
-15
0
15
30
45
60
1:40 1:20 1:10
Dispersant-to-Oil Ratio
Incr
ease
of O
il Se
dim
enta
tion
(%)
c: SRM/South Louisiana
-15
0
15
30
45
60
1:40 1:20 1:10
Dispersant-to-Oil Ratio
Incr
ease
of O
il Se
dim
enta
tion
(%)
d: MRD/Alaska North Slope
0
100
200
300
400
1:40 1:20 1:10Dispersant-to-Oil Ratio
Incr
ease
of O
il Se
dim
enta
tion
(%)
e: CI/Alaska North Slope
0
100
200
300
400
1:40 1:20 1:10
Dispersant-to-Oil Ratio
Incr
ease
of O
il Se
dim
enta
tion
(%)
f: CRD/Alaska North Slope
0
100
200
300
400
1:40 1:20 1:10
Dispersant-to-Oil Ratio
Incr
ease
of O
il Se
dim
enta
tion
(%)

4.4 Physical properties of OSAs
4.4.1 OSA’s size distribution Measured size distributions of OSAs formed with the four sediments at 100 mg/L concentration and the Arabian Medium and South Louisiana oils without and with Corexit 9500 at 1:10 DOR are shown on Figures 23 and 24. The curves show typical distribution of sediment flocs (Khelifa and Hill, 2006a). Compared to no oil conditions, all the data show a shift of OSA size distributions to the large flocs (blue and red curves shifting to the right side on Figures 23 and 24). OSAs obtained with Arabian Medium oil and Corexit 9500 contain larger flocs than those obtained without chemical dispersant. The same observation applies for median size (Table 6). This suggests that presence of small droplets in sediment flocs enhance growth of the flocs by enhancing their particle-particle stickiness.
Guyomarch et al. (2002) studied variations of OSA size distribution with sediment concentration. The results they obtained with sediment concentration of 2.0 g/L (oil-to-sediment close to 2 as in our study) compare well with the results of this study shown on Figures 23 and 24. However, OSA sizes measured in this study are not in the same range as those measured by Li et al. (2007) under breaking wave conditions. This is due, perhaps, to the difference in the mixing conditions used in the studies, as it is well established that mixing energy controls sediment floc size in aquatic environment. It may also due to differences in the oil-to-sediment ratios that is much more difficult to control in a wave thank than in bench scale experiments.
Table 6. Measured maximum and median sizes of OSAs. Sediment/Oil Mixture
Sediment only Sediment + AM oil
Sediment + AM oil + Corexit 9500
Sediment + SL oil
Sediment + SL oil + Corexit 9500
Sediment Type
median max median max median max median max median max CI 129 372 146 270 179 436 177 419 176 342 CRD 108 300 129 471 249 566 196 743 218 567 MRD 171 429 241 525 241 667 298 701 275 746 SRM 93 187 116 220 123 228 165 342 88 320
4.4.2 OSA’s settling velocity Data related to settling velocity of OSAs measured with the four sediment types without and with chemical dispersants are shown in Figures 25 and 26 for Arabian Medium and South Louisiana oils, respectively. The data were compared with those obtained with sediment only without oil or chemical dispersant. The modified Stokes Law, which is very often used to describe the settling process of natural particles, is also shown in these figures for comparison. From the author’s knowledge, data shown in Figures 25 and 26 represent the first information that exists in the literature regarding the settling process of OSAs. Analysis of the data shown on these figures revealed that:
• many OSAs have settling velocities very similar to those of sediment flocs of similar size (blue and red dots shown in the area of the black dots in Figures 25 and 26). We believe that these OSAs contain no or very few oil droplets and, thus, they behave like sediment flocs. This interpretation is well corroborated by the UV fluorescence microscopy observations where OSAs of different oil (droplets) contents were observed under the same slide (Figure 12).

Figure 23. Measured size distributions of OSAs formed with the four sediments at 100 mg/L concentration and the Arabian Medium oil without and with Corexit 9500 at 1:10 DOR.
• a group of many OSAs have settling velocity much smaller than sediment flocs of the same size (encircled blue and red dots on Figures 25 and 26 compared to the black dots for the same size). We believe that these OSAs contain many oil droplets in their body, as shown in Figure 12. Reduction of their settling velocity compared to those of sediment flocs of the same size was expected. It is caused by the low density of oil droplets (about 0.9 compared to about 2.6 g/mL for sediment grains) trapped into OSAs. For most sediment types (except CRD sediment), measured OSA settling velocity is about 2 to 3 times less than those of pure sediment flocs (black dots). Excluding the data obtained with CRD sediment, the average settling velocity of the encircled data (OSAs) in Figures 25 and 26 varies between 0.85 and 1.6 mm/s, depending on the sediment and oil types. However, most of the averaged settling velocities are around 1 mm/s. The average size of OSAs shown by the encircled data is between 150 and 400 microns. One notes that Hill et al., 1998) suggested a similar settling velocity for large sediment flocs despite observed variability in size.

• data obtained with CRD sediment showed little difference in settling velocity measured with and without oil. This is because very few OSAs are formed with CRD as discussed in sections 4.2 and 4.3.
• Stokes Law is not an appropriate model to describe settling process of OSAs. It overestimates settling velocity of OSAs and sediment flocs. This finding is in agreement with recent findings related to modelling of settling process of sediment flocs (Khelifa and Hill, 2006b).
Figure 24. Measured size distributions of OSAs formed with the four sediments at 100 mg/L concentration and the South Louisiana oil without and with Corexit 9500 at 1:10 DOR.
4.4.3 OSA’s density Effective density of OSAs was obtained using size and settling velocity data shown in Figures 23 to 26 and the modified Stokes’ Law, as discussed in Appendix E. Results are shown in Figures 27 and 28. As for settling velocity, the data on effective density of OSAs were compared with those obtained with sediment only without oil and no chemical dispersant. From the author’s knowledge, data shown in Figures 27 and 28 represent the first information that exists in the literature regarding the effective density of OSAs. Because the effective density is almost proportional to the settling velocity, analysis of the data shown on these figures revealed similar observations as above. These include:

Figure 25. Measured settling velocities of OSAs formed with the four sediments at 100 mg/L concentration and the Arabian Medium oil without and with Corexit 9500 at 1:10 DOR. The data
lack
e
ve
are compared to those obtained without oil (sediment flocs) and without chemical dispersant (bdots).
• many OSAs have effective densities very similar to those of sediment flocs of similar size (bluand red dots shown in the area of the black dots in Figures 27 and 28). We believe that these OSAs contain very few or no oil droplets and, thus, they behave like sediment flocs. This interpretation is well corroborated by the UV fluorescence microscopy observations where OSAs of different oil (droplets) contents were observed under the same slide (Figure 12).
• a group of many OSAs have effective density much smaller than sediment flocs of the samesize (encircled blue and red dots in Figures 27 and 28 compared to the black dots). We beliethat these OSAs contain many oil droplets in their body, as shown in Figure 12. Reduction oftheir effective density compared to those of sediment flocs of the same size was expected. It is caused by the low density of oil droplets (about 0.9 compared to about 2.6 g/mL for sediment grains) trapped into OSAs. For most sediment types (except CRD sediment), measured OSA effective density is about 2 to 3 times less than those of pure sediment flocs (black dots). Excluding the data obtained with CRD sediment, the average effective density of the

encircled data (OSAs) in Figures 27 and 28 varies between 25 and 80 g/L depending on the sediment and oil types. However, most of the averaged effective densities are around 50 gThe average size of OSAs shown by the encircled data is also between 150 and 400 mas for the settling velocity data shown in Figures 25 and 26.
• The lowest OSA’s effective density of about 25 g/L was obtained with MRD sediment. One notes that, among the four sediments used in this study, MRD sediment has the smallest density and formed the largest OSAs.
/L. icrons,
It appears that presence of even small amount of oil in
• data obtained with CRD sediment showed formation of big OSAs that are slightly lighter thansediment flocs. As mentioned above and in sections 4.2 and 4.3, this is because very few OSAs are formed with CRD sediment.the flocs enhances the stickiness of sediment grains, which in turn helps building up large flocs when oil is present.
Figure 26. Measured settling velocities of OSAs formed with the four sediments at 100 mg/L concentration and the South Louisiana oil without and with Corexit 9500 at 1:10 DOR. The data are compared to those obtained without oil (sediment flocs) and without chemical dispersant (black dots).

Figure 27. Measured effective density of OSAs formed with the four sediments at 100 mg/L concentration and the Arabian Medium oil without and with Corexit 9500 at 1:10 DOR. The data are compared to those obtained without oil (sediment flocs) and without chemical dispersant (black dots). Effective density of an object in seawater = density of the object – density of the seawater.
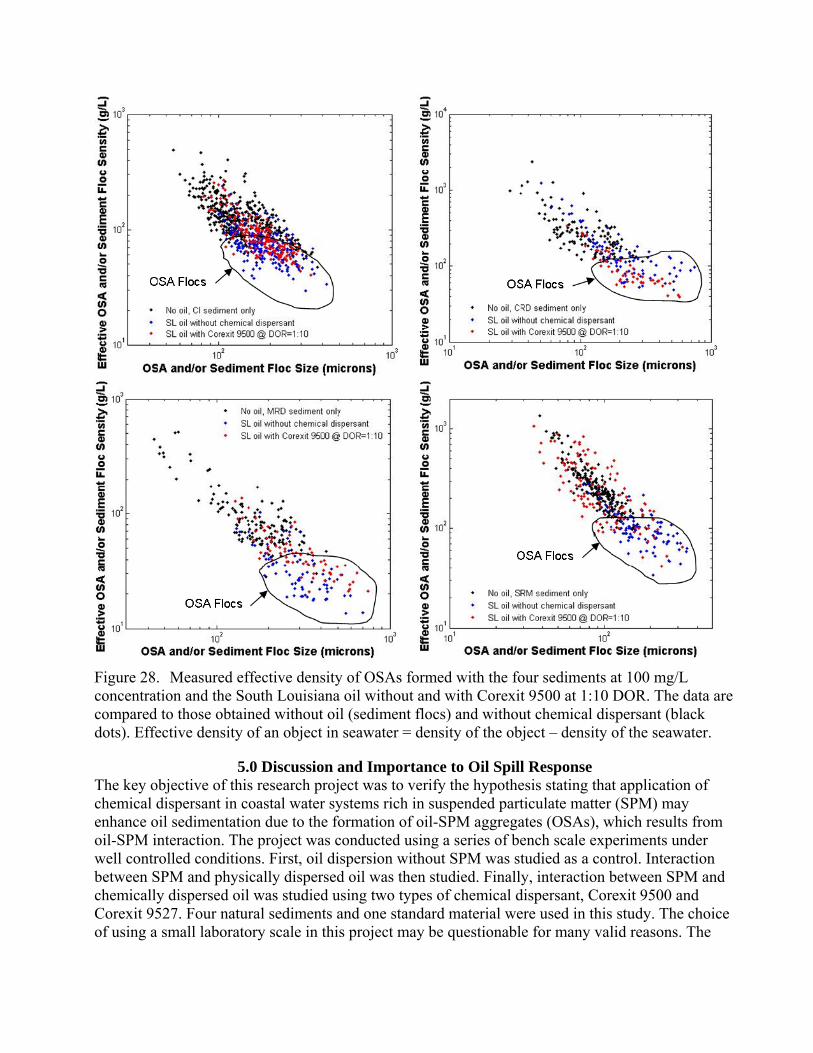
Figure 28. Measured effective density of OSAs formed with the four sediments at 100 mg/L concentration and the South Louisiana oil without and with Corexit 9500 at 1:10 DOR. The data are compared to those obtained without oil (sediment flocs) and without chemical dispersant (black dots). Effective density of an object in seawater = density of the object – density of the seawater.
5.0 Discussion and Importance to Oil Spill Response The key objective of this research project was to verify the hypothesis stating that application of chemical dispersant in coastal water systems rich in suspended particulate matter (SPM) may enhance oil sedimentation due to the formation of oil-SPM aggregates (OSAs), which results from oil-SPM interaction. The project was conducted using a series of bench scale experiments under well controlled conditions. First, oil dispersion without SPM was studied as a control. Interaction between SPM and physically dispersed oil was then studied. Finally, interaction between SPM and chemically dispersed oil was studied using two types of chemical dispersant, Corexit 9500 and Corexit 9527. Four natural sediments and one standard material were used in this study. The choice of using a small laboratory scale in this project may be questionable for many valid reasons. The

main one is extrapolation of the results to the real conditions. But, the complexity of the oil-SPM interaction and the huge number of the controlling factors suggest that the chances to getting quantitative understanding from large or field scale trials without prior small scale testing are slim. It was also proven from past R&D projects, especially those related to OSA formation conducted by the authors and many other scientists, that small scale laboratory simulations provide realistic and practical results. They have the advantages to control experimental conditions easily and to use precise measurement techniques, as was shown in this project.
Parameters that were varied in this study are: type of crude oil, type (origin) of the natural sediment, concentration of sediment, type of chemical dispersant and dispersant-to-oil ratio. Parameters that were kept constant are oil concentration, temperature (15 oC), salinity (artificial seawater), and mixing energy. Findings of the project concern many key areas of oil spill response including: oil dispersion, oil-SPM interaction, oil sedimentation, application of chemical dispersant in coastal waters, oil spill modelling, and natural recovery of oiled shorelines. These are discussed further below.
5.1 Oil Dispersion As discussed above, oil dispersion was studied first in this project to quantify the effects of chemical dispersant on oil properties and droplet formation. The findings that we consider important for oil spill response are:
• Application of Corexit 9500 or Corexit 9527 produces a significant decrease (more than five times) of oil-brine interfacial tensions (IFTs). The values of IFTs were below the detection limit of the Krüss K10 Tensiometer (which is based on the Du Noüy ring method), i.e. <3.6 mN/m, for DOR values ranging from 1:200 to 1:10. As IFT is well recognized as one of the key oil properties that control droplet formation, we believe that proper measurement of IFT reduction using more precise methods, such as the spinning drop procedure, help extend prior understanding of oil dispersion and dispersant effectiveness. This is because reduction of IFT is a direct signature of the effects of dispersant on droplet formation, while reduction of oil droplet size distribution, very often used to evaluate dispersant effectiveness, is a result of combined effects of dispersant effect on oil properties and mixing energy.
• The highest effectiveness (smallest size distribution of oil droplets and less resurfacing after suppression of the mixing energy) of Corexit 9500 on the dispersion of Alaska North Slope crude was obtained at DOR=1:20. We believe that reduction of the IFT reach its maximum at this DOR. Higher DOR reduces effectiveness of Corexit 9500. The size of droplet population that remains in suspension about one day after suppression of the mixing energy ranges from 0.5 to 15 μm at DOR=1:20. At DOR of 1:5, 1:10 and 1:40 very little oil remain in suspension, which suggests than coalescence between chemically dispersed droplets occurs and enhance oil resurfacing even at these high values of DOR. The median size of oil droplets that remain in suspension is about 2 μm regardless of the concentration of dispersant (DOR).
• Measured size of chemically dispersed oil droplets varies from 0.5 to 50 μm, depending on the DOR and the time after suppression of the mixing energy.
5.2 Oil-SPM Interaction Results of this project on oil-SPM interaction extended the prior quantitative understanding of OSA formation without chemical dispersant. They showed that:

• Fine content in natural sediments is a key factor that enhances oil-SPM interaction leading to formation of OSAs. Fine content was defined in this study as the weight percentage of sediment grains less than 5.3 μm in a sediment sample. Organic matter content is a second order factor that enhances formation of OSAs.
• CI, MRD and SRM natural sediments which contain more than 30% of fines are superior sediments for oil-SPM interaction and hence, OSA formation. SRM sediment, which contains the highest percentage of fines (56%) and the highest organic matter content (11%) forms more OSAs than the other sediments. UNA sediment does not contain any fines and does not form OSAs. It has less than 1% of organic matter content. The mass of oil that reacts with CRD sediment, which contains less than 30% of fines, is less than 3% for Arabian Medium, 7% for Alaska North Slope and 8% for South Louisiana crude, even at high sediment concentration of 300 mg/L.
• When natural sediments contain more than 40% fines, organic matter content becomes a dominant factor in oil-SPM interaction and thus, OSA formation.
• All the three oils, Arabian Medium, Alaska North Slope and South Louisiana, react with CI, CRD, MRD, SRM sediments and form OSAs. South Louisiana, which is the less viscous oil and thus, the easiest oil to disperse naturally, forms more OSAs than the two other oils. The mass of oil that reacts with this oil varies from 10 to 36% for CI sediment, 3 to 7% for CRD sediment, 16 to 48% for MRD sediment, and 17 to 51% for SRM sediment when sediment concentration increases from 100 to 300 mg/L.
• Oil-SPM interaction causes oil sedimentation. The findings are discussed in the next sections.
5.3 Oil Sedimentation Results discussed in this section relate to oil sedimentation without application of chemical dispersant. Effects of chemical dispersant on oil sedimentation are discussed in the next section.
• All the OSAs measured in this project were negatively buoyant. On average, the density of OSAs is about 50 mg/L higher than the density of the seawater. As such, the results showed that OSA formation is one of the key processes that control oil sedimentation, especially when an initially high mixing energy weakens.
• Significant oil sedimentation was obtained with the three oils when interaction occurs with CI, MRD or SRM sediments. Oil sedimentation increases with sediment concentration and reach a maximum when sediment concentration is about ½ to 1 times the concentration of oil.
• At low sediment concentration 25 and 50 mg/L, which are equivalent to 1/8 and ¼ of the oil concentration used in this study, the maximum measured oil sedimentation was 1 and 4 %, respectively, obtained with South Louisiana crude. The highest oil sedimentation of 51% of the initial oil was measured with SRM-South Louisiana interaction at sediment concentration of 300 mg/L.
5.4 Application of Chemical Dispersant in Coastal Waters As discussed above, the main objective of this study was to obtain quantitative understanding on the interaction between chemically dispersed oil and SPM and compare the results with the no chemical dispersant conditions. Results on oil sedimentation were summarized on Table 7 below. Findings that relate directly to oil spill response were summarized as follows:

• In terms of oil dispersion, OSA formation and enhancement of oil sedimentation, the two chemical dispersants tested in this project, Corexit 9500 and Corexit 9527, showed similar results.
• OSAs do form readily when Arabian Medium, Alaska North Slope or South Louisiana crude were chemically dispersed and mixed with CI, CRD, MRD, or SRM sediment. Application of chemical dispersant does not form any barrier for oil-SPM interaction and OSA formation.
• As hypothesized in the beginning of the project, the results of this research showed that in most cases oil sedimentation does increase with chemically dispersed oil compared to physically dispersed oil. The increase depends on the sediment type and concentration, the DOR and the oil type.
• Significant increases of oil sedimentation due to application of chemical dispersant were obtained when CI, CRD or MRD sediment were mixed with chemically dispersed Arabian Medium or Alaska North Slope oils, especially at sediment concentration of 100 mg/L (1/2 the concentration of oil used in this study) and higher. For sediment concentration of 200 mg/L (equals the concentration of oil used in this study), the increase in sedimentation of Alaska North Slope oil dispersed with Corexit 9500 varied from 175 to 360%, depending on the sediment type (CI, CRD or MRD) and the DOR.
• The highest increase of sedimentation of chemically dispersed oil compared to physically dispersed oil was obtained at DOR of 1:20. This is because the smallest oil droplet size distribution was measured at this DOR. This is further supporting evidence of the initial hypothesis stating that reduction of droplet size may cause significant increase of oil sedimentation due to oil-SPM interaction.
• For DOR of 1:10 and for low sediment concentration of 25 and 50 mg/L, which are equivalent to 1/8 and 1/4 of oil concentration used in this study, the measured oil sedimentation was 0.3 and 0.5% with Alaska North Slope-CI sediment without chemical dispersant, respectively. These percentages of oil sedimentation increase to 2 and 4% when the Alaska North Slope crude was chemically dispersed.
• Critical sediment concentration at which the efficiency of oil sedimentation reaches its maximum is equivalent to about ½ the concentration of oil present in the water system. In this project, this corresponds to about 100 mg/L. At this critical sediment concentration, significant enhancement of oil sedimentation following application of chemical dispersant is expected if sufficient mixing energy is available.
• Almost no obvious effects of chemical dispersant on oil sedimentation was obtained when the SRM sediment was mixed with any of the three oils used in this study at DOR of 1:10. Similar findings were obtained when CI and CRD were mixed with South Louisiana crude. However, all tests repeated with SRM sediment and DOR of 1:20 and 1:40 showed increase of oil sedimentation. Compared to no chemical dispersant conditions, the increase obtained with the two values of DOR was 28 and 5% with Arabian Medium, 25 and 22% for Alaska North Slope and 59 and 56% with South Louisiana, respectively. These increases are still small compared to what was obtained with the other sediments. We believe that this is due mainly to high fine content of the SRM sediment (56%) and the high mixing energy (help forming oil droplets without application of chemical dispersant) used in this study.
• Data on oil sedimentation obtained in this study are summarized in Table 7. As an attempt to extrapolate the findings to future applications, these data were used to estimate increase of oil sedimentation due to application of chemical dispersant as a function of fine content and concentration of natural sediments. For this we assumed an oil thickness of 2 mm, oil density

of 850 g/L and an upper mixing layer of 10 m. We assumed also that mixing energy is equivalent to the one used in this study, which corresponds to breaking wave conditions. Results are summarized in Tables 8 and 9 below for practical use.
• Further research is recommended to understand how the effects of chemical dispersant on oil sedimentation are affected by mixing energy. As a follow up to this research, it is recommended that similar bench experiments be run using two types of sediments, one rich in fines (such as SRM) and one relatively poor in fines (such as CRD), a realistic range of mixing energy and three types of viscous oils with high, medium and low viscosity.
Table 7 Summary of the study results on oil sedimentation. Oil Sedimentation (% of spilled oil)
Arabian Medium
Alaska North Slope
South Louisiana Average
Increase in Oil Sedimentation Sediment Type
Sediment concentration
(mg/L)
No CD CD No CD CD No CD CD No CD CD Compared to spilled oil (%)
Compared to No CD Conditions (%)
25 0.3 0.5 0.3 1.6 0.4 1.7 0.3 1.3 1 280 50 1 3 1 4 2 4 1 4 2 175
100 2 12 5 10 10 10 6 11 5 88 200 8 28 12 32 24 24 15 28 13 91
200* - - 12 47 - - 12 47 35 292 200** - - 12 42 - - 12 42 30 250
Cook Inlet
300 14 39 24 45 36 25 25 36 12 47 25 0.5 0.3 0.5 0.6 0.3 0.5 0.4 0.5 0 8 50 1 1 1 1 1 1 1 1 0 0
100 1 2 2 3 3 2 2 2 0 17 200 2 8 2 9 6 6 3 8 4 130
200* - - 2 10 - - 2 10 8 400
Columbia River Delta
300 3 18 7 17 7 7 6 14 8 147 25 0.2 1.3 0.3 1.6 0.7 2 0.4 1.6 1 308 50 1 6 1 5 3 5 2 5 4 220
100 4 27 4 30 16 23 8 27 19 233 200 14 53 14 57 36 61 21 57 36 167
200* - - 14 55 - - 14 55 41 293 200** - - 14 55 - - 14 55 41 293
Mississippi River Delta
300 15 56 23 58 48 65 29 60 31 108 25 0.5 2.3 0.4 2.2 0.7 1.9 0.5 2.1 2 300 50 4 5 4 5 3 5 4 5 1 36
100 23 21 18 18 10 11 17 17 0 0 200 43 47 44 38 40 38 42 41 0 0
200* 43 55 44 54 40 64 42 58 15 36 200** 43 45 44 53 40 62 42 53 11 26
SRM-1941B
300 34 56 37 49 51 58 41 54 14 34 * Results obtained with DOR=1:20; ** for DOR=1:40; CD = Chemical Dispersant and DOR=Dispersant-to-Oil-Ratio
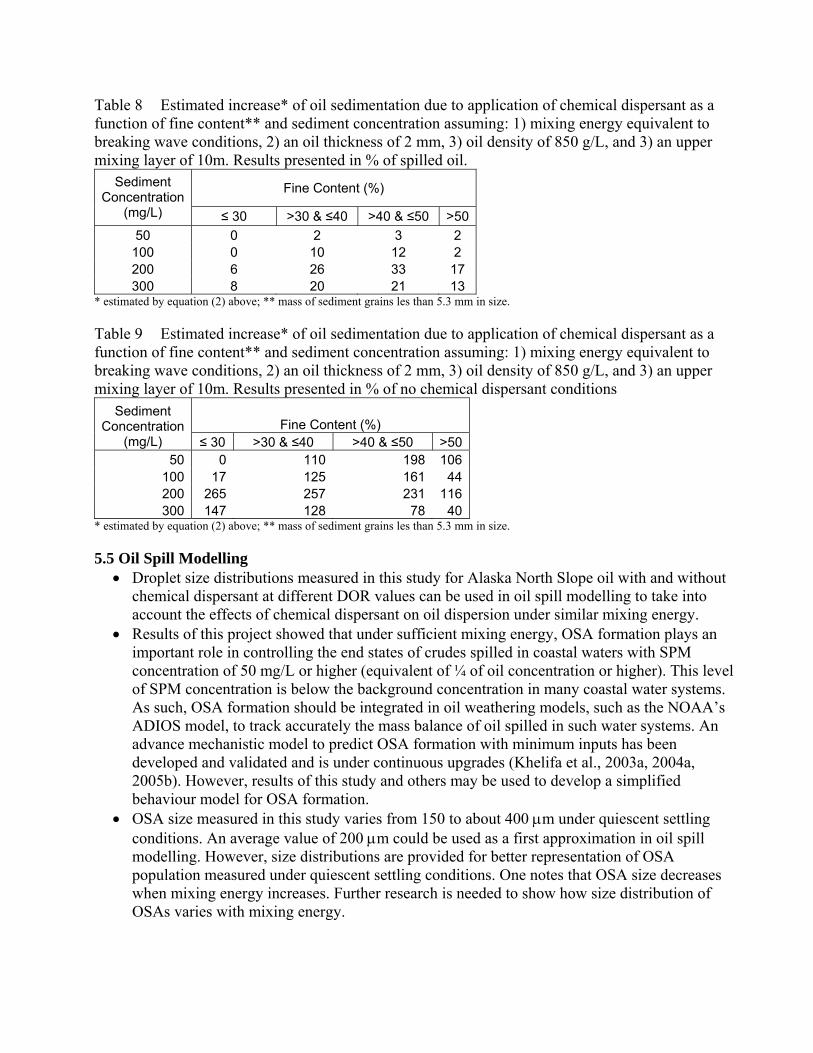
Table 8 Estimated increase* of oil sedimentation due to application of chemical dispersant as a function of fine content** and sediment concentration assuming: 1) mixing energy equivalent to breaking wave conditions, 2) an oil thickness of 2 mm, 3) oil density of 850 g/L, and 3) an upper mixing layer of 10m. Results presented in % of spilled oil.
Fine Content (%) Sediment Concentration
(mg/L) ≤ 30 >30 & ≤40 >40 & ≤50 >5050 0 2 3 2
100 0 10 12 2 200 6 26 33 17 300 8 20 21 13
* estimated by equation (2) above; ** mass of sediment grains les than 5.3 mm in size.
Table 9 Estimated increase* of oil sedimentation due to application of chemical dispersant as a function of fine content** and sediment concentration assuming: 1) mixing energy equivalent to breaking wave conditions, 2) an oil thickness of 2 mm, 3) oil density of 850 g/L, and 3) an upper mixing layer of 10m. Results presented in % of no chemical dispersant conditions
Fine Content (%) Sediment
Concentration (mg/L) ≤ 30 >30 & ≤40 >40 & ≤50 >50
50 0 110 198 106100 17 125 161 44200 265 257 231 116300 147 128 78 40
* estimated by equation (2) above; ** mass of sediment grains les than 5.3 mm in size.
5.5 Oil Spill Modelling • Droplet size distributions measured in this study for Alaska North Slope oil with and without
chemical dispersant at different DOR values can be used in oil spill modelling to take into account the effects of chemical dispersant on oil dispersion under similar mixing energy.
• Results of this project showed that under sufficient mixing energy, OSA formation plays an important role in controlling the end states of crudes spilled in coastal waters with SPM concentration of 50 mg/L or higher (equivalent of ¼ of oil concentration or higher). This level of SPM concentration is below the background concentration in many coastal water systems. As such, OSA formation should be integrated in oil weathering models, such as the NOAA’s ADIOS model, to track accurately the mass balance of oil spilled in such water systems. An advance mechanistic model to predict OSA formation with minimum inputs has been developed and validated and is under continuous upgrades (Khelifa et al., 2003a, 2004a, 2005b). However, results of this study and others may be used to develop a simplified behaviour model for OSA formation.
• OSA size measured in this study varies from 150 to about 400 μm under quiescent settling conditions. An average value of 200 μm could be used as a first approximation in oil spill modelling. However, size distributions are provided for better representation of OSA population measured under quiescent settling conditions. One notes that OSA size decreases when mixing energy increases. Further research is needed to show how size distribution of OSAs varies with mixing energy.

• Measured average OSA’s settling velocity under quiescent conditions varies from 0.85 to 1.6 mm/s, depending on oil/sediment/dispersant mixture. Stokes Law, which describes settling velocity of particles with their size, overestimates the measured settling velocity and is not recommended for use in oil spill models. Instead, as a first order approximation, use of a constant settling velocity of 1 mm/s is preferred. Data from this project can be used to develop a better model that relates the settling velocity to the size of OSAs. The model proposed by Khelifa and Hill (2006b) is recommended. However, further research is needed to show how settling of OSAs varies with mixing energy.
• Average OSA effective density measured under quiescent conditions varies from 25 to 80 g/L. As a first approximation, an average value of 50 g/L could be used in oil spill modelling. Data from this project can be used to develop a better model that relates the effective density to the size of OSAs. The model proposed by Khelifa and Hill (2006b) is recommended. However, further research is needed to show how effective density of OSAs varies with mixing energy.
5.6 Natural Recovery of Oiled Shorelines • Beside the fact that OSAs measured in this study were negatively buoyant, formation of OSA
enhances oil dispersion because it prevents coalescence of the droplets. This was shown by microscopic observations using the UV epi-fluorescence technique, as in several previous studies. Also, much less oil was found adhering to the glassware in experiments with sediment than in those with oil only.
• OSAs with relatively low effective density (10 to 50 mg/L) can be kept in suspension or re-suspended from the seafloor if sufficient hydrodynamic mixing is available. In such conditions, presence of longshore and/or offshore currents reduces environmental impacts by flushing out the OSAs from the oiled site and diluting them into a greater water volume. The data obtained in this study are key information to predict the amount of mixing energy and current intensity required to keep the OSAs in suspension or re-suspend them from the seafloor.
• OSA formation is expected to play a major role in natural cleansing of oiled shorelines if sufficient mixing energy is available to form oil droplets and if fine content of the bottom sediment is higher than about 15% of the concentration of the suspended oil (droplets).
6.0 Technology Transfer Project results were shared with the oil spill community as follows:
• Advertisements about the project are made available to the public through the following web site: http://www.ec.gc.ca/scitech/default.asp?lang=En&n=2DBC1532-1.
• Scientists with expertise in oil spill response from NOAA and the private sector have used findings from this project to evaluate the efficiency of the sediment relocation work that was conducted during the Selendang Ayu spill on Unalaska Island in Alaska.
• Scientists from NOAA with expertise in oil spill modelling have shown interest in using the findings from this project to upgrade the ADIOS software by including the oil-SPM interaction process as an end state process of spilled oils in coastal waters, estuaries and rivers.
• Findings of the project were presented (oral presentation) to scientists and graduate students from China and Malaysia during their visit to the Oil Spill Research Laboratory of the Emergencies Science and Technology Division (ESTD) at the Environmental Science and Technology Centre in Ottawa, Ontario, Canada. As a result, a PhD student from the Ocean University of China has decided to perform her research on oil-SPM interaction as a follow up of this CRRC project. She started working on her project in October 2007 at ESTD.

• A poster was prepared for the ESTD Oil Spill Research Laboratory to discuss project results with visiting scientists and managers.
• Findings related to oil dispersion and OSA formation with SRM sediment were presented and discussed with the oil spill community during three international conferences: AMOP-2007 & 2008 and IOSC-2008.
• Results of this project were presented to NOAA scientists at the 2007 PI Research Symposium in Seattle, Washington, USA, April 2007.
• A summary of the project findings were shared and discussed with the international oil spill community at the course: Efficacy and Effects of Dispersants in Oil Spill Response, organized by CRRC in Savannah in Georgia, May 2008.
7.0 Achievement and Dissemination In addition to the achievements and disseminations discussed below, the main body of project’s results and data will be published in peer-review journals, as book chapters and possibly at the Interspill-2009 conference.
Peer-review papers
Khelifa, A., B. Fieldhouse, Z. Wang, C. Yang, M. Landriault, M.F. Fingas, C.E. Brown, and L. Gamble (2007). A Laboratory Study on Formation of Oil-SPM Aggregates using the NIST Standard Reference Material 1941b. In Proceedings of the Thirtieth Arctic and Marine OilSpill Program Technical Seminar, Environment Canada, Ottawa, Ontario, pp. 35-48.
Khelifa, A., M.F. Fingas, B.P. Hollebone, and C.E. Brown (2007). Effects of Chemical Dispersants on Oil Physical Properties and Dispersion. In Proceedings of the Thirtieth Arctic and Marine OilSpill Program Technical Seminar, Environment Canada, Ottawa, Ontario, pp. 105-116.
Khelifa, A., B. Fieldhouse, Z. Wang, C. Yang, M. Landriault, C.E. Brown, and M.F. Fingas (2008). Effects of Chemical Dispersant on Oil Sedimentation Due to Oil-SPM Flocculation: Experiments with the NIST Standard Reference Material 1941b. Accepted for publication in Proceedings of the International Oil Spill Conference 2008, Savannah, Georgia, USA, pp. 627-631.
Khelifa, A., M. Chun, J.L.E. Eubank, and C.E. Brown (2008). Physical Properties of Oil-SPM Aggregates: Experiments with the NIST Standard Reference Material 1941b. In Proceedings of the Thirty-first Arctic and Marine OilSpill Program Technical Seminar, Environment Canada, Ottawa, Ontario, Vol. 1, pp. 35-51.
Oral Presentations • One presentation at CRRC 2007 PI Research Symposium, Seattle, Washington, April 19,
2007. • Two presentations at AMOP-2007, Edmonton, Alberta, June 05-07, 2007 • Two presentations at IOSC-2008, Savannah, Georgia, May 04-08, 2008 • Two presentations at AMOP-2008, Calgary, Alberta, June 03-05, 2008
Undergraduate students • Dominic Pjontek, University of Ottawa, Ottawa, Ontario, Canada. • Jonathon Eubank, University of Waterloo, Waterloo, Ontario, Canada • Michelle Chun, University of Waterloo, Waterloo, Ontario, Canada

8.0 References Ali, M. 2006. Effect of Sediment Size on Oil-Mineral Aggregation. Master Thesis. Department of
Civil Engineering, Faculty of Engineering, Dalhousie University, Halifax, Canada, 83 pp.
Ajijolaiya, L.O. 2004 . The Effects of Mineral Size and Concentration on the Formation of Oil-Mineral Aggregates. Master Thesis, Department of Civil Engineering, Faculty of Engineering, Dalhousie University, Halifax, Canada, 80 pp.
Ajijolaiya, L.O, P.S. Hill, A. Khelifa, A., R.M. Islam., and L. Lee. 2006. Laboratory Investigation of the Effects of Mineral size and Concentration on the Formation of Oil–Mineral Aggregates. Marine Pollution Bulletin, 52: 920–927.
Ballou, T.G., S.C. Hess, R.E. Dodge, A.H. Knap, and T.D. Sleeter. 1989. Effects of untreated and chemically dispersed oil on tropical marine communities: a long-term field experiment. Proceedings of the 1989 International Oil Spill Conference, American Petroleum Institute, Washington D.C., 447–454.
Ballou, T.G., R.E. Dodge, S.C. Hess, A.H. Knap, and T.D. Sleeter. 1987. Effects of a Dispersed and Undispersed Crude Oil on Mangroves, Seagrasses, and Corals. American Petroleum Institute (API) Publication N0. 4460, Washington, D.C., 227 pp.
Boehm, P.D. 1984. The comparative fate of chemically dispersed and untreated oil in an Arctic nearshore environment. In: Oil Spill Chemical Dispersants: Research, Experience, and Recommendations, STP 840, Tom E. Allen, Ed., American Society for Testing and Materials, Philadelphia, 338-360.
Boehm, P.D., M.S. Steinhauer, D.R. Green, B. Fowler, B. Humphrey, D.L. Fiest, and W.S. Cretney. 1987. Comparative fate of chemically dispersed and beached crude oil in subtidal sediments of the arctic nearshore. Arctic 40(suppl. 1):133−148.
Burbank, D.C. 1977. Circulation Studies in Kachemak Bay and Lower Cook Inlet. In: Environmental Studies of Kachemack Bay and Lower Cook Inlet, L.L. Trasky, L.B. Flagg, and D.C. Burbank, Eds. Anchorage, AK: State of Alaska, Dept. of Fish and Game, Marine/Coastal Habitat Management, 207 p.
Dames & Moore. 1978. Drilling fluid dispersion and biological effects study for the lower Cook Inlet C.O.S.T. Well. Prepared for ARCO Alaska, Anchorage, Alaska, 109 pp.
Delvigne, G.A.L. and C.E. Sweeney. 1988. Natural dispersion of oil. Oil and Chemical Pollution, 4:281–310.
Fingas, M.F. 2005. Measurement of energy in laboratory vessels-III. In: Proceedings of the Twenty-Seventh Arctic and Marine Oil Spill Program Technical Seminar, Environment Canada, Ottawa, Ontario, 1:1-16.
Fingas, M.F. 2004. Energy and work in laboratory vessels. In: Proceedings of the Twenty-Seventh Arctic and Marine Oil Spill Program Technical Seminar, Environment Canada, Ottawa, Ontario, 1:1-18.
Fingas, M. and E. Decola. 2006. Oil Spill Dispersant Effectiveness Testing in OHMSETT. Report submitted to Prince William Sound Regional Citizens’ Advisory Council (PWSRCAC), Anchorage, Alaska, 47 pp.
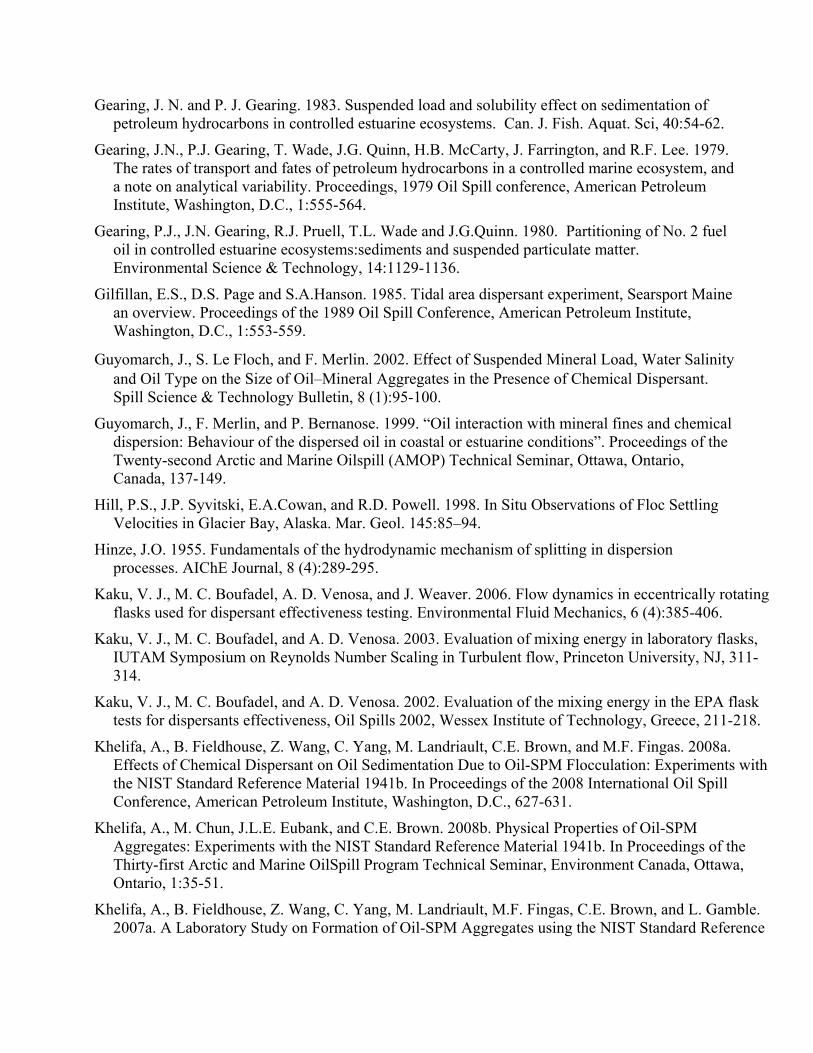
Gearing, J. N. and P. J. Gearing. 1983. Suspended load and solubility effect on sedimentation of petroleum hydrocarbons in controlled estuarine ecosystems. Can. J. Fish. Aquat. Sci, 40:54-62.
Gearing, J.N., P.J. Gearing, T. Wade, J.G. Quinn, H.B. McCarty, J. Farrington, and R.F. Lee. 1979. The rates of transport and fates of petroleum hydrocarbons in a controlled marine ecosystem, and a note on analytical variability. Proceedings, 1979 Oil Spill conference, American Petroleum Institute, Washington, D.C., 1:555-564.
Gearing, P.J., J.N. Gearing, R.J. Pruell, T.L. Wade and J.G.Quinn. 1980. Partitioning of No. 2 fuel oil in controlled estuarine ecosystems:sediments and suspended particulate matter. Environmental Science & Technology, 14:1129-1136.
Gilfillan, E.S., D.S. Page and S.A.Hanson. 1985. Tidal area dispersant experiment, Searsport Maine an overview. Proceedings of the 1989 Oil Spill Conference, American Petroleum Institute, Washington, D.C., 1:553-559.
Guyomarch, J., S. Le Floch, and F. Merlin. 2002. Effect of Suspended Mineral Load, Water Salinity and Oil Type on the Size of Oil–Mineral Aggregates in the Presence of Chemical Dispersant. Spill Science & Technology Bulletin, 8 (1):95-100.
Guyomarch, J., F. Merlin, and P. Bernanose. 1999. “Oil interaction with mineral fines and chemical dispersion: Behaviour of the dispersed oil in coastal or estuarine conditions”. Proceedings of the Twenty-second Arctic and Marine Oilspill (AMOP) Technical Seminar, Ottawa, Ontario, Canada, 137-149.
Hill, P.S., J.P. Syvitski, E.A.Cowan, and R.D. Powell. 1998. In Situ Observations of Floc Settling Velocities in Glacier Bay, Alaska. Mar. Geol. 145:85–94.
Hinze, J.O. 1955. Fundamentals of the hydrodynamic mechanism of splitting in dispersion processes. AIChE Journal, 8 (4):289-295.
Kaku, V. J., M. C. Boufadel, A. D. Venosa, and J. Weaver. 2006. Flow dynamics in eccentrically rotating flasks used for dispersant effectiveness testing. Environmental Fluid Mechanics, 6 (4):385-406.
Kaku, V. J., M. C. Boufadel, and A. D. Venosa. 2003. Evaluation of mixing energy in laboratory flasks, IUTAM Symposium on Reynolds Number Scaling in Turbulent flow, Princeton University, NJ, 311-314.
Kaku, V. J., M. C. Boufadel, and A. D. Venosa. 2002. Evaluation of the mixing energy in the EPA flask tests for dispersants effectiveness, Oil Spills 2002, Wessex Institute of Technology, Greece, 211-218.
Khelifa, A., B. Fieldhouse, Z. Wang, C. Yang, M. Landriault, C.E. Brown, and M.F. Fingas. 2008a. Effects of Chemical Dispersant on Oil Sedimentation Due to Oil-SPM Flocculation: Experiments with the NIST Standard Reference Material 1941b. In Proceedings of the 2008 International Oil Spill Conference, American Petroleum Institute, Washington, D.C., 627-631.
Khelifa, A., M. Chun, J.L.E. Eubank, and C.E. Brown. 2008b. Physical Properties of Oil-SPM Aggregates: Experiments with the NIST Standard Reference Material 1941b. In Proceedings of the Thirty-first Arctic and Marine OilSpill Program Technical Seminar, Environment Canada, Ottawa, Ontario, 1:35-51.
Khelifa, A., B. Fieldhouse, Z. Wang, C. Yang, M. Landriault, M.F. Fingas, C.E. Brown, and L. Gamble. 2007a. A Laboratory Study on Formation of Oil-SPM Aggregates using the NIST Standard Reference

Material 1941b. In Proceedings of the Thirtieth Arctic and Marine OilSpill Program Technical Seminar, Environment Canada, Ottawa, Ontario, 1:35-48.
Khelifa, A., M.F. Fingas, B.P. Hollebone, and C.E. Brown. 2007b. Effects of Chemical Dispersants on Oil Physical Properties and Dispersion. In Proceedings of the Thirtieth Arctic and Marine OilSpill Program Technical Seminar, Environment Canada, Ottawa, Ontario,1:105-116.
Khelifa, A. and P.S. Hill. 2006a. Kinematic Assessment of Floc Breakage Using a Monte Carlo Model. Journal of Hydraulic Research, IAHR, 44 (4):548–559.
Khelifa, A. and P.S. Hill. 2006b. Models for Effective Density and Settling Velocity of Flocs. Journal of Hydraulic Research, 44 (3):390-401.
Khelifa, A. 2005. Validation de la Formation d’Agrégats Pétrole-Argile dans une Eau Saumâtre et Froide. Technical Report No. FJMP3-05RTI submitted to the Canadian Coast Guard, 28 pp.
Khelifa, A., P.S. Hill, P. Stoffyn-Egli, and K. Lee. 2005a. Effects of salinity and clay composition on oil-clay aggregations. Marine Environmental Research, 59:235-254.
Khelifa, A., P.S. Hill, and K. Lee. 2005b. A comprehensive numerical approach to predict oil-mineral aggregate (OMA) formation following oil spills in aquatic environments. Proceedings of the 2005 International Oil Spill Conference, American Petroleum Institute, Washington D.C.
Khelifa, A., L.O. Ajijolaiya, P. MacPherson, K. Lee, P.S. Hill, S. Gharbi, and M. Blouin. 2005c. Validation of OMA formation in cold brackish and sea waters. Proceedings of the Twenty-eighth Arctic and Marine OilSpill Program (AMOP) Technical Seminar, Environment Canada, Ottawa, ON, Canada, 1:527-538.
Khelifa, A., L.O. Ajijolaiya, P.S. Hill, and K. Lee. 2004a. Modelling the effect of sediment size on OMA formation. In: Proceedings of the Twenty-seventh Arctic and Marine OilSpill Program Technical Seminar, Environment Canada, Ottawa, ON, Canada, 1:383-395.
Khelifa, A., P.S. Hill, and K. Lee. 2004b. Prediction of Oil Droplet Size Distribution in Agitated Aquatic Environments. Proceedings of the Twenty-seventh Arctic and Marine OilSpill Program (AMOP) Technical Seminar, Environment Canada, Ottawa, ON, Canada, 1:371-382.
Khelifa, A., P.S. Hill, and K. Lee. 2003a. A Stochastic Model to Predict the Formation of Oil-Mineral Aggregates. Proceedings of the Twenty-sixth Arctic and Marine OilSpill Program (AMOP) Technical Seminar, Environment Canada, Ottawa, ON, Canada, 1:893-909.
Khelifa, A., P. Stoffyn-Egli, P.S. Hill, and K. Lee. 2003b. Characteristics of Oil Droplets Stabilized by Mineral Particles: the Effect of Salinity. Proceedings of the 2003 International Oil Spill Conference, American Petroleum Institute, Washington, DC.
Khelifa, A., P. Stoffyn-Egli, P.S. Hill, and K. Lee. 2002. Characteristics of Oil Droplets Stabilized by Mineral Particles: the Effect of oil Types and Temperature. Spill Science & Technology Bulletin, 8 (1):19-30.
Khelifa, A., R. Ettema, M. Muste, and A. Kruger. 2001. Particle-Turbulence Interaction In Sediment-Laden Flows: An Interpretation of Published Data, and Preliminary PTV Experiments, IIHR Report No. 417, Iowa Institute of Hydraulic Research, The University of Iowa, Iowa City, Iowa, USA, 57 p. and annexes.
Le Floch, S., J. Guyomarch, F.X. Merlin, P. Stoffyn-Egli, J. Dixon, K. Lee. 2002. The influence of salinity on oil–mineral aggregate formation. Spill Science and Technology Bulletin, 8 (1):65–71.
Li, M. and C. Garrett. 1998. The relationship between oil droplet size and upper ocean turbulence. Marine Pollution Bulletin, 36 (12):961-970.
Li, Z., P. Keplay, K. Lee, T. King, M. Boufadel, and A.D. Venosa. 2007. Effects of Chemical Dispersants and Mineral Fines on Crude Oil Dispersion in a Wave Tank under Breaking Waves. Marine Pollution Bulleting, 54:983-993.
Liu, H., Y. Zhang, and W. Wang. 1995. Interfacial Properties of Oil Spill Dispersants and Their Effects on Dispersion Effectiveness. Acta Oceanologica Sinica, 587-593.
Mackay, D. and K. Hussain. 1982. An exploratory Study of Sedimentation of Naturally and Chemically Dispersed Oil. Environment Canada Report, EE-35, 24 pp., Ottawa, Ontario, Canada.
Mackay, D. and K. Hussain. 1980. Studies of oil sedimentation. In: Proceedings of the Third Arctic Marine OilSpill Program Technical Seminar, Ottawa, ON, Canada, 1:120-125.
Meakin P. 1988. Fractal aggregates, Advance Colloid Interface Science, 28:249–331.
Muschenheim, D.K., and K. Lee. 2002. Removal of Oil from the Sea Surface Through Particulate Interactions: Review and Prospectus. Spill Science and Technology Bulletin, 8, (1):9-18.
National Research Council (NRC). 2005. Understanding Oil Spill Dispersants: Efficacy and Effects. National Academy Press, Washington D. C., USA.
Omotoso, O.E., V.A. Munoz and R.J. Mikula. 2002. Mechanisms of Crude Oil–Mineral Interactions. Spill Science and Technology Bulletin, 8(1):45–54
Owens, E.H. 1999. The interaction of fine particles with stranded oil. Pure and Applied Chemistry, 71(1):83-93.
Owens, E.H. and K. Lee. 2003. Interaction of Oil and Mineral Fines on Shorelines: Review and Assessment. Marine Pollution Bulletin, 47 (9-12):397-405.
Page, C.A., J.S. Bonner, P.L. Sumner, Tom McDonald, Robin Autenrieth, and C.B. Fuller. 2000. Behavior of a Chemically-Dispersed oil and a whole oil on a near-shore environment. Water Research. 34(9):2507-2516.
Payne, J.R., J.R. Jr. Clayton, and B.E. Kirstein. 2003. Oil/Suspended Particulate Material Interactions and Sedimentation. Spill Science and Technology Bulletin, 8 (2):201-221.
Payne, J.R., J.R. Clayton, G.D.Jr. McNabb, C.L. Kirstein, C.L. Clary, R.T. Redding, J.S. Evans, E. Reimnitz and E.W. Kempema. 1989. Oil-Ice-Sediment Interactions During Freezeup and Breakup. U.S. Department of Commerce, NOAA, OCSEAP. Final Report No. 64, 382 pp.
Payne, J.R., C.R. Phillips, and W. Hom. 1987. Transport and transformations: Water column processes. In: Boesch D.F., and Rabalais, N.N. (Eds.), Long-Term Environmental Effects of Offshore Oil and Gas Development, Elsevier Applied Science, London & New York, 175-231.
Reed, M., P.S. Daling, A. Lewis, M.K. Ditlevsen, B. Brørs, J. Clark, and D. Aurand. 2001. Modelling of dispersant application to oil spills in shallow coastal waters. In: Fifth International Marine Environmental Modelling Seminar (IMEMS 2001), SINTEF Applied Chemistry, New Orleans, Louisiana, USA.

Sergy, G.A., C.C. Guenette, R.C., Prince, and K. Lee. 2003. In-situ Treatment of Oiled Sediment Shorelines. Spill Science & Technology Bulletin, 8 (3):237–244.
Sergy, G., C. Guennette, E. Owens, R. Prince, and K. Lee. 1999. Treatment of oiled sediment shorelines by sediment relocation. In: Proceedings of the 1999 International Oil Spill Conference, Seattle, Washington, USA, 549-554.
Sergy, G.A., C.C. Guenette, E.H. Owens, R.C. Prince, and K. Lee. 1998. The Svalbard Shoreline Oilspill Field Trials. In: Proceedings of the Twenty-First Arctic and Marine Oilspill Program Technical Seminar, Environment Canada, Ottawa, ON, 2:873-889.
Sterling, M.C., J.S. Bonner, A.N.S. Ernest, C.A. Page, and R. L. Autenrieth. 2004. Characterizing aquatic sediment-oil aggregates using in situ instruments. Mairine Pollution Bulletin, 48:533–42.
Stoffyn-Egli, P. and K. Lee. 2002. Formation and Characterization of Oil–Mineral Aggregates. Spill Science and Technology Bulletin, 1:31-44.
Tennekes, H. and J.L. Lumley. 1975. A first course in turbulence M.I.T Press.
Tkalich, P. and E.S. Chan. 2002. Vertical Mixing of Oil Droplets by Breaking Waves. Marine Pollution Bulletin, 44 (11):1219-1229.
Wade T.L. and J.G. Quinn. 1980. Incorporation, distribution, and fate of saturated petroleum hydrocarbons in sediments from a controlled marine ecosystem. Marine Environmental Research, 3(1):15-34.
Wang, Z. and M. Fingas. 2006. Oil and petroleum product fingerprinting analysis by gas chromatographic techniques. In Chromatographic Analysis of the Environment, 3rd edition, (ed. L. Nollet), CRC Press, New York, 1027-1101.
Wang, Z., M. Fingas, E. H. Owens, L. Sigouin, and C. E. Brown. 2001. Long-term fate and Persistence of the Spilled Metula Oil in a Marine Salt Marsh Environment: degradation of Petroleum Biomarkers. J. Chromatogr., 926:275-190.
Wang, Z., Merv Fingas, and G. Sergy. 1995. Chemical Characterization of Crude Oil Residues from an Arctic Beach by GC/MS and GC/FID. Environmental Science & Technology, 29(10):2622-2631.
Wang, Z., M.F. Fingas and G. Sergy. 1994a. Study of 22-Year-Old ARROW Oil Samples Using Biomarker Compounds by GC/MS", Environmental Science and Technology, 28 (9):1733-1746.
Wang, Z., M. Fingas, Y.Y. Shu, L. Sigouin, M. Landriault, and P. Lambert. 1994b. Quantitative Characterization of PAHs in Burn Residue and Soot Samples and Differentiation of Pyrogenic PAHs from Petrogenic PAHs - the 1994 Mobile Burn Study. Environmental Science & Technology, 33:3100-3109.
Weise, A.M., C. Nalewajko, and K. Lee. 1999. Oil-Mineral Fine Interactions Facilitate Oil Biodegradation in Seawater. Environmental Technology, 20:811-824.