EFFECTS OF DIFFERENT DISPERSING SOLUTION ON THE PROPERTIES ... · PDF fileEFFECTS OF DIFFERENT...
12
EFFECTS OF DIFFERENT DISPERSING SOLUTION ON THE PROPERTIES OF SOIL PARTICLE DURING HYDROMETER TEST Arinze Emmanuel Emeka, Department of Civil Engineering, Michael Okpara University of Agriculture, Umudike, Abia State, Nigeria [email protected] Abstract Soil particle less than 75 microns can be analyzed for the distribution of various grains sizes of silt and clay. This is achieved through hydrometer test. In this study the effect of different dispersing agents on the hydrometer test were studied. Four different solutions of dispersing agent and soil samples were prepared. The first solution was prepared using 35g of sodium hexametaphosphate with 7g of sodium carbonate (solution I). Second solution is prepared using only 40g of sodium hexametaphosphate per 1 litre of solution (solution II). Third solution is prepared using 40g of sodium carbonate (solution III) and the fourth is prepared without using any dispersing agent rather, the two soil samples used were dissolved in distilled water (solution IV). After comparative analysis, solutions I and II were recommended as the best method for preparation of soil solution for hydrometer test. Percentage passing obtained for solution I differs from solutions II, III, IV by 3.20, 6.88 and 24.07 respectively; for sample A and 3.22, 11.1 and 19.52 respectively; for sample B. Solution I and II are consistent for both samples whereas solution III is not consistent showing that it depends on the nature of soil being dispersed. Therefore, sodium carbonate is added to solution I to reduce its hardness. The results obtained showed that solution I and II are recommended only as prescribed by BS and ASTM respectively. Key word: Dispersing agent effect, mechanical analysis, hydrometer test. 1.0 INTROUDCTION The common laboratory method used to determine size distribution of fine-grained soil is called hydrometer test. In hydrometer test a small amount of soil is mixed into a suspension and its settlement is observed over time. Larger particles will settle quickly followed by International Journal of Scientific & Engineering Research, Volume 6, Issue 6, June-2015 ISSN 2229-5518 1765 IJSER © 2015 http://www.ijser.org IJSER
Transcript of EFFECTS OF DIFFERENT DISPERSING SOLUTION ON THE PROPERTIES ... · PDF fileEFFECTS OF DIFFERENT...
EFFECTS OF DIFFERENT DISPERSING SOLUTION ON THE PROPERTIES
OF SOIL PARTICLE DURING HYDROMETER TEST
Arinze Emmanuel Emeka,
Department of Civil Engineering, Michael Okpara University of Agriculture,
Umudike, Abia State, Nigeria
Abstract
Soil particle less than 75 microns can be analyzed for the distribution of various
grains sizes of silt and clay. This is achieved through hydrometer test. In this study
the effect of different dispersing agents on the hydrometer test were studied. Four
different solutions of dispersing agent and soil samples were prepared. The first
solution was prepared using 35g of sodium hexametaphosphate with 7g of sodium
carbonate (solution I). Second solution is prepared using only 40g of sodium
hexametaphosphate per 1 litre of solution (solution II). Third solution is prepared
using 40g of sodium carbonate (solution III) and the fourth is prepared without using
any dispersing agent rather, the two soil samples used were dissolved in distilled
water (solution IV). After comparative analysis, solutions I and II were
recommended as the best method for preparation of soil solution for hydrometer test.
Percentage passing obtained for solution I differs from solutions II, III, IV by 3.20,
6.88 and 24.07 respectively; for sample A and 3.22, 11.1 and 19.52 respectively; for
sample B. Solution I and II are consistent for both samples whereas solution III is
not consistent showing that it depends on the nature of soil being dispersed.
Therefore, sodium carbonate is added to solution I to reduce its hardness. The results
obtained showed that solution I and II are recommended only as prescribed by BS
and ASTM respectively.
Key word: Dispersing agent effect, mechanical analysis, hydrometer test.
1.0 INTROUDCTION
The common laboratory method used to determine size distribution of fine-grained soil is
called hydrometer test. In hydrometer test a small amount of soil is mixed into a suspension
and its settlement is observed over time. Larger particles will settle quickly followed by
International Journal of Scientific & Engineering Research, Volume 6, Issue 6, June-2015 ISSN 2229-5518
1765
IJSER © 2015 http://www.ijser.org
IJSER

smaller particles. When hydrometer is lowered into suspensions, it will sink into the
suspension until buoyancy force is sufficient to balance the weight of the hydrometer. The
length of the hydrometer projecting above the suspension is a function of the density, so it
is possible to calibrate the hydrometer to read the density of the suspension at different
intervals of time (Budhu, 2011).
Typically, a hydrometer test is conducted by taking a small quantity of a dry and fine
grained soil and thoroughly mixing it with distilled water to form a paste. The British
standard recommends 35g of sodium hexametaphosphate with 7g of sodium carbonate
along with distilled water to make 1 litre standard solution. Whereas ASTM standard
method of particle size analysis (D422-ASTM 1965) suggest that 125ml of solution of
sodium hexametaphosphate shall be used in distilled water at the rate of 40g of sodium
hexametaphosphate per litre of solution (Bindu & Ramabhadran, 2010; bindhu, 2011).
A hydrometer is placed in the glass cylinder and a clock is simultaneously started at
intervals of 1min, 2min, 4min, 8min, 15min, 30min, 1hr, 2hrs, 4hrs, 8hrs, 16hrs, 24hrs. The
hydrometer is read, the diameter D(cm) of the particle at time t(second) is calculated from
Stoke’s law as
Where is the viscosity of water (0.01gram/cms at 200C), z is the depth (cm), is the density
of water (1gram/cm3), g is the acceleration due to gravity (981cm/s2) and Gs is the specific
International Journal of Scientific & Engineering Research, Volume 6, Issue 6, June-2015 ISSN 2229-5518
1766
IJSER © 2015 http://www.ijser.org
IJSER

gravity of the soil particles (≅2.7) (Budhu, 2011; Bindu & Ramabhadran, 2010). Stoke’s
Law can also be expressed in terms of unit weight of soil as follows
Where V is the terminal velocity, ɤw is the unit weight of water, ɤs is the unit weight of the
soil (Murthy, 2008).
In application of Stoke’s Law, the particles are assumed to be free-falling spheres with no
collision. But the mineral particles of clays are plate like, and collision of particles during
sedimentation is unavoidable. Also Stokes law is valid only for laminar flow with Reynolds
number smaller than 1 (Budhu, 2011; Ye, Kuang & Li, 2014; Ye, Ye & tang, 2014).
This work studied the comparative effect of different dispersing agents on hydrometer test
result.
2.0 MATERIALS AND METHOD
Two different soil samples were used for this test. The first sample (A) was collected from
Ogun State, Nigeria. The AASHTO classification for this soil is A-7-5.
The second sample (B) classified as A-6 was collected from Kaduna State, Nigeria. For
each of the samples, four different solution were prepared for hydrometer test.
Solution I: This was prepared using 35g of sodium hexametaphosphate with 7g of sodium
carbonate in line with BS standard.
International Journal of Scientific & Engineering Research, Volume 6, Issue 6, June-2015 ISSN 2229-5518
1767
IJSER © 2015 http://www.ijser.org
IJSER

Solution II: This was prepared using only 140g of sodium hexametaphosphate per litre of
solution according to ASTM standard.
Solution III: This was prepared using only 140g of sodium carbonate.
Solution IV: This was prepared to serve as control and contains no dispersing agent.
3.0 RESULTS AND DISCUSSION CURVE
The results for sample A for each of the solution (I-IV) are shown in table 2.1 below
International Journal of Scientific & Engineering Research, Volume 6, Issue 6, June-2015 ISSN 2229-5518
1768
IJSER © 2015 http://www.ijser.org
IJSER

Sample A:
Elapsed
time
Solution I Solution II Solution III Solution IV
Diameter
(mm)
%
Passing
Diameter
(mm)
%
Passing
Diameter
(mm)
%
Passing
Diameter
(mm)
%
Passing
1min 0.050 59.24 0.049 53.57 0.047 64.73 0.050 48.92
2mins 0.040 51.78 0.035 51.71 0.035 57.29 0.037 40.55
4mins 0.030 46.17 0.025 47.99 0.025 51.71 0.026 34.97
8mins 0.020 41.52 0.018 44.27 0.018 47.99 0.019 23.8
15mins 0.010 37.80 0.013 42.41 0.013 46.13 0.015 12.65
30mins 0.009 36.86 0.0090 40.55 0.009 40.55 0.0010 7.07
1hr 0.007 35.00 0.0068 38.69 0.007 23.81 0.0075 3.35
2hrs 0.005 31.28 0.0048 36.83 0.005 19.16 0.0053 3.35
4hrs 0.003 29.42 0.0034 34.97 0.004 11.72 0.0037 3.35
6hrs 0.002 27.56 0.0028 34.04 0.0029 10.79 0.0030 3.35
24hrs 0.001 27.56 0.0014 31.25 0.0015 6.14 0.0015 3.35
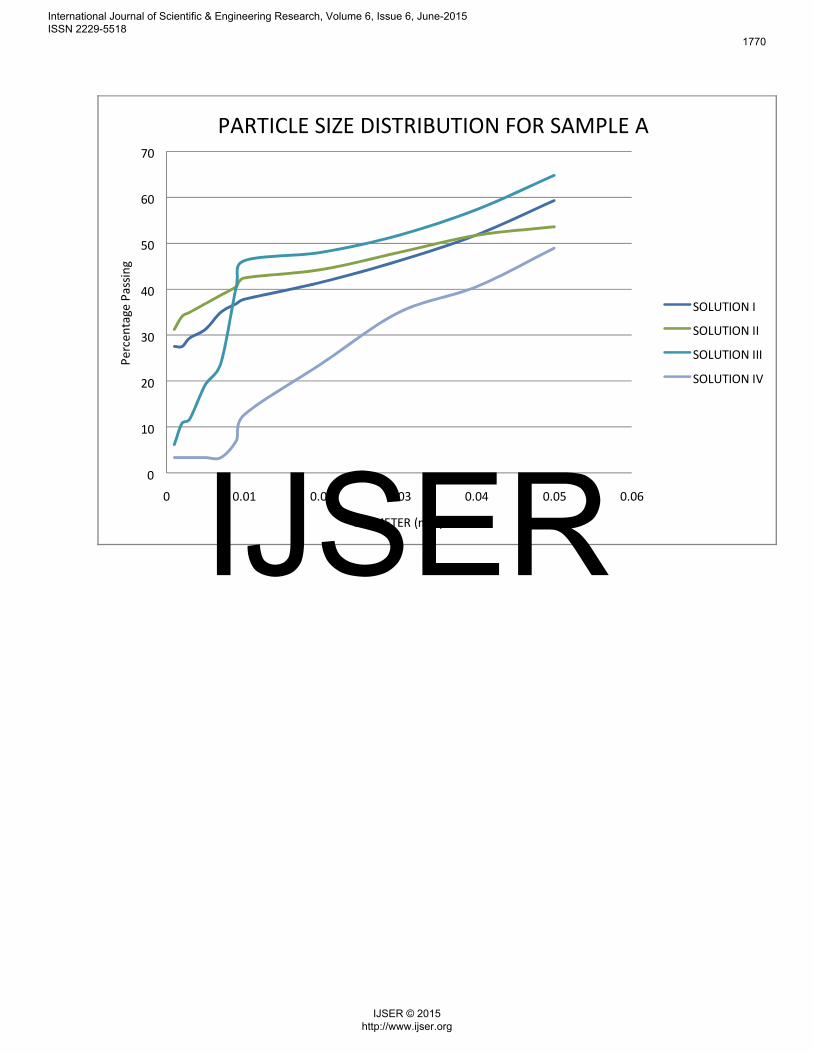
Fig. 2.1: The particle distribution size for different solutions
International Journal of Scientific & Engineering Research, Volume 6, Issue 6, June-2015 ISSN 2229-5518
1769
IJSER © 2015 http://www.ijser.org
IJSER
0
10
20
30
40
50
60
70
0 0.01 0.02 0.03 0.04 0.05 0.06
DIAMETER (mm)
PARTICLE SIZE DISTRIBUTION FOR SAMPLE A
SOLUTION I
SOLUTION II
SOLUTION III
SOLUTION IV
International Journal of Scientific & Engineering Research, Volume 6, Issue 6, June-2015 ISSN 2229-5518
1770
IJSER © 2015 http://www.ijser.org
IJSER

The Results for sample B for each of the solutions are shown in Table 2.2 below
Elapsed
time
Solution I Solution II Solution III Solution IV
Diameter
(mm)
%
Passing
Diameter
(mm)
%
Passing
Diameter
(mm)
%
Passing
Diameter
(mm)
%
Passing
1min 0.048 52.63 0.048 52.63 0.048 56.77 0.051 37.73
2mins 0.036 43.53 0.035 42.69 0.014 52.63 0.038 26.15
4mins 0.026 36.08 0.026 39.39 0.025 46.01 0.027 21.18
8mins 0.018 34.42 0.018 36.08 0.018 43.53 0.019 12.91
15mins 0.014 31.11 0.013 35.25 0.013 43.53 0.011 12.91
30mins 0.0097 31.11 0.0097 31.11 0.0093 40.22 0.010 9.60
1hr 0.0069 30.29 0.0069 30.29 0.0067 36.91 0.0074 8.77
2hrs 0.0049 28.63 0.0049 29.46 0.0047 36.08 0.0052 7.12
4hrs 0.0035 28.63 0.0035 26.98 0.0034 31.11 0.0037 6.29
6hrs 0.0028 26.15 0.0028 26.15 0.0028 29.46 0.0030 6.29
24hrs 0.0014 25.32 0.0014 25.32 0.0014 29.46 0.0015 6.29
International Journal of Scientific & Engineering Research, Volume 6, Issue 6, June-2015 ISSN 2229-5518
1771
IJSER © 2015 http://www.ijser.org
IJSER

0
10
20
30
40
50
60
0 0.01 0.02 0.03 0.04 0.05 0.06
DIAMETER (mm)
PARTICLE SIZE DISTRIBUTION FOR SAMPLE B
SOLUTION I
SOLUTION II
SOLUTION III
SOLUTION IV
International Journal of Scientific & Engineering Research, Volume 6, Issue 6, June-2015 ISSN 2229-5518
1772
IJSER © 2015 http://www.ijser.org
IJSER

Individual soil particles must be dispersed in an aqueous solution and remain
dispersed to enable determination of particle size distributed. However, soil naturally
exists as aggregates and not a dispersed mixture of particles; sand, silt and clay.
Cementing agents include organic matter; mineral oxides or polyvalent cations. That
is the reason why solution IV without dispersion agent was not well dispersed. The
percentage finer is the same, from 1hr to 24hrs for Sample A and also the same for
Sample B from 4hrs to the 24hrs.
The average particle diameter for each solution was calculated. The corresponding
percentage finer was calculated using mathematical interpolation. This average
particle diameter is shown in table 2.3 and 2.4 below for each of the sample.
Solution type Average particle (mm)
diameter
% Finer
I 0.0161 40.07
II 0.0153 43.27
III 0.0152 46.95
IV 0.0162 16.00
Table 2.3: Average particle size and corresponding percentage passing for sample
A.
International Journal of Scientific & Engineering Research, Volume 6, Issue 6, June-2015 ISSN 2229-5518
1773
IJSER © 2015 http://www.ijser.org
IJSER
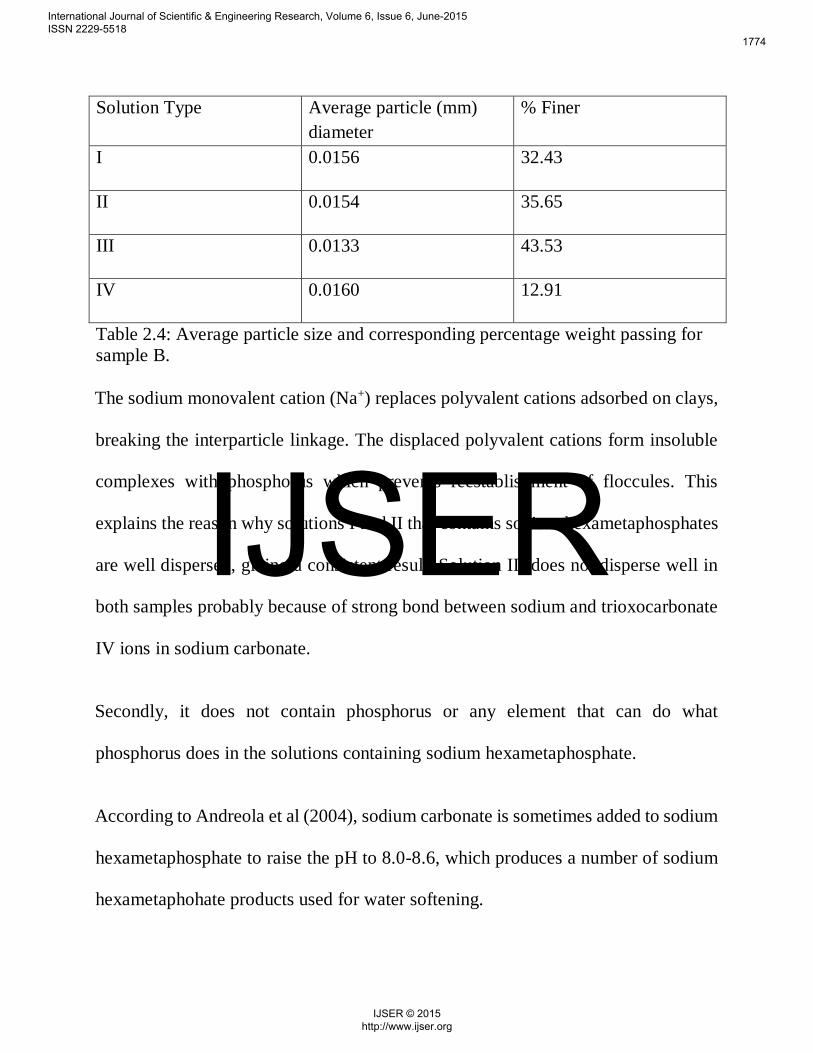
Solution Type Average particle (mm)
diameter
% Finer
I 0.0156 32.43
II 0.0154 35.65
III 0.0133 43.53
IV 0.0160 12.91
Table 2.4: Average particle size and corresponding percentage weight passing for
sample B.
The sodium monovalent cation (Na+) replaces polyvalent cations adsorbed on clays,
breaking the interparticle linkage. The displaced polyvalent cations form insoluble
complexes with phosphorus which prevents reestablishment of floccules. This
explains the reason why solutions I and II that contains sodium hexametaphosphates
are well dispersed, giving a consistent result. Solution III does not disperse well in
both samples probably because of strong bond between sodium and trioxocarbonate
IV ions in sodium carbonate.
Secondly, it does not contain phosphorus or any element that can do what
phosphorus does in the solutions containing sodium hexametaphosphate.
According to Andreola et al (2004), sodium carbonate is sometimes added to sodium
hexametaphosphate to raise the pH to 8.0-8.6, which produces a number of sodium
hexametaphohate products used for water softening.
International Journal of Scientific & Engineering Research, Volume 6, Issue 6, June-2015 ISSN 2229-5518
1774
IJSER © 2015 http://www.ijser.org
IJSER

CONCLUSION
Percentage passing obtained for solution I differs from solutions II, III, IV by 3.20,
6.88 and 24.07 respectively; for sample A and 3.22, 11.1 and 19.52 respectively; for
sample B.
Solution I and II are consistent for both samples whereas solution III is not consistent
showing that it depends on the nature of soil being dispersed.
Therefore, sodium carbonate is added to solution I to reduce its hardness. The results
obtained showed that solution I and II are recommended only as prescribed by BS
and ASTM respectively.
REFERENCE
American Society of Testing and Materials (2004). ASTM book of Standards Vol.
04.08, West Conslhocken, PA.
Andreola F., Castellini E., Manfredini T. and Romagnoli (2004) “The role of sodium
hexametaphosphate in the Dissolution process of kaolinite and kaolinF.
Journal of the European ceramic Society, Vol. 24, Number 7.
Bindhu M., (2001) “Soil Mechanics and Foundations” John Wiley and Sons, Inc 3rd
ed.
Bindu J. and Ramabhadram A. (2010) “Effect of concentration of dispersing agent
on the grain size distribution of fined grained soil” Indian Geotechnical
Conference pp. 275-278.
International Journal of Scientific & Engineering Research, Volume 6, Issue 6, June-2015 ISSN 2229-5518
1775
IJSER © 2015 http://www.ijser.org
IJSER
British Standards BS1377: Part 2:1990.
Murthy V. N. S. (2008) “Soil Mechanis and Foundation’ CBS publishers and
distributors.
Ramamurthy T. N. & Sitharam T. G. (2005) “Geotechnical Engineering S.Chand
and Company Ltd New Delhi.
Ye, X.; Kuang, J.; Li, X. & Tang, G. (2014). “Microstructure, properties and
temperature evolution of electropulsing treated functionally graded Ti-6AL-
4V alloy strip”. Journal of Alloys and Compound.
Ye, X.; Ye, Y. & Tang, G. (2014). “Effect of electropulsing treatment and Ultrasonic
treatment on the mechanical properties and microstructures of biomedical Ti-
6AL-4V alloy”. Journal of Mechanical Behaviour of Biomedical Materials.
International Journal of Scientific & Engineering Research, Volume 6, Issue 6, June-2015 ISSN 2229-5518
1776
IJSER © 2015 http://www.ijser.org
IJSER