
Effects of clinical characteristics on successful open...
15
Effects of clinical characteristics on successful open access scheduling Renata Kopach & Po-Ching DeLaurentis & Mark Lawley & Kumar Muthuraman & Leyla Ozsen & Ron Rardin & Hong Wan & Paul Intrevado & Xiuli Qu & Deanna Willis Received: 13 June 2006 / Accepted: 15 October 2006 / Published online: 31 March 2007 # Springer Science + Business Media, LLC 2007 Abstract Many outpatient clinics are experimenting with open access scheduling. Under open access, patients see their physicians within a day or two of making their appointment request, and long term patient booking is very limited. The hope is that these short appointment lead times will improve patient access and reduce uncertainty in clinic operations by reducing patient no-shows. Practice shows that successful implementation can be strongly influenced by clinic characteristics, indicating that open access policies must be designed to account for local clinical conditions. The effects of four variables on clinic performance are examined: (1) the fraction of patients being served on open access, (2) the scheduling horizon for patients on longer term appointment scheduling, (3) provider care groups, and (4) overbooking. Discrete event simulation, designed experimentation, and data drawn from an intercity clinic in central Indiana are used to study the effects of these variables on clinic throughput and patient continuity of care. Results show that, if correctly configured, open access can lead to significant improvements in clinic throughput with little sacrifice in continuity of care. Keywords Open access . Appointment scheduling . Patient no-show . Outpatient clinic . Simulation 1 Introduction Large outpatient healthcare clinics schedule thousands of patient appointments each year. The effectiveness of the scheduling process has a direct and critical impact on clinical resource usage and patient satisfaction. Typically, appointments can be made many months in advance, and when a clinic is working close to capacity, the near term schedule tends to be fully utilized. This limits patient access to care and aggravates the problem of patient no-shows, which refers to those patients who miss their appointments with no forewarning. In some clinics, no-show rates can be as high as 42%, introducing enormous volatility in clinic operations and wasting clinical resources [19]. This is not surprising since, during a long appointment lead time, the patient’ s needs can change significantly. To address the issues of timely access and patient no- show, open access scheduling is being introduced in clinics throughout the United States. Rather than booking a patient several weeks or months in advance, patients are asked to call for appointments about the time they wish to see their physicians. If appointment slots are available within the next day or two, the calling patient is scheduled. If not, the patient may be asked to call back later. When demand and capacity are properly balanced, open access can help improve patient access to physicians and reduce uncertainty in clinic operations by eliminating no-shows resulting from long appointment lead times [21]. However, when demand and capacity are not properly balanced, having patients call back later leads to an increasing and unstable call rate, unfair access, and high patient dissatisfaction. Health Care Manage Sci (2007) 10:111–124 DOI 10.1007/s10729-007-9008-9 R. Kopach (*) : P.-C. DeLaurentis : M. Lawley : K. Muthuraman : L. Ozsen : R. Rardin : H. Wan : P. Intrevado : X. Qu School of Industrial Engineering, Purdue University, 315 North Grant Street, West Lafayette, IN 47907, USA e-mail: [email protected] D. Willis Department of Family Medicine Faculty, Indiana University School of Medicine, 1110 West Michigan Street, Indianapolis, IN 46202, USA
Transcript of Effects of clinical characteristics on successful open...

Effects of clinical characteristics on successful openaccess scheduling
Renata Kopach & Po-Ching DeLaurentis &
Mark Lawley & Kumar Muthuraman & Leyla Ozsen &
Ron Rardin & Hong Wan & Paul Intrevado & Xiuli Qu &
Deanna Willis
Received: 13 June 2006 /Accepted: 15 October 2006 / Published online: 31 March 2007# Springer Science + Business Media, LLC 2007
Abstract Many outpatient clinics are experimenting withopen access scheduling. Under open access, patients seetheir physicians within a day or two of making theirappointment request, and long term patient booking is verylimited. The hope is that these short appointment lead timeswill improve patient access and reduce uncertainty in clinicoperations by reducing patient no-shows. Practice showsthat successful implementation can be strongly influencedby clinic characteristics, indicating that open access policiesmust be designed to account for local clinical conditions.The effects of four variables on clinic performance areexamined: (1) the fraction of patients being served on openaccess, (2) the scheduling horizon for patients on longerterm appointment scheduling, (3) provider care groups, and(4) overbooking. Discrete event simulation, designedexperimentation, and data drawn from an intercity clinicin central Indiana are used to study the effects of thesevariables on clinic throughput and patient continuity ofcare. Results show that, if correctly configured, open accesscan lead to significant improvements in clinic throughputwith little sacrifice in continuity of care.
Keywords Open access . Appointment scheduling . Patientno-show. Outpatient clinic . Simulation
1 Introduction
Large outpatient healthcare clinics schedule thousands ofpatient appointments each year. The effectiveness of thescheduling process has a direct and critical impact onclinical resource usage and patient satisfaction. Typically,appointments can be made many months in advance, andwhen a clinic is working close to capacity, the near termschedule tends to be fully utilized. This limits patient accessto care and aggravates the problem of patient no-shows,which refers to those patients who miss their appointmentswith no forewarning. In some clinics, no-show rates can beas high as 42%, introducing enormous volatility in clinicoperations and wasting clinical resources [19]. This is notsurprising since, during a long appointment lead time, thepatient’s needs can change significantly.
To address the issues of timely access and patient no-show, open access scheduling is being introduced in clinicsthroughout the United States. Rather than booking a patientseveral weeks or months in advance, patients are asked tocall for appointments about the time they wish to see theirphysicians. If appointment slots are available within thenext day or two, the calling patient is scheduled. If not, thepatient may be asked to call back later. When demand andcapacity are properly balanced, open access can helpimprove patient access to physicians and reduce uncertaintyin clinic operations by eliminating no-shows resulting fromlong appointment lead times [21]. However, when demandand capacity are not properly balanced, having patients callback later leads to an increasing and unstable call rate,unfair access, and high patient dissatisfaction.
Health Care Manage Sci (2007) 10:111–124DOI 10.1007/s10729-007-9008-9
R. Kopach (*) : P.-C. DeLaurentis :M. Lawley :K. Muthuraman : L. Ozsen :R. Rardin :H. Wan :P. Intrevado :X. QuSchool of Industrial Engineering, Purdue University,315 North Grant Street,West Lafayette, IN 47907, USAe-mail: [email protected]
D. WillisDepartment of Family Medicine Faculty,Indiana University School of Medicine,1110 West Michigan Street,Indianapolis, IN 46202, USA

Thus, despite its appeal, open access can fail if notcustomized for the individual clinic’s capacity and environ-ment. For example, under open access, patient continuity ofcare (access to appointments with the patient’s regularphysician) is much more sensitive to physician workpatterns, especially when medical interns and studentresidents are present. Also, the clinic’s patient demograph-ics, its physical location and proximity to public transpor-tation, and its no-show history all can be important inclinical scheduling and operations. Finally, some patients,such as those with chronic disease, may require follow-upappointments. Refusing to book these at the end of thecurrent appointment does not promote patient satisfaction.
The objective of this research is to develop modeling andanalysis techniques that help configure open access to aclinic’s unique environment, taking into account thevariables mentioned above as well as many others. Acomplete overview of these efforts is documented in [6],which describes the overall modeling framework andimplementation approach (see Fig. 1). This frameworkincludes a variety of analytical models for open accessconfiguration decisions and requirements such as (1)modeling patient no-show, (2) finding an optimal mix ofopen and longer term scheduling slots (see Fig. 2), (3)accommodating schedule backlog during open access
implementation, (4) forming provider care groups, (5)modeling patient flow in the clinic, and (6) using over-booking to offset the effect of patient no-show. Thesemodels are used to develop an initial configuration, whichis then simulated and refined (see Phase I of Fig. 1). Therefined configuration is then continually adjusted andrefined during Phase II. During this transition period, openaccess is phased in as schedule backlog is worked down.When the transition to open access is complete, the demandprocess, patient no-show rates, physician work patterns, andso forth are constantly monitored and the schedulingpolicies are continuously updated and refined. Eventually,the environment might change so much that the three phaseprocess repeats itself.
This paper describes the simulation component of theframework (see Phase I) and presents the results of adesigned experiment in which the effects of clinicalcharacteristics on two clinical performance measures areinvestigated: continuity of care and clinic throughput. Thismodeling approach was developed in collaboration withmedical partners at a large outpatient general practice clinic,which serves an inner city population and is associated witha major tertiary teaching hospital with over 950 facultyphysicians providing care across a wide spectrum ofdisciplines.
Rough-Cut Design
No-Show Analysis Model
Slot Allocation/ Time Horizon/ Sequencing
Model
Optimal Backlog Accommodation Model
Overbooking Model
Patient Care Grouping Model
Queueing Network Model
Simulation Analysis
Performance Evaluation &
Sensitivity Analysis
Efficiency
No-Show Rates
Continuity of Care
……
Refined Configuration
Staff Capacity
Session of Slots
Scheduling Horizons
Overbooking Policy
Care Groups
Backlog Scheduling Plan
Rough-Cut Modeling Feedback
Continuous Modeling Feedback
Evolving Environmental Characteristics
Characteristics of Clinic
Environment
Phase I: System Design Phase II: Transition Period Phase III: Continuous Improvement
Implementation of Design
Implementation Evaluation
Minor Adjustment
Major Adjustment
Minor Adjustment
Continuous Monitoring &
Reconfiguration
Fig. 1 Framework for configuring open access
112 Health Care Manage Sci (2007) 10:111–124

The contributions of this paper include:
1. A simulation framework that integrates models of thecall-in process, patient no-show, and clinic performance;
2. An analysis of the effect of provider care groups oncontinuity of care and clinic performance;
3. An overbooking approach for improving patient accessand an assessment of its effect on continuity of care andclinic performance;
4. An analysis of the effect of the fraction of a clinic’spatients using open access.
5. A tentative model for the relationship between appoint-ment lead time and patient no-show, and an illustrationof the negative effect of patient no-show on clinicthroughput.
The remainder of the paper is organized as follows.Section 2 provides a brief literature review, while Section 3discusses the methodological approach, which includessteps for (1) identifying modeling objectives, performancemeasures, and clinical variables, (2) performing datacollection and input analysis, and (3) developing andvalidating the clinic simulator. Section 4 then presents theexperimental design, while Section 5 discusses results,which illustrate the effects of clinic characteristics on thetwo performance measures given above. Finally, Section 6summarizes and discusses future work.
2 Literature review
This section provides a literature review for patient no-show research and outpatient appointment scheduling. Theno-show literature is important since it establishes that no-show prediction models can be successfully developed, butthat the significant factors affecting no-show are clinicdependent. The appointment scheduling literature is impor-tant as it provides the foundation for analysis of openaccess as a new scheduling paradigm.
Patient no-show is a chronic problem for outpatientclinics, where no-show rates range from 12 to 42% [19].No-show patients waste resources, complicate scheduling,adversely impact clinic revenue streams, and introducesignificant uncertainty into daily clinical operations. Manyfactors have been cited as indicators of patient no-show
including patient demographics, medical conditions, physi-cian characteristics, patient–physician interaction, clinicaccess and administrative processes, and environmentalfactors [2, 3, 7–9, 11]. Bean and Talaga [2] collected4 months of appointment data and considered the effects ofphysician’s specialty, appointment lead time, patient age,and patient gender on patient no-show rates. They identifiedpatient subgroups with significantly different no-show rates.The average no-show rate of each subgroup was then usedto predict no-show behavior. Dervin et al. [7] constructed aregressive prediction model on ten variables using data from100 appointments over a 1 month period. Goldman et al.[11] sampled 1,181 appointments over a 2 month period andcreated a no-show model using multivariate logistic regres-sion analysis with four factors; patient age, race, attendancehistory, and psychological problems. Unfortunately, theseand other studies do not present consistent conclusions. Thisindicates that important no-show predictors vary acrossclinics and predictive models have to be configured basedon the individual clinic’s background and circumstance.Further, it is of note that these no-show studies wereperformed on historical data recorded under traditional longterm appointment scheduling conditions. As open access isimplemented, most practitioners expect significant no-showreductions, which implies that no-show prediction modelscan be quickly outdated. Thus, one of the first steps in theconfiguring open access for a given clinic is to develop aprocess for assessing and updating no-show prediction models.
Looking briefly at the literature on appointment sched-uling, Cayirli and Veral [4] provided an extensive review ofthe appointment scheduling literature. They categorize theappointment scheduling literature by the following attri-butes: (a) static vs. dynamic; (b) performance measures; (c)appointment system design; and (d) methodology. Thefollowing, briefly discusses (a)–(d) and cite representativepapers. For a detailed discussion, we refer the reader to [4].
In static appointment scheduling, all decisions aboutappointment times are made prior to the start of a session,whereas in the dynamic case, appointment times areadjusted as patients arrive for service. Most outpatientliterature deals with the static case, which typically involvesN punctual patients with independent and identicallydistributed service times, to be scheduled for a singlesession with a single physician. Complications include
Fig. 2 Mix of open and longterm scheduling slots
Health Care Manage Sci (2007) 10:111–124 113

physician lateness, non-punctual patients, and multi-stagecheck-in, service, and check-out procedures. A representa-tive set of recent static papers includes [14, 25, 29].
Performance measures dictate how a given schedule is tobe evaluated. These are categorized as time, congestion, orfairness based. Time based measures weight some functionof patient waiting, physician idleness, and staff overtime.Congestion measures capture features such as queue lengthand waiting room overcrowding, and fairness measures tryto distribute patient waiting time evenly over the day [20].
Appointment system design is specified by threeparameters, the “block,” the number of patients arriving atthe beginning of an appointment period, the “initial block,”the number of patients arriving for the initial appointment,and the “interval,” the length of the appointment intervalwhich is either fixed or variable. For example, theIndividual-block/Fixed-interval is a typical design in whichone patient is scheduled to arrive at the beginning of eachappointment interval and each interval is of equal length.Also, appointment systems can be designed to use patientclassification systems, which try to provide better estima-tions of service times and no-show probabilities. Forrepresentative system design studies in complex environ-ments, the reader is referred to [5, 13, 16, 17].
There are two classes of methodology: analytical studiesand simulation. Analytical papers use queuing theory,mathematical programming, and dynamic programmingand tend to focus on the basic appointment schedulingproblem with limited consideration of patient-based envi-ronmental factors such as no-shows and walk-ins. Thesimulation studies focus on comparing detailed appointmentscheduling systems in complex environments. Representa-tive analytical and simulation papers include [18, 25, 29]and [1, 5, 13], respectively. Further, [15] provides a reviewof simulation studies in health care clinics up to 1999.
Finally, although there is some literature providing highlevel discussion of open access, such as [22], there is littlequantitative modeling of open access clinics. Giachetti et al.[10] provides an exception. They develop a systemdynamics model of an open access clinic focused onreducing patient cycle time. Unfortunately, they do notaddress improvements in patient access and quality of careas performance measures, thought to be vital. This dearth ofquantitative modeling and optimization research focusing onopen access is a huge impediment to successful implemen-tation, and the intent of this research to help fill this gap.
3 Methodology and modeling
This section describes the methodology followed inperforming this work (please see Fig. 3). The first stepwas to design the project. In collaboration with clinical
partners, the effects of several open access variables oncontinuity of care and patient flow in the clinic werestudied. To accomplish this, a decision was made todevelop a simulation model that would encompass thepatient call-in process, patient no-show probabilities basedon significant clinic and patient attributes, and the patientarrival process and flow within the clinic. After makingthese decisions, list of input data needing to be collected,analyzed, and developed for the study was generated, andmethods of data analysis both from published methods andprior experience were selected. A simulation frameworkthat would both integrate and separate the patient call-inprocess and patient flow within the clinic was also
Project Design • Identify o Objectives o Performance Measures o Modeling Approach o Clinical Factors and Hypotheses o Required Data
• Design and Select o Simulator Framework o Model Development and Validation Plan o Statistical Methods for No-show and Input Analysis o Simulation Experiments and Output Analysis
Collecting and Developing Data
• Staff Survey • Staff Interviews • Extensive Clinic Observation • Historical Appointment Data
No-show Modeling and Input Analysis
• Survey Analysis • No-show Logit Regression • Distribution Fitting for Timing Data • Patient Flow Charts and Routing Frequencies • No-show vs Lead Time Modeling
Model Building
• Coding and Troubleshooting • Queuing Model Development • Simulator Validation
Experimentation and Output Analysis
• Simulator Execution • Analysis of Variance • Plots of Significant Effects • Interpreting Results
Fig. 3 Project methodology
114 Health Care Manage Sci (2007) 10:111–124

developed. The next step was planning the model develop-ment and validation stages, and developing initial hypoth-eses and designing experiments for testing these. Aftercollecting and analyzing input data, constructing and testingthe no-show model, and building and validating simulationmodels, experiments were preformed and hypothesestested. The following subsections discuss several aspectsof these steps in more detail.
3.1 Performance measures
The performance measures considered in this work werepatient continuity of care and clinic throughput in the clinic.Few studies have addressed the continuity of care issue,which is critically important since patients who see theirown physicians, the physicians who know them best, tendto receive better treatment at lower cost. For example, aphysician unfamiliar with a patient’s characteristics mightprescribe medication or order tests that the patient’s regularphysician would not. Thus, continuity of care is importantfor patient health and for controlling costs [12, 27, 28].
Clinic throughput is a measurement of the overall effectof the daily demand, the actual no-show rate of the clinicand the number of appointments successfully booked with apatient’s care group. Clinic throughput as a system wasselected as a performance measure since open access isintended to help stabilize the clinic operating environmentby reducing patient no-show.
Continuity of care was measured by using the fraction ofpatients able to obtain appointments with their desiredphysician (or a member of their care group), and clinicthroughput by the number of patients checking in.
Other relevant statistics collected from the simulationwere as follows:
1. Number of appointments booked;2. Number of appointments booked with provider/provid-
er group;3. Number of patients double booked;4. Patient cycle time in the clinic.
3.2 Open access variables
The variables felt to be most important according to theclinical collaborators include:
1. Fraction of patients using open access;2. Scheduling horizon or appointment lead time, i.e., how
far in advance non-open access patients can scheduleappointments;
3. Provider care groups, small groups of physicians whocare for one another’s patients;
4. Overbooking procedures.
The fraction of patients on open access indicates thepatient population being served on open access scheduling.For example, if 25% of the clinic’s patients requirerecurring, periodic appointments, then the clinic mightwant to use long term scheduling for this 25% and place theother 75% on open access. This, along with no-show rates,will influence the proportion of daily slots that the clinicneeds to dedicate for open and long term schedulingpurposes. It will also require that the clinic select ascheduling horizon within which to book these longer termappointments. The length of this horizon represents themaximum possible appointment lead time, which iscommonly believed to affect patient no-show.
As previously mentioned, physician work patterns haveto be closely considered when using open access. Forexample, if a patient’s physician consults only on Mondaysand Tuesdays and the patient calls on Wednesday, thescheduler might either try to schedule the patient foranother physician or ask the patient to call back on Friday,neither of which seems satisfactory. One solution is for thephysician to participate with other physicians in a providercare group. Within such a group, physicians becomefamiliar with and help treat one another’s patients, and,ideally, a large part of the clinic week could be covered bythe combined schedules of physicians in the group.Provider care groups seem especially important in teachingenvironments where a large number of the consultations aredone by residents who are under the supervision of theteaching physicians. Thus the effect of provider care groupscomposed of teaching physicians and residents was a majorconcern for the clinical partners.
Overbooking is useful in situations where there is asignificant chance of no-show. Overbooking has been usedin airline scheduling for many years (see [26] for anengaging review of the evolution of airline overbookinginto an acceptable practice). Clinical overbooking, which isnecessary to prevent under-utilization of clinic resourcesand physician idle time, differs significantly from airlineoverbooking and thus the airline models are not applicable(for a detailed discussion, see [23]). In this paper, a simpledouble-booking policy that allows at most two patients tobe booked to a slot is applied, and then only if thelikelihood of both showing up falls beneath a specifiedthreshold-0.6 in this work, are patients double booked.
3.3 No-show and input modeling
As discussed in Section 3.1, after deciding on the modelingobjectives and approach, the types of input data thoughtnecessary were listed. This list included (1) the patient andclinical attributes that physicians and staff felt were mostimportant in predicting patient no-show; (2) historical no-
Health Care Manage Sci (2007) 10:111–124 115

show data categorized with respect to these importantattributes; (3) patient call-in rates with proportions ofpatients exhibiting important no-show attributes; (4) de-tailed clinic operations, capacities, and flow of patientswithin the clinic; and (5) timing data associated with eachof the important clinical functions. This data and informa-tion were collected and developed over a period of severalmonths, during which surveys, interviews, and extensiveon-site observations were conducted.
Thirty-eight clinic staff members were also surveyed onwhat they felt were the most important factors impactingno-show behavior at their clinic. They identified age,insurance type, attendance history, appointment session(morning or afternoon), appointment type (new or return-ing), weather, waiting time of previous visit, and appoint-ment lead time (how far in advance an appointment isbooked). Two years worth of appointment and no-showdata were then collected for the first six variables, as therewas no data available for the ‘waiting time of previousvisit’ and ‘appointment lead time.’ The data was collectedfrom the clinic’s historical records, categorized with respectto these six indicators, and a logistic response function wasconstructed to estimate the probability of a patient noshowing. The session, weather, insurance, and age group,along with several two-factor interactions were found to bestatistically significant for this clinic. Figure 4 demonstratesthe relationship between the observed and predicted no-show rates for 960 patients with more than 30 appoint-ments. The observed and predicted rates agree overall, withan R2 value of 0.8071 indicating a reasonable model. Theweighted standard prediction error based on the frequencyof appointment category is 3.6% (for more details, see [24]).
The historical no-show data collected was recordedduring a period when lead times could be as great as6 months. Unfortunately, the impact of appointment leadtime on patient no-show could not be considered since thisdata was not recorded. The clinical partners believed thatlead time would have a significant effect, and so to capturethis, the no-show rates were adjusted according to thefunction f x! " # 1$ 0:5*e$0:017x, where x is the appoint-ment lead time. The exponential form was selected from anumber of possible forms including a linear decreasingfunction and adjusting the no-show rate according to aconstant factor. The memoryless property of the exponen-tial was determined to be most suitable because (1) eachday is independent as is the patient’s need for anappointment and (2) the exponential function is able tocapture the diminishing effects of the marginal changes inthe no-show probability. In an effort of conservatism, thefunction was modeled so that the no-show rate wouldimprove at most by half, and the decay constant of 0.017was found to best fit the description of this distribution. Asillustrated in Fig. 5, this model will reduce a patient’sestimated no-show rate by 50% if the patient is scheduledwithin one day (a lead time of zero). For example, if apatient’s estimated no-show probability is 30% and thepatient is scheduled for an appointment on the dayfollowing the appointment call, the model will estimatethe patient’s no-show probability to be 15%.
For clinic operations and patient flow, extensive staffinterviews and observations recording the arrival and flowprocesses of approximately 2,450 patients over a 4 weekperiod were conducted. Patient arrival times, check-intimes, waiting-room times, time in consultation with nursesand doctors, and check-out times were also collected. Theclinic operates from 8:00 to 16:30 or until the last patient isdischarged. Appointments are scheduled for 15 min forreturning patients and 30 min for new patients. These timesare increased slightly for residents. Patients check-in with
0
0.2
0.4
0.6
0.8
0 0.1 0.2 0.3 0.4 0.5 0.6 0.7 0.8
Predicted non-attendance rate
Ob
serv
ed
no
n-a
tten
da
nce r
ate
R =0.80712
Fig. 4 Observed and predicted no-show
0
0.1
0.2
0.3
0.4
0.5
0.6
0.7
0.8
0.9
1
1 10 19 28 37 46 55 64 73 82 91 100
Days to Appointment
Adj
uste
d N
o-S
how
Pre
dict
ion
Fig. 5 Proposed no-show vs lead time model
116 Health Care Manage Sci (2007) 10:111–124
one of two Patient Service Assistants (PSA) at the check-indesk and then wait until being called to the examinationroom. After being called, the patient is either be assessed bya physician (40% of patients), a nurse (27% of patients), orboth (33% of patients). After consultation, the patient goesto check-out, a station staffed by two other PSA’s who bookfollow-up appointments if necessary. In this clinic, facultyphysicians work two days per week and residents work one.The clinic has seven nurses, ten physicians, and 20residents, and, on any given day, two physicians and threeresidents are scheduled.
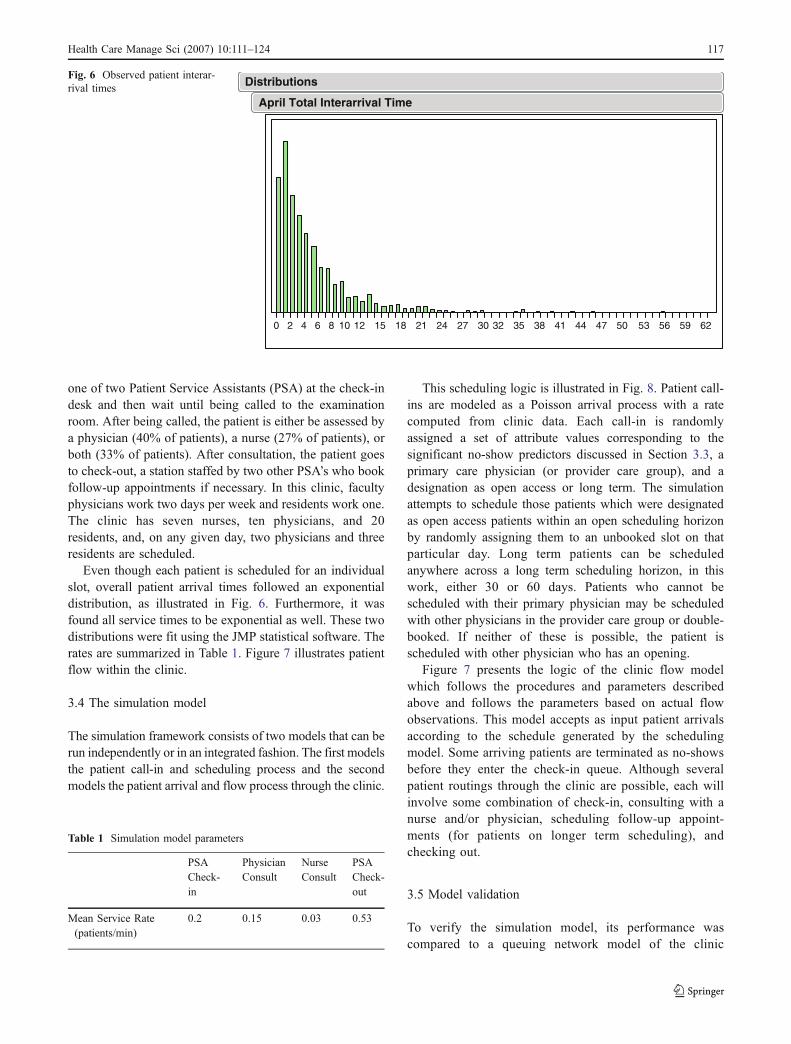
Even though each patient is scheduled for an individualslot, overall patient arrival times followed an exponentialdistribution, as illustrated in Fig. 6. Furthermore, it wasfound all service times to be exponential as well. These twodistributions were fit using the JMP statistical software. Therates are summarized in Table 1. Figure 7 illustrates patientflow within the clinic.
3.4 The simulation model
The simulation framework consists of two models that can berun independently or in an integrated fashion. The first modelsthe patient call-in and scheduling process and the secondmodels the patient arrival and flow process through the clinic.
This scheduling logic is illustrated in Fig. 8. Patient call-ins are modeled as a Poisson arrival process with a ratecomputed from clinic data. Each call-in is randomlyassigned a set of attribute values corresponding to thesignificant no-show predictors discussed in Section 3.3, aprimary care physician (or provider care group), and adesignation as open access or long term. The simulationattempts to schedule those patients which were designatedas open access patients within an open scheduling horizonby randomly assigning them to an unbooked slot on thatparticular day. Long term patients can be scheduledanywhere across a long term scheduling horizon, in thiswork, either 30 or 60 days. Patients who cannot bescheduled with their primary physician may be scheduledwith other physicians in the provider care group or double-booked. If neither of these is possible, the patient isscheduled with other physician who has an opening.
Figure 7 presents the logic of the clinic flow modelwhich follows the procedures and parameters describedabove and follows the parameters based on actual flowobservations. This model accepts as input patient arrivalsaccording to the schedule generated by the schedulingmodel. Some arriving patients are terminated as no-showsbefore they enter the check-in queue. Although severalpatient routings through the clinic are possible, each willinvolve some combination of check-in, consulting with anurse and/or physician, scheduling follow-up appoint-ments (for patients on longer term scheduling), andchecking out.
3.5 Model validation
To verify the simulation model, its performance wascompared to a queuing network model of the clinic
0 2 4 6 8 10 12 15 18 21 24 27 30 32 35 38 41 44 47 50 53 56 59 62
April Total Interarrival Time
DistributionsFig. 6 Observed patient interar-rival times
Table 1 Simulation model parameters
PSACheck-in
PhysicianConsult
NurseConsult
PSACheck-out
Mean Service Rate(patients/min)
0.2 0.15 0.03 0.53
Health Care Manage Sci (2007) 10:111–124 117

Patient Arrives
Check In
Is patient seeing a Nurse/ Technician or
Physician?
Y
Is Receptionist Available?
Physician Available?
End
See Physician
N
Y
Nurse/ Technician Available?
Y
Nurse/Technican
N
Wait
Physician
Wait
Y
NWait
N
Nurse/Technician Need to See Physician? Y
Check OutIs Check Out Receptionist Available?
Follow Up Appointment Required?
Wait
N
Y
Book Follow UP
Fig. 7 Clinical patient flow
Fig. 8 Appointment scheduling logic
118 Health Care Manage Sci (2007) 10:111–124

operations. The queuing model itself was validated early inthe project against observed data and was found to performwell with validation results listed in Table 2. The queueingmodel was a simple, less intricate model than thesimulation model, and thus easier to validate. Once it wasvalidated, it was used to verify the performance of the sim-ulation model. Service times and rates in both the queuingand simulation model were set according to the timing datacollected. There was a reasonable agreement between thetwo models on measures such as patient time in system andaverage queue lengths and strong agreement between thetime in system in the simulation model and observed data.It is of note that there are fundamental theoretical differ-ences between the simulation and queuing models. Unlikethe simulation model with distinct queues for each resourceat a service station, the queuing network has aggregatedresources at each station with a single queue for eachserver. Thus, as expected, the number of patients is larger ina single queue system when compared to the multi-queuesimulation model. Furthermore, the steady state analysis ofthe queuing network represents a continually running clinic,whereas the simulated clinic operates for only 9 h a day.Therefore the differences in these measures are expected andalso serve as good indicators of deviation from steady state.
Considerable time was spent running simulation pre-trials and assessing the behavior and believability of thesimulation model and its outputs. After a month of this typeof work, it was felt that the models were providing a validrepresentation of the actual clinic.
3.6 Model execution
The two-phased discrete-event simulation model wasconstructed using Automod 11.2. Each experimental sched-uling policy was run for a 90 days with three iterations. Toreflect the true booking state of a clinic, the length of thewarm-up period was the same as the appointment lead timefor non-open access patients. For example, if the long termscheduling horizon was 30 days, the warm up period wasset to at least 30 days. The following section will discussthe experimental design and results.
4 Hypothesis statements and design of experiments
The main hypotheses (stated in Table 3) are the straightfor-ward default hypotheses tested by a 24 full factorial design.Three replications were performed and a second-ordermodel is assumed. The three- and four-factor interactionswere used to estimate experimental error. Table 4 providesthe levels of the experimental factors that were discussed inthe preceding section. These levels were developed indiscussions with clinic staff and were deemed to bereasonable settings for the clinic. To enable a systematicexploration of the design specifications, the levels were setas far apart as possible clinic resources allow.
5 Results
This section details the results of the model. The ANOVAtables for an !=0.05 and effect plots for the twoperformance measures: continuity of care and clinicthroughput are presented. The significant effects areinterpreted and discussed as well. Table 5 provides thedetailed results of the 24 design. The negative sign indicatesthat a factor is set at its lowest level, while a positive sign isa factor set to its highest level. For example Test 2 would bein the case in which the fraction of patients allowed onopen access is set at 75% of the patient base, while theappointment lead time for those patients not on open access
Table 2 Validation results
SimulationModel
ObservedData
QueuingModel
Average Time in System(min)
43.6 45.8 38.2
Average Number of Patientsin MD Station
0.65 n/a 1.05
Table 3 Null hypotheses for 24 full factorial design
Hypotheses Tested by a 24 Full Factorial Design
1. Continuity of care is not affected by fraction of patients on openaccess.
2. Continuity of care is not affected by appointment lead time for longterm patients (scheduling horizon).
3. Continuity of care is not affected by provider care groups.4. Continuity of care is not affected by double-booking.5. Clinic throughput is not affected by fraction of patients on openaccess.
6. Clinic throughput is not affected by appointment lead time for longterm patients (scheduling horizon).
7. Clinic throughput is not affected by provider care groups.8. Clinic throughput is not affected by double-booking.
Table 4 Experimental factors
Factors Low Level(!)
High Level(+)
A Fraction of patients using openaccess
25 75
B Appointment lead time (schedulinghorizon)
30 60
C Number of doctors in a “providercare group”
1 3
D Allow double booking No Yes
Health Care Manage Sci (2007) 10:111–124 119

is 30 days, the number of doctors in a care group is 1 anddouble booking in not allowed. As all the confidenceintervals are short, three replications of each test wasdeemed sufficient.
5.1 Continuity of care
From the ANOVA of Table 6 and the corresponding maineffects plot (Fig. 9), all main effects are significant exceptappointment lead time (scheduling horizon). Also, all twofactor interactions that do not contain appointment leadtime are also significant (Fig. 10 plots the most significantfactors: fraction of patients using open access and the sizeof provider care group). The simulation data supportsrejecting null hypotheses 1, 3, and 4, but not null
hypothesis 2. Further, the interaction between provider caregroup and fraction of patients on open access indicates thatprovider care groups become essential for maintainingcontinuity of care as the fraction of patients on open accessincrease. The conclusion here is that for a clinic tosuccessfully serve a large percentage of the patientpopulation on open access, it is necessary to developprovider care groups and double booking policies.
5.2 Clinic throughput
The ANOVA of Table 7 shows that only fraction of patientson open access and appointment lead time significantlyaffect clinic throughput (Fig. 11), i.e., the ANOVA supportsrejecting null hypotheses 5 and 6 but not null hypotheses 7
Table 5 The 24 design
Test Fraction ofPatients UsingOpen AccessX1
LeadTimeX2
Number ofDoctors in a“Provider CareGroup” X3
AllowDoubleBookingX4
Mean Value forContinuity of Care(Probability of ObtainingAppointment)
ConfidenceInterval forContinuity ofCare
MeanValue forThroughput
ConfidenceInterval forThroughput
1 ! ! ! ! 0.879 (0.876,0.881) 6,168 (6,034,6,303)2 + ! ! ! 0.679 (0.676,0.682) 6,787 (6,643,6,931)3 ! + ! ! 0.880 (0.878,0.882) 4,939 (4,836,5,043)4 + + ! ! 0.668 (0.659,0.676) 6,154 (5,962,6,345)5 ! ! + ! 0.940 (0.936,0.944) 6,246 (6,148,6,344)6 + ! + ! 0.819 (0.810,0.827) 6,668 (6,545,6,791)7 ! + + ! 0.938 (0.935,0.940) 4,959 (4,884,5,034)8 + + + ! 0.818 (0.816,0.819) 5,676 (4,596,6,756)9 ! ! ! + 0.910 (0.909,0.912) 6,318 (6,288,6,348)10 + ! ! + 0.727 (0.720,0.734) 6,877 (6,790,6,965)11 ! + ! + 0.905 (0.902,0.909) 5,026 (4,981,5,072)12 + + ! + 0.723 (0.719,0.728) 6,240 (6,152,6,321)13 ! ! + + 0.944 (0.937,0.950) 6,175 (6,033,6,317)14 + ! + + 0.839 (0.828,0.849) 5,999 (5,977,6,022)15 ! + + + 0.948 (0.946,0.950) 4,903 (4,888,4,918)16 + + + + 0.844 (0.840,0.848) 6,178 (6,081,6,277)
Table 6 ANOVA for continu-ity of care
Letter a indicates two-factoreffects.
Source DF SS MS F P
Allow Double Booking 1 0.003078 0.0031 264.93 0Provider Care Group 1 0.03219 0.0322 2,770.36 0Fraction of Patients 1 0.094198 0.0942 8,106.83 0Lead Time 1 0.000009 0.0000 0.73 0.431Allow Double BookingaProvider Care Group 1 0.000631 0.0006 54.33 0.001Allow Double Bookinga Fraction of Patients 1 0.000391 0.0004 33.65 0.002Allow Double BookingaLead Time 1 0.000012 0.0000 1.03 0.357Provider Care Groupa Fraction of Patients 1 0.006723 0.0067 578.56 0Provider Care GroupaLead Time 1 0.00004 0.0000 3.46 0.122Fraction of PatientsaLead Time 1 0.000005 0.0000 0.45 0.531Error 5 0.000058 0.0000Total 15 0.137336R2=99.96%
120 Health Care Manage Sci (2007) 10:111–124
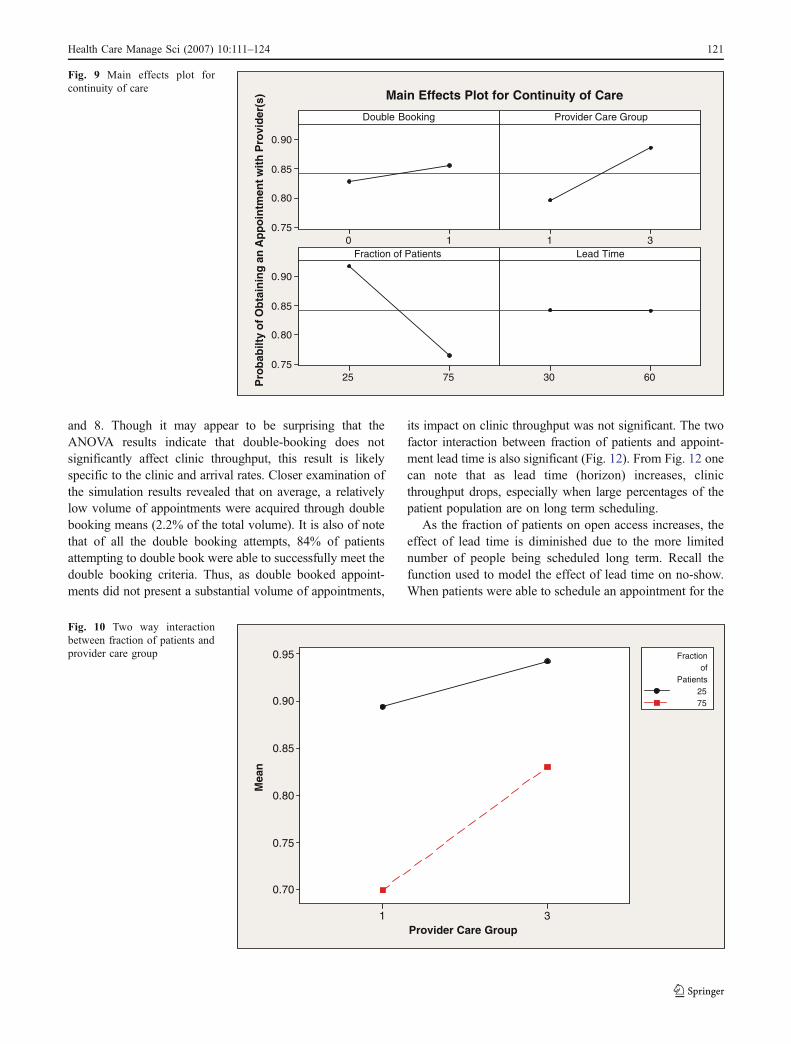
and 8. Though it may appear to be surprising that theANOVA results indicate that double-booking does notsignificantly affect clinic throughput, this result is likelyspecific to the clinic and arrival rates. Closer examination ofthe simulation results revealed that on average, a relativelylow volume of appointments were acquired through doublebooking means (2.2% of the total volume). It is also of notethat of all the double booking attempts, 84% of patientsattempting to double book were able to successfully meet thedouble booking criteria. Thus, as double booked appoint-ments did not present a substantial volume of appointments,
its impact on clinic throughput was not significant. The twofactor interaction between fraction of patients and appoint-ment lead time is also significant (Fig. 12). From Fig. 12 onecan note that as lead time (horizon) increases, clinicthroughput drops, especially when large percentages of thepatient population are on long term scheduling.
As the fraction of patients on open access increases, theeffect of lead time is diminished due to the more limitednumber of people being scheduled long term. Recall thefunction used to model the effect of lead time on no-show.When patients were able to schedule an appointment for the
Pro
babi
lty o
f Obt
aini
ng a
n A
ppoi
ntm
ent w
ith P
rovi
der(
s)
10
0.90
0.85
0.80
0.7531
7525
0.90
0.85
0.80
0.756030
Double Booking Provider Care Group
Fraction of Patients Lead Time
Main Effects Plot for Continuity of Care
Fig. 9 Main effects plot forcontinuity of care
Provider Care Group
Mea
n
31
0.95
0.90
0.85
0.80
0.75
0.70
2575
Patientsof
Fraction
Fig. 10 Two way interactionbetween fraction of patients andprovider care group
Health Care Manage Sci (2007) 10:111–124 121
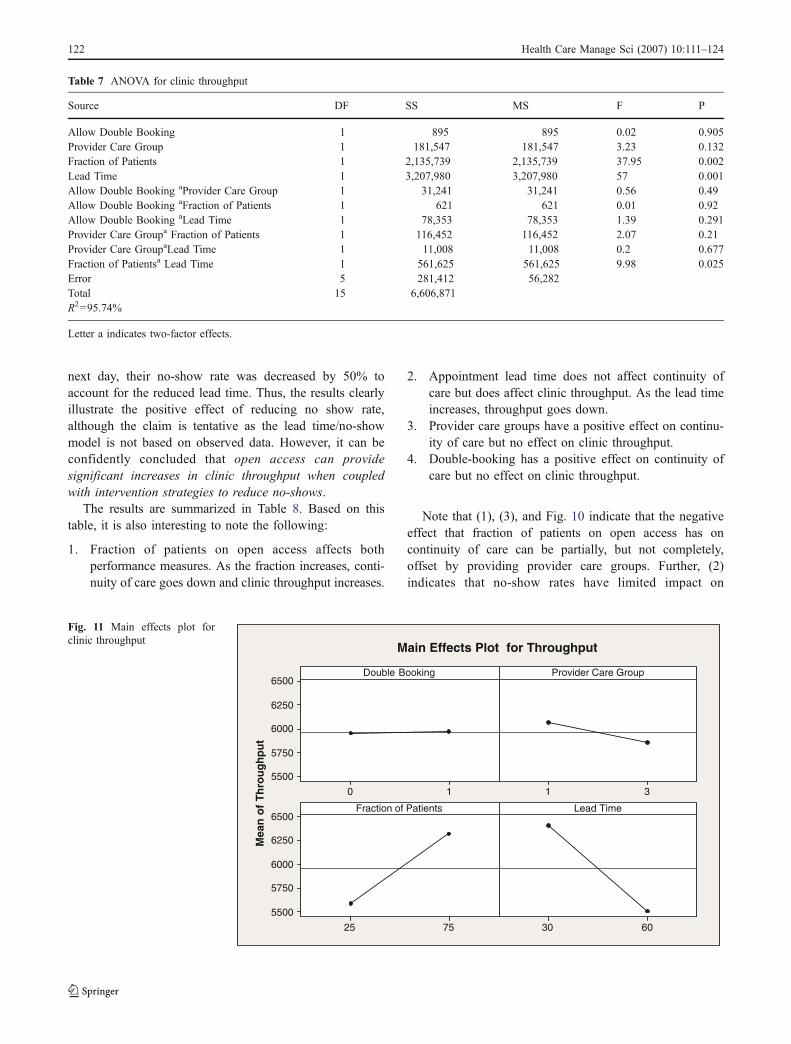
next day, their no-show rate was decreased by 50% toaccount for the reduced lead time. Thus, the results clearlyillustrate the positive effect of reducing no show rate,although the claim is tentative as the lead time/no-showmodel is not based on observed data. However, it can beconfidently concluded that open access can providesignificant increases in clinic throughput when coupledwith intervention strategies to reduce no-shows.
The results are summarized in Table 8. Based on thistable, it is also interesting to note the following:
1. Fraction of patients on open access affects bothperformance measures. As the fraction increases, conti-nuity of care goes down and clinic throughput increases.
2. Appointment lead time does not affect continuity ofcare but does affect clinic throughput. As the lead timeincreases, throughput goes down.
3. Provider care groups have a positive effect on continu-ity of care but no effect on clinic throughput.
4. Double-booking has a positive effect on continuity ofcare but no effect on clinic throughput.
Note that (1), (3), and Fig. 10 indicate that the negativeeffect that fraction of patients on open access has oncontinuity of care can be partially, but not completely,offset by providing provider care groups. Further, (2)indicates that no-show rates have limited impact on
Table 7 ANOVA for clinic throughput
Source DF SS MS F P
Allow Double Booking 1 895 895 0.02 0.905Provider Care Group 1 181,547 181,547 3.23 0.132Fraction of Patients 1 2,135,739 2,135,739 37.95 0.002Lead Time 1 3,207,980 3,207,980 57 0.001Allow Double Booking aProvider Care Group 1 31,241 31,241 0.56 0.49Allow Double Booking aFraction of Patients 1 621 621 0.01 0.92Allow Double Booking aLead Time 1 78,353 78,353 1.39 0.291Provider Care Groupa Fraction of Patients 1 116,452 116,452 2.07 0.21Provider Care GroupaLead Time 1 11,008 11,008 0.2 0.677Fraction of Patientsa Lead Time 1 561,625 561,625 9.98 0.025Error 5 281,412 56,282Total 15 6,606,871R2=95.74%
Letter a indicates two-factor effects.
Mea
n of
Thr
ough
put
10
6500
6250
6000
5750
550031
7525
6500
6250
6000
5750
55006030
Double Booking Provider Care Group
Fraction of Patients Lead Time
Main Effects Plot for Throughput
Fig. 11 Main effects plot forclinic throughput
122 Health Care Manage Sci (2007) 10:111–124

continuity of care but significantly affect clinic perfor-mance. Finally, (4) indicates that the double-booking policyimplemented in this work helps patients gain access to theirphysician but does not significantly increase the number ofpatients served by the clinic.
6 Conclusion
In this work, a simulation model was developed to studythe effects of clinic parameters on open access implementa-tion. The simulation framework proposed and implemented,integrates models of the call-in process, patient no-show, andclinic performance. The work described here is also thefundamental component of the overall modeling frameworkand implementation approach described in [6]. Using themethodology and an exhaustive set of data collected from amajor tertiary teaching hospital with over 950 facultyphysicians, the effect of various design parameters on
continuity of care and clinic throughput were investigated.The analysis indicates that the fraction of patients servedunder open access affects both the continuity of care andthe clinic throughput. Further, it indicates that double-booking has a significant effect in increasing continuity ofcare while appointment lead-time has a significant effect inincreasing clinic throughput. Provider care groups werefound to lead to significant increases in continuity of care,and that these are essential when a large percentage ofpatients are served on open access.
The results indicate that by moving to open access andshortening appointment lead times for long term schedul-ing, clinics can serve more patients. However, if a clinic istoo aggressive in implementing open access, that is, if aclinic initially puts too many patients on open access, thencontinuity of care will be significantly compromised,resulting in higher treatment costs, and physician andpatient dissatisfaction. These negative effects can bepartially offset by developing provider care groups and byusing some overbooking. However, these techniques
Lead Time
Mea
n
6030
6600
6400
6200
6000
5800
5600
5400
5200
5000
2575
Patientsof
Fraction
Fig. 12 Two way interactionbetween fraction of patients andhorizon
Table 8 Summary of null hypotheses rejected
Reject Fail to Reject
1. Continuity of care is not affected by fraction of patients on open access. !
2. Continuity of care is not affected by appointment lead time for long term patients. !
3. Continuity of care is not affected by provider care groups. !
4. Continuity of care is not affected by double-booking. !
5. Clinic throughput is not affected by fraction of patients on open access. !
6. Clinic throughput is not affected by appointment lead time for long term patients. !
7. Clinic throughput is not affected by provider care groups. !
8. Clinic throughput is not affected by double-booking. !
Health Care Manage Sci (2007) 10:111–124 123

require education, refinement, and assimilation by clinicstaff, physicians, and the patient population, which neces-sitates very carefully planned, timely implementations. Thetypes of systems analysis tools developed in this and otherworks are essential for achieving this smooth, timelytransition from traditional scheduling to open access, andthat systems analysis maximizes the probability of success.
The sources of error related to these results includepossible inaccuracies associated with the patient specific no-show adjustment function. Historical data linking appoint-ment lead time and no-show is required as is a morethroughout function approximation. However the functionas presented was deemed sufficiently robust to be used as abenchmark for similar studies. There are many possibleextensions to the basic set of tools presented in this work. Amore generic model can be constructed to allow for easierinter-clinic transferability. This work could be extended toconsider a range of operating levels for the four factorsstudies rather than their extremes and the optimal operatingconditions could be established using response surfaceoptimization. Experimentation with the arrival rate increasesand its impact on overbooking volumes would be insightful.
References
1. Babes M, Sarma G (1991) Out-patient queues at the Ibn-Rochdhealth centre. J Oper Res Soc 42(10):845–855
2. Bean AG, Talaga J (1995) Predicting appointment breaking. JHealth Care Mark 15(1):29–34
3. Brahimi M, Worthington DJ (1991) Queueing models for out-patient appointment systems—a case study. J Oper Res Soc 42(9):733–746
4. Cayirli T, Veral E (2003) Outpatient scheduling in health care: areview of literature. Prod Oper Manag 12(4):519–549
5. Cayirli T, Veral E, Rosen H (2006) Designing appointmentscheduling systems for ambulatory care services. Health CareManage Sci 9:47–58
6. DeLaurentis P, Kopach R, Rardin R, Lawley M, Muthuraman K,Wan H, Ozsen L, Intrevado P (2006) Open access appointmentscheduling—an experience at a community clinic. Proceedings of2006 IIE annual conference and exposition, Orlando, FL
7. Dervin JV, Stone DL, Beck CH (1978) The no-show patient in themodel family practice unit. J Fam Pract 7(6):1177–1180
8. Deyo RA, Inui TS (1980) Dropouts and broken appointments.Med Care 18(11):1146–1157
9. George A, Rubin G (2003) Non-attendance in general practice: asystematic review and its implications for access to primary healthcare. Fam Pract 20:178–184
10. Giachetti R, Centeno EA, Centeno MA, Sundaram S (2005)Assessing the viability of an open access policy in an outpatientclinic: a discrete-event and continuous simulation modeling
approach. Proceedings of the 2005 winter simulation conference,pp 2246–2255
11. Goldman L, Freidin R, Cook F, Grich P (1982) A multivariateapproach to the prediction of no-show behavior in a primary carecenter. Arch Intern Med 142:563–567
12. Grumbach K, Bodenheimer T (2002) A primary care home forAmericans: putting the house in order. JAMA 288(7):889–893
13. Harper P, Gamlin H (2003) Reduced outpatient waiting times withimproved appointment scheduling: a simulation modeling ap-proach. OR Spectrum 25:207–222
14. Ho C-J, Lau H-S (1992) Minimizing total cost in schedulingoutpatient appointments. Manage Sci 38(12):1750–1764
15. Jun JB, Jacobson SH, Swisher JR (1999) Application of discrete-event simulation in health care clinics: a survey. J Oper Res Soc50(2):109–123
16. Kennedy J, Hsu J (2003) Implementation of an open accessscheduling system in a residency training program. Fam Med 35(9):666–670
17. Klassen KJ, Rohleder TR (2004) Outpatient appointment sched-uling with urgent clients in a dynamic multi-period environment.Int J Serv Ind Manag 15(2):167–186
18. Koizumi N, Kuno E, Smith TE (2005) Modeling patient flowsusing a queuing network with blocking. Health Care Manage Sci8(1):49–60
19. Lee VJ, Earnest A, Chen MI, Krishnan B (2005) Predictors offailed attendances in a multi-specialty outpatient centre usingelectronic databases. BMC Health Serv Res 5:51
20. Mondschein S, Weintraub G (2003) Appointment policies inservice operations: a critical analysis of the economic framework.Prod Oper Manag 12(2):266–286
21. Murdock A, Rodgers C, Lindsay H, Than TCK (2002) Why dopatient not keep their appointments? Prospective study in agastroenterology outpatient clinic. J R Soc Med 95:284–286
22. Murray M, Berwick DM (2003) Advanced access: reducingwaiting and delays in primary care. JAMA 289(8):1035–1040
23. Muthuraman K, Lawley M (2006) A stochastic overbookingmodel for outpatient clinical scheduling with no-shows.(in revision)
24. Qu X, Rardin RL, Williams JAS, Tieman L, Wan H, Willis DR,Rosenman MB A statistical model for the prediction of patientnon-attendance in a primary care clinic. Proceedings of 2006 IIEannual conference and exposition, Orlando, FL
25. Robinson L, Chen R (2003) Scheduling doctors’ appointments:optimal and empirically based heuristic policies. IIE Trans 35(3):295–307
26. Rothstein M (1985) OR and the overbooking problem. Oper Res33(2):237–248
27. Schers H, van den Hoogen H, Bor H, Grol R, van den Bosch W(2004) Preference for a general practitioner and patients’ evalua-tions of care: a cross-sectional study. Br J Gen Pract 54(506):693–694
28. Stokes T, Tarrant C, Mainous A, Schers H, Freeman G, Baker R(2005) Continuity of care: is the personal doctor still important? Asurvey of general practitioners and family physicians in Englandand Wales, the United States, and The Netherlands. Annals ofFamily Medicine 3(4):353–359
29. Vanden Bosch PM, Dietz DC (2000) Minimizing expectedwaiting in a medical appointment system. IIE Trans 32(9):841–848
124 Health Care Manage Sci (2007) 10:111–124

Reproducedwith permission of the copyright owner. Further reproduction prohibitedwithout permission.