Effects of Climate and Location on Traffic Signs...
17
1 Effects of Climate and Location on Traffic Signs Deterioration: A LiDAR-Based Study in Utah By: Majid Khalilikhah A Term Project Paper CEE 6440 / GIS in Water Resources Instructors: Dr. David Tarboton Dr. David Maidment Fall 2013 Utah State University Logan, Utah
Transcript of Effects of Climate and Location on Traffic Signs...
1
Effects of Climate and Location on Traffic Signs Deterioration:
A LiDAR-Based Study in Utah
By:
Majid Khalilikhah
A Term Project Paper
CEE 6440 / GIS in Water Resources
Instructors:
Dr. David Tarboton Dr. David Maidment
Fall 2013
Utah State University
Logan, Utah
2
ABSTRACT
To meet the MUTCD 2009 and MAP-21 requirements, transportation agencies have
developed methodologies for asset management. In order to address the data challenge, the Utah
Department of Transportation (UDOT) chose mobile LiDAR technology to have comprehensive
information about its road assets in a cost effective manner. Finally, over 97,000 traffic signs
were captured by mobile LiDAR study. In response to the condition of the sign population
surveyed, the rate of deterioration was 6.7%. Since the deterioration on the face of the sign
decreases its legibility, it is important to identify contributing factors to sign deterioration. To do
so, a sort of climate and location data was examined. At the conclusion, it was determined that
average annual temperature, elevation, and exposure of the sign were more important factors.
INTRODUCTION
Transportation agencies across the country have aggressively developed methodologies
to meet the 2009 Manual on Uniform Traffic Control Devices (MUTCD) mandate requiring
investigation of traffic sign retroreflectivity(1). To do so, the implementation of sign
retroreflectivity assessment and management plans to achieve and maintain minimum levels for
signs is necessary. Each of the three management methods outlined in the MUTCD (Expected
Sign Life, Blanket Replacement, and Control Signs) depends on establishing a baseline data set
and conducting of periodic surveys.
In addition, the Moving Ahead for Progress in the 21st Century Act (MAP-21) was
signed into law on July 6, 2012 and it funds surface transportation programs(2). To accomplish
Section 1203 of the MAP-21, USDOT is demanded to announce performance measures in the
areas of the National Highway Performance Program (NHPP), Highway Safety Improvement
Program (HSIP), the Congestion Mitigation and Air Quality Improvement Program (CMAQ),
and the National Freight Movement (Freight) by approximately spring 2015. Thus, MAP-21
performance measures for asset management are driving the need to data informed decisions.
One of the challenges in fulfilling those mandates is collection of sign data due to the
sheer size of sign inventories. Accurate data is important as it serves as the basis for cost efficient
and compliance effective strategies. With tens of thousands or even hundreds of thousand signs
in an agencies inventory, the cost of data collection can be a significant burden. To address the
data challenge, the Utah Department of Transportation (UDOT) has sponsored an effort to have
comprehensive information about its road assets in a cost effective manner. To do so, mobile
LiDAR (light detection and ranging) was investigated and chosen to record over 97,000 traffic
signs under UDOT’s jurisdiction. The hypothesis was that LiDAR could be used to cost
effectively collect data on a large number of signs across a large area.
High legibility and visibility are viable characteristics of traffic signs so ensure that they
convey the sign intended message. While the efficient retroreflectivity only ensures the visibility
of the signs, a study performed by researchers at Utah State University concluded that a decline
in the overall legibility of the sign might be caused by sign deterioration(3). For recorded data,
the Mobile LiDAR classified the sign condition into three groups called as good, fair, and poor.
Being bent, damaged, delaminated, dents, dirty, faded paint, fallen, graffiti, temporary
3
obstructed, rusty, and sticker caused a sign recorded as fair or poor. At the conclusion, 6.70
percent of the surveyed signs were recorded in fair or poor condition. In order to determine the
factors caused sign deteriorations, an analysis might be driven.
The objective of this research is to determine the contributing factors affecting sign
deterioration through utilizing Geographic Information System (GIS). The climate and
environment data was obtained from different online sources. With considering the data and
combining them with the known location of each sign, the effects of a variety of factors on
deterioration rate might be examined. The paper reviews of recent sign retroreflectivity and
deterioration research efforts and current management practices, examines the methodology
utilized to collect data, presents the results of the data analysis, identifies key research findings
and conclusions, and makes recommendations for further research.
BACKGROUND
On May 14, 2012, final revisions were adopted to the Manual on Uniform Traffic Control
Devices (MUTCD) that eliminated the three original target compliance dates for minimum
retroreflectivity levels. Two years from this effective date of revision the following provision
will take effect: “Implementation and continued use of an assessment or management method
that is designed to maintain regulatory and warning sign retroreflectivity at or above the
established minimum levels (1).” The coefficient of retroreflectivity, RA, which is commonly
referred to as retroreflectivity is the ratio of a signs luminance to the illuminance.
In addition, MAP-21 performance measures for asset management are driving the need to
data informed decisions for asset management. One of the challenges in fulfilling that mandate is
collection of sign reflectivity data due to the shear size of sign inventories. To address the data
challenge, the Utah Department of Transportation (UDOT) has sponsored field investigations by
a team of researchers at Utah State University to investigate the effectiveness of data collection
techniques.
Over the course of the past four years, the team has developed data taxonomies, field
collection methods, and post-collection analysis methods. Early research included the
development of standard practices for measuring retroreflectivity with hand-held
retroreflectometers. The lessons learned in those early efforts were incorporated into a data
collection system that included the use of mobile computing devices to capture key parameters.
Data from this effort include was collected on over 1,700 signs located across the state’s major
climatological regions in both rural and urban environments.
While the prior work produced useful findings to further the body of knowledge for
measurement techniques and data requirements, it did not address the issue of scale. To address
this, a third phase of research was conducted leveraging a UDOT Mobile LiDAR-based sign data
collection effort that examined over 97,000 signs. The hypothesis was that LiDAR could be used
to cost effectively collect data on a large number of signs across a large area.
Previous studies were performed focusing on the data collection process for
retroreflectivity of traffic signs. Considering agency operations, site selection, and attribute
4
collection and also the availability of limited data, a collection plan for the Utah Department of
Transportation (UDOT) was developed by researchers at Utah State University using 1,433
UDOT signs(4). By using the same data set, a simple method for sign retroreflectivity
management was presented by proposing a method for preliminary data collection (5). Since the
damage rates of the surveyed signs were higher than their rate of failure, a study was conducted
to examine the factors affecting damage rates using 1,716 recorded traffic signs(3). A risk-based
approach for agencies to follow when checking for compliance of signs with minimum
retroreflectivity levels was recently developed in Pennsylvania (6). Other researchers focused on
long-term deterioration of traffic signs with attention towards color and retroreflectivity to
provide information related to select types of signs(7).
DATA COLLECTION
To meet the MUTCD 2009 and MAP-21 requirements, transportation agencies have
developed methodologies to efficiently assess and manage sign data inventory. The collection of
reliable data is a key factor in successfully implementation of such programs. Since the sample
size is too large and resources and budgets are limited, the selection of a proper data collection
methodology is vital. Taking into consideration the scale of the data, UDOT conducted
leveraging a Mobile LiDAR-based sign data collection effort that examined over 97,000 traffic
signs. In this section of the paper, the methodology utilized to collect sign data is presented as
well as the online sources used to obtain climate and location data.
Mobile LiDAR Technology
To have comprehensive information about its road assets, UDOT embarked on an effort
to collect data in a cost effective manner. To do so, mobile LiDAR was investigated and chosen
for a massive data collection, which included data collection on the following roadway assets:
1. Signs
2. Pavements
3. Pavement Markings
4. Guardrails
5. Reflectors
6. Other Roadway Assets
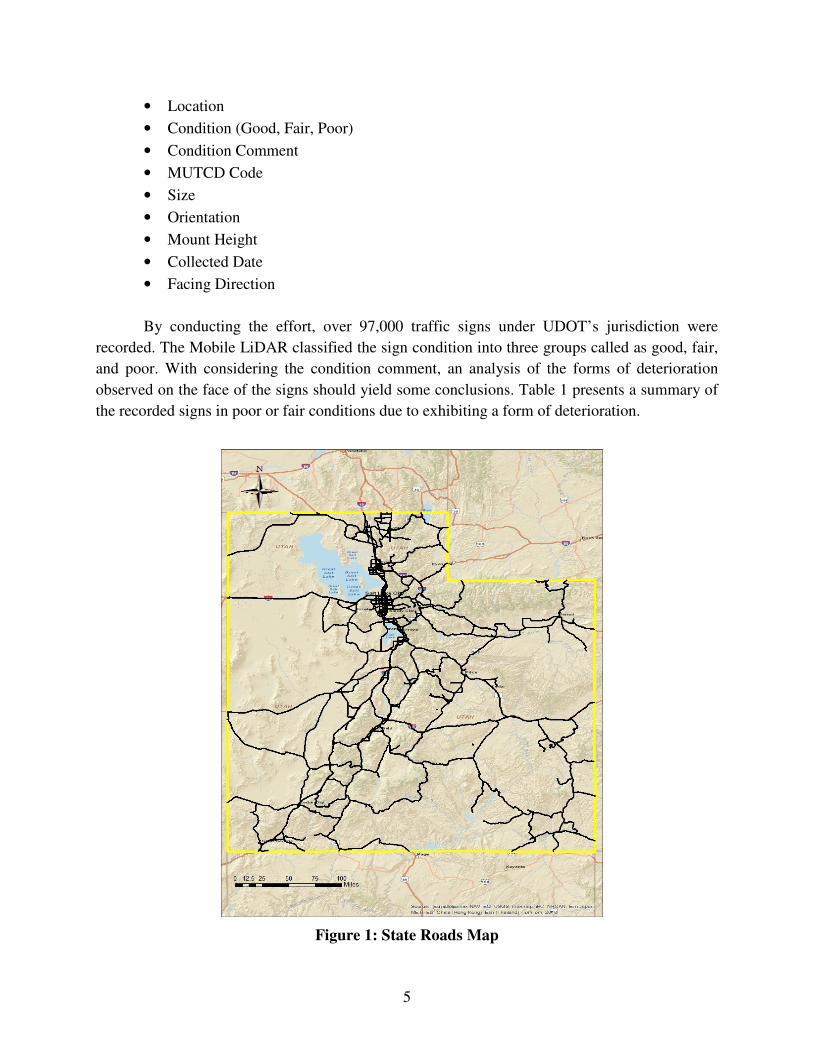
This comprehensive approach way accomplished by the deployment of an instrumented
vehicle drives at freeway speeds and collects many different types of asset data on the roadway.
A map of the state roads that the vehicle drove is shown in Figure 1. The sensors on the UDOT
data collection vehicle include: a LiDAR sensor, a laser road imaging system, a laser rut
measurement system, a laser crack measurement system, a road surface profiler, and a position
orientation system. The data collected by the Mobile LiDAR included the following attributes of
the sign:
5
• Location
• Condition (Good, Fair, Poor)
• Condition Comment
• MUTCD Code
• Size
• Orientation
• Mount Height
• Collected Date
• Facing Direction
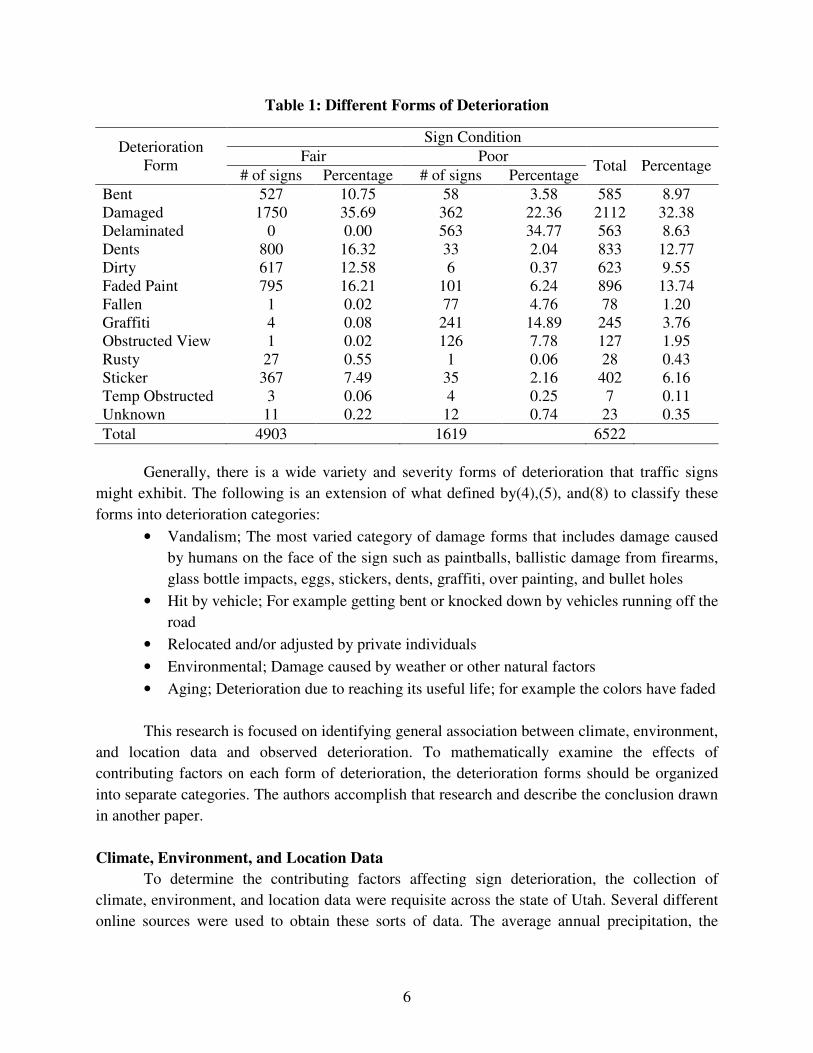
By conducting the effort, over 97,000 traffic signs under UDOT’s jurisdiction were
recorded. The Mobile LiDAR classified the sign condition into three groups called as good, fair,
and poor. With considering the condition comment, an analysis of the forms of deterioration
observed on the face of the signs should yield some conclusions. Table 1 presents a summary of
the recorded signs in poor or fair conditions due to exhibiting a form of deterioration.
Figure 1: State Roads Map
6
Table 1: Different Forms of Deterioration
Deterioration
Form
Sign Condition
Fair Poor Total Percentage
# of signs Percentage # of signs Percentage
Bent 527 10.75 58 3.58 585 8.97
Damaged 1750 35.69 362 22.36 2112 32.38
Delaminated 0 0.00 563 34.77 563 8.63
Dents 800 16.32 33 2.04 833 12.77
Dirty 617 12.58 6 0.37 623 9.55
Faded Paint 795 16.21 101 6.24 896 13.74
Fallen 1 0.02 77 4.76 78 1.20
Graffiti 4 0.08 241 14.89 245 3.76
Obstructed View 1 0.02 126 7.78 127 1.95
Rusty 27 0.55 1 0.06 28 0.43
Sticker 367 7.49 35 2.16 402 6.16
Temp Obstructed 3 0.06 4 0.25 7 0.11
Unknown 11 0.22 12 0.74 23 0.35
Total 4903 1619 6522
Generally, there is a wide variety and severity forms of deterioration that traffic signs
might exhibit. The following is an extension of what defined by(4),(5), and(8) to classify these
forms into deterioration categories:
• Vandalism; The most varied category of damage forms that includes damage caused
by humans on the face of the sign such as paintballs, ballistic damage from firearms,
glass bottle impacts, eggs, stickers, dents, graffiti, over painting, and bullet holes
• Hit by vehicle; For example getting bent or knocked down by vehicles running off the
road
• Relocated and/or adjusted by private individuals
• Environmental; Damage caused by weather or other natural factors
• Aging; Deterioration due to reaching its useful life; for example the colors have faded
This research is focused on identifying general association between climate, environment,
and location data and observed deterioration. To mathematically examine the effects of
contributing factors on each form of deterioration, the deterioration forms should be organized
into separate categories. The authors accomplish that research and describe the conclusion drawn
in another paper.
Climate, Environment, and Location Data
To determine the contributing factors affecting sign deterioration, the collection of
climate, environment, and location data were requisite across the state of Utah. Several different
online sources were used to obtain these sorts of data. The average annual precipitation, the
7
average annual temperature, wind power, elevation, land cover, and municipalities were data
used in this research.
The Parameter-elevation Regressions on Independent Slope Model (PRISM) climate
mapping system was utilized to obtain the thirty year average (1981-2010) annual precipitation
data as well as normal minimum, mean, and maximum annual temperature(9). PRISM group
reveals spatial climate data obtained from a wide range of observations. During the data
collection effort, the elevation of each traffic sign was recorded. To create a map of the elevation
of individual traffic signs, the NED30 digital elevation model from the United State Geological
Survey (USGS) National Elevation Dataset was also used(10).
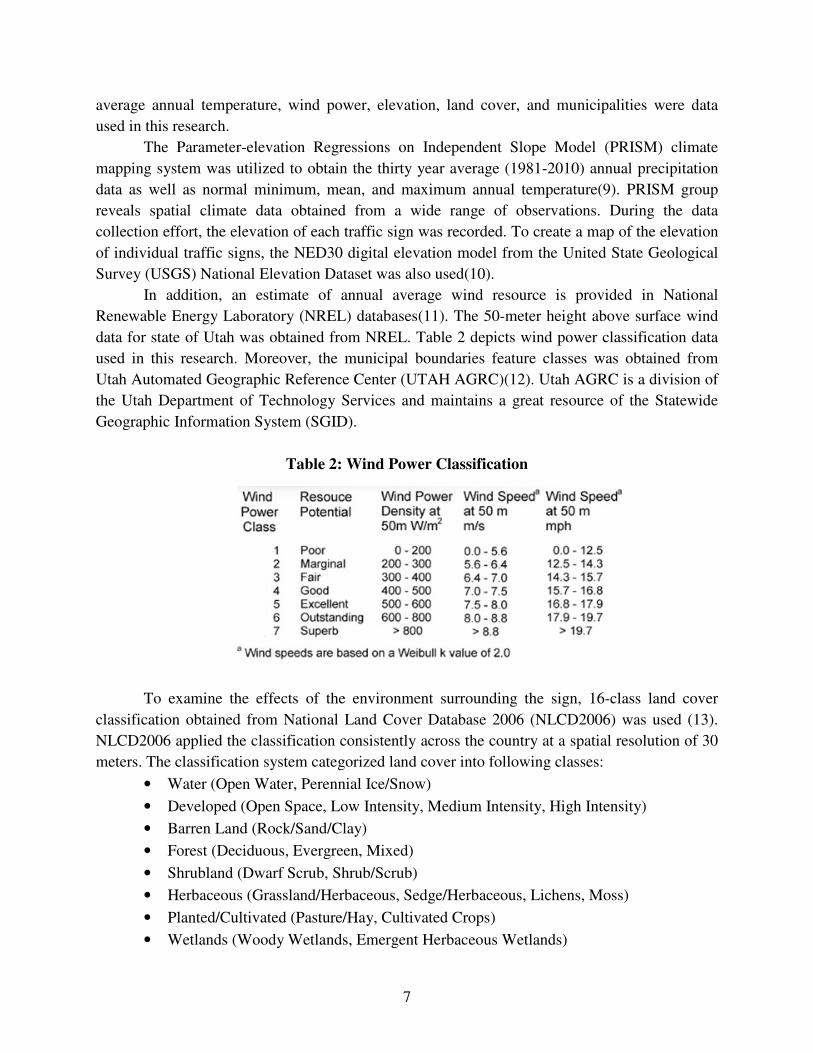
In addition, an estimate of annual average wind resource is provided in National
Renewable Energy Laboratory (NREL) databases(11). The 50-meter height above surface wind
data for state of Utah was obtained from NREL. Table 2 depicts wind power classification data
used in this research. Moreover, the municipal boundaries feature classes was obtained from
Utah Automated Geographic Reference Center (UTAH AGRC)(12). Utah AGRC is a division of
the Utah Department of Technology Services and maintains a great resource of the Statewide
Geographic Information System (SGID).
Table 2: Wind Power Classification
To examine the effects of the environment surrounding the sign, 16-class land cover
classification obtained from National Land Cover Database 2006 (NLCD2006) was used (13).
NLCD2006 applied the classification consistently across the country at a spatial resolution of 30
meters. The classification system categorized land cover into following classes:
• Water (Open Water, Perennial Ice/Snow)
• Developed (Open Space, Low Intensity, Medium Intensity, High Intensity)
• Barren Land (Rock/Sand/Clay)
• Forest (Deciduous, Evergreen, Mixed)
• Shrubland (Dwarf Scrub, Shrub/Scrub)
• Herbaceous (Grassland/Herbaceous, Sedge/Herbaceous, Lichens, Moss)
• Planted/Cultivated (Pasture/Hay, Cultivated Crops)
• Wetlands (Woody Wetlands, Emergent Herbaceous Wetlands)
8
DATA ANALYSIS
In order to drive data analysis, the climate and location data obtained from online sources
were imported into ArcGIS software as well as the sign data. The values of climate and location
data for each individual traffic sign were extracted from the raster data. Data analysis of this
paper is presented in two sections. The first section focuses on the weather observations and
then, the effect of exposure is examined. To ensure that the association between each
contributing factor and sign condition is linear, a trend test should be driven. The author
accomplished that test though the results will be shown in another paper.
Weather Condition
The effects of the different weather observations are discussed in this section including
average annual temperature, average annual precipitation, and wind power.
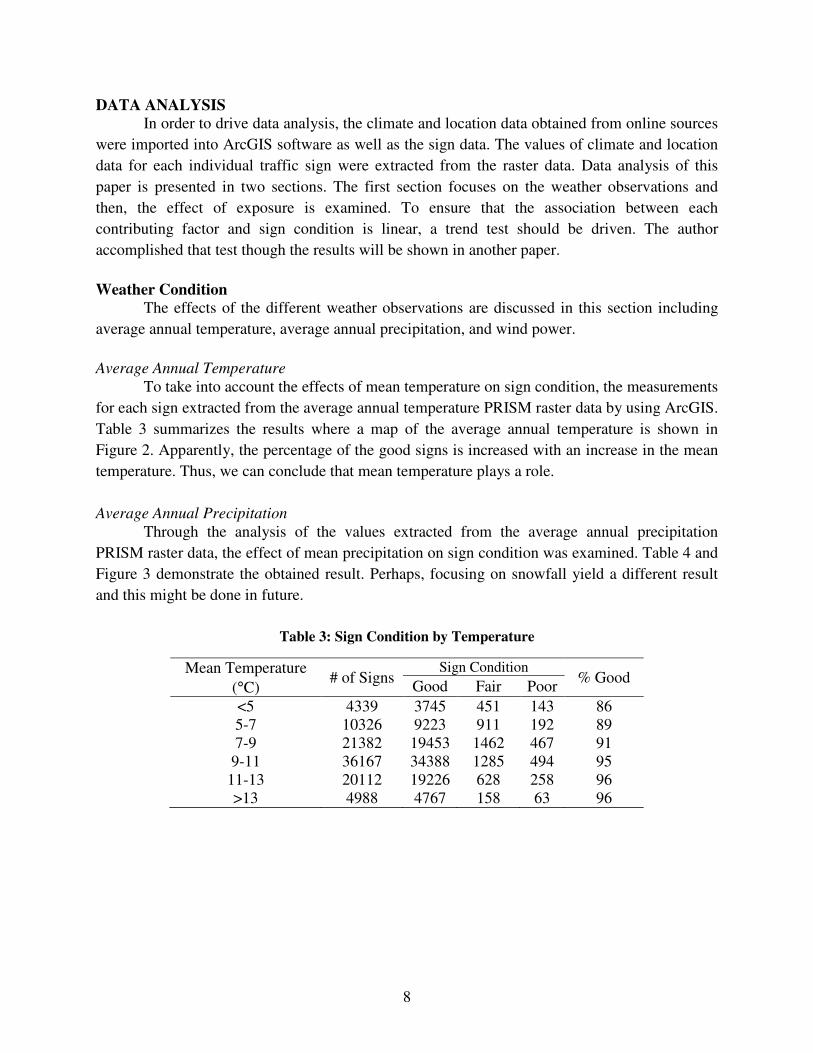
Average Annual Temperature
To take into account the effects of mean temperature on sign condition, the measurements
for each sign extracted from the average annual temperature PRISM raster data by using ArcGIS.
Table 3 summarizes the results where a map of the average annual temperature is shown in
Figure 2. Apparently, the percentage of the good signs is increased with an increase in the mean
temperature. Thus, we can conclude that mean temperature plays a role.
Average Annual Precipitation
Through the analysis of the values extracted from the average annual precipitation
PRISM raster data, the effect of mean precipitation on sign condition was examined. Table 4 and
Figure 3 demonstrate the obtained result. Perhaps, focusing on snowfall yield a different result
and this might be done in future.
Table 3: Sign Condition by Temperature
Mean Temperature
(°C) # of Signs
Sign Condition % Good
Good Fair Poor
<5 4339 3745 451 143 86
5-7 10326 9223 911 192 89
7-9 21382 19453 1462 467 91
9-11 36167 34388 1285 494 95
11-13 20112 19226 628 258 96
>13 4988 4767 158 63 96
9
Figure 2: Average Annual Temperature Map
Table 4: Sign Condition by Precipitation
Mean Precipitation
(mm) # of Signs
Sign Condition % Good
Good Fair Poor
100-200 5447 5133 250 64 94
200-300 19395 17910 1149 336 92
300-400 21163 19725 1074 364 93
400-500 28486 26984 1105 397 95
500-600 11357 10558 586 213 93
>600 11466 10492 731 243 92

10
Figure 3: Average Annual Precipitation Map
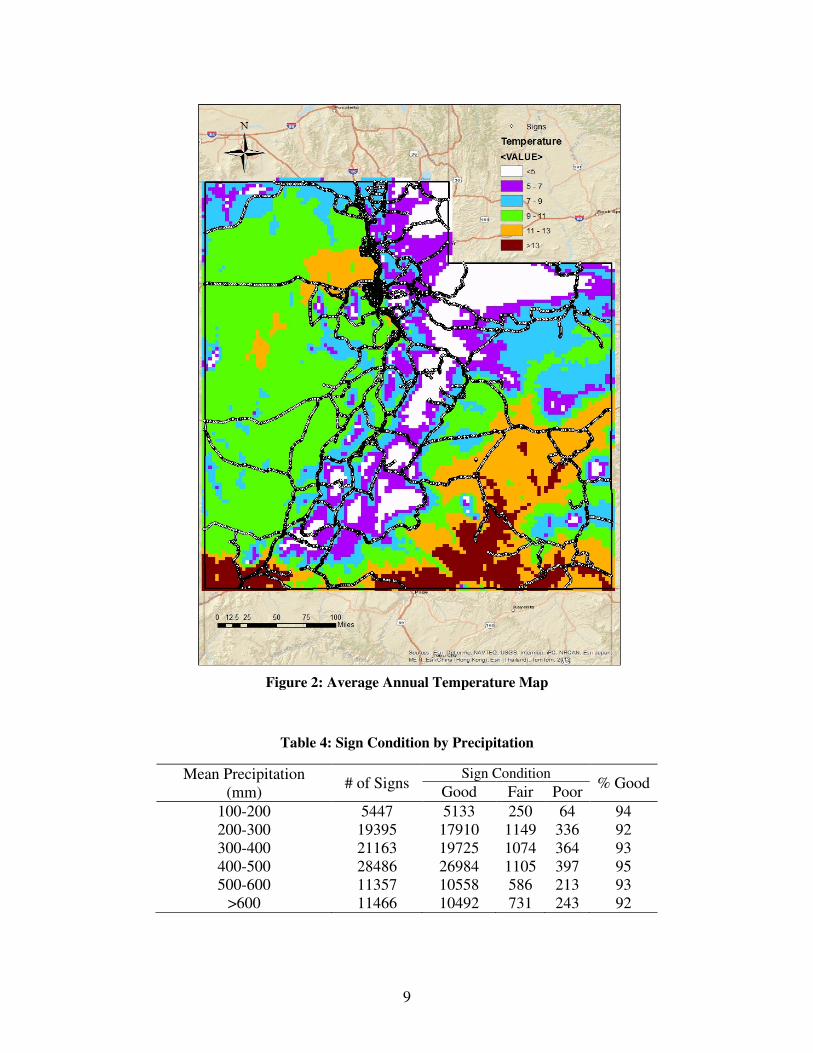
Wind Power
Data obtained from National Renewable Energy Laboratory was analyzed to determine if
wind is a contributing factor to sign deterioration. Since the majority of the recorded signs are
located in the area with the same wind power class, this variable can be considered as
unimportant. As Table 5 shows, 92.4% of the signs are placed where the wind is categorized into
class number one. A map of the wind across the state of Utah is shown in Figure 4.
Table 5: Sign Condition by Wind Power Class
Wind Power # of Signs Sign Condition
% Good Good Fair Poor
Class # 1 89887 83795 4577 1515 90
Others 7427 7007 318 102 94
11
Figure 4: Wind Power Map
Location Data
This section of the paper depicts the effects of the location data including elevation, land
cover, and wind power on traffic sign deterioration.
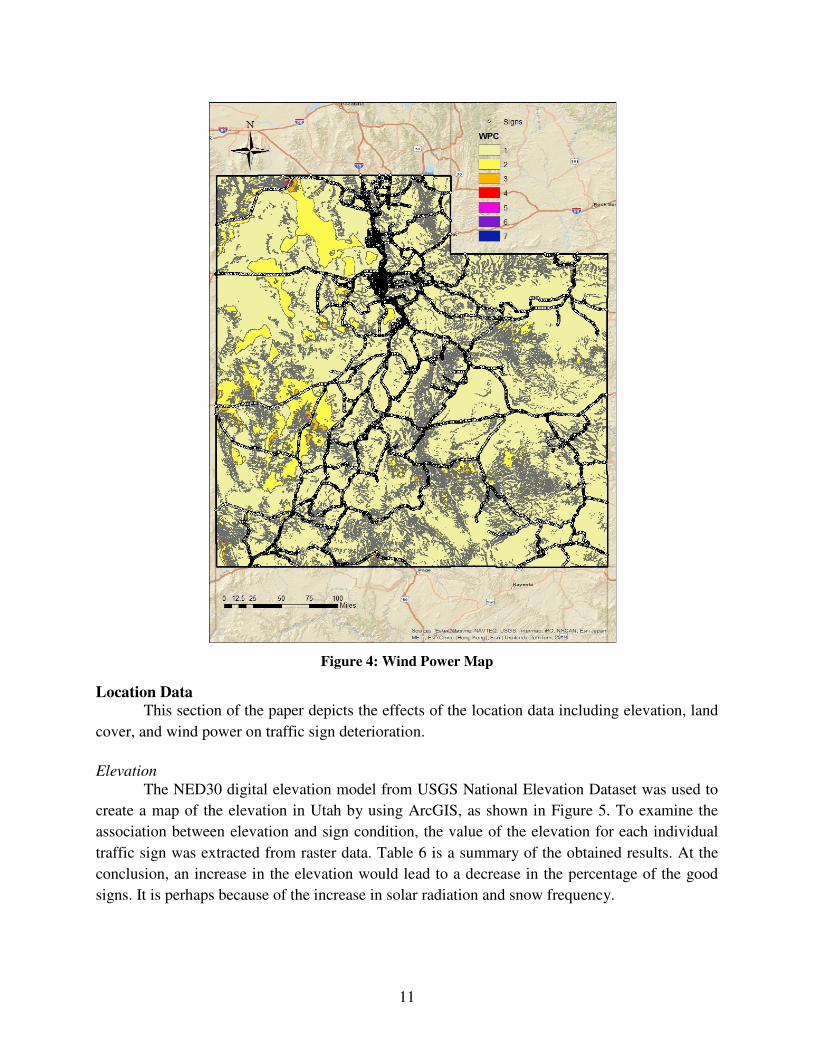
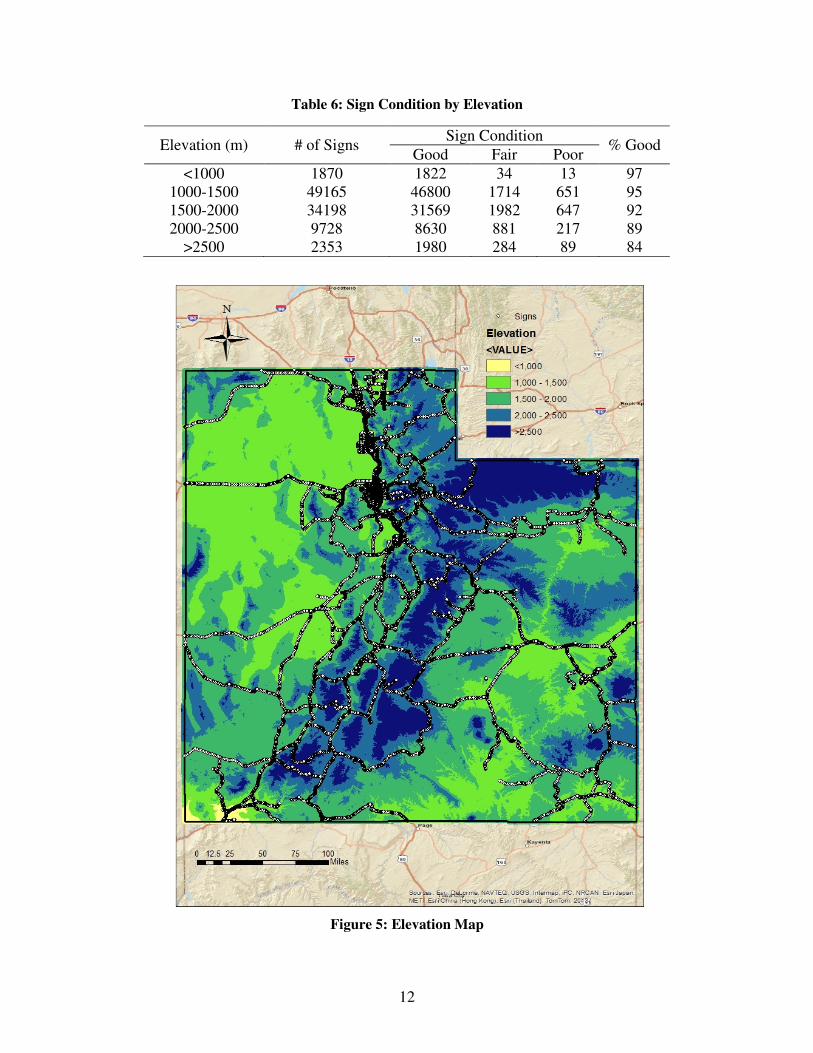
Elevation
The NED30 digital elevation model from USGS National Elevation Dataset was used to
create a map of the elevation in Utah by using ArcGIS, as shown in Figure 5. To examine the
association between elevation and sign condition, the value of the elevation for each individual
traffic sign was extracted from raster data. Table 6 is a summary of the obtained results. At the
conclusion, an increase in the elevation would lead to a decrease in the percentage of the good
signs. It is perhaps because of the increase in solar radiation and snow frequency.
12
Table 6: Sign Condition by Elevation
Elevation (m) # of Signs Sign Condition
% Good Good Fair Poor
<1000 1870 1822 34 13 97
1000-1500 49165 46800 1714 651 95
1500-2000 34198 31569 1982 647 92
2000-2500 9728 8630 881 217 89
>2500 2353 1980 284 89 84
Figure 5: Elevation Map
13
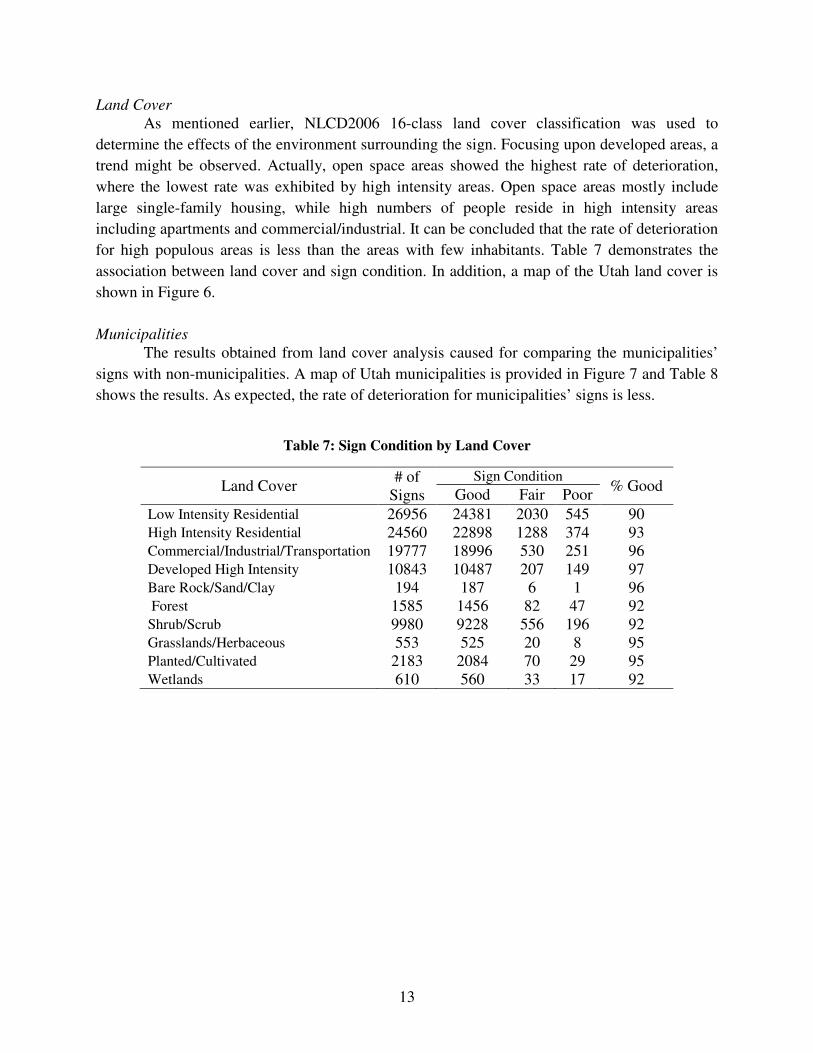
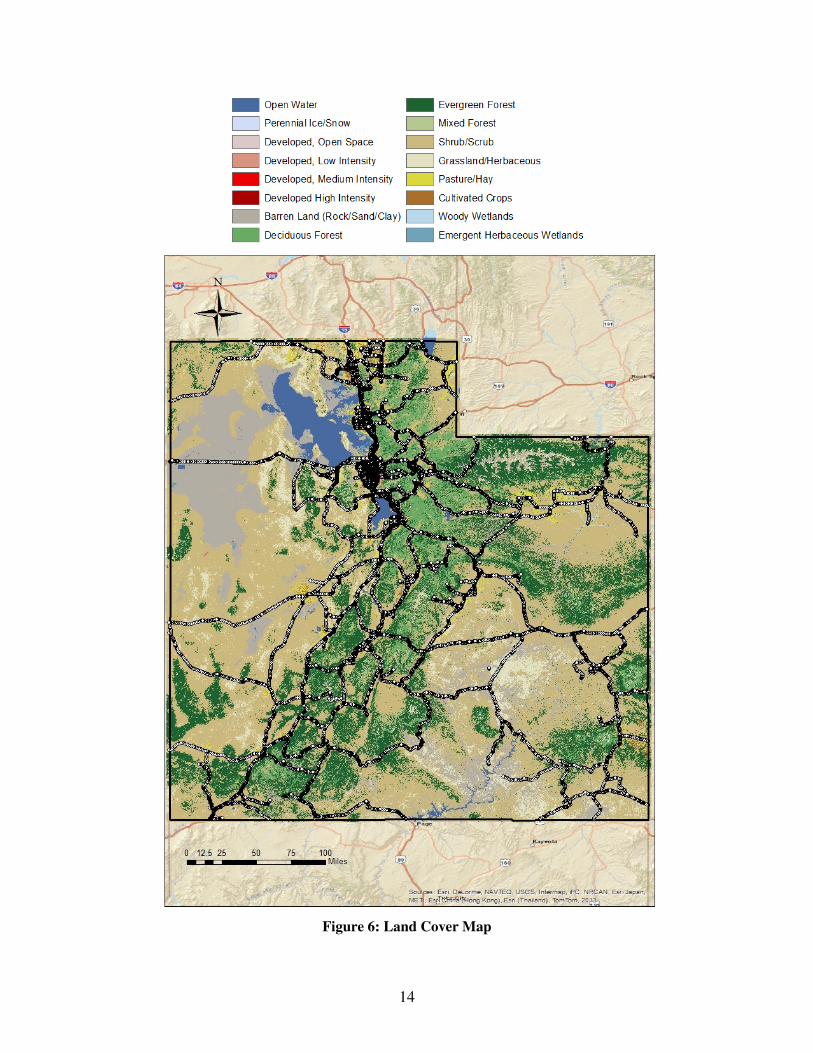
Land Cover
As mentioned earlier, NLCD2006 16-class land cover classification was used to
determine the effects of the environment surrounding the sign. Focusing upon developed areas, a
trend might be observed. Actually, open space areas showed the highest rate of deterioration,
where the lowest rate was exhibited by high intensity areas. Open space areas mostly include
large single-family housing, while high numbers of people reside in high intensity areas
including apartments and commercial/industrial. It can be concluded that the rate of deterioration
for high populous areas is less than the areas with few inhabitants. Table 7 demonstrates the
association between land cover and sign condition. In addition, a map of the Utah land cover is
shown in Figure 6.
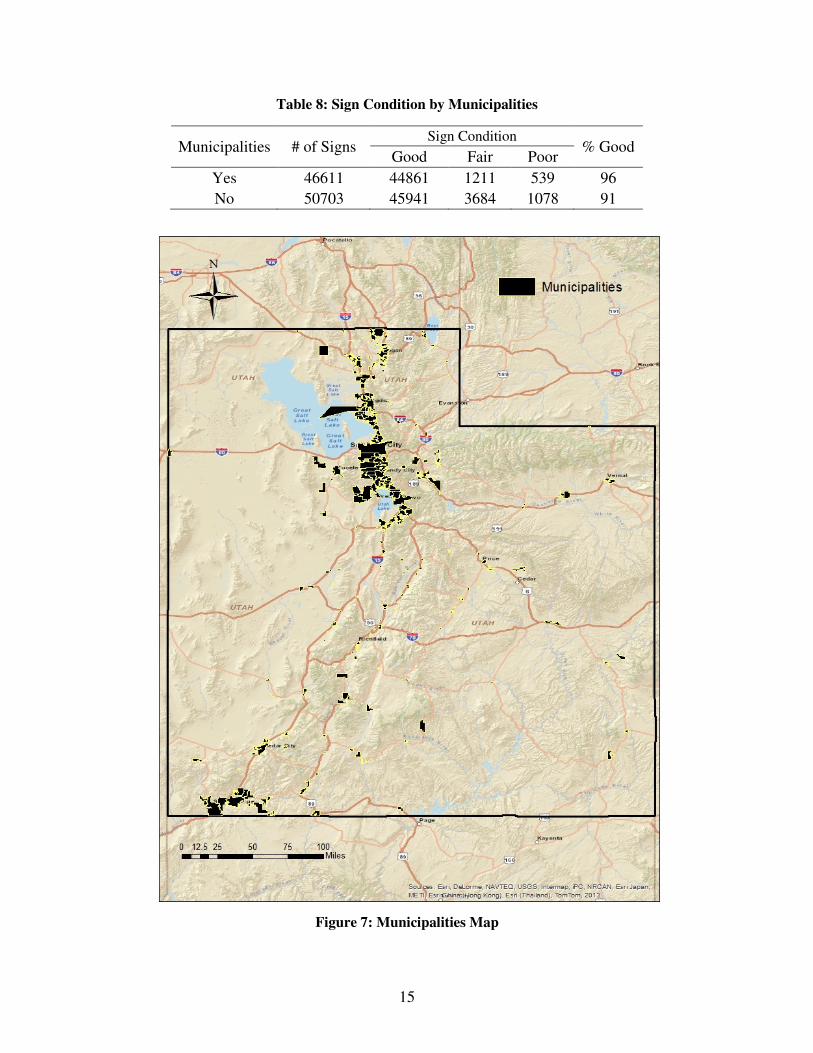
Municipalities
The results obtained from land cover analysis caused for comparing the municipalities’
signs with non-municipalities. A map of Utah municipalities is provided in Figure 7 and Table 8
shows the results. As expected, the rate of deterioration for municipalities’ signs is less.
Table 7: Sign Condition by Land Cover
Land Cover # of
Signs
Sign Condition % Good
Good Fair Poor
Low Intensity Residential 26956 24381 2030 545 90 High Intensity Residential 24560 22898 1288 374 93 Commercial/Industrial/Transportation 19777 18996 530 251 96 Developed High Intensity 10843 10487 207 149 97 Bare Rock/Sand/Clay 194 187 6 1 96 Forest 1585 1456 82 47 92 Shrub/Scrub 9980 9228 556 196 92 Grasslands/Herbaceous 553 525 20 8 95 Planted/Cultivated 2183 2084 70 29 95 Wetlands 610 560 33 17 92
14
Figure 6: Land Cover Map
15
Table 8: Sign Condition by Municipalities
Municipalities # of Signs Sign Condition
% Good Good Fair Poor
Yes 46611 44861 1211 539 96
No 50703 45941 3684 1078 91
Figure 7: Municipalities Map
16
DISCUSSION
The transportation agencies are required to provide an inventory of the traffic signs in
their jurisdiction to meet MUTCD and MAP-21 requirements. To collect a reliable and accurate
data, UDOT conducted leveraging a Mobile LiDAR-based sign data collection effort that
examined over 97,000 traffic signs. Focusing on sign condition, it was determined that 6.7 % of
the captured signs exhibited a form of deterioration on the face. This paper examined the
contributing factors affecting the sign condition. To do so, the climate and location data obtained
from different online sources were combined with the known location of each individual sign.
Finally, it was concluded that average annual temperature, elevation, and exposure of the sign
were the major contributing factors. Mean precipitation might also be another important factor.
ACKNOWLEDGEMENT
This study has benefited from discussion with Dr. David Tarboton and Dr. Kevin
Heaslip.
17
REFERENCES
1. FHWA. Manual on Uniform Traffic Control Devices for Streets and Highways. ; 2009.
2. MAP-21 Administration, U.S. Department of Transportation Federal Highway. [Online].
Available from: http://www.fhwa.dot.gov/map21/.
3. Boggs W, Heaslip K, Louisell C. Analysis of Sign Damage and Failure: A Case Study in
Utah. In ; 2013; Washington, D.C.: Transportation Research Board.
4. Evans T, Heaslip K, Boggs W, Hurwitz D, Gardiner K. Assessment of Sign Retroreflectivity
Compliance fir the Development of a Management Plan. In ; 2012; Washington, D.C.:
Transportation Research Board.
5. Boggs W, Evans T, Heaslip K, Louisell C, Gardiner K. Development of a Sign Asset
Management Plan for Retroreflectivity Compliance. In ; 2012; Washington, D. C.:
Transportation Research Board.
6. Liang J, McCarthy LM, Park S, Mcfadden J. Risk-Based Methodology for Local Agency
Compliance with Minimum Sign Retroreflectivity Standards. In ; 2012; Washington, D. C.:
Transportation Research Board.
7. Brimley BK, Carlson PJ. The Current State of Research on the Long-Term Deterioration of
Traffic Signs Washington, D.C.: Transportation Research Board; 2013.
8. McGee HW. Maintenance of Signs and Sign Supports: A Guide for Local Highway and
Street Maintenance Personnel. Washington, D.C.:; 2010. Report No.: FHWA-SA-09-025.
9. PRISM Climate Group Oregon State University. [Online]. Available from:
http://www.prism.oregonstate.edu.
10. USGS The National Map Viewer. [Online]. Available from:
http://viewer.nationalmap.gov/viewer/.
11. National Renewable Energy Laboratory. [Online]. Available from: http://www.nrel.gov/.
12. UTAH AGRC Automated Geographic Reference Center. [Online]. Available from:
http://gis.utah.gov.
13. Multi-Resolution Land Characteristics Consortium National Land Covae 2006. [Online].;
2011. Available from: http://www.mrlc.gov/nlcd2006.php.