
Effects of clay platelets and natural nanotubes on ... clay... · Effects of clay platelets and...
14
Effects of clay platelets and natural nanotubes on mechanical properties and gas permeability of Poly (lactic acid) nanocomposites Yichen Guo a, * , Kai Yang a , Xianghao Zuo a , Yuan Xue a , Clement Marmorat a , Ying Liu b , Chung-Chueh Chang b , Miriam H. Rafailovich a, * a Department of Materials Science and Engineering, Stony Brook University, Stony Brook, NY,11794, USA b ThINC Facility, Advanced Energy Center, Stony Brook, NY 11794, USA article info Article history: Received 1 October 2015 Received in revised form 30 November 2015 Accepted 9 December 2015 Available online 17 December 2015 Keywords: Biodegradable nanocomposites Nanoplatelets and nanotubes Work of adhesion Mechanical properties Oxygen gas permeability abstract Environmental concerns have resulted in the increased use of biodegradable polymers and their nano- composites. We have developed a facile method for measuring the work of adhesion (W a ) between nanoparticles and their matrix, which we showed can be used to determine their degree of intercalation within the matrix. This method was then applied to Poly (lactic acid) (PLA) nanocomposites with either sodium montmorillonite clays (C-Naþ), organically modified clays (C-30B), resorcinol di (phenyl phos- phate) (RDP) coated C-Naþ (C-RDP), Halloysite nanotubes (HNTs) and RDP coated HNTs (H-RDP). The C- 30B showed the highest W a within the PLA matrix, followed by the C-RDP and the C-Naþ. X-ray diffraction and TEM indicated that the C-30B platelets were highly exfoliated, the C-RDP were interca- lated, while the C-Naþ were aggregated in the PLA matrix. Oxygen gas permeability measurements showed the largest decrease in permeability for the C-30B nanocomposites, followed by the C-RDP, and the C-Naþ nanocomposites. The values of the particle aspect ratios obtained using Nielsen model were consistent with the TEM images. In contrast to clay platelets, HNTs and H-RDP were not effective in decreasing oxygen gas permeability of PLA matrix, which was in excellent agreement with the model we derived. Despite the higher degree of exfoliation, the C-30B nanocomposites had a significantly lower Izod impact than the C-RDP nanocomposites. SEM images showed numerous micro-voids on the Izod impact fracture surface of C-30B nanocomposites. On the other hand, the nanotubes were much more effective in reinforcing the mechanical properties, with RDP coated tubes having the better performance, consistent with their higher value of W a with PLA matrix. These results showed that RDP coated silicate nanoparticles can provide environmentally safe alternatives for modifying the mechanical and gas bar- rier properties of PLA. © 2015 Elsevier Ltd. All rights reserved. 1. Introduction In recent years the environmental concern caused by the de- mands on polymer waste disposal has generated an increased in- terest in the applications of biodegradable polymers. One of the most popular polymers in this class is Poly (lactic acid) (PLA), due to its multiple applications in consumer products, biomedical struc- tures, and more recently additive manufacturing. PLA is a ther- moplastic aliphatic polyester polymerized from lactic acid and lactide monomers which are produced from the fermentation of crops and their residues [1]. Unlike the majority of biodegradable polymers which are degraded by microbial attack, PLA primarily degrades through hydrolysis, which allows its application in food- contact packaging and biomedical implants [2]. Furthermore, in contrast to other biodegradable polymers, such as polycaprolactone (PCL), Poly (butylene succinate-co-adipate) (PBSA), the mechanical properties of PLA are comparable to those of other glassy conven- tional plastics. In order to develop PLA as a potential replacement, properties such as modulus, gas permeability, and rheology could be improved further. It is well documented by Masami Okamoto et al. [3e10] that organically modified montmorillonite (MMT) clays can enhance the thermo mechanical, gas barrier, and even biodegradability properties of PLA. The degree of enhancement is a function of the degree of exfoliation which in turn has been shown by numerous groups to depend on the interactions between the host matrix and the clay surface. Modification of the clay surface * Corresponding authors. E-mail address: [email protected] (Y. Guo). Contents lists available at ScienceDirect Polymer journal homepage: www.elsevier.com/locate/polymer http://dx.doi.org/10.1016/j.polymer.2015.12.012 0032-3861/© 2015 Elsevier Ltd. All rights reserved. Polymer 83 (2016) 246e259
Transcript of Effects of clay platelets and natural nanotubes on ... clay... · Effects of clay platelets and...

lable at ScienceDirect
Polymer 83 (2016) 246e259
Contents lists avai
Polymer
journal homepage: www.elsevier .com/locate/polymer
Effects of clay platelets and natural nanotubes on mechanicalproperties and gas permeability of Poly (lactic acid) nanocomposites
Yichen Guo a, *, Kai Yang a, Xianghao Zuo a, Yuan Xue a, Clement Marmorat a, Ying Liu b,Chung-Chueh Chang b, Miriam H. Rafailovich a, *
a Department of Materials Science and Engineering, Stony Brook University, Stony Brook, NY, 11794, USAb ThINC Facility, Advanced Energy Center, Stony Brook, NY 11794, USA
a r t i c l e i n f o
Article history:Received 1 October 2015Received in revised form30 November 2015Accepted 9 December 2015Available online 17 December 2015
Keywords:Biodegradable nanocompositesNanoplatelets and nanotubesWork of adhesionMechanical propertiesOxygen gas permeability
* Corresponding authors.E-mail address: [email protected] (Y. Guo).
http://dx.doi.org/10.1016/j.polymer.2015.12.0120032-3861/© 2015 Elsevier Ltd. All rights reserved.
a b s t r a c t
Environmental concerns have resulted in the increased use of biodegradable polymers and their nano-composites. We have developed a facile method for measuring the work of adhesion (Wa) betweennanoparticles and their matrix, which we showed can be used to determine their degree of intercalationwithin the matrix. This method was then applied to Poly (lactic acid) (PLA) nanocomposites with eithersodium montmorillonite clays (C-Naþ), organically modified clays (C-30B), resorcinol di (phenyl phos-phate) (RDP) coated C-Naþ (C-RDP), Halloysite nanotubes (HNTs) and RDP coated HNTs (H-RDP). The C-30B showed the highest Wa within the PLA matrix, followed by the C-RDP and the C-Naþ. X-raydiffraction and TEM indicated that the C-30B platelets were highly exfoliated, the C-RDP were interca-lated, while the C-Naþ were aggregated in the PLA matrix. Oxygen gas permeability measurementsshowed the largest decrease in permeability for the C-30B nanocomposites, followed by the C-RDP, andthe C-Naþ nanocomposites. The values of the particle aspect ratios obtained using Nielsen model wereconsistent with the TEM images. In contrast to clay platelets, HNTs and H-RDP were not effective indecreasing oxygen gas permeability of PLA matrix, which was in excellent agreement with the model wederived. Despite the higher degree of exfoliation, the C-30B nanocomposites had a significantly lowerIzod impact than the C-RDP nanocomposites. SEM images showed numerous micro-voids on the Izodimpact fracture surface of C-30B nanocomposites. On the other hand, the nanotubes were much moreeffective in reinforcing the mechanical properties, with RDP coated tubes having the better performance,consistent with their higher value of Wa with PLA matrix. These results showed that RDP coated silicatenanoparticles can provide environmentally safe alternatives for modifying the mechanical and gas bar-rier properties of PLA.
© 2015 Elsevier Ltd. All rights reserved.
1. Introduction
In recent years the environmental concern caused by the de-mands on polymer waste disposal has generated an increased in-terest in the applications of biodegradable polymers. One of themost popular polymers in this class is Poly (lactic acid) (PLA), due toits multiple applications in consumer products, biomedical struc-tures, and more recently additive manufacturing. PLA is a ther-moplastic aliphatic polyester polymerized from lactic acid andlactide monomers which are produced from the fermentation ofcrops and their residues [1]. Unlike the majority of biodegradable
polymers which are degraded by microbial attack, PLA primarilydegrades through hydrolysis, which allows its application in food-contact packaging and biomedical implants [2]. Furthermore, incontrast to other biodegradable polymers, such as polycaprolactone(PCL), Poly (butylene succinate-co-adipate) (PBSA), the mechanicalproperties of PLA are comparable to those of other glassy conven-tional plastics. In order to develop PLA as a potential replacement,properties such as modulus, gas permeability, and rheology couldbe improved further. It is well documented by Masami Okamotoet al. [3e10] that organically modified montmorillonite (MMT)clays can enhance the thermo mechanical, gas barrier, and evenbiodegradability properties of PLA. The degree of enhancement is afunction of the degree of exfoliation which in turn has been shownby numerous groups to depend on the interactions between thehost matrix and the clay surface. Modification of the clay surface

Y. Guo et al. / Polymer 83 (2016) 246e259 247
energies is usually done via cation exchange with quaternaryammonium chloride salts. These salts are known to be highly toxic[11] and hence can negate some of the advantages of using “envi-ronmentally friendly” polymer technology.
We have previously shown that the surface energy ofMMT-clayscan also be modified using resorcinol di (phenyl phosphate) (RDP)adsorption. This technique is easy to implement and RDP is far saferthan quaternary ammonium chloride salts [12]. Pack et al. [13] havedemonstrated that RDP coated clays can perform better than theorganoclays in conventional polymer systems, such as styrenicpolymers and polyolefin. Here we explore the properties of RDPcoated clays with PLA, since that would produce nanocompositeswhich would enable environmentally friendly manufacturing inevery aspect.
The clays that we used in this study are sodium MMT-clayplatelets and Halloysite nanotubes. RDP is a liquid which we haveshown previously to easily adsorb onto the surface of clays. Hal-loysite nanotubes are a type of natural occurring minerals with theempirical formula Al2Si2O5(OH)4 and are expected as possible al-ternatives to both clays and carbon nanotubes [14]. First we showhow a simple procedure which measures the Young's contact anglecan be used to determine the affinity of the nanoparticles and thehost matrix. Thenwe use this test to determine the compatibility ofRDP coated clay platelets with PLA and compare the performancerelative to Cloisite 30B, quaternary amine coated MMT-clays. Inaddition to surface interactions, the role of particle morphology isalso explored, in particular as it affects gas permeability, bycomparing the performance of the RDP coated clay platelets withHalloysite nanotubes, having the same surface functionalities.Finally we derive a set of equations, where these properties areused to predict the gas permeability as well as the mechanicalproperties of the nanocomposites.
2. Experiment
2.1. Materials
The MMT-clays, Cloisite Naþ (C-Naþ) and organoclays, Cloisite30B (C-30B) were supplied by Southern Clay Inc. C-30B is synthe-sized via ion exchange between Naþ of the C-Naþ and bis (2-hydroxyethyl) methyl hydrogenated tallow quaternary ammoniumcation. HNTs were supplied by Applied Minerals Inc. with the tradename Dragonite. The RDP, known as Fyrolflex RDP, was a type ofphosphorus flame retardant agent (FR) provided by ICL-IP Inc. Poly(lactic acid), PLA 4042D, was purchased from the Natureworks LLCwith a density of 1.24 g/cm3andmolecular weight of 120,000 g/mol.
2.2. RDP coated C-Naþ (C-RDP) and HNTs (H-RDP) preparation
The 20 wt % of RDP was placed into a 200 mL beaker and heatedon a hot plate at 70 �C. Then, the 80 wt % of C-Naþ or HNTs wereadded and stirred manually with the RDP for 10min. The mixturewas removed from the beaker and put into a plastic sample holderwhich was then inserted into a Thinky Mixer for further mixing.The procedure was set at 700 rpm for 5min. After that, the mixturewas taken out and put into a mortar to be grinded. Finally, themixture was removed from the shaker and poured into a beakerwhich was then placed in a vacuum oven at 70 �C for 24 h formoisture removal and completion of RDP coating.
2.3. Nanocomposites preparation
The PLA nanocomposites were prepared by melting blend in aC.W. Brabender operated at 180 �C. PLA pellets were poured intothe chamber under 20 rpm. After the pellets melted, the
nanoparticles were added, then increased the speed to 100 rpm andkept for 10 min. The mixture were cut into little pieces for hot-pressure molding to fit the requirements of different character-izations. The ratios of the samples were summarized in Table 1.
2.4. Characterization methods
2.4.1. Fourier transform infrared spectroscopy (FT-IR)The FT-IR spectra of RDP oligomers and nanoparticles were
directly acquired using attenuated total reflectance (ATR) samplingtechnique from a Perkin Elmer Frontier FT-IR spectrometer withUniversal ATR Polarization Accessory.
2.4.2. Transmission electron microscopy (TEM)Cross sections of the PLA homopolymer nanocomposites were
cut by Leica UC-7 at room temperature with a diamond knife. Theultrathin films with a thickness of 80e100 nmwere then floated onthe deionized (DI) water and then transferred onto copper grids.The cross sections were viewed by a JEOL JEM1400 TransmissionElectron Microscope at 80 kV.
2.4.3. Scanning electron microscopy (SEM)The SEM (Jeol JSM7600F) with a Schottky electron gunwas used
to display the fracture surfaces of the broken impact samples. Theelemental distribution of silicon, aluminum and sodium wererespectively acquired using an Energy Dispersive X-ray Spectros-copy (EDXS) attachment on the SEM. All the samples were requiredto coat 10 nm thickness of gold on the surfaces to increase electricalconductivity.
2.4.4. X-ray diffraction (XRD)The structure of the nanoparticles and the intercalation and
exfoliation phenomena of the various clay nanocomposites werecharacterized using the Ultima vertical thetaetheta diffractometer(Rigaku Corp.) with a 1.6 kW X-ray generator and copper anode(wavelength, l¼0.154 nm). The angular scan was performed by ascintillation counter along with Bragg-Brentano optics in fixed timemode.
2.4.5. Contact angle measurementsC-Naþ, C-RDP and C-30B monolayers were made using Lang-
muireBlodgett (LB) technique under certain procedures accordingto the previous works [13,15] and were imaged using a VEECO/DI-3000 scanning force microscope (AFM) in contact mode. Prepara-tion of HNTs and H-RDP layers were conducted by spin casting ofHNTs and H-RDP methanol dispersion on the sulfuric acid treated,hydrophilic Si wafers. The wafers with HNTs and H-RDP wereannealed at 70 �C for 1 h in a vacuum oven and then detected bySEM. Little PLA pieces (around 5 mg) were located on the claymonolayers and nanotube layers in a vacuum oven set at 180 �C for24 h to melt the pieces and form PLA droplets. The contact angles ofPLA droplets on each nanoparticle layer were observed andmeasured using the CAM 200 optical contact angle meter (KSVInstrument Ltd., Helsinki, Finland). The contact angle value of eachsample represents the average measurements of 10 PLA droplets.
2.4.6. Dynamic mechanical analysis (DMA)TA Instruments DMA Q800 was used to perform the dynamic
mechanical properties of nanocomposites under the single canti-lever bendmode at the frequency of 1 Hz. The storagemodulus andtan d were collected from 20 to 80 �C at the rate of 3� C/min.
2.4.7. Rheology measurementsRheology performance of nanocomposites were tested using a
Bohlin Gemini HR Nano rheometer from Malverm instruments. A

Table 1Concentrations of nanocomposites used in this study.
PLA/C-Naþ Abbreviation PLA/C-RDP Abbreviation PLA/C-30B Abbreviation PLA/HNTs Abbreviation PLA/H-RDP Abbreviation
99/1 PCNa1 99/1 PCRDP1 99/1 PC30B1 99/1 PH1 99/1 PHRDP197/3 PCNa3 97/3 PCRDP3 97/3 PC30B3 97/3 PH3 97/3 PHRDP395/5 PCNa5 95/5 PCRDP5 95/5 PC30B5 95/5 PH5 95/5 PHRDP593/7 PCNa7 93/7 PCRDP7 93/7 PC30B7 93/7 PH7 93/7 PHRDP790/10 PCNa10 90/10 PCRDP10 90/10 PC30B10 90/10 PH10 90/10 PHRDP1085/15 PCNa15 85/15 PCRDP15 85/15 PC30B15 85/15 PH15 85/15 PHRDP15
Y. Guo et al. / Polymer 83 (2016) 246e259248
constant strain amplitude (2.5%) was applied for frequency sweepfrom 0.01 Hz to 100 Hz in oscillatory shear mode. All the sampleswere measured at 180 �C on a 20 mm aluminum cup.
2.4.8. Mechanical testsTensile properties of nanocomposites were obtained using Ins-
tron 5542 (Instron Co., Grove City, PA) in compliance with ASTM D-638, type M with the extension rate set at 2.5 mm/min. The Izodimpact tests were conducted according to ASTM D-256 testmethod. The measurement value for each kind of sample repre-sents the average tests of 10 specimens.
2.4.9. Gas permeability measurementsOxygen permeability rate of all the samples were measured at
room temperature by a permeability cell apparatus (CSI-135,Custom Scientific Instruments. Inc.) under ASTM D-1434 standard.Specimens with a thickness around 750mm were prepared by hotpressing. Each result represents the average measurements of 10specimens.
2.5. Characterization of the nanoparticles
Nanoparticle structure was characterized using X-ray diffrac-tion, TEM imaging and FT-IR spectroscopy. X-ray diffraction pat-terns of clay nanoparticles are shown in Fig. 1. A single peak at2q¼7.66� marks the first order (001) of the interlayer spacing of C-Na þ at d ¼ 1.16 nm [16,17]. The diffraction pattern of C-RDP dis-plays both the (001) peak 2q¼4.34� (d ¼ 2.04 nm) and a secondorder (002) peak 2q¼8.61� (d ¼ 1.03 nm), which is in agreementwith the results of Pack et al. [13] who showed that the RDP olig-omers intercalate into the interspace of the clay platelets. Thediffraction pattern for Ce30B is also shown in Fig. 1 wherewe find a
Fig. 1. X-ray patterns of nanoparticles. The dots lines indicate the exact location of(001) peaks for every nanoparticles.
strong primary (001) peak 2q¼4.82� (d ¼ 1.83 nm) and a very weaksecondary (002) peak 2q¼9.57� (d ¼ 0.93 nm) indicating that theseclays are uniformly coated with the quaternary amine functionalgroups [16,18]. TEM images of CeNaþ and C-RDP displayed inFig. 2a, b also show the difference of morphologies. Under highmagnification, we can observe the closely stacking layers of C-Naþ,while we can only see blurred stacking silicate layers with theincorporation of RDP. The intercalation of RDP has also beenconfirmed by FT-IR spectra. The RDP IR spectrum in Fig. 3a showeda distinct phosphorus-oxygen single bond characteristic peak on961 (cm�1), and a typical phosphorus-oxygen double bond char-acteristic peak on 1298 (cm�1). In addition, three characteristicpeaks on 1125 (cm�1), 1259 (cm�1) and 1183 (cm�1) verified theexistence of P-O-Ar structure. We can also identify two obviouslycharacteristic peaks from the C-Na þ spectrum on 1041 (cm�1) and3631 (cm�1), corresponded to SieO stretching vibration and OeHstretching vibration, respectively. After coating of RDP, the C-RDPspectrum demonstrated some changes on peaks. The SieOstretching band has shifted from 1041 (cm�1) to 1075 (cm�1),indicating the presence of RDP oligomers in the clay galleries[13,19]. The shift of PeO peak from 961 (cm�1) to 1010 (cm�1) canbe ascribed to the formation of hydrogen bonding between RDPand the hydroxyl groups on the platelet surface [13,20].
Both coated and uncoated nanotubes showed nearly the sameX-ray pattern in Fig. 1, where we found the specific (001) peak2q¼11.83� (d ¼ 0.75 nm) corresponding to the dehydration state ofinterlayer [14] on either pattern, which indicated that RDP oligo-mers were failed to intercalate into the interlayer of HNTs. The TEMimages of HNTs and H-RDP were shown in Fig. 2c, d. We canobserve the homogenous coating layer of RDP on the HNTs surfacesin the insert of Fig. 2d, which was consistent with Pack's results[21]. The coating of RDP on HNTs surfaces also resulted in thechange of IR spectrums. From Fig. 3b, we can identify three typicalcharacteristic peaks of HNTs, which were SieO stretching vibrationon 1030 (cm�1), internal hydroxyl groups on 3623 (cm�1) andexternal hydroxyl groups on 3698 (cm�1) [22,23]. When incorpo-rated with RDP, like the situation in clays, the PeO peak shiftedfrom 961 (cm�1) to 1009 (cm�1), which implied there werehydrogen bonding formed between RDP and hydroxyl groups onthe surface of HNTs.
3. Results and discussion
3.1. Microstructure of nanocomposites
In order to detect the relative affinity between PLA and nano-particles, contact angle measurements were performed. Mono-layers of the clays were lifted onto Si wafers and the clay andnanotube layers were imaged with AFM (Fig. 4aec) and SEM(Fig. 4d, e), respectively. From the images we can see that, except fora few areas where bilayers were observed, all the clays formmonolayers at the air/water interface. Furthermore, regardless ofthe surface functional group, all clays were lifted successfully anduniformly covered the native oxide covered silicon surfaces. The
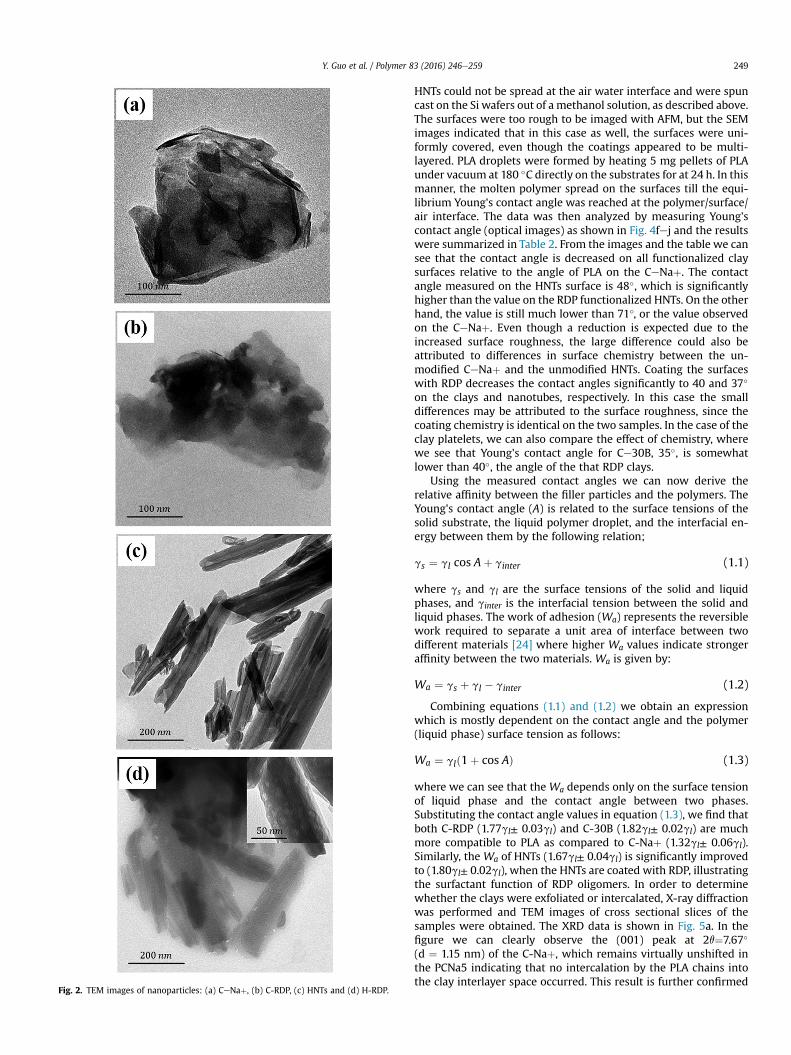
Fig. 2. TEM images of nanoparticles: (a) CeNaþ, (b) C-RDP, (c) HNTs and (d) H-RDP.
Y. Guo et al. / Polymer 83 (2016) 246e259 249
HNTs could not be spread at the air water interface and were spuncast on the Si wafers out of a methanol solution, as described above.The surfaces were too rough to be imaged with AFM, but the SEMimages indicated that in this case as well, the surfaces were uni-formly covered, even though the coatings appeared to be multi-layered. PLA droplets were formed by heating 5 mg pellets of PLAunder vacuum at 180 �C directly on the substrates for at 24 h. In thismanner, the molten polymer spread on the surfaces till the equi-librium Young's contact angle was reached at the polymer/surface/air interface. The data was then analyzed by measuring Young'scontact angle (optical images) as shown in Fig. 4fej and the resultswere summarized in Table 2. From the images and the table we cansee that the contact angle is decreased on all functionalized claysurfaces relative to the angle of PLA on the CeNaþ. The contactangle measured on the HNTs surface is 48�, which is significantlyhigher than the value on the RDP functionalized HNTs. On the otherhand, the value is still much lower than 71�, or the value observedon the CeNaþ. Even though a reduction is expected due to theincreased surface roughness, the large difference could also beattributed to differences in surface chemistry between the un-modified CeNaþ and the unmodified HNTs. Coating the surfaceswith RDP decreases the contact angles significantly to 40 and 37�
on the clays and nanotubes, respectively. In this case the smalldifferences may be attributed to the surface roughness, since thecoating chemistry is identical on the two samples. In the case of theclay platelets, we can also compare the effect of chemistry, wherewe see that Young's contact angle for Ce30B, 35�, is somewhatlower than 40�, the angle of the that RDP clays.
Using the measured contact angles we can now derive therelative affinity between the filler particles and the polymers. TheYoung's contact angle (A) is related to the surface tensions of thesolid substrate, the liquid polymer droplet, and the interfacial en-ergy between them by the following relation;
gs ¼ gl cos Aþ ginter (1.1)
where gs and gl are the surface tensions of the solid and liquidphases, and ginter is the interfacial tension between the solid andliquid phases. The work of adhesion (Wa) represents the reversiblework required to separate a unit area of interface between twodifferent materials [24] where higher Wa values indicate strongeraffinity between the two materials. Wa is given by:
Wa ¼ gs þ gl � ginter (1.2)
Combining equations (1.1) and (1.2) we obtain an expressionwhich is mostly dependent on the contact angle and the polymer(liquid phase) surface tension as follows:
Wa ¼ glð1þ cos AÞ (1.3)
where we can see that the Wa depends only on the surface tensionof liquid phase and the contact angle between two phases.Substituting the contact angle values in equation (1.3), we find thatboth C-RDP (1.77gl± 0.03gl) and C-30B (1.82gl± 0.02gl) are muchmore compatible to PLA as compared to C-Naþ (1.32gl± 0.06gl).Similarly, the Wa of HNTs (1.67gl± 0.04gl) is significantly improvedto (1.80gl± 0.02gl), when the HNTs are coated with RDP, illustratingthe surfactant function of RDP oligomers. In order to determinewhether the clays were exfoliated or intercalated, X-ray diffractionwas performed and TEM images of cross sectional slices of thesamples were obtained. The XRD data is shown in Fig. 5a. In thefigure we can clearly observe the (001) peak at 2q¼7.67�
(d ¼ 1.15 nm) of the C-Naþ, which remains virtually unshifted inthe PCNa5 indicating that no intercalation by the PLA chains intothe clay interlayer space occurred. This result is further confirmed
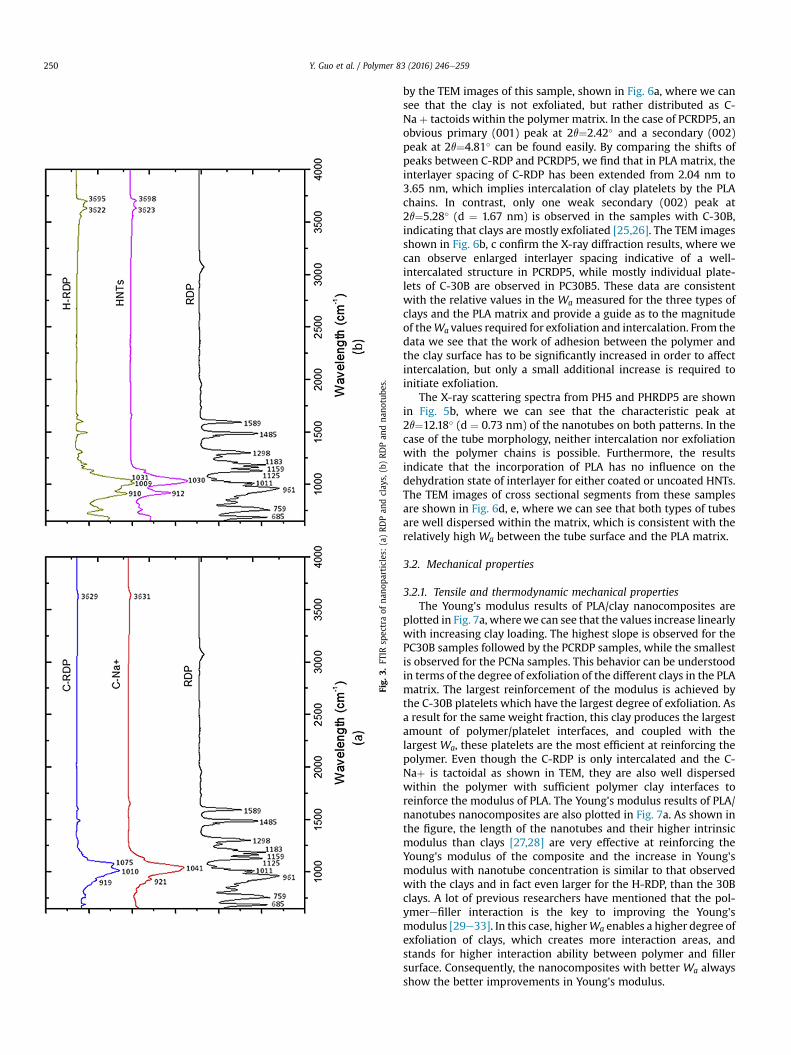
Fig.
3.FT
IRsp
ectraof
nano
particles:
(a)RD
Pan
dclay
s,(b)RD
Pan
dna
notube
s.
Y. Guo et al. / Polymer 83 (2016) 246e259250
by the TEM images of this sample, shown in Fig. 6a, where we cansee that the clay is not exfoliated, but rather distributed as C-Naþ tactoids within the polymer matrix. In the case of PCRDP5, anobvious primary (001) peak at 2q¼2.42� and a secondary (002)peak at 2q¼4.81� can be found easily. By comparing the shifts ofpeaks between C-RDP and PCRDP5, we find that in PLA matrix, theinterlayer spacing of C-RDP has been extended from 2.04 nm to3.65 nm, which implies intercalation of clay platelets by the PLAchains. In contrast, only one weak secondary (002) peak at2q¼5.28� (d ¼ 1.67 nm) is observed in the samples with C-30B,indicating that clays are mostly exfoliated [25,26]. The TEM imagesshown in Fig. 6b, c confirm the X-ray diffraction results, where wecan observe enlarged interlayer spacing indicative of a well-intercalated structure in PCRDP5, while mostly individual plate-lets of C-30B are observed in PC30B5. These data are consistentwith the relative values in the Wa measured for the three types ofclays and the PLA matrix and provide a guide as to the magnitudeof theWa values required for exfoliation and intercalation. From thedata we see that the work of adhesion between the polymer andthe clay surface has to be significantly increased in order to affectintercalation, but only a small additional increase is required toinitiate exfoliation.
The X-ray scattering spectra from PH5 and PHRDP5 are shownin Fig. 5b, where we can see that the characteristic peak at2q¼12.18� (d ¼ 0.73 nm) of the nanotubes on both patterns. In thecase of the tube morphology, neither intercalation nor exfoliationwith the polymer chains is possible. Furthermore, the resultsindicate that the incorporation of PLA has no influence on thedehydration state of interlayer for either coated or uncoated HNTs.The TEM images of cross sectional segments from these samplesare shown in Fig. 6d, e, where we can see that both types of tubesare well dispersed within the matrix, which is consistent with therelatively high Wa between the tube surface and the PLA matrix.
3.2. Mechanical properties
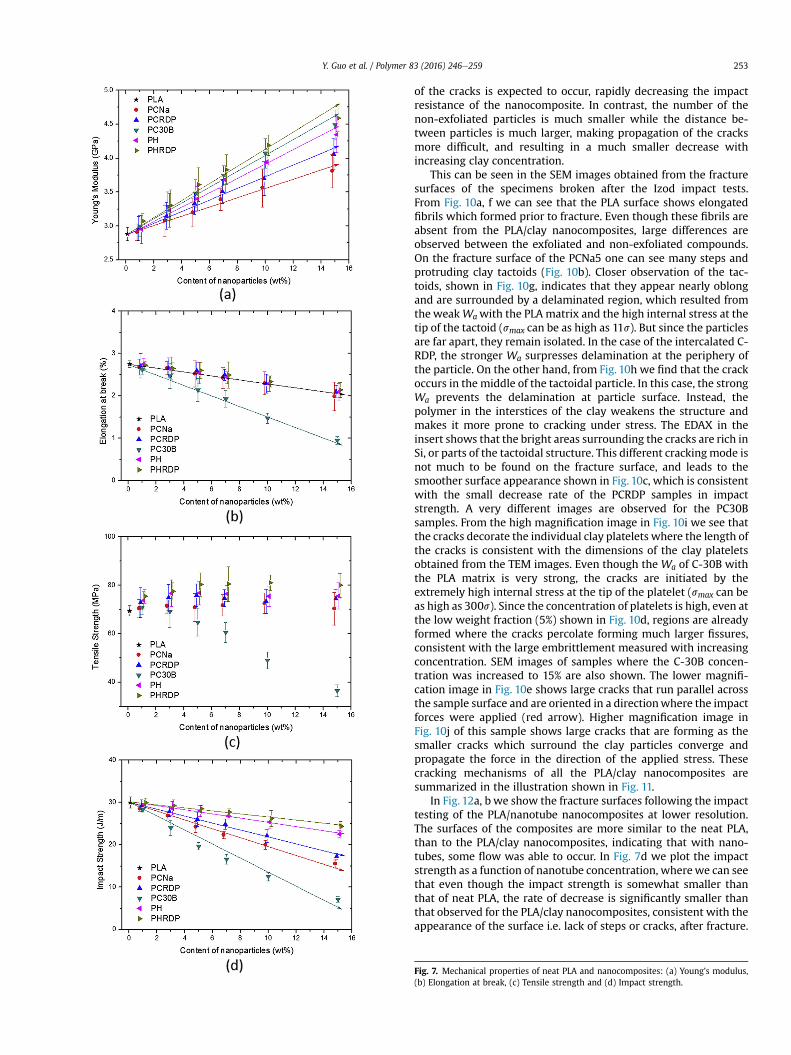
3.2.1. Tensile and thermodynamic mechanical propertiesThe Young's modulus results of PLA/clay nanocomposites are
plotted in Fig. 7a, wherewe can see that the values increase linearlywith increasing clay loading. The highest slope is observed for thePC30B samples followed by the PCRDP samples, while the smallestis observed for the PCNa samples. This behavior can be understoodin terms of the degree of exfoliation of the different clays in the PLAmatrix. The largest reinforcement of the modulus is achieved bythe C-30B platelets which have the largest degree of exfoliation. Asa result for the same weight fraction, this clay produces the largestamount of polymer/platelet interfaces, and coupled with thelargest Wa, these platelets are the most efficient at reinforcing thepolymer. Even though the C-RDP is only intercalated and the C-Naþ is tactoidal as shown in TEM, they are also well dispersedwithin the polymer with sufficient polymer clay interfaces toreinforce the modulus of PLA. The Young's modulus results of PLA/nanotubes nanocomposites are also plotted in Fig. 7a. As shown inthe figure, the length of the nanotubes and their higher intrinsicmodulus than clays [27,28] are very effective at reinforcing theYoung's modulus of the composite and the increase in Young'smodulus with nanotube concentration is similar to that observedwith the clays and in fact even larger for the H-RDP, than the 30Bclays. A lot of previous researchers have mentioned that the pol-ymerefiller interaction is the key to improving the Young'smodulus [29e33]. In this case, higherWa enables a higher degree ofexfoliation of clays, which creates more interaction areas, andstands for higher interaction ability between polymer and fillersurface. Consequently, the nanocomposites with better Wa alwaysshow the better improvements in Young's modulus.

Fig. 4. AFM images of clay monolayers: (a) C-Naþ, (b) C-RDP and (c) C-30B. SEM images of nanotube layers: (d) HNTs and (e) H-RDP. The contact angle optical images of PLAdroplets on each nanoparticle layer: (f) PLA on C-Naþ, (g) PLA on C-RDP, (h) PLA on C-30B, (i) PLA on HNTs and (j) PLA on H-RDP.
Y. Guo et al. / Polymer 83 (2016) 246e259 251
In contrast to the modulus, the degree of elongation shows alinear decrease with increasing filler concentration. The degree ofelongation is a reflection of the degree of “flow” of the samplewhenshear stress is applied. If the Wa between particles and matrix islarge, strong adsorption of the polymer chains occurs onto the fillerinterfaces which restricts their motion under stress. As a resultchain scission occurs rather than flow, which reduces elongationand embrittles the samples. This can be seen from Fig. 7b where weplot the degree of elongation, and where we can see that the PC30Bsamples have the largest negative slope, while the other samplesshow similar small slopes with increasing clay concentration.
The tensile strength of the neat PLA and nanocomposites,plotted in Fig. 7c, exhibits small enhancement for all the samplesexcept the PC30B with the increasing filler content. The increase ofYoung's modulus compensates the reduction of elongation rate,which leads to the constant value of tensile strength for PCNa,PCRDP, PH and PHRDP samples. On the other hand, the reduction ofelongation rate for PC30B is so large that the improvement ofmodulus is insufficient to compensate for it.
The storage modulus (G0) of neat PLA and nanocomposites areshown in Fig. 8a, where we see that, below the glass transitiontemperature (Tg), all nanocomposites have larger values of G0 thanneat PLA due to the interaction between PLA chains and the rigidnanoparticles. In the case of PLA/clay nanocomposites, theenhancement of G0 for PC30B5 is the largest while that for PCNa5 isthe smallest, which again, confirms the fact that higher degree ofexfoliation for clay nanoparticles yields more polymer/platelet in-terfaces and results in the better reinforcement within the polymer.The largest increase in G0 is observed for the PH5 and PHRDP5,indicating that in addition to enhancing the static properties, thetubular nanoparticles are also more effective at enhancing thedynamical properties of the composites. In the case of the clays, theenhancement was attributed to the positive Wa, which scaled withthe increase in the value of the modulus. Furthermore, in a stronglyinteracting system is also known that the Tg of the polymers areaffected. This has been confirmed by detecting the peak of tan d inFig. 8b and displayed in Table 3, where we can see that the PCNa5,PCRDP5 and PC30B5 have increased 0.5 �C, 1.2 �C and 2.8 �C of Tg
Table 2Contact angles of PLA on each kind of nanoparticles.
Parameters PLA on C-Naþ PLA on C-RDP
Contact Angle 71.49�±3.51� 39.86�±2.34�
respectively, and both PH5 and PHRDP5 show higher Tg (2.5 �C and2.4 �C respectively). The interaction between the PLA chains andnanoparticles causes the limitation of chains' mobility and resultsin the rise of Tg. Therefore, higher Tg corresponds to higher inter-action, which is perfectly agreed with the Wa values of all theparticles with the PLA.
The performances of rheology tests have been shown in Fig. 9,where we can find out that the G0 of each nanocomposites becomesless frequency dependence compared to that of neat PLA. The smallslopes of PH5 and PHRDP5's curves at low frequency indicate thatthe G0 are becoming nearly independent of frequency. We ascribethis pseudo-solid viscoelastic transition to the restraint of PLArelaxation by the present of nanotubes. Similar rheologicalbehavior has been observed in other polymer blend systems con-taining tubular nanoparticles like single and multi-wall carbonnanotubes [34e36]. PLA/clay nanocomposites also perform G0
curves with lower slopes at low frequency, which is consistent withsome previous researches [5e8]. Among them, PC30B5 shows thelowest slope due to the highest degree of exfoliation. The G0 of bothPH5 and PHRDP5 exhibit a similar independency of frequency tothe high exfoliated PC30B5 sample, which implies that nanotubesare very effective to restrain the relaxation and long-range motionof PLA chains. The reason can be ascribed to the fact that tubularnanoparticles are easy to form intersected spatial networks inpolymer matrix. It is worth to mention that all the mechanical re-sults of PHRDP samples are better than PH samples at same fillerconcentration. This can be ascribed to the higher Wa between theRDP coated on HNTs surfaces and the PLA matrix.
3.2.2. Impact resistanceIn Fig. 7d, we plot the impact strength as a function of clay
loading. From the figure we can see that it also drops linearly withincreasing clay concentration. The slope of the PCRDP samples issmaller than that of the PCNa samples, while the slope of the P30Bsamples is the largest. Comparing the rate of decrease in elongationwith the rate of decrease of the impact strength one can see that theimpact strength decreases much faster for all the PLA/clay nano-composites. These differences are a consequence of the fact that the
PLA on C-30B PLA on HNTs PLA on H-RDP
35.23�±2.16� 47.92�±2.94� 36.94�±2.25�

Fig. 5. X-ray patterns of nanoparticles. (a) PLA/clay nanocomposites and (b) PLA/nanotube nanocomposites. The dots lines indicate the exact location of (001) peaks for everynanocomposites.
Y. Guo et al. / Polymer 83 (2016) 246e259252
impact force in the Izod test is applied much faster than the abilityof the chains in the entangled polymer to flow.
Nanoparticle inclusions in matrices can generate internalstresses, which result in local crack formation. When an externalstress s, is applied, the stress generated at the tip of the particle,smax is a function of the particle aspect ratio as follows [37].
smax ¼ s�1þ 2
ab
�(2.1)
Where, a and b are the length and width of the volume occupiedby the particle. This volume can be estimated from the TEM images
Fig. 6. TEM images of nanocomposites: (a) PCNa5, (b
shown in Fig. 6 for each type of particle. From the figureswe can seethat the average aspect ratio, r¼ a/b, of C-Na þ tactoids is around 1to 5. In contrast for the PC30B samples, the platelets are fullyseparated and each platelet propagates the external force s. Fromequation (3.1), r is around 10 to 150, which results in a much largerstress applied to the matrix at the tip of the particle for the exfo-liated vs. the tactoidal structures. This large concentration of energycannot be easily dissipated and can result in cracks forming aroundthe clay platelets. For low clay concentrations, the cracks would besmall and localized around the particles, but as the number ofplatelets increases with increasing clay concentration, percolation
) PCRDP5, (c) PC30B5, (d) PH5 and (e) PHRDP5.
Y. Guo et al. / Polymer 83 (2016) 246e259 253
of the cracks is expected to occur, rapidly decreasing the impactresistance of the nanocomposite. In contrast, the number of thenon-exfoliated particles is much smaller while the distance be-tween particles is much larger, making propagation of the cracksmore difficult, and resulting in a much smaller decrease withincreasing clay concentration.
This can be seen in the SEM images obtained from the fracturesurfaces of the specimens broken after the Izod impact tests.From Fig. 10a, f we can see that the PLA surface shows elongatedfibrils which formed prior to fracture. Even though these fibrils areabsent from the PLA/clay nanocomposites, large differences areobserved between the exfoliated and non-exfoliated compounds.On the fracture surface of the PCNa5 one can see many steps andprotruding clay tactoids (Fig. 10b). Closer observation of the tac-toids, shown in Fig. 10g, indicates that they appear nearly oblongand are surrounded by a delaminated region, which resulted fromthe weakWawith the PLA matrix and the high internal stress at thetip of the tactoid (smax can be as high as 11s). But since the particlesare far apart, they remain isolated. In the case of the intercalated C-RDP, the stronger Wa surpresses delamination at the periphery ofthe particle. On the other hand, from Fig. 10h we find that the crackoccurs in the middle of the tactoidal particle. In this case, the strongWa prevents the delamination at particle surface. Instead, thepolymer in the interstices of the clay weakens the structure andmakes it more prone to cracking under stress. The EDAX in theinsert shows that the bright areas surrounding the cracks are rich inSi, or parts of the tactoidal structure. This different crackingmode isnot much to be found on the fracture surface, and leads to thesmoother surface appearance shown in Fig. 10c, which is consistentwith the small decrease rate of the PCRDP samples in impactstrength. A very different images are observed for the PC30Bsamples. From the high magnification image in Fig. 10i we see thatthe cracks decorate the individual clay platelets where the length ofthe cracks is consistent with the dimensions of the clay plateletsobtained from the TEM images. Even though the Wa of C-30B withthe PLA matrix is very strong, the cracks are initiated by theextremely high internal stress at the tip of the platelet (smax can beas high as 300s). Since the concentration of platelets is high, even atthe low weight fraction (5%) shown in Fig. 10d, regions are alreadyformed where the cracks percolate forming much larger fissures,consistent with the large embrittlement measured with increasingconcentration. SEM images of samples where the C-30B concen-tration was increased to 15% are also shown. The lower magnifi-cation image in Fig. 10e shows large cracks that run parallel acrossthe sample surface and are oriented in a directionwhere the impactforces were applied (red arrow). Higher magnification image inFig. 10j of this sample shows large cracks that are forming as thesmaller cracks which surround the clay particles converge andpropagate the force in the direction of the applied stress. Thesecracking mechanisms of all the PLA/clay nanocomposites aresummarized in the illustration shown in Fig. 11.
In Fig. 12a, b we show the fracture surfaces following the impacttesting of the PLA/nanotube nanocomposites at lower resolution.The surfaces of the composites are more similar to the neat PLA,than to the PLA/clay nanocomposites, indicating that with nano-tubes, some flow was able to occur. In Fig. 7d we plot the impactstrength as a function of nanotube concentration, wherewe can seethat even though the impact strength is somewhat smaller thanthat of neat PLA, the rate of decrease is significantly smaller thanthat observed for the PLA/clay nanocomposites, consistent with theappearance of the surface i.e. lack of steps or cracks, after fracture.
Fig. 7. Mechanical properties of neat PLA and nanocomposites: (a) Young's modulus,(b) Elongation at break, (c) Tensile strength and (d) Impact strength.

Table 3Glass transition temperature (Tg) of neat PLAand nanocomposites from tan d curves.
Samples Tg (�C)
PLA 65.3PCNa5 65.8PCRDP5 66.5PC30B5 68.1PH5 67.8PHRDP5 67.7
Y. Guo et al. / Polymer 83 (2016) 246e259254
The relative low aspect ratio and good Wa with the matrix of HNTsand H-RDP are able to prevent the delamination under externalforce, which is further confirmed by the lack of voids around thenanotube/polymer interfaces. In addition, as shown in Fig. 12c andd, the erected tubes and voids on the fracture surface indicate anextraction or pull out process during the impact, which contributesto the impact resistance of composites. Similar to the results intensile and thermodynamic tests, PHRDP samples always performbetter than PH samples in impact resistance at same filler loading,which can be also ascribed to the higher Wa of H-RDP with the PLAmatrix.
Fig. 9. Storage modulus (G0) vs frequency curves of neat PLA and nanocomposites at180 �C.
3.3. Oxygen gas permeability
3.3.1. PlateletsIt has been established by multiple groups that layered silicates
provide efficient barriers towards gas diffusion by increasing thetortuosity of their diffusion pathways within a polymer, i.e. PLAmatrix [5e7,9,10,38,39]. In order to determine the influence of Wa
and particle structure on the permeability, we plot the relativeoxygen permeability as a function of filler concentration in Fig. 13a,where we can clearly see that the reduction in permeability ishighest for the PC30B, or where the exfoliated particles provide thelargest total barrier surface area. The data can be fit with theNielsen model [40] which assumes that gas molecules travelthrough a tortuous pathway composed of rectangular platelets ofwidth (L) and thickness (W), oriented in a direction which isperpendicular to the gas diffusion direction, as shown in theschematic of Fig. 13b. The relative oxygen permeability within thenanocomposites can then be given by
PPo
¼ 1�∅1þ a
2∅(3.1)
Where P and Po are the gas permeability of polymers with andwithout nanoparticles respectively. ∅ is the volume fraction of thenanoparticles and a¼L/W is the aspect ratio of the platelets. If we fitthe datawith a as the only free parameter, the best fits are obtainedin Fig. 13a with the values listed in Table 4, where we can see thatthe values are somewhat lower than the centroid of the distribu-tions observed in the TEM images, but this can be explained by
Fig. 8. Dynamic mechanical curves of neat PLA and nanocomposites: (a)
introducing a tilt angle of platelets caused by random array in realsituation as shown in Fig. 13c. The values obtained for the C-Naþand C-RDP are much lower and clearly not related to the di-mensions of the MMT platelets. But the values for a obtained aresimilar to those for r, or the aspect ratio of the tactoids, which wasused to determine the impact stress concentration. In this case, thelower permeability is an even more sensitive measure of both thenumber as well as the aspect ratio of the tactoids, and clearly
Storage modulus (G0) vs temperature and (b) tan d vs temperature.
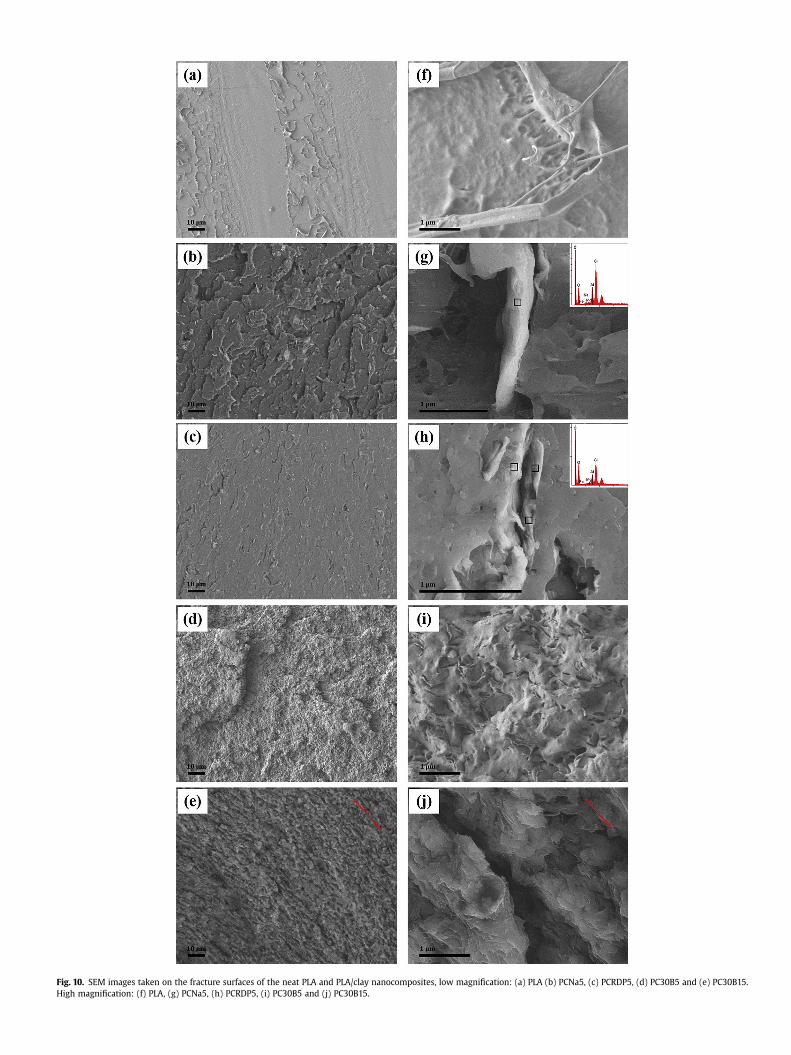
Fig. 10. SEM images taken on the fracture surfaces of the neat PLA and PLA/clay nanocomposites, low magnification: (a) PLA (b) PCNa5, (c) PCRDP5, (d) PC30B5 and (e) PC30B15.High magnification: (f) PLA, (g) PCNa5, (h) PCRDP5, (i) PC30B5 and (j) PC30B15.

Y. Guo et al. / Polymer 83 (2016) 246e259256
sensitive to the reduction in size produced by the increased value ofWa for the C-RDP relative to the C-Naþ. The low gas permeabilityobserved in all cases and especially for the PC30B is also consistentwith the observation that the voids shown in Fig. 10i are a result ofthe shock of the impact. If the voids were generated by processingstrains at the particle interface [41], increased, rather thandecreased, permeability values would have resulted.
3.3.2. NanotubesThe influence of the PLA/nanotube composites on the oxygen
gas permeability is plotted in Fig. 14a as well, which clearly showsthat for the same volume fractions, the tubes appear to have amuchsmall influence on the gas permeability, even at high loadings. Thecylindrical structure of the nanotubes is not well approximated bythe schematic shown in Fig. 13b and c, and hence a modifiedversion of the Nielsen model had to be developed, using theschematic shown in Fig. 14b. The evenly dispersed nanotubes withdiameter (2R) are first presumed to be arranged in an arrayperpendicular to the gas diffusion direction. The permeability co-efficient (P) equals to the product of the diffusion coefficient (D) andsorption coefficient (S) [28].
P ¼ DS (3.2)
Since D is affected by the tortuosity (4):
D ¼ Do4
(3.3)
Where Do is the diffusion coefficient of polymer matrix, and S isdependent on the volume fraction (∅):
S ¼ Soð1�∅Þ (3.4)
Where So is the sorption coefficient of polymer matrix, thepermeability coefficient equation can be expressed as:
PPo
¼ 1�∅4
(3.5)
4 is defined as the specific value of the gas diffusion path (l0) withthe existence of nanotubes over the path (l) without:
Fig. 11. Schematic illustration of crack initiation in the PLA matrix by different clays
4 ¼ l0
l(3.6)
The contribution of each nanotube to prolong the gas diffusionpath is R
Z p2
0ðq� sinqÞdq ¼ p2R =8� R on the average, and assume
the mean number of nanotubes influenced gas diffusing is C, then:
l0 ¼ lþ C�p2R8
� R�
(3.7)
And since C can be written as:
C ¼ l∅2R
(3.8)
Combine equation (3.7) and (3.8):
4 ¼ p2 � 816
∅þ 1 (3.9)
The relative oxygen permeability equation of nanocompositeswith tubular additives is then:
PPo
¼ 1�∅1þ p2�8
16 ∅(3.10)
The equation (3.10) shows that the gas permeability of nano-composites with tubular additives is independent of the tubediameter and hence the effectiveness of tubular nanoparticles onreduction of gas permeability in polymer matrix is much lowerthan that of platelet nanoparticles, in agreement with the experi-mental observation. The gas permeability for the nanotubescalculated from equation (3.10) is also plotted as a function of tubeconcentration in Fig. 14a where we can see that the actual data liesslightly above the curve, but no significant difference is discernedbetween the HNTs and H-RDP. The model proposed to deriveequation (3.10) assumed an oriented array of tubes. The morerealistic situation is shown in the lower panel of Fig. 14c, where thenanotubes are randomly oriented within the matrix. An exactequation for this case is more difficult to derive, but a simpleapproximation could be applied where the effective diffusionpathway of the tubes is assumed to be slightly elliptical, rather thanspherical. This is further reducing the tortuosity of the gas diffusionpathway, and resulting in further, though slight, increase of the gas
: (a) C-Naþ in the matrix, (b) C-RDP in the matrix and (c) C-30B in the matrix.
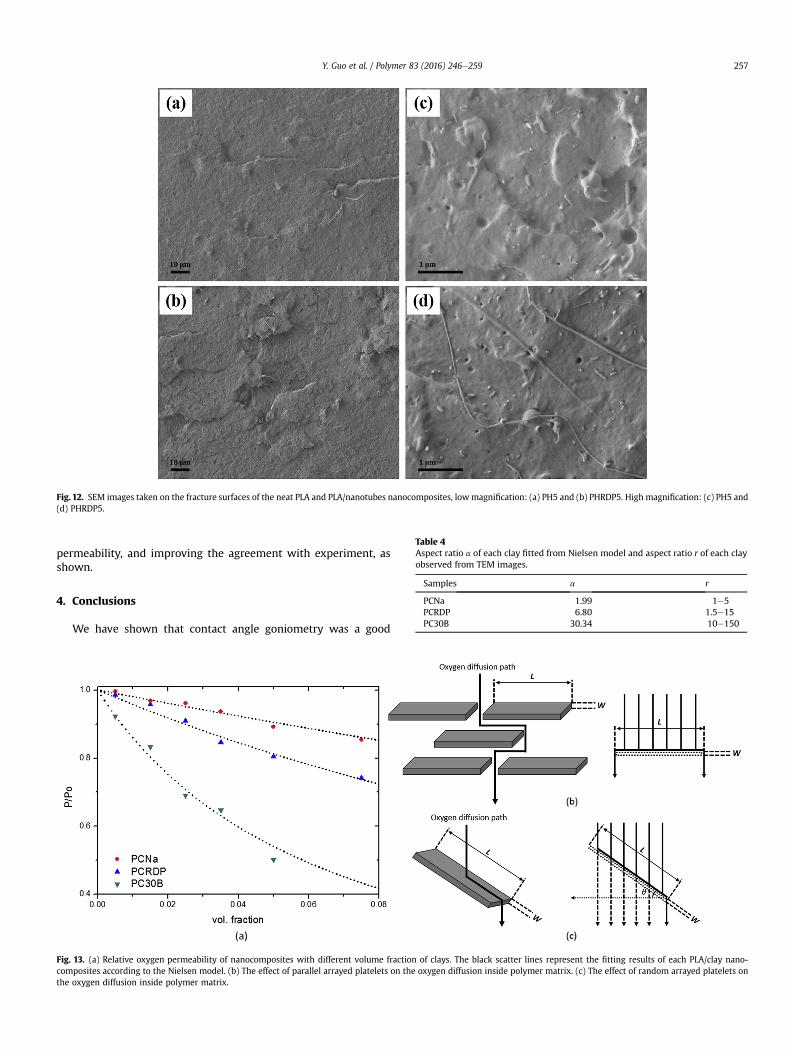
Fig. 12. SEM images taken on the fracture surfaces of the neat PLA and PLA/nanotubes nanocomposites, lowmagnification: (a) PH5 and (b) PHRDP5. High magnification: (c) PH5 and(d) PHRDP5.
Table 4Aspect ratio a of each clay fitted from Nielsen model and aspect ratio r of each clayobserved from TEM images.
Y. Guo et al. / Polymer 83 (2016) 246e259 257
permeability, and improving the agreement with experiment, asshown.
Samples a r
PCNa 1.99 1e5PCRDP 6.80 1.5e15PC30B 30.34 10e150
4. Conclusions
We have shown that contact angle goniometry was a good
Fig. 13. (a) Relative oxygen permeability of nanocomposites with different volume fraction of clays. The black scatter lines represent the fitting results of each PLA/clay nano-composites according to the Nielsen model. (b) The effect of parallel arrayed platelets on the oxygen diffusion inside polymer matrix. (c) The effect of random arrayed platelets onthe oxygen diffusion inside polymer matrix.

Fig. 14. (a) Relative oxygen permeability of nanocomposites with different volume fraction of nanotubes. The black scatter line represents the permeability calculation of PLA/nanotube nanocomposites. (b) The effect of tubes arrayed perpendicularly to the gas diffusion direction on the oxygen diffusion inside polymer matrix. (c) The effect of randomarrayed tubes on the oxygen diffusion inside polymer matrix.
Y. Guo et al. / Polymer 83 (2016) 246e259258
technique for determination ofWa between nanoparticles and theirmatrix. The Wa then can be used to determine the degree ofintercalation of coated or uncoated clay platelets in the polymermatrix as well as the gas permeability, and the mechanical prop-erties. The highest Wa within the PLA matrix was determined forthe C-30B platelets, followed by the C-RDP, and the uncoated C-Naþ. X-ray scattering and TEM indicated that the C-30B exhibited ahigh degree of exfoliation, while the C-RDP were intercalated, andthe C-Na þ platelets were aggregated into large tactoids. Conse-quently the C-30B showed the largest decrease in permeability tooxygen gas, followed by the C-RDP and the C-Naþ. Using amodifiedNielsen model developed to fit the permeability data, we obtainedvalues of the particle aspect ratios consistent with the TEM images.Extending our model to the clay nanotubes we showed that incontrast to platelets, they would not be effective regardless of theWa. This prediction was in excellent agreement with experiment.The mechanical response of the nanocomposites was more com-plex. C-RDP minimized the reduction of the impact strength, whileaddition of C-30B significantly decreased it. SEM images indicatedthat the Izod impact created micro-voids at the clay/polymerinterface. The voids were largest for the 30B sample, reducing itsability to withstand the shock. On the other hand, both RDP coatedand uncoated nanotubes showed better performance inmechanicalproperties than clays especially in dynamic mechanical tests, withH-RDP always showing slightly better results consistent with thehigher Wa with PLA matrix. In addition, relatively low aspect ratioof nanotubes was able to maintain the impact strength but wasmuch less effective to barrier oxygen diffusion of PLAmatrix. All theresults above indicate that RDP absorption can be a much saferalternative method for cation exchange in functionalizing silicatesurface nanoparticles. Platelet nanoparticles with high aspect ratiocan efficiently improve gas barrier property but weaken thetoughness of host matrix. In contrast, tubular nanoparticles are
superior mechanical enhancers but have insignificant influence ongas permeability of host matrix.
Acknowledgment
The Authors thank Dr. Ellen Wachtel and Dr. Yishay Feldmanfrom the Department of Materials and Interfaces at WeizmannInstitute of Science for measuring X-ray diffraction. Support fromNY State Center for Advanced Technology is gratefullyacknowledged.
References
[1] J. Lunt, Polym. Degrad. Stab. 59 (1998) 145e152.[2] R.A. Gross, B. Kalra, Green Chem. 297 (2002) 803e807.[3] S.S. Ray, K. Yamada, A. Ogami, M. Okamoto, K. Ueda, Macromol. Rapid Com-
mun. 23 (2002) 943e947.[4] S.S. Ray, P. Maiti, M. Okamoto, K. Yamada, K. Ueda, Macromolecules 35 (2002)
3104e3110.[5] S.S. Ray, K. Yamada, M. Okamoto, K. Ueda, Polymer 44 (2003) 857e866.[6] S.S. Ray, K. Yamada, M. Okamoto, A. Ogami, K. Ueda, Chem. Mater. 15 (2003)
1456e1465.[7] S.S. Ray, K. Yamada, M. Okamoto, Y. Fujimoto, A. Ogami, K. Ueda, Polymer 44
(2003) 6633e6646.[8] S.S. Ray, M. Okamoto, Macromol. Mater. Eng. 288 (2003) 936e944.[9] S.S. Ray, P. Maiti, M. Okamoto, K. Yamada, K. Ueda, Nano Lett. 2 (2002)
1093e1096.[10] M. Okamoto, J. Ind. Eng. Chem. 10 (2004) 1156e1181.[11] MSDS-Quaternary Ammonium Chloride.[12] MSDS-FYROLFLEX RDP.[13] S. Pack, T. Kashiwagi, C. Cao, C.S. Korach, M. Lewin, M.H. Rafailovich, Macro-
molecules 43 (2010) 5338e5351.[14] M. Du, B. Guo, D. Jia, Polym. Int. 59 (2010) 574e582.[15] J. Koo, S. Pack, S. Satija, A. Tikhonov, J.C. Sokolov, M.H. Rafailovich, T. Koga,
J. Colloid Interface Sci. 318 (2008) 103e109.[16] H. Park, W. Lee, C. Park, W. Cho, C. Ha, J. Mater. Sci. 38 (2003) 909e915.[17] Y. Xu, X. Ren, M.A. Hanna, J. Appl. Polym. Sci. 99 (2006) 1684e1691.[18] G. Ozkoc, S. Kemaloglu, J. Appl. Polym. Sci. 114 (2009) 2481e2487.[19] K.C. Cole, Macromolecules 41 (2008) 834e843.

Y. Guo et al. / Polymer 83 (2016) 246e259 259
[20] A.M. Modro, T.A. Modro, Can. J. Chem. 77 (1999) 890e894.[21] S. Pack, E. Bobo, N. Muir, K. Yang, S. Swaraj, H. Ade, C. Cao, C.S. Korach,
T. Kashiwagi, M.H. Rafailovich, Polymer 53 (2012) 4787e4799.[22] K.P. Nicolini, C.R.B. Fukamachi, F. Wypych, A.S. Mangrich, J. Colloid Interface
Sci. 338 (2009) 474e479.[23] M. Du, B. Guo, Y. Lei, M. Liu, D. Jia, Polymer 49 (2008) 4871e4876.[24] D.E. Packham, Int. J. Adhes. Adhes. 16 (1996) 121e128.[25] L. Zaidi, S. Bruzaud, A. Bourmaud, P. Mederic, M. Kaci, Y. Grohens, J. Appl.
Polym. Sci. 116 (2010) 1357e1365.[26] M. Paul, M. Alexandre, P. Degee, C. Calberg, R. Jerome, P. Dubois, Macromol.
Rapid Commun. 24 (2003) 561e566.[27] L. Guimaraes, A.N. Enyashin, G. Seifert, H.A. Duarte, J. Phys. Chem. C 114
(2010) 11358e11363.[28] J.L. Suter, R.L. Anderson, H.C. Greenwell, P.V. Coveney, J. Mater. Chem. 19
(2009) 2482e2493.[29] M. Bhattacharya, A.K. Bhowmick, Polymer 49 (2008) 4808e4818.[30] H. Gu, J. Guo, H. Wei, S. Guo, J. Liu, Y. Huang, M.A. Khan, X. Wang, D.P. Young,
S. Wei, Z. Guo, Adv. Mater. 27 (2015) 6277e6282.
[31] H. Gu, J. Guo, H. Wei, X. Yan, D. Ding, X. Zhang, Q. He, S. Tadakamalla, X. Wang,T.C. Ho, S. Wei, Z. Guo, J. Mater. Chem. C 3 (2015) 8152e8165.
[32] M. Murariu, A. Dechief, Y. Paint, S. Peeterbroeck, L. Bonnaud, P. Dubois,J. Polym. Environ. 20 (2012) 932e943.
[33] K. Prashantha, B. Lecouvet, M. Sclavons, M.F. Lacrampe, P. Krawczak, J. Appl.Polym. Sci. 128 (2013) 1895e1903.
[34] T. Kashiwagi, F. Du, J.F. Douglas, K.I. Winey, R.H. Harris Jr., J.R. Shields, Nat.Mater. 4 (2005) 928e933.
[35] F. Du, R.C. Scogna, W. Zhou, S. Brand, J.E. Fischer, K.I. Winey, Macromolecules37 (2004) 9048e9055.
[36] S. Pack, T. Kashiwagi, D. Stemp, J. Koo, M. Si, J.C. Sokolov, M.H. Rafailovich,Macromolecules 42 (2009) 6698e6709.
[37] B. Cotterell, J.Y.H. Chia, K. Hbaieb, Eng. Fract. Mech. 74 (2007) 1054e1078.[38] N. Tenn, N. Follain, J. Soulestin, R. Cretois, S. Bourbigot, S. Marais, J. Phys.
Chem. C 117 (2013) 12117e12135.[39] G. Choudalakis, A.D. Gotsis, Eur. Polym. J. 45 (2009) 967e984.[40] L.E. Nielsen, J. Macromol. Sci. Part A 1 (1967) 929e942.[41] A. Yasmin, J.L. Abot, I.M. Daniel, Scr. Mater. 49 (2003) 81e86.


