Effects of atmospheric pressure loading and seven ...
12
Effects of atmospheric pressure loading and seven-parameter transformations on estimates of geocenter motion and station heights from space geodetic observations P. Tregoning Research School of Earth Sciences, Australian National University, Canberra, ACT, Australia T. van Dam European Center for Geodynamics and Seismology, Luxembourg Received 22 July 2004; revised 20 December 2004; accepted 3 January 2005; published 23 March 2005. [1] Variations in fluid loads such as the oceans and the atmosphere deform the surface of the Earth. The accuracy of station coordinates, in particular, heights, that can be estimated depends on how well one can separate these surface deformations from the associated translational motion between the center of mass of the solid Earth and the total Earth (CM). We applied simulated atmospheric pressure loading effects to the coordinates of sites in the CM frame to explore to what level of accuracy both geocenter motion and accurate station coordinates can actually be recovered from geodetic analyses. We found that standard seven-parameter transformations (three rotations, three translations, scale) generally recover about 80% of the geocenter motion; however, the inclusion of a scale factor permits the aliasing of surface loading deformation, introducing scale errors of up to 0.3 ppb and daily height errors as large as 4 mm. This limits the geophysical studies that can be performed accurately using the results of geodetic analyses where the magnitudes of the signals are small (e.g., tectonic movement of tide gauges, uplift rates for interpreting glacial isostatic adjustment). The quality of the geodetic results is extremely sensitive to the number and distribution of sites used to estimate the transformations and becomes worse when regional (rather than global) sets of sites are used. If the scale factor parameter is omitted, then the amount of aliasing of surface loading effects is reduced considerably and more accurate site velocities and geocenter motion estimates are achieved. Citation: Tregoning, P., and T. van Dam (2005), Effects of atmospheric pressure loading and seven-parameter transformations on estimates of geocenter motion and station heights from space geodetic observations, J. Geophys. Res., 110, B03408, doi:10.1029/2004JB003334. 1. Introduction [2] The total mass of the Earth is composed of the solid Earth and the fluid loads at the surface such as the oceans and the atmosphere, snow loading and continental water storage. The center of mass of the solid Earth (CE) does not coincide with the center of mass of the total Earth (CM) (Figure 1); rather, the two are related by a translation (commonly called ‘‘geocenter motion’’) [e.g., Farrell, 1972; Dong et al., 1997, 2003; Blewitt, 2003] and spatially and temporally varying deformation of the surface of the Earth. [3] Unlike the CE reference frame, the CM frame is directly accessible by observation [Blewitt, 2003]. Space geodetic techniques such as satellite laser ranging (SLR) and Global Positioning System (GPS) involve observing Earth-orbiting satellites from tracking stations on the sur- face of the Earth. The satellites rotate around the center of mass of the total Earth (CM) and the coordinates of the tracking sites located on the surface of the Earth are defined in an International Terrestrial Reference Frame (ITRF). The realized nature of the ITRF is a CM frame in the long-term but is a center of figure frame (CF) in the short-term [Dong et al., 2003] (Figure 1). Therefore space geodetic techniques are theoretically capable of providing estimates of the translation between CM and CF caused by the surficial mass distribution variations, although the parameterization of the satellite orbits could possibly accommodate some of this geocenter motion [Watkins and Eanes, 1997; Blewitt, 2003]. [4] The transformations between reference frames is an important part of any geodetic analysis, and the accuracy of the resulting estimates of geophysical parameters (e.g., site velocities and even the geocenter motion estimates them- selves) are dependent upon how this process is undertaken. JOURNAL OF GEOPHYSICAL RESEARCH, VOL. 110, B03408, doi:10.1029/2004JB003334, 2005 Copyright 2005 by the American Geophysical Union. 0148-0227/05/2004JB003334$09.00 B03408 1 of 12
Transcript of Effects of atmospheric pressure loading and seven ...
Effects of atmospheric pressure loading and
seven-parameter transformations on estimates of
geocenter motion and station heights from space
geodetic observations
P. TregoningResearch School of Earth Sciences, Australian National University, Canberra, ACT, Australia
T. van DamEuropean Center for Geodynamics and Seismology, Luxembourg
Received 22 July 2004; revised 20 December 2004; accepted 3 January 2005; published 23 March 2005.
[1] Variations in fluid loads such as the oceans and the atmosphere deform the surface ofthe Earth. The accuracy of station coordinates, in particular, heights, that can be estimateddepends on how well one can separate these surface deformations from the associatedtranslational motion between the center of mass of the solid Earth and the total Earth(CM). We applied simulated atmospheric pressure loading effects to the coordinates ofsites in the CM frame to explore to what level of accuracy both geocenter motion andaccurate station coordinates can actually be recovered from geodetic analyses. We foundthat standard seven-parameter transformations (three rotations, three translations, scale)generally recover about 80% of the geocenter motion; however, the inclusion of a scalefactor permits the aliasing of surface loading deformation, introducing scale errors of up to0.3 ppb and daily height errors as large as 4 mm. This limits the geophysical studiesthat can be performed accurately using the results of geodetic analyses where themagnitudes of the signals are small (e.g., tectonic movement of tide gauges, uplift rates forinterpreting glacial isostatic adjustment). The quality of the geodetic results is extremelysensitive to the number and distribution of sites used to estimate the transformationsand becomes worse when regional (rather than global) sets of sites are used. If the scalefactor parameter is omitted, then the amount of aliasing of surface loading effects isreduced considerably and more accurate site velocities and geocenter motion estimates areachieved.
Citation: Tregoning, P., and T. van Dam (2005), Effects of atmospheric pressure loading and seven-parameter transformations on
estimates of geocenter motion and station heights from space geodetic observations, J. Geophys. Res., 110, B03408,
doi:10.1029/2004JB003334.
1. Introduction
[2] The total mass of the Earth is composed of the solidEarth and the fluid loads at the surface such as the oceansand the atmosphere, snow loading and continental waterstorage. The center of mass of the solid Earth (CE) does notcoincide with the center of mass of the total Earth (CM)(Figure 1); rather, the two are related by a translation(commonly called ‘‘geocenter motion’’) [e.g., Farrell,1972; Dong et al., 1997, 2003; Blewitt, 2003] and spatiallyand temporally varying deformation of the surface of theEarth.[3] Unlike the CE reference frame, the CM frame is
directly accessible by observation [Blewitt, 2003]. Spacegeodetic techniques such as satellite laser ranging (SLR)and Global Positioning System (GPS) involve observing
Earth-orbiting satellites from tracking stations on the sur-face of the Earth. The satellites rotate around the center ofmass of the total Earth (CM) and the coordinates of thetracking sites located on the surface of the Earth are definedin an International Terrestrial Reference Frame (ITRF). Therealized nature of the ITRF is a CM frame in the long-termbut is a center of figure frame (CF) in the short-term [Donget al., 2003] (Figure 1). Therefore space geodetic techniquesare theoretically capable of providing estimates of thetranslation between CM and CF caused by the surficialmass distribution variations, although the parameterizationof the satellite orbits could possibly accommodate some ofthis geocenter motion [Watkins and Eanes, 1997; Blewitt,2003].[4] The transformations between reference frames is an
important part of any geodetic analysis, and the accuracy ofthe resulting estimates of geophysical parameters (e.g., sitevelocities and even the geocenter motion estimates them-selves) are dependent upon how this process is undertaken.
JOURNAL OF GEOPHYSICAL RESEARCH, VOL. 110, B03408, doi:10.1029/2004JB003334, 2005
Copyright 2005 by the American Geophysical Union.0148-0227/05/2004JB003334$09.00
B03408 1 of 12

Transformations not done correctly can yield coordinate/velocity errors that would lead to incorrect geophysicalinterpretations. To this end, we describe below how esti-mating a scale factor in transforming between referenceframes actually degrades the accuracy of site coordinatesand geocenter motion estimates when surface loads arepresent and unaccounted for.[5] The relation between the CM and CF reference frames
is straightforward: the coordinates of a site, i, in the framescan be written as
X CMi þ �CMi ¼ X CF
i þ T þ �CFi ð1Þ
where T is simply a translation (in Cartesian coordinates) ofthe origin and represents the geocenter motion while �i
CM
and �iCF are the surface displacements of site i in the CM and
CF frames, respectively, caused by the fluid loads. Byconstruction, � has a mean of zero when summed across thewhole of the Earth because the translation, T, is the constantpart of the deformation.[6] A common approach to the analysis of space-geodetic
observations is to first compute a ‘‘fiducial-free’’ network,that is, one in which the coordinates of the ground trackingstations are only loosely constrained [e.g., Herring et al.,1991; Heflin et al., 1992; Zumberge et al., 1997]. The freenetwork is then aligned with a terrestrial reference frame bycomputing a transformation of the site coordinates withrespect to their externally derived values (e.g., theirITRF2000 values). In GPS analysis, a seven-parametertransformation is often estimated (three translations, threerotations, scale factor) [Blewitt et al., 1992] where thetranslations are direct estimates of the geocenter motionbetween the CM and CF reference frames. Estimatinggeocenter motion in this manner (called the ‘‘network shiftapproach’’ by Dong et al. [2003]) has generally producedvalues with a large variation that appear to be quite sensitiveto analysis procedures and are probably dominated byunmodeled noise sources [Heflin et al., 2002; Dong et al.,2003].[7] Wu et al. [2003] transformed fiducial-free networks
into the center of network (CN) frame (using seven-param-eter transformations [Heflin et al., 2002]), removed lineartrends from the resulting time series and inverted theresiduals for both the pattern of surface deformation andgeocenter motion. The estimation of geocenter motion inthis manner has been called the ‘‘degree-1 deformationapproach’’ [Dong et al., 2003]. Any errors introduced bythe transformation process into the terrestrial referenceframe will affect the accuracy of the geocenter motionestimates by this method. Blewitt et al. [2001] estimatedsimultaneously from GPS fiducial-free networks a timeseries of site coordinates, six-parameter transformations ofweekly networks from the CM to the CF frame and globaldegree-1 Earth deformation. This process is not the same asthe degree-1 deformation approach because the transforma-tions between reference frames and the load moment areestimated at the same time rather than sequentially(D. Lavallee and G. Blewitt, personal. communication,2004). The deformations predicted by their model have alsobeen detected in very long baseline interferometry baselines[Lavallee and Blewitt, 2002].
Figure 1. (a–c) Simplified illustration of the differentreference frames used in geodesy. In Figure 1a, the solidcircle represents the center of mass of the solid Earth (CE)while the cross represents the center of mass of the totalEarth (CM), being the solid Earth plus the surface masssystem in the fluid envelope (FE). In Figure 1b the center ofnetwork (CN, black hexagon) is different from both CE andCM in the extreme case of only three stations. In Figure 1c,in the theoretical situation of having geodetic sites evenlyspaced over the entire surface of the Earth (including in theoceans), the center of figure (CF, solid square) approximatesCE. Note that surface deformation associated with degree-1surface loading has been omitted in order to simplify thefigure.
B03408 TREGONING AND VAN DAM: STATION HEIGHTS AND GEOCENTER MOTION
2 of 12
B03408
[8] Here we scrutinize the process of transforming a set ofcoordinates from the CM to the CF frame. We used a oneyear simulated series of fiducial-free global polyhedra in theCM frame that include atmospheric pressure loading in-duced surface deformations and translations to assess towhat extent these signals can be recovered and/or alias intoother parameters in the transformation process. We alsoinvestigated the sensitivity of the process to the selection ofsites used to estimate the transformations by using differentsets of transformation sites. Our approach does not involveanalyzing any actual space-geodetic observations but theconclusions are relevant to all techniques (e.g., SLR, GPS,DORIS) that involve transformations of networks from theCM to the CF frame.[9] For clarity, we refer below to the sites used to
compute the transformations as ‘‘transformation sites’’ andnetworks of such sites as ‘‘transformation networks.’’ Afiducial-free network may thus be composed of a transfor-mation network (being the transformation sites used totransform from one reference frame to another) and theremaining sites that are not used in that particular transfor-mation but that do get transformed into the other referenceframe.
2. Surface Load
[10] In this study we look in detail at the effects ofestimating geocenter motion by transforming loosely con-strained coordinates, affected only by atmospheric pressureloading, into an ITRF using the network shift approach. Theloading effects of other fluid loads can be expected to havesimilar effects (scaled by the difference in magnitudes of theloading) on the estimates of geodetic site coordinates andgeocenter motion on daily time scales; therefore the con-clusions from the results below can be extrapolated to othermass loading phenomena.[11] The deformation of the surface of the Earth produced
by changes in the mass of the atmosphere can be estimatedfrom a knowledge of the atmospheric pressure at the surfaceby convolving Green’s functions to calculate the integrateddeformation [e.g., van Dam and Herring, 1994; Chen et al.,1999; Moore and Wang, 2003; Petrov and Boy, 2004]. Weused global atmospheric pressure data from the NCEPReanalysis and the details of the computation are describedin detail by T. M. van Dam and P. Tregoning (CorrectingGPS data for atmospheric pressure loading at the observa-tion level, manuscript in preparation, 2005, hereinafterreferred to as T. M. van Dam and P. Tregoning, manuscriptin preparation, 2005). This is a simplified model that omitsthe diurnal and semidiurnal atmospheric tides; however, forthe purposes of simulating a likely atmospheric pressureloading signal it suffices to capture only the first-ordereffect which is the daily to seasonal variations in atmo-spheric pressure. The omitted tidal effects have a maximumamplitudes of around 1 mm and 3 mm in the verticalcomponent for the diurnal and semidiurnal tides, respec-tively [van Dam et al., 2003].[12] To compute the atmospheric pressure loading
(ATML) displacements in the CM reference frame, we useda global convolution of the atmospheric pressure withGreen’s functions which have been derived using degree-1load Love numbers in the CM frame (all other load Love
numbers to degree 144 remain the same in different refer-ence frames) [Farrell, 1972; Blewitt, 2003]. Similarly,deformations in the CF frame were derived from Green’sfunctions using degree-1 load Love numbers in the CFframe.[13] The same observations of atmospheric pressure were
used to create the ATML in the CM and CF frames;therefore the computed loading effects, �i, at any site, i, inthe CM and CF frames is can be expressed as
�CMi ¼ �CFi þ T1 ð2Þ
where T1 is the degree-1 translation of the geocenter fromthe CF origin to the CM origin. We refer below to thesetranslations as the ‘‘true’’ degree-1 geocenter motion sincethey are known exactly from the numerical modeling of theATML in the two reference frames.[14] We generated a time series of these translations at
6 hourly intervals by calculating the difference in computedloading from the CF and the CM models. This valuechanges as a function of time, reflecting the changing natureof atmospheric pressure across the Earth. Previous studieshave used such estimates of geocenter motion to derivespherical harmonic models for geocenter motion and tocompare annual and semiannual variations with valuesderived from SLR analyses [e.g., Chen et al., 1999]. Whatis of greater interest in this study are the small, dailyvariations and whether and how they alias into otherparameters in the transformation from the CM to the CFreference frame.[15] The atmospheric pressure loading includes higher-
degree effects that average to a mean of zero across theentire Earth. However, discrete sampling of the loadingeffects may have the adverse effect of permitting thealiasing of higher-degree deformations into geocenter mo-tion estimates when transforming from the CM to the CFreference frames.[16] While we have used a simulated model for atmo-
spheric pressure loading, it is based on actual globalpressure variations and does represent realistic surficialdeformations. A high correlation has been found on a site-by-site basis between predicted vertical motion and varia-tions actually seen in GPS height time series (T. M. vanDam and P. Tregoning, manuscript in preparation, 2005).
3. Simulated Coordinates
[17] Imagine an analysis of a global network of spacegeodetic observations (e.g., SLR or GPS) that is perfectexcept for the modeling of atmospheric pressure loading.That is, the orbit force model matches precisely the motionof the satellites, the tropospheric and ionospheric delays aremodeled exactly, solid earth tide, ocean tide loading modelsand all other physical phenomena are perfectly modeled butno consideration has been given to the effects of atmosphericpressure loading. A fiducial-free solution from such ananalysis would produce a global polyhedron in the CMframe (because the artificial satellites rotate around thecenter of mass of the total Earth) where the ground trackingstation coordinates would be the ‘‘perfect’’ estimates of thecoordinates plus the station-dependent surficial loadingeffects (in the CM frame) caused by the unmodeled atmo-
B03408 TREGONING AND VAN DAM: STATION HEIGHTS AND GEOCENTER MOTION
3 of 12
B03408

spheric pressure loading. If the true coordinates of the siteswere known, an analysis of such solutions could yieldinformation about how ignoring the atmospheric pressureloading effects (origin translations and surface deformation)affects the accuracy of the final geodetic products of orbitalparameters, geocenter motion and site coordinates.[18] It is straightforward to simulate such a global
polyhedron of station coordinates by adding the ATML(computed in the CM frame) for any number of sites tosome a priori values of the sites in the CF frame. In sodoing, one introduces the degree-1 translation of the originfrom the CF to the CM frame as well as the site-specificsurface deformations (which may include higher-degreeeffects as well). Using ATML values computed on differentdays permits a time series of global polyhedra to be
created. Since this process requires no actual observations,one is free to generate site coordinates anywhere on theEarth including in ocean regions. Therefore we generatedvalues for ‘‘realistic’’ sites where actual geodetic trackingstations exist but also on a regular 10� grid across the entireEarth.[19] The result is a set of station coordinates for each day
of 2001 that vary from day to day, where the variation is aresult of only a translation between the origin of the CM andthe CF frames as well as surficial deformation caused byatmospheric pressure loading. Both of these are quantitiesgenerated from the ATML model and are known exactly.For simplification, we set to zero the velocities of all sites sothat the true estimate of the site coordinates is the same forevery day. Any deviations from the a priori values therefore
Figure 2. Transformation networks used to transform-free networks in the CM frame into the CF frame,and coordinate RMS after removing the ATML(cf). Results for six- and seven-parameter transformationsare shown for each network: (a) 37-station network ofDong et al. [2002]; (b) 66-station network of Blewittet al. [2001]; (c) 10� grid across the entire Earth; (d) only nodes in Figure 2c that lie over land; (e) as forFigure 2c but excluding nodes located on the Antarctic continent; (f) only nodes in Figure 2e that lie overland. Note that the scale range is different in Figure 2d from all the other plots.
B03408 TREGONING AND VAN DAM: STATION HEIGHTS AND GEOCENTER MOTION
4 of 12
B03408
represent errors that have been introduced into stationcoordinates.
4. Results
[20] We transformed the daily polyhedra in the CM frameonto the a priori site coordinates in the CF frame andcompared the estimates of the transformation parametersto the true values. In the case of the scale factor and thethree rotation parameters, the true values are in fact zero.The translation estimates should be the translations betweenthe CM and CF reference frames, with the values changingfrom day to day in a known way. The horizontal coordinatesof all transformation sites were given equal weighting andwe varied the ratio of weighting of heights with respect tohorizontal coordinates as described below.[21] We used several different selections of global and
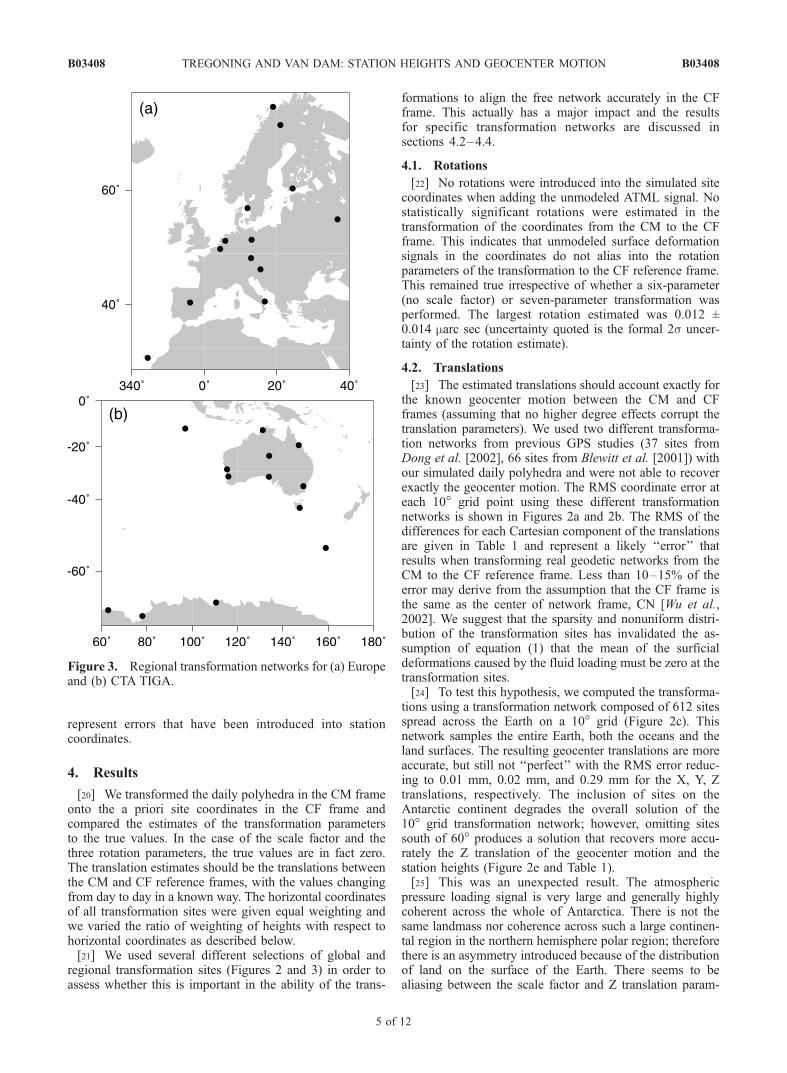
regional transformation sites (Figures 2 and 3) in order toassess whether this is important in the ability of the trans-
formations to align the free network accurately in the CFframe. This actually has a major impact and the resultsfor specific transformation networks are discussed insections 4.2–4.4.
4.1. Rotations
[22] No rotations were introduced into the simulated sitecoordinates when adding the unmodeled ATML signal. Nostatistically significant rotations were estimated in thetransformation of the coordinates from the CM to the CFframe. This indicates that unmodeled surface deformationsignals in the coordinates do not alias into the rotationparameters of the transformation to the CF reference frame.This remained true irrespective of whether a six-parameter(no scale factor) or seven-parameter transformation wasperformed. The largest rotation estimated was 0.012 ±0.014 marc sec (uncertainty quoted is the formal 2s uncer-tainty of the rotation estimate).
4.2. Translations
[23] The estimated translations should account exactly forthe known geocenter motion between the CM and CFframes (assuming that no higher degree effects corrupt thetranslation parameters). We used two different transforma-tion networks from previous GPS studies (37 sites fromDong et al. [2002], 66 sites from Blewitt et al. [2001]) withour simulated daily polyhedra and were not able to recoverexactly the geocenter motion. The RMS coordinate error ateach 10� grid point using these different transformationnetworks is shown in Figures 2a and 2b. The RMS of thedifferences for each Cartesian component of the translationsare given in Table 1 and represent a likely ‘‘error’’ thatresults when transforming real geodetic networks from theCM to the CF reference frame. Less than 10–15% of theerror may derive from the assumption that the CF frame isthe same as the center of network frame, CN [Wu et al.,2002]. We suggest that the sparsity and nonuniform distri-bution of the transformation sites has invalidated the as-sumption of equation (1) that the mean of the surficialdeformations caused by the fluid loading must be zero at thetransformation sites.[24] To test this hypothesis, we computed the transforma-
tions using a transformation network composed of 612 sitesspread across the Earth on a 10� grid (Figure 2c). Thisnetwork samples the entire Earth, both the oceans and theland surfaces. The resulting geocenter translations are moreaccurate, but still not ‘‘perfect’’ with the RMS error reduc-ing to 0.01 mm, 0.02 mm, and 0.29 mm for the X, Y, Ztranslations, respectively. The inclusion of sites on theAntarctic continent degrades the overall solution of the10� grid transformation network; however, omitting sitessouth of 60� produces a solution that recovers more accu-rately the Z translation of the geocenter motion and thestation heights (Figure 2e and Table 1).[25] This was an unexpected result. The atmospheric
pressure loading signal is very large and generally highlycoherent across the whole of Antarctica. There is not thesame landmass nor coherence across such a large continen-tal region in the northern hemisphere polar region; thereforethere is an asymmetry introduced because of the distributionof land on the surface of the Earth. There seems to bealiasing between the scale factor and Z translation param-
Figure 3. Regional transformation networks for (a) Europeand (b) CTA TIGA.
B03408 TREGONING AND VAN DAM: STATION HEIGHTS AND GEOCENTER MOTION
5 of 12
B03408
eters, both of which move site coordinates in roughlyparallel directions close to the pole. A different samplingof the Earth (e.g., equal distance between grid nodes or evena higher density of nodes) would probably resolve thisproblem but we did not pursue this. Below we treat thegrid solution without transformation sites in Antarctica asour ‘‘best’’ transformation network.[26] We selected from this 10� grid (excluding the nodes
located south of 60�S) the nodes that happen to fall on (orwithin a few hundred kilometers of) a landmass. Thisreduces the number of transformation sites from 612 to300, still considerably more than used by Blewitt et al.[2001] (66 sites) or Dong et al. [2002] (37 sites) and in amore regular pattern than can be provided by existinggeodetic tracking sites. The use of this transformationnetwork (Figure 2f) produced geocenter motion errorssimilar to that of the 66 site network (Table 1) and isclearly inferior to the solution including fictitious sitesover oceans.
4.3. Scale Factor
[27] Rather than simply averaging to a mean of zeroacross the Earth, the surficial deformations at the trackingsites get absorbed erroneously into the scale factor of theseven-parameter transformations. This has two adverseeffects: it corrupts the geocenter translation estimates andintroduces errors in the station coordinates, in particular, inthe height component (see Figure 2). Since fluid loadingoccurs at all times, all geodetic analyses that haveused seven-parameter transformations to align fiducial-freeglobal polyhedra to a CF frame will have introduced errorsinto the coordinate estimates because of this aliasing.[28] The pattern and magnitude of error in station coor-
dinates depends upon the number and distribution of trans-formation sites. Figure 2 shows the RMS of coordinateerrors (in north, east and up) over a 12 month period fromseven-parameter transformations using different transforma-tion networks. The pattern is very similar for the 37 and66 station GPS transformation networks (Figures 2a and2b), although the magnitude of the RMS error in height is
reduced in the latter case, probably because the scale factorestimates from the 66 station transformations are generallysmaller (Figure 4). Using a transformation network with a10� spacing (excluding sites south of 60� on the Antarcticcontinent) yields a solution with an RMS of less than0.3 mm in all components (Figure 2e). A solution usingonly grid nodes in Figure 2e that lie over continentallandmass (but excluding the Antarctic sites) produces apattern similar to the 66 transformation site solutions.[29] In contrast, the results from six-parameter transfor-
mations (no scale factor estimated), using the same globalpolyhedra and transformation networks, have coordinateRMS values of �0.2 mm (Table 1 and Figure 2). Here,there is no appreciable difference introduced by the changesin the transformation networks, indicating that the availabledistribution of space-geodetic tracking sites is capable ofproducing the correct answer. The remaining differencesseen in the geocenter motion estimates are probably causedby higher-degree loading effects and by insufficient sam-pling of the Earth. We can place a current lower bound of�0.2 mm (or �1%) on the accuracy of geocenter motionestimates derived from the network shift approach if surfacedeformation caused by ATML is present.
4.4. Weighting of the Height Component
[30] The results of the seven-parameter transformationsshown in Figure 2 have been computed with equal weightsfor north, east and height components. Decreasing theweight of the heights (e.g as suggested by Dong et al.[1998, 2002]) actually makes the results worse (Figure 5).Changing the weighting of the height component alsoincreases the errors introduced in the six-parameter trans-formations. The downweighting of the heights permitsunmodeled surface loading effects to be absorbed intothe height parameters of the transformation sites, therebydestabilizing the transformation process and degrading theresult.[31] However, removing the heights altogether produces
a similar result to that of weighting all componentsequally. Given that the height estimates from real obser-
Table 1. RMS of Site Coordinates, Geocenter Errors, and Scale Factor Estimates Using Different Transformation Networksa
TransformationNetwork
Number ofSitesb
Mean Site Coordinate Error RMS RMS Geocenter Motion Error RMS ScaleFactor, ppbN, mm E, mm U, mm X, mm Y, mm Z, mm
Seven-Parameter TransformationDong et al. [2002] 37 0.38 0.40 0.72 0.43 0.32 0.31 0.10Blewitt et al. [2001] 66 0.32 0.36 0.46 0.28 0.40 0.21 0.0610� grid 612 0.14 0.05 0.31 0.01 0.02 0.29 0.0610�, land-only 300 0.54 0.21 1.08 0.14 0.22 0.76 0.1510� (no Antarctic) grid 560 0.17 0.06 0.25 0.02 0.04 0.21 0.0310� (no Antarctic), land-only 228 0.47 0.39 0.54 0.25 0.48 0.41 0.06
Six-Parameter TransformationDong et al. [2002] 37 0.23 0.20 0.20 0.13 0.22 0.22 -Blewitt et al. [2001] 66 0.22 0.17 0.22 0.11 0.20 0.23 -10� grid 612 0.20 0.16 0.20 0.10 0.20 0.22 -10�, land-only 300 0.24 0.20 0.23 0.12 0.25 0.25 -10� (no Antarctic) grid 560 0.18 0.15 0.18 0.10 0.20 0.20 -10� (no Antarctic), land-only 228 0.21 0.19 0.21 0.12 0.25 0.23 -Europe 13 2.89 4.02 3.09 -Australasian 12 1.06 1.33 0.80 -
aSite coordinates have been transformed from the CM to the CF frame and the atmospheric pressure loading (in the CF frame) has been subtractedsubsequently.
bThis is the number of sites used in the computation of the transformation, not the total number of sites in the network.
B03408 TREGONING AND VAN DAM: STATION HEIGHTS AND GEOCENTER MOTION
6 of 12
B03408

vations are likely to contain errors caused by mismodel-ing of tropospheric effects, antenna phase center varia-tions etc, it makes sense to not use them at all in thetransformation. The results of six-parameter transforma-
tions shown in Figure 2 were derived without includingthe height components.
5. Effect on Regional Networks
[32] Certain fluid loading signals correlate across largegeographical regions. This can be seen by the spatiallycoherent (but temporally varying) deformation in the verti-cal component caused by atmospheric pressure loading(Figure 6). There is little chance that the loading deforma-tion at a set of transformation sites in a regional network(albeit a network spanning thousands of kilometers) willaverage to a mean of zero. Consequently, the assumption ofzero-mean surface deformation in equation (1) will beinvalidated and the estimated geocenter translations willbe incorrect.[33] We computed six-parameter transformations using
two regional transformation networks. The first spans west-ern Europe (Figure 3a), while the other is the same as theregional network analyzed by the CTA TIGA-PP AnalysisCentre [Tregoning et al., 2004]. A large portion of thecorrelated surface deformation gets absorbed directly intothe translation parameters, thus producing errors in thegeocenter motion estimates (Figure 7 and Table 1). It hasbeen recognized previously that geocenter motion estimatesfrom regional networks are not reliable [Davies and Blewitt,2000]; however, the effect of this on the resulting stationheights has not been demonstrated.[34] For the station at Maspalomas, located in the Canary
Islands off the west coast of Africa, the RMS of the heighttime series using a global transformation network is 0.2 mmbut 2.1 mm when the regional transformation network isused (both of these computations involve transforming intothe CF frame then subtracting the modeled ATML signal.The RMS of the uncorrected height estimates is 2.3 and0.6 mm for the regional and global solutions, respectively).The atmospheric pressure loading signal at the site is verysmall (Figure 7), with an RMS of 0.6 mm; however, theATML effects at the other European sites have corrupted thetransformations from the CM to the CF frame, therebydegrading considerably the accuracy of the height estimatesat the coastal site of Maspalomas. The degradation isconsiderably worse than the small ATML signal present atthe site.[35] A similar situation arises using the much larger
regional transformation network shown in Figure 3b, al-though the magnitude of degradation of the coordinateestimates is much smaller. The accuracy of the estimatedgeocenter motion is also greatly improved (Figure 7). Ingeneral, height estimates from a regional transformationnetwork stabilization contain significantly more errorthan those derived from global transformation networks(Table 2).
6. Discussion
[36] Blewitt et al. [1992] converted the fudicial-free net-works of Heflin et al. [1992] into the ITRF’90 referenceframe using seven-parameter transformations. They statedthat the scale of the systems are defined by the speed oflight and gravitational coefficient, GM, and therefore thatthe scale factor parameter should be consistent with zero.
Figure 4. Daily scale factor estimates from differentfiducial networks: (a) 37 sites of Dong et al. [2002];(b) 66 sites of Blewitt et al. [2001]; (c) 612 sites on a10� global grid; (d) as for Figure 4c but without Antarcticfiducial sites; (e) as for Figure 4d but only sites overland.
B03408 TREGONING AND VAN DAM: STATION HEIGHTS AND GEOCENTER MOTION
7 of 12
B03408

Transformations of free networks including scale factorparameters have been employed by van Dam et al.[1994], Dixon et al. [1997], Zumberge et al. [1997], Maoet al. [1999], Freymueller et al. [1999], Davies and Blewitt[2000], Heflin et al. [2002], Willis and Heflin [2004], andmany other studies (the lists provided here and below areindicative rather than exhaustive).[37] Studies using SLR either define the terrestrial refer-
ence frame by fixing site coordinates [e.g., Bianco et al.,1998; Schillak and Wnuk, 2003] (hence do not estimate atransformation at all) or do not estimate a scale factorparameter [e.g., Noomen et al., 1993; Schwintzer et al.,1997; Cretaux et al., 2002; Moore and Wang, 2003]. Otheranalysts have used only six-parameter transformations, forexample, Feigl et al. [1993], McClusky et al. [2000],Kreemer et al. [2000], van Dam et al. [2001], and, althoughnot explicitly stated, Blewitt et al. [2001], Blewitt andClarke [2003], and Gross et al. [2004] (D. Lavallee andG. Blewitt, personal communication, 2004). Many otherstudies do not indicate how many parameters were estimatedin the coordinate transformation process [e.g., Cretaux etal., 1998; Bouille et al., 2000; Larson and van Dam, 2000;Wahr et al., 2001; Brondeel and Willems, 2003]. Dong et al.[1998] examined the validity of estimating explicit trans-lations and scale factor but left the question unresolved. Wesuggest that including a scale factor parameter in thetransformation degrades the accuracy of the results if thereare unmodeled surface deformations present in the freenetwork polyhedra.[38] Heflin et al. [2002] used daily seven-parameter
transformations of fiducial-free GPS networks to estimategeocenter motion and variations in scale. Their time seriesof scale factor estimates for the most recent year of theiranalysis had a standard deviation of 0.3 ppb which theysuggested may be caused by errors in mismodeling oftropospheric delay and antenna phase center patterns (bothtransmitter and ground reception antennae). The standarddeviation of a single daily estimate of scale factor intro-
duced into the seven-parameter transformations of oursimulated coordinates is 0.1 ppb using the 37-stationtransformation network of Dong et al. [2002] and 0.06 ppbusing the 66-station network of Blewitt et al. [2001](Figure 4). These values are comparable to that of Heflinet al. [2002], and we suggest that unmodeled loading effectsof atmospheric pressure loading may have contributedsignificantly to the variation in scale seen in their study.[39] The most obvious way to prevent the site coordinates
and geocenter translations from being corrupted by surfaceloading effects is to not estimate a scale factor whentransforming from the CM to the CF frame. Is there a needto retain the estimation of a scale factor? The scale of thesystem is defined in the geodetic analyses of space geodeticobservations by defining values for GM and the velocity oflight; therefore there is no theoretical reason that a scalefactor needs to be estimated when transforming from theCM to the CF reference frame unless a scale factor has beenintroduced somewhere by the mismodeling (or not model-ing at all) of some real phenomena. Whether the definitionof scale within the analysis of each technique is consistentbetween techniques is an independent issue beyond thescope of this study.[40] An alternative approach is to correct for the surficial
deformations before computing the transformations, eitherat the observation level or by applying daily averagedvalues to the coordinates of each site in the daily polyhedra.In this case, the total of all loading effects must beconsidered, including atmospheric pressure loading, oceantide loading, ocean circulation variations, snow and waterloading, changes in glaciers etc. It will not suffice to use anumerical model derived from a spherical harmonic seriesbecause the daily variations in some of the loading sources(e.g., atmospheric pressure loading) often exceed the max-imum amplitude of such seasonal models (T. M. van Damand P. Tregoning, manuscript in preparation, 2005) (see alsoFigure 7). If the loading deformations are modeled in theCM frame, then both the surface deformation and transla-
Figure 5. RMS coordinate errors (N, E, U) from six-parameter transformations with different weightsapplied to the contribution of station heights. (a) Height not used at all; (b) same as horizontalcomponent; (c) height downweighted by a factor of 10; and (d) height downweighted by a factor of 100.
B03408 TREGONING AND VAN DAM: STATION HEIGHTS AND GEOCENTER MOTION
8 of 12
B03408

tion of the origin will be removed (to within the accuracy ofthe models).[41] Applying surface deformation corrections after the
transformations have been computed for regional networkswill not produce perfect results because it is likely that someof the deformation will have been absorbed by the transla-tion parameters. This could reduce the apparent correlationof the height variations and the modeled deformations.Subsequently applying the loading deformation, in particu-lar when regional transformation networks are used, canincrease the variance of height estimates, in particular atcoastal and island sites. Such increases have been attributedpreviously to errors in ocean tide loading models [Brondeeland Willems, 2003]. Dong et al. [2002] applied the correc-
tions for atmospheric pressure loading prior to computingthe transformations (D. Dong, personal communication,2004) and will therefore not have degraded the accuracyof the coordinate estimates in their study.[42] It is generally not stated in the literature in which
reference frame loading deformations have been computedin studies of atmospheric pressure loading, ocean tideloading, etc. [e.g., van Dam and Herring, 1994; van Damet al., 1994; Petrov and Boy, 2004]. It is most likely that thecalculations performed using the load Love numbers (orassociated tabulated values) of Farrell [1972] have beencomputed in the CE reference frame. Our tests show thatapplying the loading in the wrong reference frame (i.e.,correcting site coordinates in the CM frame with valuescomputed in the CE frame) removes the surface deforma-tions, leaving only the translation of the origin to beestimated in the transformation from the CM to the otherframe. Including a scale factor parameter will not affect theaccuracy of the transformation in this case, provided thatthe numerical models fully account for all loading effects.The omission of any of these effects (along with any errorsin the numerical models) will affect seven-parameter trans-formations in the same manner as outlined in section 4.
7. Conclusions
[43] The transformation of fiducial-free geodetic net-works computed in a CM reference frame into a surface-fixed CF frame can be problematic if deformation of thesurface by fluid loads has occurred but has not beenaccounted for prior to the transformation. There will alwaysbe such deformation, since the mass of the atmosphere andoceans are being redistributed continuously. When a seven-parameter transformation is employed, only a fictitiousnetwork of transformation sites evenly spread across thewhole of the Earth, including the oceans (but excludingAntarctica), is capable of separating the geocenter motiontranslations from the site-specific surficial deformations. Allrealistic geodetic transformation networks, and even asimulated 10� grid across all land surfaces, cause aliasingof the deformation into the translation parameters and, moresignificantly, into an erroneous estimate of a scale factor.This corrupts the resulting station coordinates and canintroduce height errors on certain days of up to 4 mm inglobal analyses and up to 10 mm in regional analyses.[44] When no scale factor is estimated the results of the
six-parameter transformations are much more accurate.There remains an RMS of �0.2 mm in all three sitecoordinate components but the process is able to recovercorrectly the geocenter translations between the CM and CFreference frames. This applies when the selected transfor-mation network ranges from as few as 30 global stationsthrough to a fictitious 10� evenly spaced grid. Weighting theheight and horizontal components equally or excluding theheights altogether in the transformations produce similarresults whereas downweighting the contribution of heightsreduces the accuracy of the estimated site coordinates.[45] Estimating a scale factor when transforming from the
CM to the CF reference frame results in the parameterabsorbing some of the real surficial deformations caused byloading phenomena. This has the unfortunate effect ofdegrading the subsequent station coordinates as well as
Figure 6. Deformation in the vertical component causedby atmospheric pressure loading on three different daysduring 2001.
B03408 TREGONING AND VAN DAM: STATION HEIGHTS AND GEOCENTER MOTION
9 of 12
B03408

the estimates of geocenter motion. Even when geocentermotion is to be derived from the ‘‘degree-1 deformationapproach’’ rather than the ‘‘network shift approach’’ thesame conclusion applies. This process relies on the assump-tion that the coordinate residuals represent solely thedegree-1 surface deformations and this will not be true ifa seven-parameter transformation has been used because thestation coordinates, in particular the heights, will have beencorrupted by the erroneous scale factor estimates.[46] In the case of regional networks, unmodeled surface
deformations can introduce considerable errors into thetransformation from the CM to the CF reference framebecause the deformations are absorbed into the geocentermotion estimates. The smaller the regional network, thegreater will be the error. Subsequently applying loadingdeformation corrections to site coordinates in the CF frameresults in coordinates with an RMS error about 6 times
Figure 7. Errors introduced by atmospheric pressure loading effects at (left) Maspalomas in the CanaryIslands and (right) Alice Springs in Australia when the six-parameter transformation from CM to CF isdone with a regional transformation network. (a) Atmospheric pressure loading signal (red); (b) heightestimates after the transformation to the CF frame from a regional (blue) and a global transformationnetwork (black, offset by 10 mm); (c) height time series from regional (blue) and global (black,offset by 10 mm) stabilization when the true ATML signal in the CF frame is subsequently removed;(d–f) geocenter translation errors from regional (blue) and global (black) transformations: X (Figure 7d),Y (Figure 7e), Z (Figure 7f).
Table 2. Mean RMS Errors of Station Heights and RMS of
Geocenter Errors From Transformations Using Global and
Regional Networks
Site
Regional Globala
N E U N E U
Europe Transformation NetworkKOSG 0.40 0.54 1.24 0.19 0.19 0.21WTZR 0.40 0.52 1.34 0.19 0.18 0.23MATE 0.47 0.51 1.13 0.21 0.18 0.22
Australasian Transformation NetworkTIDB 0.19 0.14 0.49 0.24 0.21 0.13PERT 0.23 0.21 0.61 0.30 0.16 0.12DAV1 0.66 0.15 0.54 0.29 0.10 0.18
aThe coordinate RMS listed here are from the solutions using thetransformation network of Blewitt et al. [2001].
B03408 TREGONING AND VAN DAM: STATION HEIGHTS AND GEOCENTER MOTION
10 of 12
B03408

greater than that resulting from transformations using aglobal transformation network. However, if the ‘‘regional’’transformation network is sufficiently large (such as theCTA TIGA-PP network spanning about 1/8th of the Earth)then the error introduced into station coordinates is compa-rable in horizontal coordinates to that of a global stabiliza-tion and only �2.5 times greater for the vertical component.To achieve accuracies from regional analyses that arecomparable to results from global analyses, surface defor-mations (such as atmospheric pressure loading, snow load-ing etc) must be modeled prior to transforming the networksinto the CF reference frame.[47] The conclusions reached in this study relate to trans-
forming coordinates from one reference frame to another andare not specific to any individual space-geodetic techniquesuch as SLR or GPS. There may or may not be differences inscale between techniques that may require scale factors to beestimated when combining techniques; however, this is aseparate issue entirely from that presented here. There aremany possible ways that scale errors could be introduced intoGPS analysis (e.g., errors in phase center models for trackingstations and satellite transmitters, different techniques used todefine the scale of the ITRF2000 reference coordinates). Weacknowledge that it may seem logical to compensate forthese effects by estimating a scale factor when transformingfrom the CM to the CF reference frame. However, it must berealized that, in doing so, one not only perhaps reducesscale effects but at the same time actually introduces scaleerrors if there are unmodeled surface loading effects present.In all cases when surface deformation effects caused by fluidload mass redistribution are present in fiducial-free networksin the CM frame, estimating a scale factor when transformingthe network into the CF reference frame will degradethe accuracy of the transformation.
[48] Acknowledgments. We thank K. Lambeck and D. Dong formany fruitful discussions on loading, reference frames, and geocentermotion and D. Lavallee and H. McQueen for constructive comments onan earlier version of this manuscript. T. Herring, S. Owen, and ananonymous reviewer provided helpful review comments. This study wasfunded in part by Fonds Nationale de la Recherche de Luxembourg grantFNR/03/MA06/06.
ReferencesBianco, G., R. Devoti, M. Fermi, V. Luceri, P. Rutigliano, and C. Sciarretta(1998), A contribution in the estimation of tectonic motion in crucialareas: The CGS96 SLR solution, Tectonophysics, 294, 225–236.
Blewitt, G. (2003), Self-consistency in reference frames, geocenter defini-tion, and surface loading of the solid Earth, J. Geophys. Res., 108(B2),2103, doi:10.1029/2002JB002082.
Blewitt, G., and P. Clarke (2003), Inversion of Earth’s changing shape toweigh sea level in static equilibrium with surface mass redistribution,J. Geophys. Res., 108(B6), 2311, doi:10.1029/2002JB002290.
Blewitt, G., M. B. Heflin, F. H. Webb, U. J. Lindqwister, and R. P. Malla(1992), Global coordinates with centimeter accuracy in the internationalterrestrial reference frame using GPS, Geophys. Res. Lett., 19, 853–856.
Blewitt, G., D. Lavallee, P. Clarke, and K. Nurutdinov (2001), A newglobal mode of Earth deformation: Seasonal cycle detected, Science,294, 2342–2345.
Bouille, F., A. Cazenave, J. M. Lemoine, and J. F. Cretaux (2000), Geo-centre motion from the DORIS space system and laser data to the Lageossatellites: Comparison with surface loading data, Geophys. J. Int., 143,71–82.
Brondeel, M., and T. Willems (2003), Atmospheric pressure loading in GPSheight estimates, Adv. Space Res., 31, 1959–1964.
Chen, J. L., C. R. Wilson, R. J. Eanes, and R. S. Nerem (1999), Geophy-sical interpretation of observed geocenter variations, J. Geophys. Res.,104, 2683–2690.
Cretaux, J.-F., L. Soudarin, A. Cazenave, and F. Bouille (1998), Present-daytectonic plate motions and crustal deformation from the DORIS spacesystem, J. Geophys. Res., 103, 30,167–30,181.
Cretaux, J., L. Soudarin, F. J. M. Davidson, M. Gennero, M. Berge-Nguyen, and A. Cazenave (2002), Seasonal and interannual geocentermotion from SLR and DORIS measurements: Comparison with surfaceloading data, J. Geophys. Res., 107(B12), 2374, doi:10.1029/2002JB001820.
Davies, P., and G. Blewitt (2000), Methodology for global geodetic timeseries estimation: A new tool for geodynamics, J. Geophys. Res., 105,11,083–11,100.
Dixon, T. H., A. Mao, M. Bursik, M. Heflin, J. Langbein, R. Stein, andF. Webb (1997), Continuous monitoring of surface deformation at LongValley Caldera, California, with GPS, J. Geophys. Res., 102, 12,017–12,034.
Dong, D., J. Dickey, Y. Chao, and M. Cheng (1997), Geocenter variationscaused by atmosphere, ocean and surface ground water, Geophys. Res.Lett., 25, 1867–1870.
Dong, D., T. A. Herring, and R. W. King (1998), Estimating regionaldeformation from a combination of space and terrestrial geodetic data,J. Geod., 72, 200–214.
Dong, D., P. Fang, Y. Bock, M. K. Cheng, and S. Miyazaki (2002), Anat-omy of apparent seasonal variations from GPS-derived site position timeseries, J. Geophys. Res., 107(B4), 2075, doi:10.1029/2001JB000573.
Dong, D., T. Yunck, and M. Heflin (2003), Origin of the InternationalTerrestrial Reference Frame, J. Geophys. Res., 108(B4), 2200,doi:10.1029/2002JB002035.
Farrell, W. E. (1972), Deformation of the Earth by surface loads, Rev.Geophys., 10, 761–797.
Feigl, K. L., et al. (1993), Space geodetic measurements of crustal defor-mation in central and southern California, 1984–1992, J. Geophys. Res.,98, 21,677–21,712.
Freymueller, J. T., M. H. Murray, P. Segall, and D. Castillo (1999), Kine-matics of the Pacific-North America plate boundary zone, northern Ca-lifornia, J. Geophys. Res., 104, 7419–7441.
Gross, R. S., G. Blewitt, P. J. Clarke, and D. Lavallee (2004), Degree-2harmonics of the Earth’s mass load estimated from GPS and Earth rota-tion data, Geophys. Res. Lett., 31, L07601, doi:10.1029/2004GL019589.
Heflin, M. B., et al. (1992), Global geodesy using GPS without fiducialsites, Geophys. Res. Lett., 19, 131–134.
Heflin, M. B., D. Argus, D. Jefferson, F. Webb, and J. Zumberge (2002),Comparison of a GPS-defined global reference frame with ITRF2000,GPS Solutions, 6, 71–75.
Herring, T. A., D. Dong, and R. W. King (1991), Sub-milliarcsecond de-termination of pole position using Global Positioning System data, Geo-phys. Res. Lett., 18, 1893–1896.
Kreemer, C., J. Haines, W. E. Holt, G. Blewitt, and D. Lavallee (2000), Onthe determination of a global strain rate model, Earth Planet. Space, 52,765–770.
Larson, K. M., and T. van Dam (2000), Measuring postglacial rebound withGPS and absolute gravity, Geophys. Res. Lett., 27, 3925–3928.
Lavallee, D., and G. Blewitt (2002), Degree-1 Earth deformation from verylong baseline interferometry measurements, Geophys. Res. Lett., 29(20),1967, doi:10.1029/2002GL015883.
Mao, A., C. Harrison, and T. Dixon (1999), Noise in GPS coordinate timeseries, J. Geophys. Res., 104, 2797–2816.
McClusky, S., et al. (2000), Global Position System constraints on platekinematics and dynamics in the eastern Mediterranean and Caucasus,J. Geophys. Res., 105, 5695–5719.
Moore, P., and J. Wang (2003), Geocenter variation from laser tracking ofLageos1/2 and loading data, Adv. Space Res., 31, 1927–1933.
Noomen, R., B. A. C. Ambrosius, and K. F. Wakker (1993), Crustal mo-tions in the Mediterranean Region determined from laser ranging toLAGEOS, in Contributions of Space Geodesy to Geodynamics:Crustal Dynamics, Geodyn. Ser., vol. 23, edited by D. E. Smith andD. L. Turcotte, pp. 331–346, AGU, Washington, D. C.
Petrov, L., and J. Boy (2004), Study of the atmospheric pressure loadingsignal in very long baseline interferometry observations, J. Geophys.Res., 109, B03405, doi:10.1029/2003JB002500.
Schillak, S., and E. Wnuk (2003), The SLR stations coordinates determinedfrom monthly arcs of LAGEOS-1 and LAGEOS-2 laser ranging in1999–2001, Adv. Space Res., 31, 1935–1940.
Schwintzer, P., et al. (1997), Long-wavelength global gravity field models:GRIM4-S4, GRIM4-C4, J. Geod., 71, 189–208.
Tregoning, P., P. J. Morgan, and R. Coleman (2004), The effect of receiverfirmware upgrades on GPS vertical time series, Cah. Cent. Eur. Geodyn.Seismol., 23, 37–46.
van Dam, T. M., and T. A. Herring (1994), Detection of atmosphericpressure loading using very long baseline interferometry measurements,J. Geophys. Res., 99, 4505–4517.
B03408 TREGONING AND VAN DAM: STATION HEIGHTS AND GEOCENTER MOTION
11 of 12
B03408
van Dam, T. M., G. Blewitt, and M. B. Heflin (1994), Atmospheric pressureloading effects on Global Positioning System coordinate determinations,J. Geophys. Res., 99, 23,939–23,950.
van Dam, T. M., J. Wahr, P. C. D. Milly, A. B. Shmakin, G. Blewitt,D. Lavallee, and K. Larson (2001), Crustal displacements due tocontinental water loading, Geophys. Res. Lett., 28, 651–654.
van Dam, T., H.-P. Plag, O. Francis, and P. Gegout (2003), GGFC SpecialBureau for Loading: Current status and Plans, in Proceedings of the IERSWorkshop on Combination Research and Global Geophysical Fluids,Bavarian Academy of Sciences, Munich, Germany, 18–21 November2002, IERS Tech. Note 30, edited by B. Richter, W. Schwegmann, andW. R. Dick, pp. 180–198, Int. Earth Rotation Serv., Paris.
Wahr, J., T. van Dam, K. Larson, and O. Francis (2001), Geodetic measure-ments in Greenland and their implications, J. Geophys. Res., 106,16,567–16,581.
Watkins, M. M., and R. J. Eanes (1997), Observations of tidally coherentdiurnal and semidiurnal variations in the geocenter, Geophys. Res. Lett.,24, 2231–2234.
Willis, P., and M. B. Heflin (2004), External validation of the GRACEGGM01C gravity field using GPS and DORIS positioning results, Geo-phys. Res. Lett., 31, L13616, doi:10.1029/2004GL020038.
Wu, X., D. F. Argus, M. B. Heflin, E. R. Ivins, and F. H. Webb (2002), Sitedistribution and aliasing effects in the inversion for load coefficients andgeocenter motion from GPS data, Geophys. Res. Lett., 29(24), 2210,doi:10.1029/2002GL016324.
Wu, X., M. B. Heflin, E. R. Ivins, D. F. Argus, and F. H. Webb (2003),Large-scale global surface mass variations inferred from GPS measure-ments of load-induced deformation, Geophys. Res. Lett., 30(14), 1742,doi:10.1029/2003GL017546.
Zumberge, J. F., M. B. Heflin, D. C. Jefferson, M. M. Watkins, and F. H.Webb (1997), Precise point positioning for the efficient and robustanalysis of GPS data from large networks, J. Geophys. Res., 102,5005–5017.
�����������������������P. Tregoning, Research School of Earth Sciences, Australian National
University, Mills Road, Canberra, ACT 0200, Australia. ([email protected])T. van Dam, European Center for Geodynamics and Seismology, Rue
Josy Welter, 19, Walferdange L-7256, Luxembourg. ([email protected])
B03408 TREGONING AND VAN DAM: STATION HEIGHTS AND GEOCENTER MOTION
12 of 12
B03408


![Atmospheric volcanic loading derived from bipolar ice ...climate.envsci.rutgers.edu/pdf/GaoIceCores2006JD007461.pdf[2] Understanding natural causes of climate change is vital to evaluate](https://static.fdocuments.us/doc/165x107/5f7ba2e46ec89e0d984de8ef/atmospheric-volcanic-loading-derived-from-bipolar-ice-2-understanding-natural.jpg)