Effects of alcohol and practice on choice reaction time · Perception & Psychophysics 1987, 42 (5),...
11
Perception & Psychophysics 1987, 42 (5), 465-475 Effects of alcohol and practice on choice reaction time E. A. MAYLOR and P. M. A. RABBITI' University of Manchester, Manchester, England Forty subjects participated in a four-choice reaction time experiment in which they received alcohol (1 ml/kg body weight) in one session and no alcohol in another on consecutive days (the order being counterbalanced). Fifty practice trials and then 2,000 experimental trials were given in each session. Subjects were slower, more variable, and less accurate overall with alcohol than without. They were also slower and more variable in the first than in the second session. By com- bining the data across subjects to produce speed-error tradeofffunctions, it appears that practice has little effect whereas alcohol has a substantial effect; responses made within 600 msec of stimu- lus presentation are more likely to be erroneous with alcohol than without. In addition, the num- ber of consecutive errors was increased by alcohol. The results are interpreted within a model in which it is suggested that the primary effect of alcohol upon performance in speeded tasks is to decrease the rate of accumulation of evidence. Although there have been many investigations into the effects of alcohol on reaction time, few definite conclu- sions can be drawn from them. For example, Drew, Colquhoun, and Long (1959) pointed out the methodo- logical deficiency in several papers of failing to take ac- count of practice effects. In a review of work published between 1940 and 1960, Carpenter (1962) concluded that the quality and sophistication of most experiments on al- cohol and reaction time were very low. While the majority of recent results indicate that "al- cohol causes a slowing of reaction time in choice reaction- time tasks" (Schneider, Dumais, & Shiffrin, 1984, p. 15), exceptions include the results of Wilkinson and Colqu- houn (1968) and Shillito, King, and Cameron (1974). The former study investigated the effect of alcohol on Leonard's (1959) five-ehoice serial self-paced reaction time task. This uses five lamps, arranged in a pentagon, each adjacent to one of five associated metal contacts. Sub- jects were required to touch each contact as soon as pos- sible after the lamp next to it was lit. A correct response switched off the lamp and immediately activated the next signal in a pseudorandom sequence. There was no effect on speed and gaps (the number of responses made in a given time and response times more than 1.5 see, respec- tively), but more errors were made with alcohol, partic- ularly toward the end of a session. Shillito et al. (1974) also found no effect on reaction time, and surprisingly obtained the lowest error rate, not for the placebo, but for a low dose of alcohol. This researchwas supported by the Medical Research Councilof Great Britain (Grant G8221479). The authors are grateful to Dorothy Bishop for writing the computerprogramsand Robert Proctor for helpfulcom- ments on an earlier version of the paper. Requests for reprints should be addressed to Elizabeth Maylorat the Age and Cognitive Performance ResearchCentre, University of Manchester, Oxford Road, Manchester M13 9PL, England. However, in these and other studies (Huntley, 1972, 1974; Tharp, Rundell, Lester, & Williams, 1974), speed and error measures have been discussed independentlyand few have acknowledged the possibility of speed-error tradeoffs (SETOs), that is, the ability to increase speed at the expense of accuracy and vice versa. Thus, varia- tions in response criteria can produce performance changes quite apart from the effects of alcohol. Jennings, Wood, and Lawrence (1976) investigated this by gener- ating speed-error tradeoff functions (SETOFs) for several doses of alcohol. An auditory reaction time task with a deadline procedure was used, in which a response had to be made prior to the onset of a visual signal. The de- lay of the deadline signal varied between 175 and 375 msec in steps of 50 msec but was constant over a block of trials. From the overall results, it was not possi- ble to separate criterion changes from real changes in ef- ficiency as both mean correct reaction time and propor- tion correct decreased with increasing amount of alcohol. Thus, SETOFs for each dose were generated in the fol- lowing way. For each deadline condition, mean reaction time was calculated and an accuracy measure was derived from a transformation of the proportion correct. A linear regression was then carried out producing a slope and intercept for each alcohol condition. There was no effect of alcohol on the intercept, but there was a decrease in slope with increasing alcohol. For all doses (.33 to 1.33 ml of 95% ethyl alcohol per kilogram of body weight), alcohol impaired performance by decreasing the rate of improvement in accuracy with response time. This could be attributed to impaired perceptual analysis of sig- nals (see Broadbent, 1971; Fisher, 1984; Rabbitt, 1979), so that either response time is increased to maintain a sta- ble error rate or speed is unaffected while more errors are made. The aim of the present experiment was to produce SETOFs with and without alcohol, using a self-paced 465 Copyright 1987 Psychonomic Society, Inc.
Transcript of Effects of alcohol and practice on choice reaction time · Perception & Psychophysics 1987, 42 (5),...

Perception & Psychophysics1987, 42 (5), 465-475
Effects of alcohol and practice onchoice reaction time
E. A. MAYLOR and P. M. A. RABBITI'University of Manchester, Manchester, England
Forty subjects participated in a four-choice reaction time experiment in which they receivedalcohol (1 ml/kg body weight) in one session and no alcohol in another on consecutive days (theorder being counterbalanced). Fifty practice trials and then 2,000 experimental trials were givenin each session. Subjects were slower, more variable, and less accurate overall with alcohol thanwithout. They were also slower and more variable in the first than in the second session. By combining the data across subjects to produce speed-error tradeoff functions, it appears that practicehas little effect whereas alcohol has a substantial effect; responses made within 600 msec of stimulus presentation are more likely to be erroneous with alcohol than without. In addition, the number of consecutive errors was increased by alcohol. The results are interpreted within a modelin which it is suggested that the primary effect of alcohol upon performance in speeded tasksis to decrease the rate of accumulation of evidence.
Although there have been many investigations into theeffects of alcohol on reaction time, few definite conclusions can be drawn from them. For example, Drew,Colquhoun, and Long (1959) pointed out the methodological deficiency in several papers of failing to take account of practice effects. In a review of work publishedbetween 1940 and 1960, Carpenter (1962) concluded thatthe quality and sophistication of most experiments on alcohol and reaction time were very low.
While the majority of recent results indicate that "alcohol causes a slowing of reaction time in choice reactiontime tasks" (Schneider, Dumais, & Shiffrin, 1984, p. 15),exceptions include the results of Wilkinson and Colquhoun (1968) and Shillito, King, and Cameron (1974). Theformer study investigated the effect of alcohol onLeonard's (1959) five-ehoice serial self-paced reactiontime task. This uses five lamps, arranged in a pentagon,each adjacent to one of five associatedmetal contacts. Subjects were required to touch each contact as soon as possible after the lamp next to it was lit. A correct responseswitched off the lamp and immediately activated the nextsignal in a pseudorandom sequence. There was no effecton speed and gaps (the number of responses made in agiven time and response times more than 1.5 see, respectively), but more errors were made with alcohol, particularly toward the end of a session. Shillito et al. (1974)also found no effect on reaction time, and surprisinglyobtained the lowest error rate, not for the placebo, butfor a low dose of alcohol.
Thisresearchwassupported by the Medical Research Councilof GreatBritain(GrantG8221479).The authorsare grateful to DorothyBishopfor writingthe computerprogramsand RobertProctor for helpfulcomments on an earlier version of the paper. Requests for reprints shouldbe addressed to Elizabeth Maylorat the Age and Cognitive PerformanceResearchCentre, University of Manchester, OxfordRoad, ManchesterM13 9PL, England.
However, in these and other studies (Huntley, 1972,1974; Tharp, Rundell, Lester, & Williams, 1974), speedand error measures have been discussed independentlyandfew have acknowledged the possibility of speed-errortradeoffs (SETOs), that is, the ability to increase speedat the expense of accuracy and vice versa. Thus, variations in response criteria can produce performancechanges quite apart from the effects of alcohol. Jennings,Wood, and Lawrence (1976) investigated this by generating speed-error tradeoff functions (SETOFs) for severaldoses of alcohol. An auditory reaction time task with adeadline procedure was used, in which a response hadto be made prior to the onset of a visual signal. The delay of the deadline signal varied between 175 and375 msec in steps of 50 msec but was constant over ablock of trials. From the overall results, it was not possible to separate criterion changes from real changes in efficiency as both mean correct reaction time and proportion correct decreased with increasing amount ofalcohol.Thus, SETOFs for each dose were generated in the following way. For each deadline condition, mean reactiontime was calculated and an accuracy measure was derivedfrom a transformation of the proportion correct. A linearregression was then carried out producing a slope andintercept for each alcohol condition. There was no effectof alcohol on the intercept, but there was a decrease inslope with increasing alcohol. For all doses (.33 to1.33 ml of 95% ethyl alcohol per kilogram of bodyweight), alcohol impaired performance by decreasing therate of improvement in accuracy with response time. Thiscould be attributed to impaired perceptual analysis of signals (see Broadbent, 1971; Fisher, 1984; Rabbitt, 1979),so that either response time is increased to maintain a stable error rate or speed is unaffected while more errorsare made.
The aim of the present experiment was to produceSETOFs with and without alcohol, using a self-paced
465 Copyright 1987 Psychonomic Society, Inc.
466 MAYLOR AND RABBITT
rather than an externally paced task, allowing the subjectto exercise control over timing. Rabbitt (1979) suggestedthat in order to control performance in a self-paced choicereaction time task, subjects must (1) know when errorsare made, (2) be able to vary response speed and controlit in order to "track" their fastest, safe reaction time band,and (3) know when they make unnecessarily slowresponses. For example, elderly subjects have slowermean reaction times thanyoung subjects mainly as a resultof impairments in the second and third aspects of control. Large numbers of trials were presented in the presentexperiment in an attempt to produce reliable SETOFs andto study possible interactions between alcohol and practice. In addition, from a detailed analysis of responses immediately before and after errors, the effect of alcoholon the three control mechanisms could be investigated.
Designs in which subjects are tested first without alcohol and then with alcohol are economical in that the experiment can be completed in one session, but highly questionable because of order effects that are difficult to assess.One way to control for these is to compare the performance ofa no-alcohol group with that of an alcohol group.However, as noted by Huntley (1973), "when the twogroup design is used and performance on the task of interest is highly variable, because of the masking effectsof individual differences ... very strong treatment effectsare frequently necessary in order to obtain statistically significant differences" (p. 153). The present study therefore employed a design in which half of the subjectsreceived no alcohol in the first session and alcohol in thesecond; the order for the other subjects was reversed-;
MEmOD
SubjectsThirty-six male and 4 female volunteers were recruited through
advertisements placed around the University of Manchester. Theywere mostly undergraduates aged between 18 and 37 years (mean= 22.6), and their weights ranged from 55 to 84 kg (mean = 69.1).Each subject participated in two sessions, each I h 20 min long,at the sarne time on consecutive days. The present experiment wasthe third of three carried out during the session. The subjects werepaid £6 for participating in the study.
Apparatus and StimuliThe subjects were given alcohol in the form of vodka (37.5 %
alcohol by volume) mixed with concentrated orange juice andwater(see Procedure for exact quantities). A Lion Alcolmeter S-D2(breathalyzer) obtained from Lion Laboratories Ltd., Barry, UK,was used to estimate blood alcohol concentration to the nearest 5 mgalcohol/IOO ml blood.
An Apple Ile microcomputer was used to control the experimentand record responses using a millisecond clock by Mountain Hardware. The stimuli appearedin the center of a Hitachi 200-mm monitor (white on gray) and were the characters A, B, C, D, each measuring approximately 2.5x3.5 mm. The response keys were "Z","X", ",", and "." of the computer keyboard. (This particularletter-identification taskhas been used in other studies in our laboratories, for example, in the investigation of the effects of age byRabbitt & Goward, 1986.)
Design and ProcedureThe subjects were asked to drink no alcohol on the previous even
ing and to eat nothing for at least 2 h before each session. Excessive drinkers and teetotalers were excluded from the study following completion of a personal-details questionnaire that includedquestions on age, weight, number of cigarettes smoked per day,current medication, serious illnesses, and general drinking habits.In addition, the subjects signed a form agreeing to take part in theexperiment and to refrain from driving, cycling, and handling dangerous machinery for 24 h. The subjects also agreed to inform theexperimenter of any side effects experienced as a result of thealcohol.
Each session began with the subject's drinking 500 ml as quicklyas possible. For the "alcohol" session, this was made up of 150 mlconcentrated orange juice, 100/37.5 ml vodka (that is, I ml alcohol) per kilogram of body weight, and water. For the other session, 150 ml orange juice was mixed with 350 ml water and a fewdrops of vodka were floated on the top of the drink. The order ofthealcohol and no-alcohol sessions was counterbalanced across subjects. The nonalcoholic drink was consumed in an average of4.25 min (SD = 1.26); the alcoholic drink was consumed in6.63 min (SD = 2.74). The subject was given no information concerning the contents of the drink. (Most subjects were probablyaware of the fact that one drink contained more alcohol than theother. However, it is unlikely that the main results of interest werein any way influenced by this knowledge.) A breath reading wastaken 20 min after completion of the drink, and the present experiment began 5 min after that. (Two other unrelated experiments werecarried out before the present one and in thesamesession-see Maylor & Rabbitt, 1987.) At the end of the session (SO min), a finalbreath reading was taken.
The subjects were tested individually. Ten blocks of trials of thechoice reaction time task were given in each session. There were250 trials in Block I and 200 trials in each of Blocks 2-10. Thefirst 50 trials in Block I were regarded as practice and were notincluded in the analysis. The subject was shown the four possiblestimuli (A, B, C, and D) and the corresponding keys ("Z", "X"," , ", and ".") to be pressed by the index and middle fingers ofthe two hands. To begin each block, the subject was required to
. press the spacebar. This was followed by a short delay (1.5 sec)before the presentation of the first stimulus (A, B, C, or D). Thesubject was required to press the correct key as quickly as possible. This immediately removed the stimulus from the screen. Following a delay of500 msec, thenext stimulus appeared. The stimuliwere chosen randomly with the restriction that each stimulus bedifferent from the previous one. If the subject pressed two keyswithin a short interval (e.g., an error response followed immediately by a correction response) or pressed a key other than one ofthe four specified responses, the following instruction appeared onthe screen: "Make sure your fingers are on the right keys. Press•Spacebar' to continue." In addition, if an anticipatory responsewas made (less than 150 msec after stimulus presentation), the trialwas immediately aborted and excluded from the analysis. The subject was allowed up to approximately 2 min to rest between blocks.
RESULTS AND DISCUSSION
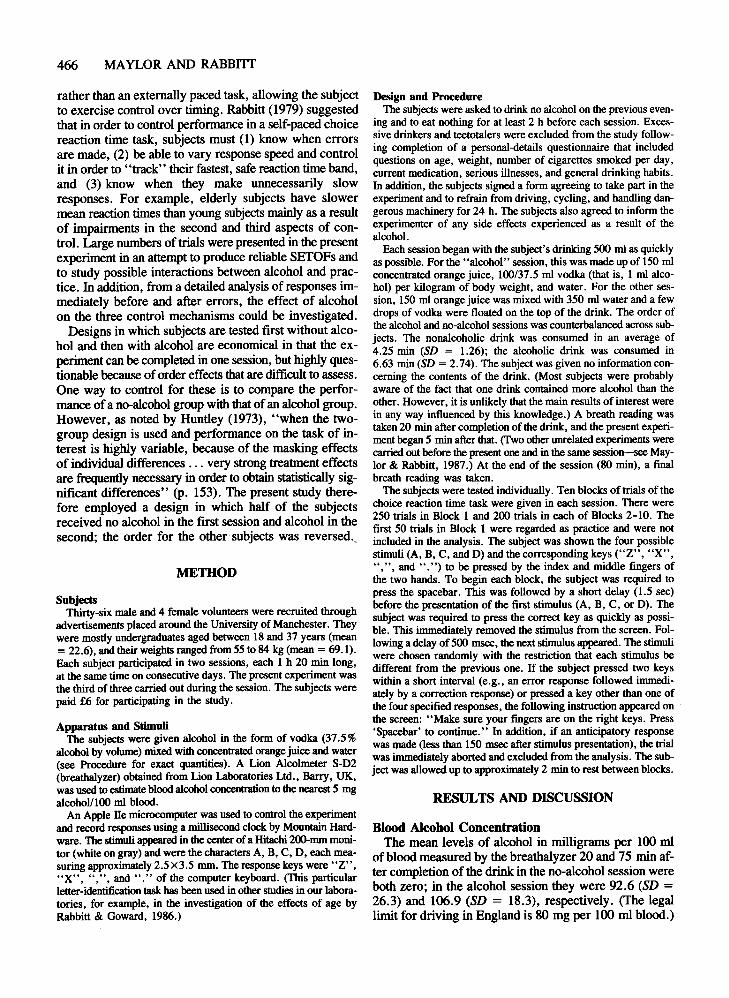
Blood Alcohol ConcentrationThe mean levels of alcohol in milligrams per 100 ml
of blood measured by the breathalyzer 20 and 75 min after completion of the drink in the no-alcohol session wereboth zero; in the alcohol session they were 92.6 (SD =26.3) and 106.9 (SD = 18.3), respectively. (The legallimit for driving in England is 80 mg per 100 ml blood.)

ALCOHOL, PRACTICE, AND REACTION TIME 467
It should be noted that the first reading was taken whenblood alcohol would have been rising and the second wastaken when it was falling, so that the mean peak bloodalcohol concentration would have been slightly higher thaneither of these readings (see Drew et al., 1959).
Overall MeansThe data from 3 subjects had to be omitted from the
analysis. One had previously participated in a very similar choice reaction time experiment, another was unableto remain reasonably alert during the alcohol session, andthe third misunderstood the instructions and did not attempt to respond to each stimulus as quickly as possible.In addition, two blocks of trials were lost from the alcohol session for 1 subject, who abandoned the experimentfeeling unwell.
The overall results are presented in Table 1. Three-wayanalyses of variance were conducted on the mean responsetimes, standard deviations, and medians, with sessionorder (2 levels: no-alcohol-alcohol and alcohol-noalcohol) as the between-subjects factor, and alcohol (2levels) and response accuracy (2 levels: correct and error) as within-subjects factors.
For the mean response times, there was no effect ofsession order [F(I,35) = 1.79, p > .1], but there weresignificant effects of alcohol [F(1,35) = 28.63,p < .01]and response accuracy [F(1 ,35) = 43.77, p < .01]. Theonly significant interaction was between session order andalcohol [F(I,35) = 29.56, p < .01]. This can be bestunderstood by taking as an example the means for correct responses only for the no-alcohol-alcohol group (555552 msec) and the alcohol-no-alcohol group (571488 msec). Thus, there is an average increase in meancorrect reaction time due to alcohol of 40 msec and anaverage decrease from the first to the second session of43 msec. The absence of an overall session order effectindicates that alcohol does not interact with practice, thatis, there is no particular overall advantage in receivingalcohol in the first or second session.
For standard deviations, there was no effect of sessionorder (F < 1), but there were significant effects of alcohol [F(1,35) = 10.21, p < .01] and response accuracy[F(1,35) = 5.26, p < .05]. From Table 1 it can be seenthat alcohol increased variability, while correct responseswere more variable than errors. Again, there was a ses-
Table 1Overall Means
No Alcohol Alcohol
CorrectMean RT (msec) 522 562SD (msec) 128 149Median RT (msec) 503 540
ErrorMean RT (msec) 487 520SD (msec) 116 136Median RT (msec) 469 502
Error Rate (%) 4.14 4.97
sion order X alcohol interaction [F(1 ,35) = 17.57, p <.01]. There was an overall decrease in standard deviation of 27 msec from the first to the second session.
When median reaction times were analyzed, rather thanmeans, an identical pattern of results was obtained, thatis, significant effects of alcohol [F(I,35) = 40.28, p <.01] and response accuracy [F(1,35) = 52.45, p < .01]with an interaction between sesson order and alcohol[F(1,35) = 32.94, p < .01]. The overall decrease in median response time from the first to the second sessionwas 32 msec.
The error rates were subjected to a two-way mixed analysis of variance with session order and alcohol as factors. There was no effect of session order [F(1,35) =1.18, p > .1] but there was a significant effect of alcohol [F(I,35) = 8.18, p < .01] and no interaction(F < 1).
To summarize, responses are slower, more variable (butsee below), and less accurate with alcohol, and are fasterand less variable in the second than in the first session.
There is normally a monotonic relationship betweenmean correct response time and variability of correctresponses. It is therefore important to ask if the increasein standard deviation with alcohol is more than that whichis usually associated with slower responses. This was investigated by performing linear regressions on mean correct response times against standard deviations separatelyfor no alcohol and alcohol. First, the correlation coefficients were .814 and .836, respectively, confirming thatthere is a strong tendency for standard deviation to increase linearly with mean reaction time. Second, the linearregression equations were very similar, with slopes of.483 and .449 and intercepts of -124.2 and -112.8 msecfor no alcohol and alcohol, respectively. From this analysis it can be concluded that there is no evidence that alcohol increases variability any more than would be expected for an increase in mean response time.
Changes in Performance Within a SessionIt is possible that the effect of alcohol is more severe
at the end of a long session than at the beginning (see,e.g., Gustafson, 1986; Wilkinson & Colquhoun, 1968)..To investigate this, mean reaction times for correctresponses only and the error rates were analyzed in twoseparate analyses of variance with session order as thebetween-subjects factor and alcohol and block (10 levels)as within-subjects factors (36 subjects). The overall meansare presented in Figures 1 and 2.
For response times, there was no effect of session order(F < 1), but there were highly significant effects of alcohol [F(I,34) = 32.33, p < .01] and block [F(9,306)= 5.42, p < .01]. There were interactions between session order and alcohol [F(1,34) = 44.18, p < .01] andbetween session order, alcohol, and block [F(9,306) =4.63, p < .01].
The effect of alcohol and the. session order X alcoholinteraction have already been discussed. It can be seenfrom Figure 1 that, in general, response time decreases

468 MAYLOR AND RABBITT
600 SESSION 1 SESSION 2
580
~560E'-"l-II: 540..u
"..;; 520ucIV
;500
480
\\\\\\\\\\
• Alcohol
• No Alcohol
2 3 4 5 6 7 8 9 10 2 3 4 5 6 7 8 9 10
Block number
Figure 1. Mean correct response times as a function of block for Sessions 1 and 2, with andwithout alcohol.
over the session (the block effect). This is more markedon the first than on the second session, and, indeed,without alcohol on the second session, there is a slightincrease leading to the three-way interaction. There is certainly no evidence from the mean correct response timesto support the suggestion that the effect of alcohol isgreater toward the end of a session, although it has to beremembered that blood alcohol concentration would notremain constant throughout an alcohol session (see Drewet al., 1959).
For errors, there were significant effects of alcohol[F(l,34) = 8.93, p < .01] and block [F(9,306) = 9.14,p < .01], with no interactions. Figure 2 illustrates thegeneral increase in error rate across each session, the ef-
feet being similar with and without alcohol. This againindicates that the effect of alcohol is no more severe atthe end than at the beginning of a 4O-min session.
Speed-Error Tradeoff FunctionsThe above analysis does raise the question of SETOFs.
Thus, the general change in performance from the 1st tothe 10th block in a session (increased speed and errors)may be merely a movement along the SETOF. That is,subjects may operate in a different region of the SETOFwithout a change in actual performance efficiency impliedby an alteration of the function itself. It is clear that thiscannot be the case for the effect of alcohol as subjectsare both slower and less accurate overall under alcohol.
7 SESSION 1 SESSION 2
6\
\\\
\
5\\
\\
2 411/I- ............CII:
II: 30II:II:11/ 2
• No Alcohol
• Alcohol
, , , , , , , , , ,0 2 3 4 5 6 7 8 9 10 1 2 3 4 5 8 7 8 9 10
BLOCK NUMBER
Figure 2. Error rates as a function of block for Sessions 1 and 2, with and without alcohol.

ALCOHOL, PRACTICE, AND REACTION TIME 469
• Alcohol SESSION 2
o No Alcohol SESSION 1
'00 --- --la)
90
80
70
80
III-•..e so..III+..U 40•....0u< 30
•..0.... 20III
10
0520 800 sao 840 820 1000+
Ib) '00 -------
80
80
10
80
RT(msec)
SESSION 1
SESSION 2
III... 50e..III+.. 40Ue..oU 30
~..o::: 20
1&1
'0
200 210 520
• Alcohol
ONo Alcohol
100
RT(msec)
180 840
Figure 3. Speed-error tradeolT functions witb and witbout alcobol. (a) N~alcobol-alcobol group, 19 subjects.(b) A1cobol-n~alcobol group, 18 subjects.

470 MAYLOR AND RABBITT
The essential question here is how the SETOF is affected.To investigate this, functions were produced for each subject with and without alcohol by calculating the proportions of errors to total responses in reaction time bandsof 40 msec, However, they were inconclusive, being farfrom smooth because of the very small number of errorsand correct responses at the extreme ends of the function.The data were therefore combined across subjects toproduce four SETOFs, that is, for the no-alcohol-alcoholorder and alcohol-no-alcohol order, with and withoutalcohol.'
As can be seen from Figure 3, there was little effectof session order, that is, SETOFs do not change their position within the limits of practice given in this experiment (see also Rabbitt, in press). This is particularly striking when, for example, the mean correct reaction timesfor the four conditions are considered. (These were discussed earlier in relation to the session order X alcoholinteractions.) For no alcohol and alcohol in Figure 3a,the means are 555 and 552 msec, respectively; in Fig- .ure 3b, the means are 488 and 571 msec, respectively.The SETOFs for the same condition (either no alcoholor alcohol) are thus very much more alike than wouldperhaps have been expected on the basis of the meanresponse times alone. Therefore, the data from all the subjects were combined to produce the overall SETOFs
shown in Figure 4. First, it can be seen that the functionsare very similar between 600 and 920 msec. For responsesless than 600 msec, the SETOF for no alcohol is generally below that for alcohol. Thus, a response made within600 msec of stimulus presentation is more likely to be anerror with alcohol than without. From Figure 4 it appearsthat, compared with no alcohol, the point of the lowesterror rate for alcohol is further to the right along the reaction time axis. The overall reaction time distributions forcorrect and error responses are presented in Figures 5 and6, respectively. It should be remembered that the areasbeneath the graphs are not equal (particularly for Figure 6)since alcohol increases the number of errors by 20% anddecreases the number of correct responses by 0.9%.
Possible ModelsWithin models of choice reaction time such as, for ex
ample, Fisher (1984), these effects of alcohol are most parsimoniously explained in terms of a decrease in the rateof accumulation of evidence (see Figure 7). This wouldshow up as a shift in the intercept of the SETOF to theright along the reaction time axis. Both correct and errorresponses with alcohol take longer and are more variablethan without alcohol. Responses made before the time required for a correct decision are more likely to be errorsbecause they are based on insufficient evidence. If the ac-
• Alcohol
o No Alcohol
100
90
80
70
60
~....•..0 50....w+..U 40•....0CJ
30<•..0.. 20..W
10
0200 260 360 440 520 600 680 760 840 920 1000+
RT (msec)
Figure 4. Speed-error tradeoff functions with and without alcohol (37 subjects).

12000
ALCOHOL, PRACTICE, AND REACTION TIME 471
• -.Icohol
o No Alcohol
10000
8000
»oc::•;'eooo•..I&.
4000
2000
520 eoo e80 780
,I
,'pIIII
--~::e:~'
lI40
RT(msec)
Figure 5. Reaction time distributions for correct responses.
600
• Alcohol500
0 No Alcohol
400
>-0c::•:I 300cr•..
I&.
200
100
RTlmsec)
Figure 6. Reaction time distributions for error responses.
1120
.,..'
1000+

472 MAYLOR AND RABBITT
EvidenceAccumulation ofevidence withoutalcohol
Accumulation ofevidence withalcohol
TimeII
~I
(Variability),,-
- -/7- - /.../- -I /')/
./1// I
/' IIIIIII
~I
Level of evidencerequired for acorrect decision
ITime required for a correct decision
Figure 7. Model illustrating the possible effect of alcohol on speeded decision-making.
Table 2Mean Response Times (in Milliseconds) for Errors
and Responses Following Errors
This was investigated by analyzing the errors and correct responses immediately following errors.
The mean response times were analyzed with sessionorder (no-alcohol-alcohol; alcohol-no-alcohol) as thebetween-subjects factor and alcohol and trial type (5levels: error responses [E], correct responses where theprevious response was an error [EC], correct responseswhere the previous response was correct but the responsebefore that was an error [ECC], and so on, up to correctresponses occurring after an error followed by three correct responses [ECCCC)) as within-subjects factors. Thisrevealed no effect of session order [F(I,35) = 1.61,P > .1] but significant effects of alcohol [F(1,35) =36.51, p < .01] and trial type [F(4,140) = 32.76, p <.01]. There were significant interactions between sessionorder and alcohol [F(I,35) = 37.56, p < .01] and between alcohol and trial type [F(4,140) = 4.77, p < .05].Finally, the three-way interaction was significant[F(4,140) = 4.84, p < .05].
The means are presented in Table 2, in addition to theremaining correct responses, included for comparison.
cumulation rate is lower with alcohol, it would follow thata response made within a certain time (whichappears fromFigure 4 to be approximately 600 msec) is more likely tobe an error with alcohol than without alcohol.
Figure 7 is obviously an oversimplification and cannot,for example, account for the observation that reaction timedistributions are positively skewed (see the mean-mediandifferences of Table 1). Rabbitt (1979) suggested that thesystem "controls its maximum output rate to observe aspeed-error trade-off, and controls its minimum outputrate to avoid undesirably slow reaction bands" (p. 136).Practice and age appear to affect the latter, that is, byaltering the length of the "tail" of the reaction time distributions. This is consistent with the present experiment,in which there was no change in the overall shape of theSETOF between the two sessions (see Figure 3) butresponses were slower and more variable in the first thanin the second session.
What Happens After an Error?It has already been suggested that errors are fast
responses based on insufficient evidence. To respond asquickly as possible, subjects must make errors occasionally in order to ensure that they are operating very neartheir limits. Rabbitt (1979) has recently argued that inreaction time tasks, subjects "track" their SETOFs, thatis, they gradually increase their speed until an error ismade, then make an immediate adjustment to the amountof evidence required before responding, so that theresponse after an error is abnormally slow (see also Laming, in press).
The question of interest here is: How is this controlmechanism affectedby alcohol? For example, the increasein errors with alcohol could be due to a failure to makea large enough adjustment following an error so thatalthough the next response is correct, as the subject increases speed again, the interval between errors decreases.
Session Order
No Alcohol-Alcohol
Alcohol-No Alcohol
Trial Type No Alcohol
E 521EC 622
ECC 576ECCC 567
ECCCC 554(Other Cs) 551
E 453EC 521
ECC 490ECCC 482
ECCCC 485(Other Cs) 486
Alcohol
523625565564560547
517656584575566565

ALCOHOL, PRACTICE, AND REACTION TIME 473
Subjects are slower with alcohol than without (the alcohol effect) and slower overall in the first than in the second session (reflected in the session order X alcohol interaction). The interaction between alcohol and trial typecan be attributed to the greater effect of alcohol for ECtrials than for the other types of trials (+69 msec [EC]vs. 33 msec [E], 42 msec [ECC], 45 msec [ECCC],44 msec [ECCCC]). (It should be noted that the interaction remained highly significant at p < .01 when correctresponses only were analyzed.) The increase in reactiontime following an error (E to EC) is 121 msec with alcohol and 85 msec without alcohol. Similarly, the three-wayinteraction is mainly the result of a difference in this increase from the first (+ 120 msec) to the second(+85 msec) session. It has already been suggested thatpractice does not greatly alter the rate of accumulationof evidence, so that the decrease in this difference fromthe first to the second session indicates that the adjustment made to the amount of evidence required followingan error is initially large (when the subject is overcautious)but is reduced by practice. With alcohol, however, evidence accumulates at a slower rate, so that an identical
. adjustment to the response criterion following an error,with and without alcohol, can result in different effects(+ 121 and +85 msec, respectively) on overall responsetime. 2
Are Errors Distributed Randomly?Table 3 presents the mean numbers of each of the trial
types in Table 2 (excluding the "Other Cs"). These weresimilarly analyzed with session order as the betweensubjects factor and alcohol and trial type as within-subjectsfactors. There was no effect of session order [F(I,34) =2.01 , p > .1], but there were significant effects of alcohol [F(1,34) = 8.49, p < .01] and trial type [F(4,136)= 42.46, p < .01]. The only significant interaction wasbetween alcohol and trial type [F(4,136) = 5.35,p < .01]. The trial-type effect is, of course, merely theresult of the loss of Trial Types 2-5 for every consecutive error and for every error on the last trial of a block,the loss of Trial Types 3-5 for every ECE sequence andfor every error on the last or penultimate trial of a block,and so on. Thus, because of the overall increase in thenumber of errors with alcohol, an interaction between alcohol and trial type was expected. However, one interesting question is whether the observed numbers are different from those expected by chance given a particular error
Table 3Mean Numbers of Errors and Responses Following Errors
Trial Type No Alcohol Alcohol
I. E 80.0 97.62. EC 76.6 (75.4) 90.4 (91.2)3. ECC 72.3 (71.7) 84.3 (84.0)4. ECCC 68.5 79.75. ECCCC 65.1 75.6
Note-The figures in brackets are the mean numbers expected assuming a random distribution of errors.
rate; that is, are the errors distributed randomly throughout the 2,000 trials? The number of consecutive errorswas therefore investigated in the following way. For eachsubject, the expected number of Trial Type 2 was calculated, both with and without alcohol, by first assumingthat, given an error, the probability of the next trial's being an error equals Number of errors/2ooo. Thus, the expected number of trials ofType 2 in a session equals Number of errors - (Number of errors x Number oferrors/2,000 + 10 X Number of errors/2,000) (the latter part of the expression being the expected number ofconsecutive errors plus the expected number of errors atthe end of a block).
An analysis of variance was conducted on these observed and expected numbers of trials of Type 2 with session order as the between-subjects factor and alcohol andobserved versus expected as within-subjects factors. Therewere no effects of session order [F(1,34) = 2.05,p > .1]or of observed/expected (F < 1), but there was a significant effect of alcohol [F(I,34) = 8.56, p < .01]. Theonly interaction was a highly significant one between alcohol and observed/expected [F(I,34) = 11.43, P < .01].From the means for Trial Type 2 in Table 3, it can beseen that this interaction is due to an increase in the observed number without alcohol, but a decrease with alcohol as compared with the expected numbers. This indicates that consecutive errors occurred less often thanwould be expected by chance without alcohol, but muchmore often than expected with alcohol. Because of thecriterion shift implied by the increase in response timefollowing an error (see Table 2), the result for no alcohol should not be surprising (see also Laming, in press).Thus, when an error is made and detected, the next response is unusually cautious as a result and therefore morelikely to be correct than otherwise. With alcohol, however, consecutive errors occur more frequently than wouldbe expected by chance, and there are at least two possible reasons for this. The first involves correction responses, which were observed by Rabbitt (1966) as occurring on average 500 msec after error responses. In thepresent study, the subject was required to inhibit theseand to make only one response to each stimulus. A correction response made more than 650 msec after an error(that is, 500-rnsec response-stimulus interval + 150-msec"anticipation" period) would have been classified asanother error, since each stimulus was different from theprevious one. The increase in the number of consecutiveerrors with alcohol may therefore be attributed to a reduction in the ability to inhibit correction responses, or to anincrease in their latency putting more of them in the timewindow allowed by the experimental procedure, or to acombination of both of these factors. The second possibility is that as processing is generally slowed down by alcohol (see, e.g., Figures 5 and 7), the time taken to detectan error and make the appropriate adjustment is increased,by which time a second error may have occurred.
These possibilities were investigated by dividing theconsecutive errors (EEs) into those that were probably

474 MAYLOR AND RABBITT
Table 4Mean Numbers of Consecutive Errors
CONCLUSIONS
due to correction responses (that is, when the secondresponse was appropriate to the first stimulus) and those!hat could not be attributed to correction responses (thatIS, when the second response was inappropriate to the firststimulus)-see Table 4. An analysis of variance was conducted on these numbers of trials with session order asthe between-subjects factor and alcohol and consecutiveerror type as within-subjects factors. There was no effect of session order [F(1,34) = 1.59, P > .1] or errortype (F < 1), but there was a significant effect of alcohol [F(1,34) = 11.42, P < .01]. There were no significant interactions.
First, the absence of an effect of error type is important as it indicates that correction responses were occurring more than 650 msec after error responses (the ratioof error types being 1:1 rather than 1:3 that would be expected if correction responses did not occur). Second, theeffect of alcohol (demonstrated by the present analysis, butmore importantly in the previous analysis in which theoverall increase in error rate with alcohol was taken intoaccount) combined with the absence of any interactions suggests that alcohol increases the probability of both correction and noncorrection responses. As discussed earlier, botheffects can be attributed entirely to slower processing withalcohol. Thus, the increase in the number of correctionresponses can be seen as the result of their increased latency due to alcohol, allowing more of them to be detectedby the computer program (that is, those made over650 msec after an error). Similarly, for the second typeof consecutive error (noncorrection responses), it is suggested that alcohol increases the time taken, first, to realize that an error has been made and, second, to take appropriate action by adjusting the response criterion.
An analysis was also carried out on the numbers of trialsof Type 3, with session order, alcohol, and observed/expected as factors.? There was no effect of session order [F(I,34) = 2.05, p > .1] or of observed/expected [F(I,34) = 1.54, P > .1], and nointeractions. The only significant effect was that of alcohol [F(1,34) = 7.73, p < .01]. From Table 3 it can beseen that for Trial Type 3 the observed values are slightlyhigher (although not significantly) than the expected valuesfor both alcohol and no alcohol. Combined with the average difference of 16.5 msec between the response timesto Trial Types ECC and the other correct responses("Other Cs"), this indicates that the criterion adjustmentfollowing an error probably affects at least the followingtwo responses (see Laming, in press). No further analyseswere conducted on the numbers of trial types.
No Alcohol Alcohol
EE where R2 = SIEE where R2 < > SI
I.311.53
3.313.33
The overall results suggest an impairment in performance of a self-paced four-ehoice reaction time task af~r. consum~on of 1 ml alcohol per kilogram of bodyweight, which cannot be attributed to a difference inresponse criterion only; responses are slower, more variable, and less accurate. There is an overall improvementin speed and variability, but no change in accuracy fromthe first to the second session, which could result froma reduction in the number ofunnecessarily slow responsesrather than from an improvement in processing rate. Analysis of the combined data from all the subjects confirmedthat practice has little effect on the SETOF, whereas alcohol alters the function up to 600 msec, so that a responsemade within that time is more likely to be an error withalcohol than it is without alcohol.
Thus, conclusions similar to those of Jennings et al.(1976) have been reached using a different experimentalparadigm and a different treatment of the data. The mainresults are not inconsistent with the view that alcoholdecreases the rate of accumulation of evidence. In addition, the present results indicate that alcohol has some effect o.nthe control over the upper rate of responding (seeRabbitt, 1979). Although an adjustment is made to theresponse criterion following an error both with andwithout alcohol, the increase in the number of the twotypes of consecutive error with alcohol suggests the following. First, error detection is slower with alcohol sothat the appropriate adjustment is delayed, leading to anincrease in the number of consecutive errors not attributable to correction responses. Second, alcohol maydecrease the ability to inhibit a correction response to anerror or may increase the latency of a correction response,both of which would lead to an increase in the numberof consecutive errors attributable to correction responses.Further experimentation is required to distinguish betweenthese last two possibilities.
REFERENCES
BROADBENT, D. E. (1971). Decision and stress. London: AcademicPress.
CARPENTER, J. A. (1962). Effects of alcohol on some psychologicalprocesses. Quarterly Journal of Studies on Alcohol, 23, 274-314.
DREW, G. C., COLQUHOUN, W. P., &; LoNG, H. A. (1959). Effectsofsmall doses ofalcohol on a skill resemblingdriving (MRC Memorandum No. 38). London: Her Majesty's Stationery Office.
FISHER, S. (1984). Stress and the perception ofcontrol. Hillsdale, NJ:Erlbaum.
GUSTAFSON, R. (1986). Alcohol and vigilance performance: Effect ofsmall doses of alcohol on simple visual reaction time. Perceptual &Motor Skills, 62, 951-955.
HUNTLEY, M. S. (1972). Influences of alcohol and S-R uncertainty uponspatial localisation time. Psychopharmacologia (Berlin), 27, 131-140.
HUNTLEY, M. S. (1973). Alcohol influences upon closed-eourse driving performance. Journal of Safety Research, S, 149-164.
HUNTLEY, M. S. (1974). Effects of alcohol, uncertainty and noveltyupon response selection. Psychopharmacologia (Berlin), 39-,259-266.
JENNINGS, J. R., WOOD, C. C., &; LAWRENCE, B. E. (1976). Effects

ALCOHOL, PRACTICE, AND REACTION TIME 475
of graded doses of alcohol on speed-accuracy tradeoff in choice reactiontime. Perception & Psychophysics, 19, 85-91.
LAMING, D. (in press). Some boundary conditions of choice-reactionperformance. In A. F. Sanders (Ed.), Proceedings ofAachen Symposium on Choice Reaction Timeand Stress. Hillsdale, NJ: Erlbaum.
LEONARD, J. A. (1959). Tactual choice reactions: I. Quarterly Journalof Experimental Psychology, 11, 76-83.
MAYWR, E. A., & RABBITI, P. M. A. (1987). Effect of alcohol on rateof forgetting. Psychopharmacology, 91, 230-235.
RABBITT, P. M. A. (1966). Errors and error correction in choice responsetasks. Journal of Experimental Psychology, 71, 264-272.
RABBITT, P. M. A. (1979). Current paradigms and models in humaninformation processing. In V. H. HanIilton & D. M. Warburton(Eds.), Human stress and cognition: An information processing approach. New York: Wiley.
RABBITT, P. M. A. (in press). Models for effects of alcohol on skilledperformance. In A. F. Sanders (Ed.), Proceedings ofAachen Symposium on Choice Reaction Time andStress. Hillsdale, NJ: Erlbaum.
RABBITI, P. M. A., & GoWARD, L. (1986). Effects of age and raw IQtest score on mean correct and mean error reaction times in serialchoice tasks. A reply to Smith and Brewer. British Journal of Psychology, 77, 69-73.
SCHNEIDER, W., DUMAIS, S. T., & SHIFFRIN, R. M. (1984). Automaticand control processing and attention. In R. Parasuraman & D. R. Davies (Eds.), Varieties of attention. New York: Academic Press.
SHILUTO, M. L., KiNG, L. E., & CAMERON, C. (1974). Effects of alcohol on choice reaction time. Quanerly Journal ofStudies on Alcohol, 35, 1023-1034.
THARP, VAN K., JR., RUNDELL, O. H., LESTER, B. K., & WILUAMS,H. L. (1974). Alcohol and information processing. Psychopharmaco/ogia (Berlin), 40, 33-52.
WILKINSON, R. T., & COLQUHOUN, W. P. (1968). Interaction ofalcohoi with incentive and with sleep deprivation. Journal ofexperimental Psychology, 76, 623-629.
NOTES
I. Since responses madewithin 150 msec ("anticipations") were notincluded in the analysis, the first RT band (120-159 msec) was plotted
as 150 msec, the second band (160-199 msec) as 160 msec, the thirdband (200-239 msec) as 200 msec, and so on. Error rates of 100% inFigures 3 and 4 are perhaps surprising, since the task was four-ehoice(or indeed three-ehoice, given that the subject was told in advance thatthere were no immediate repetitions). Nevertheless, of the responsesmade between 150 and 159 msec, all were errors.
2. Again, we have to ask if this increase with alcohol is unexpectedly large, that is, more than a slowing of the rate of accumulation ofevidence (see Figure 7) would lead us to expect. Following sinIilar logicto that discussed above with regard to response variability, an appealcan be made to an analysis of individual differences. First, a linearregression was performed on the mean "other" correct response times againstthe mean increases in RT from E to EC without alcohol (37 subjects).The overall correlation was 0.666, indicating that the E to EC reactiontime difference is monotonically related to overall response speed orevidence accumulation rate. The slope of the regression equation was0.727 and the intercept was -293.1 msec. An analysis then conductedon the alcohol data revealed a slightly lower correlation coefficient of0.539, but a very similar slope (0.773) and intercept (-310.5). The conclusion must therefore be that it would be difficult to distinguish between the performance of 2 subjects with the same mean correct responsetime (a slow sober subject and a fast subject slowed by alcohol) on thebasis of either the E to EC reaction timeincrease or (as established earlier)the variability of correct responses.
3. The expected numbers were calculated in the following way. First,the probability that the two trials after an error are "correct then error" equals (2,000 - Number of errors)/2,000 x Number of errors/2,000, so that the expected number of such sequences equals this probability multiplied by the number of errors, minus the expected numberof errors on either the last or the penultimate trial of a block (that is,20 x Number of errors/2,000). Thus, the expected number of trialsof Type 3 equals the observed number of trials of Type 2 minus theexpected number of ECE sequences.
(Manuscript received January 30, 1987;revision accepted for publication May 7, 1987.)