Effects exposure to on low density and diastolic blood...
7
British Journal of Industrial Medicine 1992;49:287-293 Effects of exposure to carbon disulphide on low density lipoprotein cholesterol concentration and diastolic blood pressure Grace M Egeland, Greg A Burkhart, Teresa M Schnorr, Rick W Hornung, John M Fajen, Shiu T Lee Abstract The relation of carbon disulphide (CS2) exposure to risk factors for ischaemic heart disease was recently examined using data from a 1979 cross sectional study of 410 male textile workers, of whom 165 were exposed and 245 were unexposed to CS2. Average eight hour CS2 exposure concentrations ranged from 0-6 to 11-8 ppm by job title category among the exposed workers. A significant and positive linear trend in low density lipoprotein choles- terol concentration (LDL.) and diastolic blood pressure with increasing CS2 exposure was found after adjustment for potential confoun- ders. When exposure was examined as a categorical variable (none, low, moderate, and high), the high exposure group had an adjusted mean LDL, that was 0-32 mmol/l greater than the non-exposed group (p = 0-02), and an adjusted mean diastolic blood pressure that was 3-16 mm Hg greater than the non-exposed group (p = 0-09). The effect of CS2 on diastolic blood pressure was strengthened in analyses limited to exposed workers: the high exposure group had an adjusted mean diastolic blood pressure that was 5 mm Hg greater than that of the low exposed group (p = 0 03). Triglyceride, high density lipoprotein cholesterol, and fast- ing glucose concentration, and systolic blood pressure were not affected by exposure. Blood lead concentration was positively associated with systolic and diastolic blood pressure. The results indicate that relatively modest exposure to CS2 may raise LDL, concentration and diastolic blood pressure and suggest mechanisms by which exposure to CS2 may influence risk of ischaemic heart disease. Also the results provide further support for the hypothesis of a possible association between blood lead concentration and blood pressure. Exposure to carbon disulphide (CS2) is a well establi- shed risk factor for mortality from ischaemic heart disease.'" Tiller and colleagues, in Great Britain, found that workers with 10 or more years of exposure to CS2 had a greater than twofold excess mortality from ischaemic heart disease than non-exposed workers.4 In Finland, a nearly fivefold excess in mortality from ischaemic heart disease was found among viscose rayon workers compared with paper mill workers.2 The effect of CS2 exposure on ischaemic heart disease appears to be reversible: the excess mortality from ischaemic heart disease in the Finnish cohort disappeared after the initiation of a prevention programme that removed most workers from exposure and greatly reduced CS2 exposure concentrations for the others.6 Similarly, in a follow up study of rayon workers in Great Britain, cumulative exposure among workers whose exposure had ceased for one or more years was not related to increases in mortality from ischaemic heart disease.5 Despite the well established association of exposure to CS2 with ischaemic heart disease, few studies have attempted to examine the possible mechanisms that may mediate the effect of CS2 on risk of ischaemic heart disease.'127" These studies report no significant differences in electrocardiogra- phic abnormalities,'7 glucose metabolism, or serum triglyceride concentrations9; CS2 has been associated, however, with increases in blood pressure,' 2 and with increases in total cholesterol concentration in some8'O but not all' studies. Although the mechanisms for the putative effect of CS2 on lipids and blood pressure have not been established, CS2 impairs thyroid activity" and alters catecholamine metabolism.'2 These, in turn, could influence lipid metabolism and vasoregulation. National Institute for Occupational Safety and Health, Industrywide Studies Branch, 4676 Colum- bia Parkway, Cincinnati, OH 45226 G M Egeland, G A Burkhart, T M Schnorr, R W Homung, J M Fajen, S T Lee 287 on 16 July 2018 by guest. Protected by copyright. http://oem.bmj.com/ Br J Ind Med: first published as 10.1136/oem.49.4.287 on 1 April 1992. Downloaded from
Transcript of Effects exposure to on low density and diastolic blood...
British Journal of Industrial Medicine 1992;49:287-293
Effects of exposure to carbon disulphide on lowdensity lipoprotein cholesterol concentration anddiastolic blood pressure
GraceM Egeland, Greg A Burkhart, TeresaM Schnorr, Rick W Hornung, JohnM Fajen,Shiu T Lee
AbstractThe relation of carbon disulphide (CS2)exposure to risk factors for ischaemic heartdisease was recently examined using data froma 1979 cross sectional study of 410 male textileworkers, of whom 165 were exposed and 245were unexposed to CS2. Average eight hour CS2exposure concentrations ranged from 0-6 to11-8 ppm by job title category among theexposed workers. A significant and positivelinear trend in low density lipoprotein choles-terol concentration (LDL.) and diastolic bloodpressure with increasing CS2 exposure wasfound after adjustment for potential confoun-ders. When exposure was examined as acategorical variable (none, low, moderate, andhigh), the high exposure group had an adjustedmean LDL, that was 0-32 mmol/l greater thanthe non-exposed group (p = 0-02), and anadjusted mean diastolic blood pressure thatwas 3-16mm Hg greater than the non-exposedgroup (p = 0-09). The effect of CS2 on diastolicblood pressure was strengthened in analyseslimited to exposed workers: the high exposuregroup had an adjusted mean diastolic bloodpressure that was 5mm Hg greater than that ofthe low exposed group (p = 0 03). Triglyceride,high density lipoprotein cholesterol, and fast-ing glucose concentration, and systolic bloodpressure were not affected by exposure. Bloodlead concentration was positively associatedwith systolic and diastolic blood pressure. Theresults indicate that relatively modestexposure to CS2 may raise LDL, concentration
and diastolic blood pressure and suggestmechanisms by which exposure to CS2 mayinfluence risk of ischaemic heart disease. Alsothe results provide further support for thehypothesis of a possible association betweenblood lead concentration and blood pressure.
Exposure to carbon disulphide (CS2) is a well establi-shed risk factor for mortality from ischaemic heartdisease.'" Tiller and colleagues, in Great Britain,found that workers with 10 or more years ofexposureto CS2 had a greater than twofold excess mortalityfrom ischaemic heart disease than non-exposedworkers.4 In Finland, a nearly fivefold excess inmortality from ischaemic heart disease was foundamong viscose rayon workers compared with papermill workers.2 The effect of CS2 exposure onischaemic heart disease appears to be reversible: theexcess mortality from ischaemic heart disease in theFinnish cohort disappeared after the initiation of aprevention programme that removed most workersfrom exposure and greatly reduced CS2 exposureconcentrations for the others.6 Similarly, in a followup study of rayon workers in Great Britain,cumulative exposure among workers whose exposurehad ceased for one or more years was not related toincreases in mortality from ischaemic heart disease.5
Despite the well established association ofexposure to CS2 with ischaemic heart disease, fewstudies have attempted to examine the possiblemechanisms that may mediate the effect of CS2 onrisk of ischaemic heart disease.'127" These studiesreport no significant differences in electrocardiogra-phic abnormalities,'7 glucose metabolism, or serumtriglyceride concentrations9; CS2 has been associated,however, with increases in blood pressure,' 2 and withincreases in total cholesterol concentration in some8'Obut not all' studies. Although the mechanisms for theputative effect of CS2 on lipids and blood pressurehave not been established, CS2 impairs thyroidactivity" and alters catecholamine metabolism.'2These, in turn, could influence lipid metabolism andvasoregulation.
National Institute for Occupational Safety andHealth, Industrywide Studies Branch, 4676 Colum-bia Parkway, Cincinnati, OH 45226GM Egeland, G A Burkhart, TM Schnorr, RW Homung,J M Fajen, S T Lee
287
on 16 July 2018 by guest. Protected by copyright.
http://oem.bm
j.com/
Br J Ind M
ed: first published as 10.1136/oem.49.4.287 on 1 A
pril 1992. Dow
nloaded from
Egeland, Burkhart, Schnorr, Hornung, Fajen, Lee
We examined the relation of exposure to CS2 tototal serum cholesterol, low and high densitylipoprotein cholesterol, triglyceride, and fastingglucose conclentrations, and systolic and diastolicblood pressure, using existing data from a cross
sectional study conducted in 1979.'3 Other findingsfrom this study have been described previously.S""Although the data presented here were collected over
11 years ago, the findings contribute to our current
understanding of the association of CS2 with risk ofischaemic heart disease.
MethodsSTUDY POPULATIONIn 1979, participants for the cross sectional studywere recruited from current employees of a synthetictextile company operating four artificial fibre plantsin a small community in Tennessee.'3 Workersexposed to CS2 were recruited from employees whohad worked for a minimum of one year in the viscoserayon plant. The comparison group of non-exposedworkers was recruited from employees who hadworked for at least one year in the three other plants(polyester filament, nylon filament, and nylon polye-ster staple plants) and had never worked in theviscose rayon plant or in a previously closed rayon
filament plant. Of the 273 exposed men in the viscoserayon plant, 69 2% (189) agreed to participate. Of
the 422 workers not exposed to CS2, 58-1% (245)agreed to participate. No data are available on thedemographic characteristics of the non-participants.
Exposed workers were divided into three exposure
groups: low, moderate, and high. The classificationwas established before the field work and was basedon information about the manufacturing process,
exposures associated with current job assignment,and company data on historical exposure.'3 Table 1lists the job titles used to group workers into the low,moderate, and high exposure categories. Twentyfour workers were excluded from the analysesbecause they could not be categorised into a singleexposure group. Of the 165 exposed workers, 48 were
categorised into the low, 67 into the moderate, and 50into the high exposure groups.
To estimate the current CS2 exposure concentra-
tion of the three exposure groups at the time of thestudy, eight hour time weighted average (TWA)personal breathing zone samples were collected fromsome workers in each job category. Samples were
collected with 150 mg charcoal adsorption tubes at a
flow rate of 20 ml/min using calibrated MDA andduPont low flow sampling pumps. Charcoal sampleswere desorbed with benzene and analysed by gas
chromatography.'6 The personal samples were
collected on 12 days in March and April 1979.Although we use the relative terms, low, moderate,
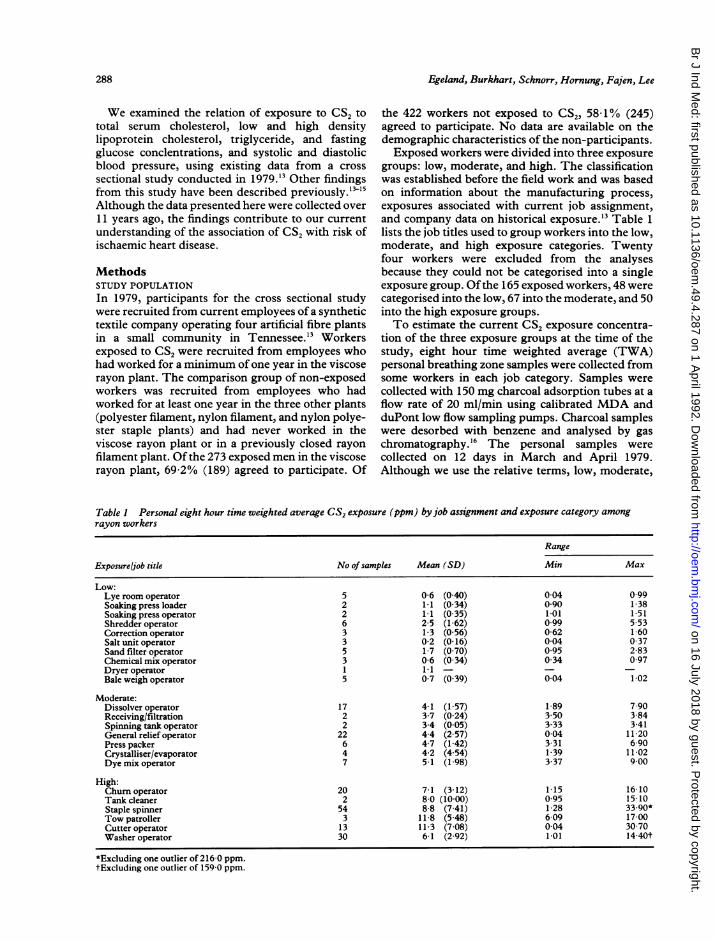
Table I Personal eight hour time weighted average CS2 exposure (ppm) byjob assignment and exposure category amongrayon workers
Range
Exposure/job title No of samples Mean (SD) Min Max
Low:Lye room operator 5 0-6 (0 40) 0-04 0 99Soaking press loader 2 1i1 (0-34) 0 90 1-38Soaking press operator 2 1-1 (0-35) 1 01 1.51Shredder operator 6 2-5 (1-62) 0 99 5-53Correction operator 3 1-3 (0-56) 0-62 1 60Salt unit operator 3 0-2 (0-16) 0 04 0 37Sand filter operator 5 1-7 (0 70) 0 95 2 83Chemical mix operator 3 0-6 (0-34) 0 34 0 97Dryer operator 1 11 - - -Bale weigh operator 5 0-7 (0-39) 0 04 1 02
Moderate:Dissolver operator 17 4-1 (1-57) 1-89 7 90Receiving/filtration 2 3-7 (0-24) 3 50 3 84Spinning tank operator 2 3-4 (0-05) 3-33 3 41General relief operator 22 4-4 (2-57) 0-04 11 20Press packer 6 4-7 (1-42) 3 31 6 90Crystalliser/evaporator 4 4-2 (4-54) 1-39 11 02Dyemixoperator 7 5-1 (1-98) 3 37 9 00
High:Chumroperator 20 71 (312) 1 15 1610Tank cleaner 2 8 0 (10-00) 0-95 15 10Staple spinner 54 8-8 (7-41) 1-28 33.90*Tow patroller 3 11-8 (5-48) 6 09 17 00Cutter operator 13 11-3 (7 08) 0-04 30 70Washer operator 30 6-1 (2 92) 1 01 14-40t
*Excluding one outlier of 216 0 ppm.tExcluding one outlier of 159-0 ppm.
288
on 16 July 2018 by guest. Protected by copyright.
http://oem.bm
j.com/
Br J Ind M
ed: first published as 10.1136/oem.49.4.287 on 1 A
pril 1992. Dow
nloaded from
Effects of CS2 exposure on lipoprotein cholesterol concentration and blood pressure
and high for the three exposure groups throughoutthe paper, we emphasise that the median CS,exposure concentrations for all three exposuregroups were low: 1 0 ppm for the low, 4 1 ppm for themoderate, and 7-6 ppm for the high exposuregroups.'5 Table 1 -lists the mean and range ofexposure concentrations associated with each jobcategory in each exposure group. Although theexposure data showed some variability, the personalexposure sampling verified the prior classification ofworkers into low, moderate, and high exposurecategories: the mean TWA exposures for the jobtitles ranged from 0-6 to 2-5 ppm in the low exposuregroup, from 3-4 to 5 1 ppm in the moderate exposuregroup, and from 6-1 to 11 8 ppm in the high exposuregroup.As well as CS2 exposure concentrations, other
occupational exposures were assessed during thefieldwork. Workers exposed to CS2 were potentiallyexposed to hydrogen sulphide, whereas workers inthe comparison group were potentially exposed tocaprolactam, ethylene glycol, dimethyl tereph-thalate, and methanol. Personal eight hour airsampling was conducted to determine the extent ofother chemical exposures. At the time of sampling,exposures to the compounds mentioned werenegligible.'7 All five samples tested for methanol andall 1 1 samples tested for dimethyl terephthalate werebelow the limit of detection (0-9 ppm and 0-015 ppmrespectively). Eleven of 12 samples tested forcaprolactam were below the limit of detection (0 -14ppm), and the remaining sample (3 9 ppm) was belowthe 5 ppm standard of the United States Departmentof Labor, Occupational Safety and Health Adminis-tration (OSHA) and the 4-3 ppm recommendedstandard set by the American Conference ofGovern-mental Industrial Hygienists (ACGIH).'8 Seventeensamples were analysed for hydrogen sulphide andshowed low concentrations ranging from 0-1 to 1-9ppm; concentrations well below the ACGIH stan-dard of 10 ppm.'8 The eight samples analysed forethylene glycol had concentrations ranging from 0-32to 10-1 ppm; these were well below the OSHAstandard and the ACGIH recommended standard of50 ppm.'8 Although no environmental monitoringwas conducted for lead, blood lead concentrationswere determined for all study participants because ofthe potential for exposure to lead during maintenanceoperations with lead solder.The risk factors for ischaemic heart disease were
measured during the 1979 cross sectional study.Blood pressure was measured after each worker hadbeen in a supine position for a minimum of 10minutes. All measurements were made by one tech-nician using a random zero sphygmomanometer tominimise observer error. The average of two read-ings was used in the analyses. Fasting morningvenous blood samples were collected on 94% (385) of
the 410 participants to obtain serum for laboratoryanalyses of total cholesterol, high density lipoproteincholesterol (HDLC), triglyceride, and glucose con-centrations in accordance with the laboratory tech-niques and protocols used by the Lipid ResearchClinic Program Study.'9 The concentration ofLDLCwas calculated using the Friedewald equation,'which is a valid estimate of LDLC when triglycerideconcentrations are below 350 mg/dl. Samples from24 subjects were excluded from the LDLC analysesbecause triglyceride concentrations exceeded 350mg/dl. A questionnaire was administered on workhistory, health behaviour, and use of medication.Subjects who reported health conditions or currentuse ofmedications known to influence risk factors forischaemic heart disease were excluded from theanalyses. For the blood pressure analyses, weexcluded 18 subjects who reported the use of anti-hypertensive drugs; for fasting glucose, we excludedtwo subjects taking hypoglycaemic drugs, and forlipoproteins, we excluded five subjects taking cor-ticosteroids and lipid lowering or thyroid medica-tions. Because antihypertensive medications couldinfluence the lipid concentrations, we also conductedthe lipid analyses without subjects taking these. Asthe results were unaltered, they are not reported here.
ANALYSESWe examined the relation of exposure to CS2 withtotal serum cholesterol, low and high densitylipoprotein cholesterol, triglyceride, and fastingglucose concentrations, and systolic and diastolicblood pressure. General linear models were used inall univariate and multivariate linear regressionanalyses to examine differences in each risk factor byexposure level (none, low, moderate, and high). Totest for trend, we also examined exposure to CS2 as acontinuous variable. In this analysis, we assignedeach worker the mean CS2 exposure (ppm) associatedwith his current job title category as depicted in table1. Non-exposed workers were assigned a zeroexposure value. Because of possible differences inother chemical exposures between the exposed andunexposed groups, all analyses were repeated with-out the unexposed group to examine the consistencyof the data.
Because of the data which suggested that the effectof CS2 on ischaemic heart disease is reversible, wewere primarily interested in examining the effect ofcurrent CS2 exposure on the risk factors forischaemic heart disease. We did, however, alsoexamine cumulative exposure. Because historicalpersonal exposures were difficult to reconstruct andbecause our records indicated that 81 8% of theexposed employees worked in their current jobassignment for the duration of their employmentwith the company, we examined a cumulativeexposure effect by entering duration of employment
289
on 16 July 2018 by guest. Protected by copyright.
http://oem.bm
j.com/
Br J Ind M
ed: first published as 10.1136/oem.49.4.287 on 1 A
pril 1992. Dow
nloaded from
Egeland, Burkhart, Schnorr, Hornung, Fajen, Lee
into the final multivariate model containing thecurrent exposure categories. The distributions ofserum triglyceride and blood lead concentrationswere normalised by a natural log transformation.We considered the following variables as potential
confounders in the analyses of serum lipids: age,
body mass index (kg/m'), education (less than 12years v 12 or more years), current smoking (yes v no),current alcohol consumption (none, less than one
drink a week, one or more drinks a week), and race
(white v non-white). In the blood pressure analyses,we examined the above variables as well as blood leadand haemoglobin concentrations and pulse rate.
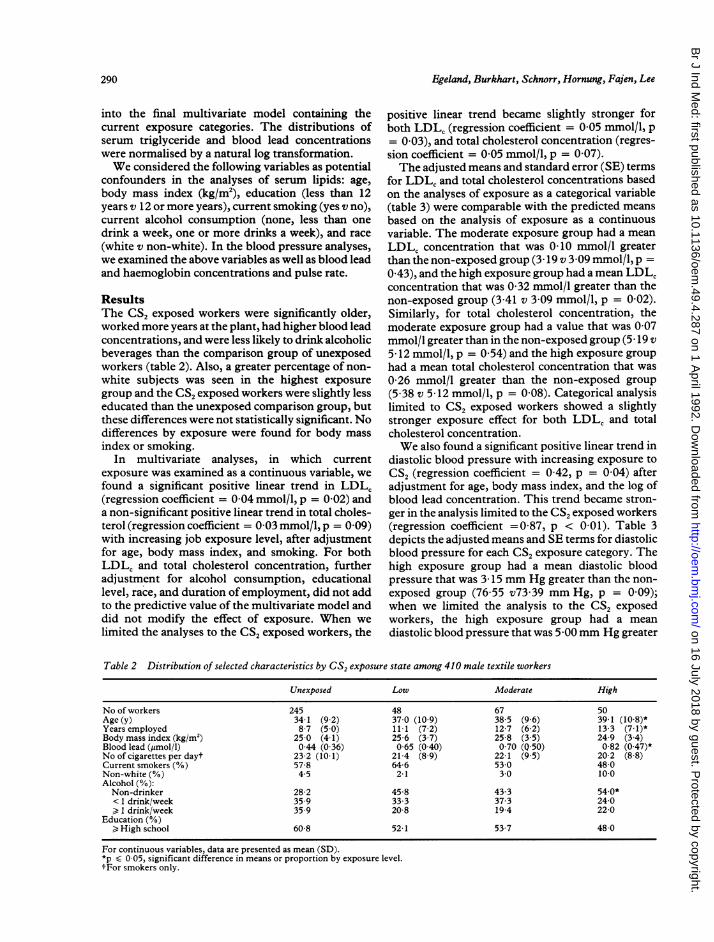
ResultsThe CS, exposed workers were significantly older,worked more years at the plant, had higher blood leadconcentrations, and were less likely to drink alcoholicbeverages than the comparison group of unexposedworkers (table 2). Also, a greater percentage of non-white subjects was seen in the highest exposure
group and the CS, exposed workers were slightly lesseducated than the unexposed comparison group, butthese differences were not statistically significant. Nodifferences by exposure were found for body mass
index or smoking.In multivariate analyses, in which current
exposure was examined as a continuous variable, wefound a significant positive linear trend in LDLC(regression coefficient = 0-04 mmol/l, p = 0-02) anda non-significant positive linear trend in total choles-terol (regression coefficient = 0-03 mmol/l, p = 0-09)with increasing job exposure level, after adjustmentfor age, body mass index, and smoking. For bothLDLC and total cholesterol concentration, furtheradjustment for alcohol consumption, educationallevel, race, and duration of employment, did not addto the predictive value of the multivariate model anddid not modify the effect of exposure. When we
limited the analyses to the CS, exposed workers, the
positive linear trend became slightly stronger forboth LDLC (regression coefficient = 0 05 mmol/l, p= 0 03), and total cholesterol concentration (regres-sion coefficient = 0-05 mmol/l, p = 0-07).The adjusted means and standard error (SE) terms
for LDLC and total cholesterol concentrations basedon the analyses of exposure as a categorical variable(table 3) were comparable with the predicted meansbased on the analysis of exposure as a continuousvariable. The moderate exposure group had a mean
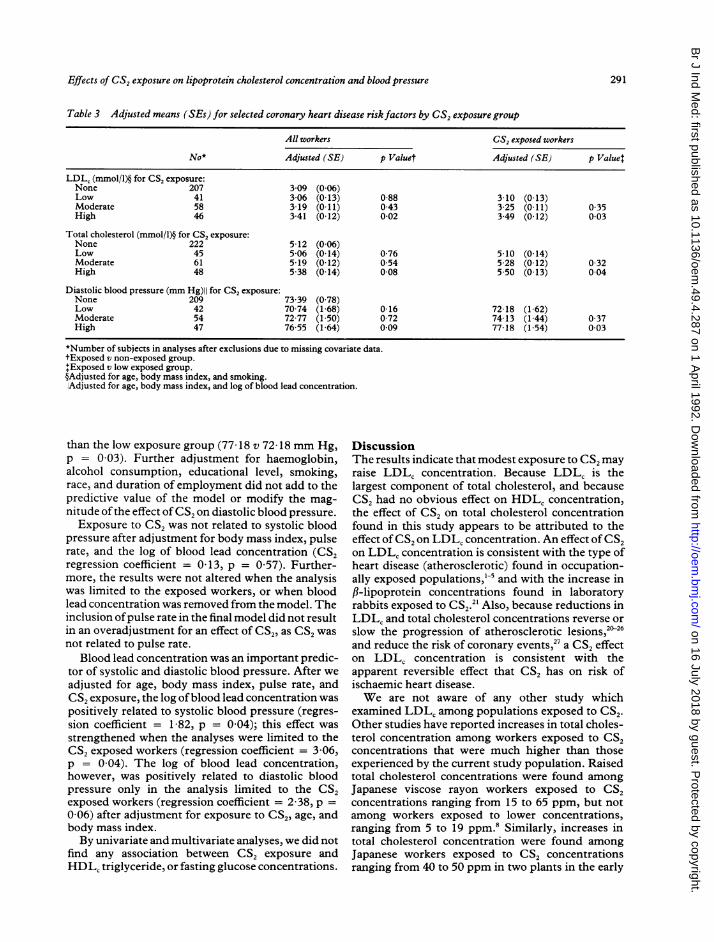
LDLC concentration that was 0-10 mmol/l greaterthan the non-exposed group (3 19 v 3 09 mmol/l, p =0A43), and the high exposure group had a mean LDLCconcentration that was 0 32 mmol/l greater than thenon-exposed group (3 41 v 3 09 mmol/l, p = 0 02).Similarly, for total cholesterol concentration, themoderate exposure group had a value that was 0-07mmol/l greater than in the non-exposed group (5 19 v5 12 mmol/l, p = 0-54) and the high exposure grouphad a mean total cholesterol concentration that was
0 26 mmol/l greater than the non-exposed group(5 38 v 5 12 mmol/l, p = 0 08). Categorical analysislimited to CS2 exposed workers showed a slightlystronger exposure effect for both LDLC and totalcholesterol concentration.We also found a significant positive linear trend in
diastolic blood pressure with increasing exposure to
CS2 (regression coefficient = 0 42, p = 0 04) afteradjustment for age, body mass index, and the log ofblood lead concentration. This trend became stron-ger in the analysis limited to the CS2 exposed workers(regression coefficient =0 87, p < 0 01). Table 3depicts the adjusted means and SE terms for diastolicblood pressure for each CS2 exposure category. Thehigh exposure group had a mean diastolic bloodpressure that was 3- 15 mm Hg greater than the non-exposed group (76-55 v73 39 mm Hg, p = 0 09);when we limited the analysis to the CS2 exposedworkers, the high exposure group had a mean
diastolic blood pressure that was 5 00mm Hg greater
Table 2 Distribution of selected characteristics by CS, exposure state among 410 male textile workers
Unexposed Low Moderate High
No of workers 245 48 67 50Age (y) 34-1 (9 2) 37 0 (10 9) 38-5 (9 6) 39-1 (10-8)*Years employed 87 (50) 11 1 (72) 127 (62) 13-3 (7-1)*Body mass index (kg/m2) 25-0 (4 1) 25-6 (3 7) 25-8 (3 5) 24-9 (3 4)Blood lead (pmol/l) 0 44 (0 36) 0-65 (0-40) 0 70 (0-50) 0-82 (0 47)*No of cigarettes per dayt 23 2 (101) 21-4 (8-9) 22-1 (9 5) 20-2 (8 8)Current smokers (%) 578 64-6 53.0 48-0Non-white (%) 4-5 21 30 10 0Alcohol (%):Non-drinker 28-2 45-8 433 54.0*< 1 drink/week 35-9 33-3 37-3 24-0) I drink/week 35 9 20-8 19-4 22-0
Education (%)> High school 60-8 52-1 53-7 48-0
For continuous variables, data are presented as mean (SD).*p < 0 05, significant difference in means or proportion by exposure level.tFor smokers only.
290
on 16 July 2018 by guest. Protected by copyright.
http://oem.bm
j.com/
Br J Ind M
ed: first published as 10.1136/oem.49.4.287 on 1 A
pril 1992. Dow
nloaded from
Effects of CS2 exposure on lipoprotein cholesterol concentration and blood pressure
Table 3 Adjusted means (SEs) for selected coronary heart disease riskfactors by CS2 exposure group
All workers CS2 exposed workers
No* Adjusted (SE) p Valuet Adjusted (SE) p Value:
LDL, (mmol/l)§ for CS2 exposure:None 207 3 09 (0-06)Low 41 3-06 (0 13) 0-88 3-10 (0 13)Moderate 58 3 19 (0 I 1) 0-43 3-25 (0 11) 0-35High 46 3 41 (0 12) 0-02 3-49 (0 12) 0 03
Total cholesterol (mmol/l)§ for CS2 exposure:None 222 5 12 (0 06)Low 45 5-06 (0 14) 0 76 5 10 (0-14)Moderate 61 5 19 (0-12) 0 54 5 28 (0-12) 0 32High 48 5-38 (0-14) 008 5 50 (0-13) 0 04
Diastolic blood pressure (mm Hg)II for CS2 exposure:None 209 73 39 (0-78)Low 42 70 74 (1-68) 016 72 18 (1-62)Moderate 54 72 77 (1 50) 0-72 74 13 (1 44) 0-37High 47 76-55 (1 64) 0 09 77 18 (1 54) 0 03
*Number of subjects in analyses after exclusions due to missing covariate data.tExposed v non-exposed group.+Exposed v low exposed group.§Adjusted for age, body mass index, and smoking.IAdjusted for age, body mass index, and log of blood lead concentration.
than the low exposure group (77 18 v 72 18 mm Hg,p = 0 03). Further adjustment for haemoglobin,alcohol consumption, educational level, smoking,race, and duration of employment did not add to thepredictive value of the model or modify the mag-nitude ofthe effect ofCS2 on diastolic blood pressure.Exposure to CS2 was not related to systolic blood
pressure after adjustment for body mass index, pulserate, and the log of blood lead concentration (CS2regression coefficient = 0-13, p = 0-57). Further-more, the results were not altered when the analysiswas limited to the exposed workers, or when bloodlead concentration was removed from the model. Theinclusion ofpulse rate in the final model did not resultin an overadjustment for an effect of CS2, as CS2 wasnot related to pulse rate.
Blood lead concentration was an important predic-tor of systolic and diastolic blood pressure. After weadjusted for age, body mass index, pulse rate, andCS2 exposure, the log ofblood lead concentration waspositively related to systolic blood pressure (regres-sion coefficient = 1-82, p = 0-04); this effect wasstrengthened when the analyses were limited to theCS2 exposed workers (regression coefficient = 3-06,p = 0-04). The log of blood lead concentration,however, was positively related to diastolic bloodpressure only in the analysis limited to the CS2exposed workers (regression coefficient = 2-38, p =0-06) after adjustment for exposure to CS2, age, andbody mass index.By univariate and multivariate analyses, we did not
find any association between CS2 exposure andHDLC triglyceride, or fasting glucose concentrations.
DiscussionThe results indicate that modest exposure to CS2 mayraise LDLC concentration. Because LDLC is thelargest component of total cholesterol, and becauseCS2 had no obvious effect on HDLC concentration,the effect of CS2 on total cholesterol concentrationfound in this study appears to be attributed to theeffect of CS2 on LDLC concentration. An effect ofCS2on LDLc concentration is consistent with the type ofheart disease (atherosclerotic) found in occupation-ally exposed populations,'5 and with the increase inf,-lipoprotein concentrations found in laboratoryrabbits exposed to CS2.2' Also, because reductions inLDLc and total cholesterol concentrations reverse orslow the progression of atherosclerotic lesions,2"26and reduce the risk of coronary events,27 a CS2 effecton LDLC concentration is consistent with theapparent reversible effect that CS2 has on risk ofischaemic heart disease.We are not aware of any other study which
examined LDLC among populations exposed to CS2.Other studies have reported increases in total choles-terol concentration among workers exposed to CS2concentrations that were much higher than thoseexperienced by the current study population. Raisedtotal cholesterol concentrations were found amongJapanese viscose rayon workers exposed to CS2concentrations ranging from 15 to 65 ppm, but notamong workers exposed to lower concentrations,ranging from 5 to 19 ppm.8 Similarly, increases intotal cholesterol concentration were found amongJapanese workers exposed to CS2 concentrationsranging from 40 to 50 ppm in two plants in the early
291
on 16 July 2018 by guest. Protected by copyright.
http://oem.bm
j.com/
Br J Ind M
ed: first published as 10.1136/oem.49.4.287 on 1 A
pril 1992. Dow
nloaded from
Egeland, Burkhart, Schnorr, Hornung, Fajen, Lee
1950s, but not among workers in the same two plantsin 1965 when exposures ranged from 5 to 15 ppm.'0Among viscose rayon workers in Finland, exposurewas not related to total cholesterol concentration,9but only 615% of the exposed study participantswere currently exposed at the time of the study andcurrent exposures were below 20 ppm. In the presentstudy, we found a non-significant positive lineartrend in total cholesterol concentration with increas-ing CS2 exposure. Average exposure concentrationsby job title ranged from 0-6 ppm to 11 8 ppm.The mean LDLC concentration in the high
exposure group is in the borderline high risk range() 3 36 mmol/l) established by the National Heart,Lung, and Blood Institute.28 The Lipid ResearchClinics (LRC) prevalence follow up study reportedthat a 0 78 mmol/l (30 mg/dl) difference in LDLCconcentration was associated with a 65% increase inmortality from coronary heart disease among menduring an eight year period.29 In the LRC popula-tion, the differences in LDLC concentration byexposure category would translate to an increasedcoronary heart disease risk of 26% and 9% for thehigh and moderate exposure groups respectively. Amortality study of four rayon textile plants in theUnited States, that included our study plant, found a24% increase in mortality from ischaemic heartdisease among workers that had similar job assign-ments as our high exposure group.30 The mortalitystudy did not report CS2 exposure levels at these fourplants, however.As well as an effect on LDLC concentration the
results indicate that exposure to CS2 may also have aneffect on diastolic blood pressure. As with LDLC andtotal cholesterol concentrations, the trend in diastolicblood pressure found among all workers was streng-thened in the analysis limited to the CS2 exposedworkers. It is possible that potential differences inother chemical exposures between the CS2 exposedand unexposed groups may influence the magnitudeof the association found between exposure state andblood pressure and lipoproteins. For example, thegroup not exposed to CS2 had potential exposure tocaprolactam, which has been reported to raise bloodpressure in animal studies.3' Because the exposedpopulation is more homogeneous with regard tochemical exposures than the total CS2 exposed andnon-exposed group, the analyses excluding the non-exposed group could provide a more sensitive indica-tion of a possible effect of exposure to CS2.Our results do not indicate an effect of exposure to
CS2 on systolic blood pressure. Reports from a studypopulation in Finland, however, showed raised dias-tolic and systolic blood pressure among CS2 exposedworkers.'2 Reasons for this discrepancy are notobvious, as current exposures (less than 20 ppm) andthe average duration of employment of the Finnishworkers were comparable with that of our study
population. The Finnish study, however, did notconsider the potential for confounding exposure toinorganic lead, which was positively correlated toCS2 exposure and blood pressure in this study.The relation of blood lead concentration to dias-
tolic and systolic blood pressure is of interest. Theblood lead concentrations, which ranged from a meanof 0 44 ,umol/l for the unexposed CS2 group to 0 82,umol/l for the high exposed CS2 group, are compara-ble with the range of exposures identified in thegeneral United States population.32 The results areconsistent with the hypothesis that low to moderateexposure to lead is related to increases in bloodpressure as shown in animal studies,3334 and suppor-ted by associations found in several,3"37 but not all38epidemiological studies.One strength of our study is that we were able to
examine and control for several potential confoun-ders, such as blood lead concentration, body massindex, race, smoking, and educational level: variablesthat are often not available in occupational studies.One limitation, however, is that we were not able tocontrol for potential differences in other characteris-tics, such as diet or physical activity. The fact thatthere were no differences in the basic pay rate of theviscose rayon workers by exposure category,however, suggests that the workers were a relativelyhomogeneous group. Another limitation is thepotential for selection bias. Workers with healthconcerns may have been more likely to participate inthe study, but this could have been equally true forexposed and non-exposed workers. Becausedemographic data were not collected on non-participants we are unable to consider the issue ofselection bias in detail. We did, however, examine thedistribution of workers taking antihypertensivemedications by degree of exposure. Although wefound no statistically significant differences, we didfind a slightly greater percentage of antihypertensiveuse among the low (6 3%) and moderate (9 0%)exposure groups than among the non-exposed(3 3%) and high exposure groups (2 0%). It ispossible that these slight differences could result inan underestimate of an effect of CS2 on bloodpressure in the low and moderate exposure groups.
In 1989, OSHA reduced the eight hour TWApermissible exposure limit for CS2 from 20 ppm to 4ppm,39 because of findings suggesting that exposureswithin the range of 20 ppm are associated withcardiovascular,5630 neurological,30 and possiblereproductive effects.40 4' The moderate exposuregroup, which had CS2 exposures in the range of thecurrent OSHA standard, showed no statisticallysignificant differences in LDLc concentration anddiastolic blood pressure compared with the non-exposed group. The lack of statistically significantincreases in these risk factors among the moderateexposure group, however, may be due to the
292
on 16 July 2018 by guest. Protected by copyright.
http://oem.bm
j.com/
Br J Ind M
ed: first published as 10.1136/oem.49.4.287 on 1 A
pril 1992. Dow
nloaded from
Effects of CS2 exposure on lipoprotein cholesterol concentration and blood pressure
relatively large SE terms and the small sample size ofthe moderate exposure group: our power to detect the0-10 mmol/l difference in LDLC concentration bet-ween the moderate and non-exposed group was only56%. Also, because we found a significant lineartrend in LDLC concentration and diastolic bloodpressure with increasing exposure to CS2, the resultssupport the NIOSH recommended exposure limit of1 ppm, which was established to provide a margin ofsafety for the estimated 40 000 United States workersexposed to CS2.YThe results of this study indicate that relatively
modest exposure to CS2 may raise LDLC concentra-tion and diastolic blood pressure. This suggestsmechanisms by which CS2 exposure may increase therisk of ischaemic heart disease. Our findings alsoconfirm other studies which show that lead exposureincreases diastolic and systolic blood pressure.
1 Hernberg S, Partanen T, Nordman C-H, Sumari P. Coronaryheart disease among workers exposed to carbon disulphide.BrJ Ind Med 1970;27:313-25.
2 Tolonen M, Hernberg S, Nurminen M. A follow up study ofcoronary heart disease in viscose rayon workers exposed tocarbon disulphide. Br JInd Med 1975;32:1-10.
3 Tolonen M, Nurminen M, Hernberg S. Ten-year mortality ofworkers exposed to carbon disulphide. Scand J Work EnvironHealth 1979;5:109-14.
4 Tiller JR, Schilling RSF, Morris JN. Occupational toxic factorin mortality from coronary heart disease. BMJ 1968;IV:407-11.
5 Sweetnam PM, Taylor SWC, Elwood PC. Exposure to carbondisulphide and ischaemic heart disease in a viscose rayonfactory. Br J Ind Med 1986;44:220-7.
6 Nurminen M, Hernberg S. Effects of intervention on thecardiovascular mortality of workers exposed to carbon disul-phide: a 15 year follow up. Br J Ind Med 1985;42:32-5.
7 Oliver LC, Weber RP. Chest pain in rubber chemical workersexposed to carbon disulphide and methaemoglobin formers.Br J Ind Med 1984;41:296-304.
8 Harashima S, Toyama T, Sakurai T. Serum cholesterol level ofviscose rayon workers. Keio J Med 1960;9:81-90.
9 Hermberg S, Nordman C-H, Partanen T, Christiansen V,Virkola P. Blood lipids, glucose tolerance and plasma creatin-ine in workers exposed to carbon disulphide. Work Environ-ment and Health 1971;8:11-7.
10 Toyamoa T, Sakurai H. Ten-year changes in exposure level andtoxicological manifestations in carbon disulphide workers. In:Briefer H, Teisinger J, eds, Toxicology of carbon disulphide.Amsterdam: Excerpta Medica Foundation 1967:197-204.
11 Mangeri S, Cavalleri A, Mangeri U, Taccola A. New aspects inthe pathogenic mechanism of carbon disulphide toxic action.Med Lav 1971;62:398-403.
12 Magos L. The clinical and experimental aspects of CS, exposureon brain catecholamines in rats. Br J Pharmacol 1970;39:26-33.
13 Fajen J, Albright B, Leffingwell SS. A cross-sectional medicaland industrial hygiene survery of workers exposed to carbondisulfide. ScandJ Work Environ Health 1981;7 (suppl 4):20-7.
14 Putz-Anderson V, Albright BE, Lee ST, Johnson BL, ChrislipDW, Taylor BJ, et al. A behavioral examination of workersexposed to carbon disulfide. Neurotoxicology 1983;4:67-78.
15 Johnson BL, Boyd J, Burg JR, Lee ST, Xintaras C, Albright BE.Effects on the peripheral nervous system of workers' exposureto carbon disulfide. Nedurotoxicology 1983;4:53-66.
16 Eller P. NIOSH manual of analytical methods, 3rd ed. Cincin-nati, Ohio: US Depart of Health and Human Services,National Institute for Occupational Safety and Health; 1986.(NIOSH publ No 84-10).
17 In-depth industrial hygiene report of the American EnkaCompany. Cincinnati, OH: April 1982. (NTIS PB83221689.)
18 American Conference of Governmental Industrial Hygienists.Guide to occupational exposure values, Cincinnati, Ohio: 1986.
19 Manual of Laboratory Operations. Lipid Research ClinicProgram. Lipid and Lipoprotein Analyses. Bethesda, MD:US Dept of Health, Education, and Welfare, National Ins-titutes of Health publication (NIH) 75-628, 1975.
20 Friedewald WT, Levy RI, Frederickson DS. Estimation of theconcentration of LDL-c in plasma without the use of thepreparative ultracentrifuge. Clin Chem 1972;18:499-502.
21 Cohen AE, Scheel LD, Kopp JF, et al. Biochemical mechanismsin chronic carbon disulfide poisoning. Am Ind Hyg Assoc J1959;20:303-23.
22 Brensike JF, Levy RI, Kelsey SF, et al. Effects of therapy withcholestyramine on progression of coronary arteriosclerosis:results of the NHLBI Type II Coronary Intervention Study.Circulation 1984;69:313-24.
23 Kane JP, Malloy MJ, Ports TA, Phillips NR, Diehl JC, HavelRJ. Regression of coronary atherosclerosis during treatmentof familial hypercholesterolemia with combined drugregimens. JAMA 1990;264:3007-12.
24 Cashin-Hemphill L, Mack WJ, Pogoda J, Sanmarco ME, AzenSP, Blankenhorn DH. Beneficial effects of colestipol-niacin oncoronary atherosclerosis: a 4-year follow-up. JAMA 1990;264:3013-7.
25 Brown G, Albers JJ, Fisher LD, et al. Regression of coronaryartery disease as a result of intensive lipid-lowering therapy inmen with high levels of apolipoprotein B. N Engl J Med1990;323: 1289-98.
26 Blankenhorn DH, Nessim SA, Johnson RL, et al. Beneficialeffects of combined colestipol-niacin therapy on coronaryatherosclerosis and coronary venous bypass grafts. JAMA1987;255:3233-40.
27 Tyroler HA. Lowering plasma cholesterol levels decreases riskof coronary heart disease: an overview of clinical trials. In:Steinberg D, Olefsky JM, eds. Hypercholesterolemia andatherosclerosis. New York, NY: Churchill Livingstone Inc1987:99-116.
28 The Expert Panel. Report of the National Cholesterol EducationProgram Expert Panel on detection, evaluation, and treatmentof high blood cholesterol in adults. Arch Intern Med1988;148:36-69.
29 Jacobs DR, Membane IL, Bangdiwala SI, Criqui MH, TyrolerHA. For the Lipid Research Clinics program. High densitylipoprotein cholesterol as a predictor of cardiovascular diseasemortality in men and women: The Follow-up study of theLipid Research Clinics Prevalence Study.Am J Epidemiol1990;131:32-47.
30 MacMahon B, Monson RR. Mortality in the US rayon industry.J Occup Med 1988;30:698-705.
31 Gross P. Biologic activity of Epsilon-caprolactam. CRC CriticalReviews in Toxicology 1984;13:205-16.
32 Schwartz J. The relationship between blood lead and bloodpressure in the NHANES II Survey. Environ Health Perspect1988;78:15-22.
33 Carmignani M, Boscolo P, Ripanti G, Finelli VN. Effects ofchronic exposure to cadmium and/or lead on some neuro-humoral mechanisms regulating cardiovascular function inthe rat. International conference on heavy metals in the environ-ment. Heidelberg, Germany. 1983;1:557-60.
34 Koop SJ, Perry HM, Glonek T, et al. Cardiac physiologic-metabolic changes after chronic low-level heavy metal feeding.Am J Physiol 1980:239-H22-H30.
35 Weiss ST, Munoz A, Stein A, Sparrow D, Speizer FE. Therelationship of blood lead to blood pressure in a longitudinalstudy of working men. Am JEpidemiol 1986;123:800-8.
36 Rabinowitz M, Bellinger D, Leviton A, Needleman H, Schoen-baum SX. Pregnancy hypertension, blood pressure duringlabor, and blood lead levels. Hypertension 1984;1O:447-5 1.
37 Harlan WR. The relationship of blood lead levels to bloodpressure in the US population. Environ Health Perspect1988;78:9-13.
38 Pocock SJ, Shaper AG, Ashby D, Delves I, Whitehead IP. BloodLead concentration, blood pressure, and renal function. BMJ1984j289:872-4.
39 US Department of Labor, Occupational Safety and HealthAdministration. Air contaminants; final rule. Federal Register1989;54:2535.
40 Cai SX, Bao YS. Placental transfer, secretion into mother milk ofcarbon disulphide and the effects on maternal function offemale viscose rayon workers. Ind Health 1981;19:15-29.
41 Hemminki K, Niemi ML. Community study of spontaneousabortions: Relation to occupation and air pollution by sulfurdioxide, hydrogen sulfide, and carbon disulfide. Int ArchOccup Environ Health. 1982;51:55-63.
42 Criteria for a recommended standard: Occupational exposure tocarbon disulfide. Cincinnati, OH: US Department of Health,Education, and Welfare, National Institute for OccupationalSafety and Health, publication (NIOSH) 77-156.
Accepted 12 August 1991
293
on 16 July 2018 by guest. Protected by copyright.
http://oem.bm
j.com/
Br J Ind M
ed: first published as 10.1136/oem.49.4.287 on 1 A
pril 1992. Dow
nloaded from