Effects and Mechanisms of Mechanical Activation on ...
39
Effects and Mechanisms of Mechanical Effects and Mechanisms of Mechanical Activation on Hydrogen Sorption/ Activation on Hydrogen Sorption/ Desorption Desorption of of Nanoscale Nanoscale Lithium Nitrides Lithium Nitrides Leon L. Shaw, Tippawan Markmaitree, William Osborn, Xuefei Wan University of Connecticut Z. Gary Yang, Jianzhi Hu, Chun Lu, Jun Liu Pacific Northwest National Laboratory May 15 – 18, 2007 2007 DOE Hydrogen Program Review Project ID: STP34 This presentation does not contain any proprietary or confidential information
Transcript of Effects and Mechanisms of Mechanical Activation on ...
Effects and Mechanisms of Mechanical Effects and Mechanisms of Mechanical Activation on Hydrogen Sorption/ Activation on Hydrogen Sorption/
DesorptionDesorption of of NanoscaleNanoscale Lithium NitridesLithium Nitrides
Leon L. Shaw, Tippawan Markmaitree, William Osborn, Xuefei Wan
University of Connecticut
Z. Gary Yang, Jianzhi Hu, Chun Lu, Jun LiuPacific Northwest National Laboratory
May 15 – 18, 20072007 DOE Hydrogen Program Review
Project ID: STP34
This presentation does not contain any proprietary or confidential information
2
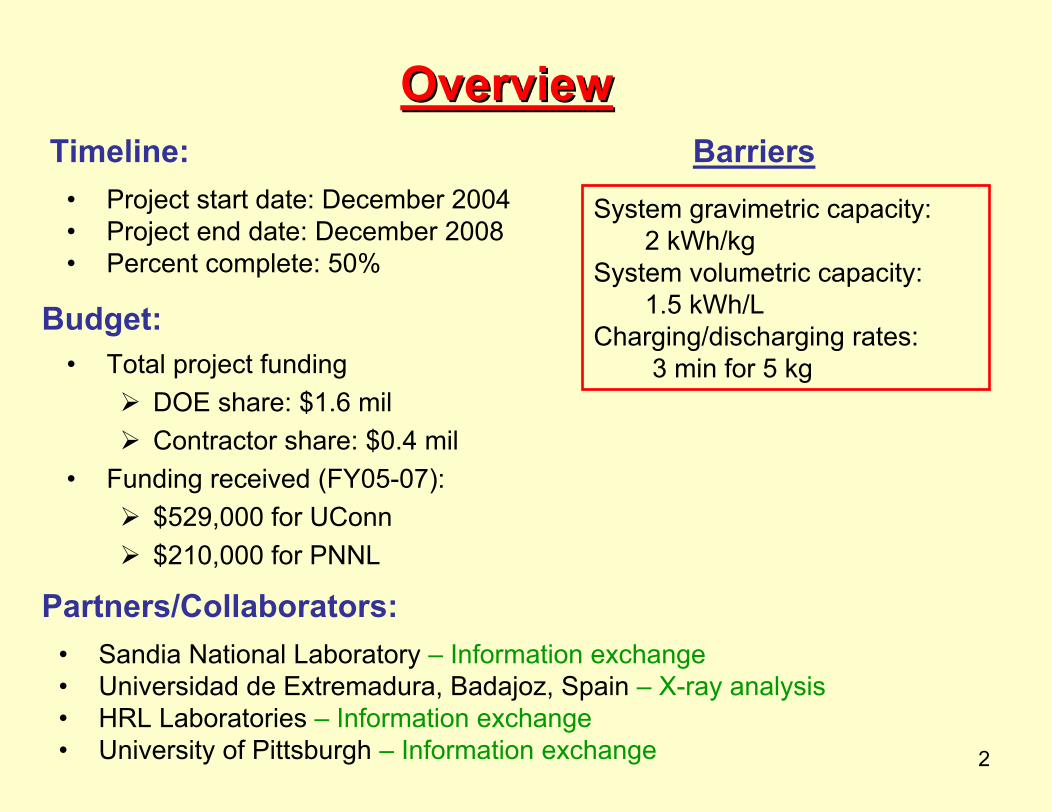
OverviewOverview
• Project start date: December 2004• Project end date: December 2008• Percent complete: 50%
• Total project fundingDOE share: $1.6 milContractor share: $0.4 mil
• Funding received (FY05-07): $529,000 for UConn$210,000 for PNNL
Timeline:
Budget:
Partners/Collaborators:• Sandia National Laboratory – Information exchange• Universidad de Extremadura, Badajoz, Spain – X-ray analysis• HRL Laboratories – Information exchange• University of Pittsburgh – Information exchange
Barriers
System gravimetric capacity: 2 kWh/kg
System volumetric capacity: 1.5 kWh/L
Charging/discharging rates: 3 min for 5 kg
3
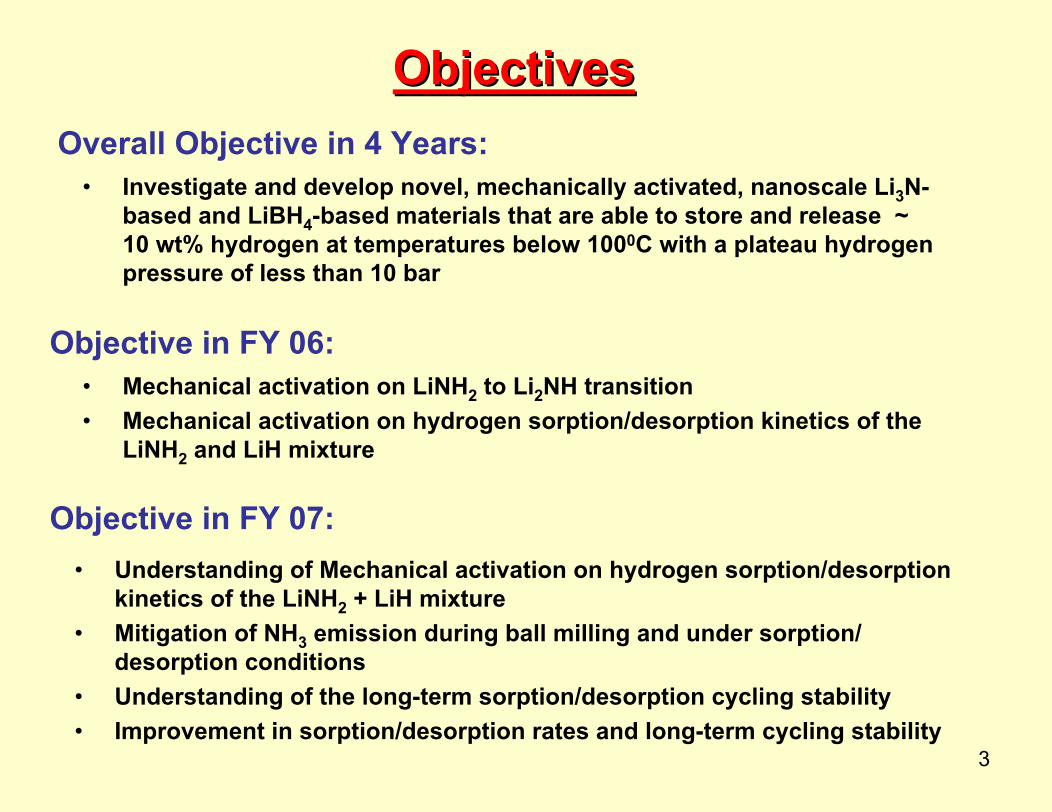
• Investigate and develop novel, mechanically activated, nanoscale Li3N-based and LiBH4-based materials that are able to store and release ~ 10 wt% hydrogen at temperatures below 1000C with a plateau hydrogen pressure of less than 10 bar
ObjectivesObjectivesOverall Objective in 4 Years:
Objective in FY 06:• Mechanical activation on LiNH2 to Li2NH transition• Mechanical activation on hydrogen sorption/desorption kinetics of the
LiNH2 and LiH mixture
Objective in FY 07:• Understanding of Mechanical activation on hydrogen sorption/desorption
kinetics of the LiNH2 + LiH mixture• Mitigation of NH3 emission during ball milling and under sorption/
desorption conditions• Understanding of the long-term sorption/desorption cycling stability• Improvement in sorption/desorption rates and long-term cycling stability
4
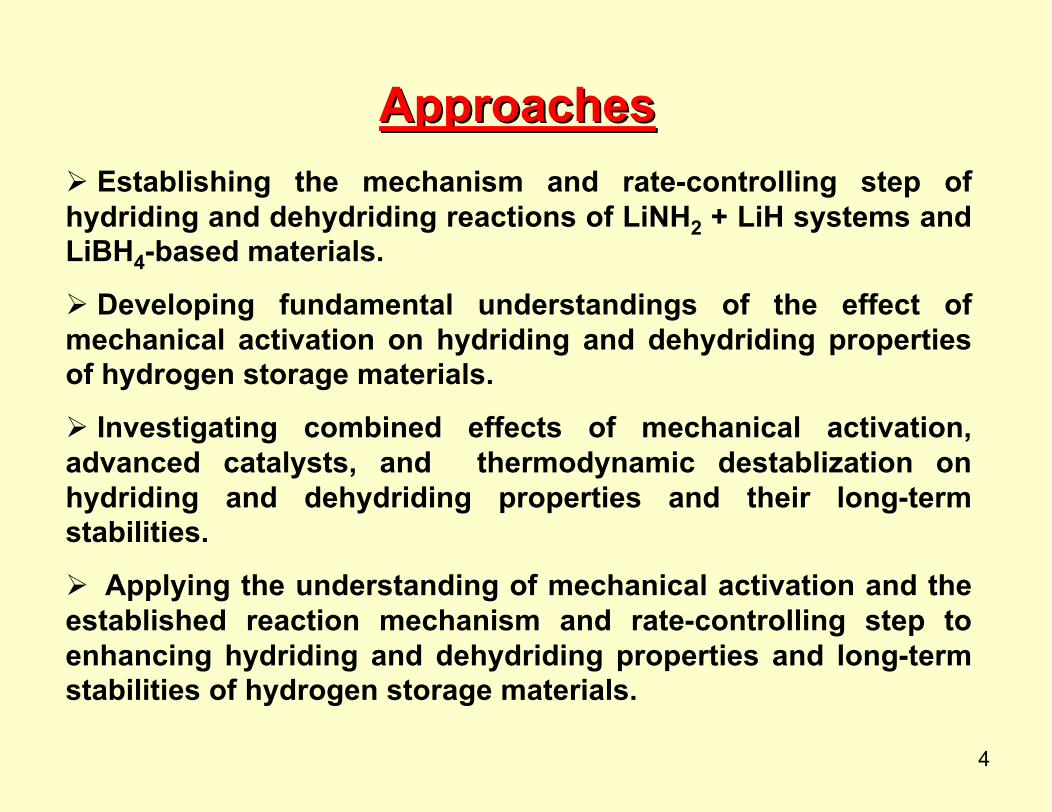
ApproachesApproachesEstablishing the mechanism and rate-controlling step of
hydriding and dehydriding reactions of LiNH2 + LiH systems and LiBH4-based materials.
Developing fundamental understandings of the effect of mechanical activation on hydriding and dehydriding properties of hydrogen storage materials.
Investigating combined effects of mechanical activation, advanced catalysts, and thermodynamic destablization on hydriding and dehydriding properties and their long-term stabilities.
Applying the understanding of mechanical activation and the established reaction mechanism and rate-controlling step to enhancing hydriding and dehydriding properties and long-term stabilities of hydrogen storage materials.
5
Technical Accomplishments, Technical Accomplishments, Progress and ResultsProgress and Results
I. Evidence of Nano-Engineering and Mechanical Activation Obtained via High-Energy Ball Milling (UConn & PNNL)
II. Reaction Mechanism, Kinetics, and Enhancement of LiNH2 to Li2NH Transition via Mechanical Activation (UConn)
III. Reaction Mechanism, Kinetics, and Enhancement of Hydrogen Sorption/Desorption of LiNH2 + LiH Systems via Mechanical Activation (UConn)
IV. Atomic Level Understanding of Reaction Mechanism and Effects of Mechanical Activation via NMR (PNNL)
V. Enhancement of Reaction Kinetics and Stability of Mechanically Activated LiNH2 + LiH Systems (UConn)
(May 1, 2006 – April 30, 2007)

6
I. Evidence of I. Evidence of NanoNano--Engineering and Mechanical Engineering and Mechanical Activation Achieved via HighActivation Achieved via High--Energy Ball MillingEnergy Ball Milling
High-energy ball milling leads to changes in powder characteristics including:
formation of nano-particles (Fig. A);
increases in specific surface area, SSA (Fig. B); and
introduction of internal strains and alternation in the local electronic state (Fig. C).
-10-50 ppm5
45-min milling
180-min milling
10
0
10
20
30
40
50
60
70
1 2 3 4
Spec
ific
surf
ace
area
(m2 /g
)
Fig. B: SSA of LiNH2 + LiHmixtures
Fig. A: Crystallite size of LiH particles
No milling Milling for 90 min
Milling for 180 min
Milling for 24 hr
Fig. C: 6Li MAS NMR spectra of LiNH2
Peak shifting and broadening indicate alternation in the local electronic state and
structural refinement.
7
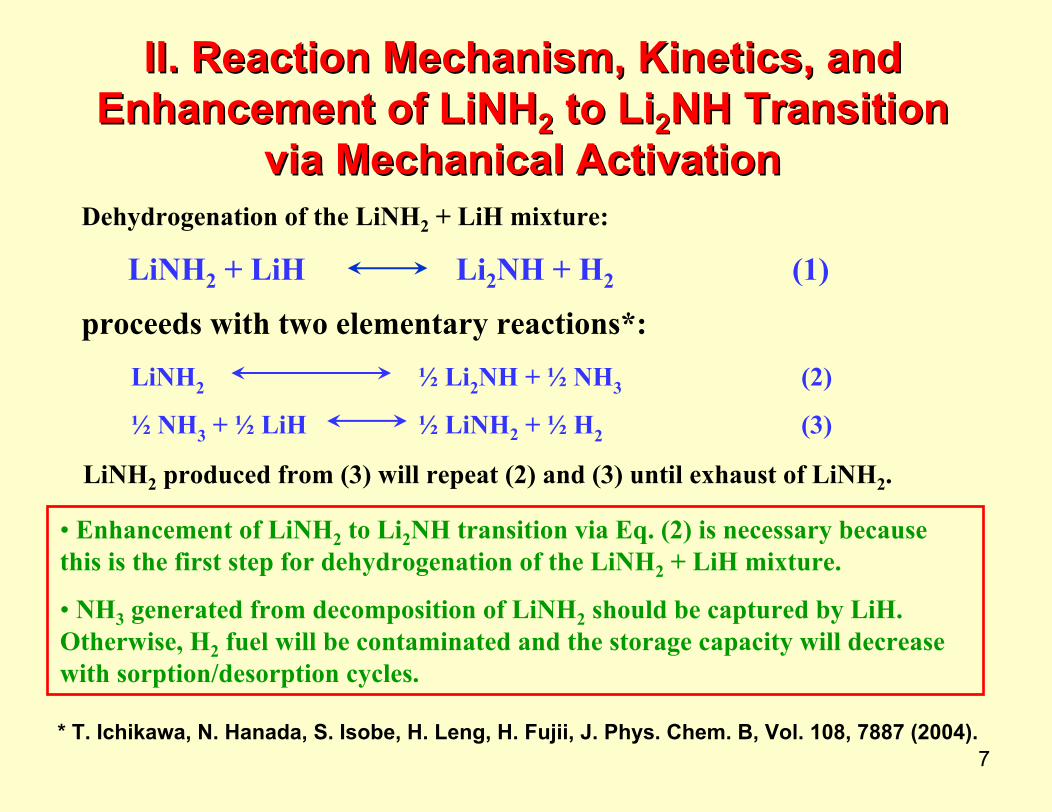
LiNH2 + LiH Li2NH + H2 (1)
LiNH2 ½ Li2NH + ½ NH3 (2)
½ NH3 + ½ LiH ½ LiNH2 + ½ H2 (3)
II. Reaction Mechanism, Kinetics, and II. Reaction Mechanism, Kinetics, and Enhancement of LiNHEnhancement of LiNH22 to Lito Li22NH Transition NH Transition
via Mechanical Activationvia Mechanical ActivationDehydrogenation of the LiNH2 + LiH mixture:
proceeds with two elementary reactions*:
• Enhancement of LiNH2 to Li2NH transition via Eq. (2) is necessary because this is the first step for dehydrogenation of the LiNH2 + LiH mixture.
• NH3 generated from decomposition of LiNH2 should be captured by LiH. Otherwise, H2 fuel will be contaminated and the storage capacity will decrease with sorption/desorption cycles.
LiNH2 produced from (3) will repeat (2) and (3) until exhaust of LiNH2.
* T. Ichikawa, N. Hanada, S. Isobe, H. Leng, H. Fujii, J. Phys. Chem. B, Vol. 108, 7887 (2004).

8
The onset temperature for weight loss of LiNH2without milling is 1200C, whereas the corresponding value for LiNH2 with ball milling is room temperature.
The transition rate from LiNH2 to Li2NH and NH3increases with the ball milling time, i.e., the more mechanical activation, the higher the transition rate.
No milling
Milled for 180 min at RT
TGA Results of LiNH2 with and without ball milling
60
70
80
90
100
110
0 100 200 300 400 500 600
Temperature (oC)
Wei
ght(%
)
no milled
milled for 45 min. milled
for 180 min
Enhancement of LiNHEnhancement of LiNH22 to Lito Li22NH Transition NH Transition via Mechanical Activationvia Mechanical Activation
The thermogravimetric analysis (TGA) was conducted under a flowing argon condition, and thus the weight loss was due to NH3 formation as indicated by Eq. (2) of Slide 7 and its flowing out of the TGA chamber with the flowing argon.
9
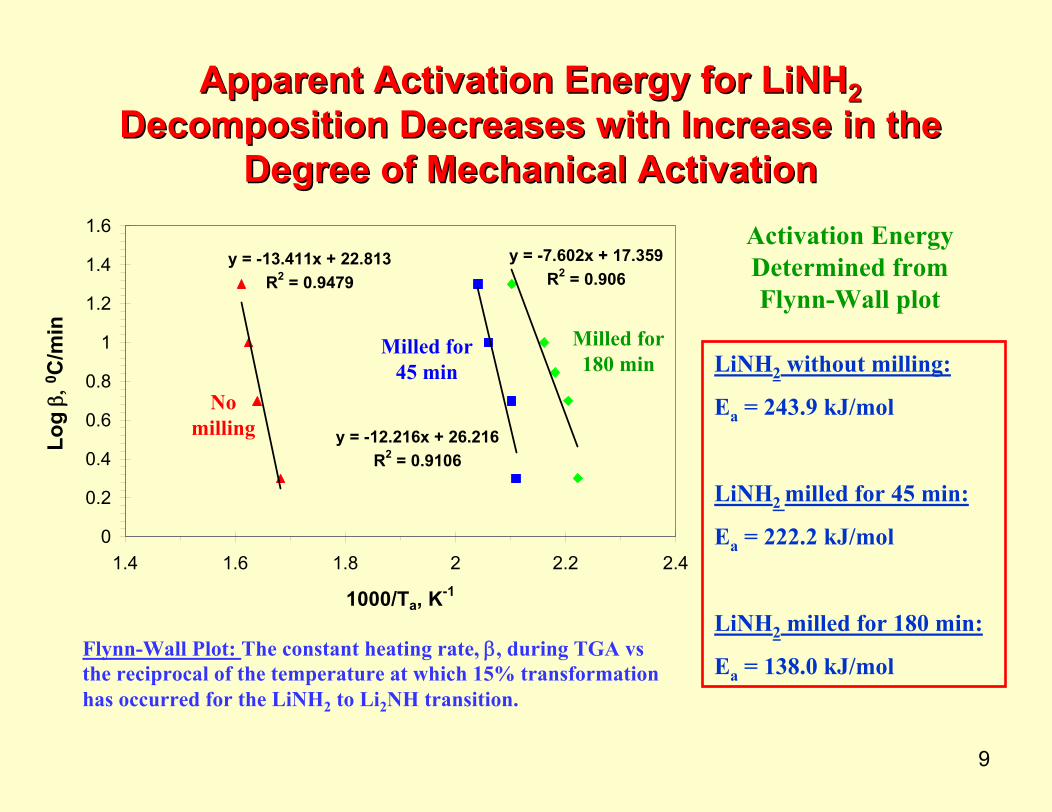
Apparent Activation Energy for LiNHApparent Activation Energy for LiNH22Decomposition Decreases with Increase in the Decomposition Decreases with Increase in the
Degree of Mechanical ActivationDegree of Mechanical Activation
LiNH2 without milling:
Ea = 243.9 kJ/mol
LiNH2 milled for 45 min:
Ea = 222.2 kJ/mol
LiNH2 milled for 180 min:
Ea = 138.0 kJ/mol
y = -13.411x + 22.813R2 = 0.9479
y = -12.216x + 26.216R2 = 0.9106
y = -7.602x + 17.359R2 = 0.906
0
0.2
0.4
0.6
0.8
1
1.2
1.4
1.6
1.4 1.6 1.8 2 2.2 2.4
1000/Ta, K-1
Flynn-Wall Plot: The constant heating rate, β, during TGA vsthe reciprocal of the temperature at which 15% transformation has occurred for the LiNH2 to Li2NH transition.
Activation Energy Determined from Flynn-Wall plot
Milled for 180 min
Milled for 45 min
No milling
Log
β, 0 C
/min

10
60
70
80
90
100
110
0 5 10 15 20 25 30 35
Time (min)
Wei
ght (
%)
0
50
100
150
200
250
300
350
400
Tem
pera
ture
(0 C
)
0
0.2
0.4
0.6
0.8
1
1.2
0 5 10 15 20 25
t (min)
Frac
tion
tran
sfor
med
(%)
Reaction Kinetics of Reaction Kinetics of LiNHLiNH22 DecompositionDecomposition
The weight change of LiNH2 under a constant temperature and pressure condition was monitored to determine the decomposition kinetics and rate-limiting mechanism. Fig. A shows such an experiment with rapid heating of LiNH2 to 3500C in a TGA chamber and holding at 3500C with a flowing argon until the reaction was completed.
There is no linear relationship between the fraction decomposed and the holding time in the isothermal and isobaric experiment.
Fig. A
Fig. B
Temperature
Weight
11
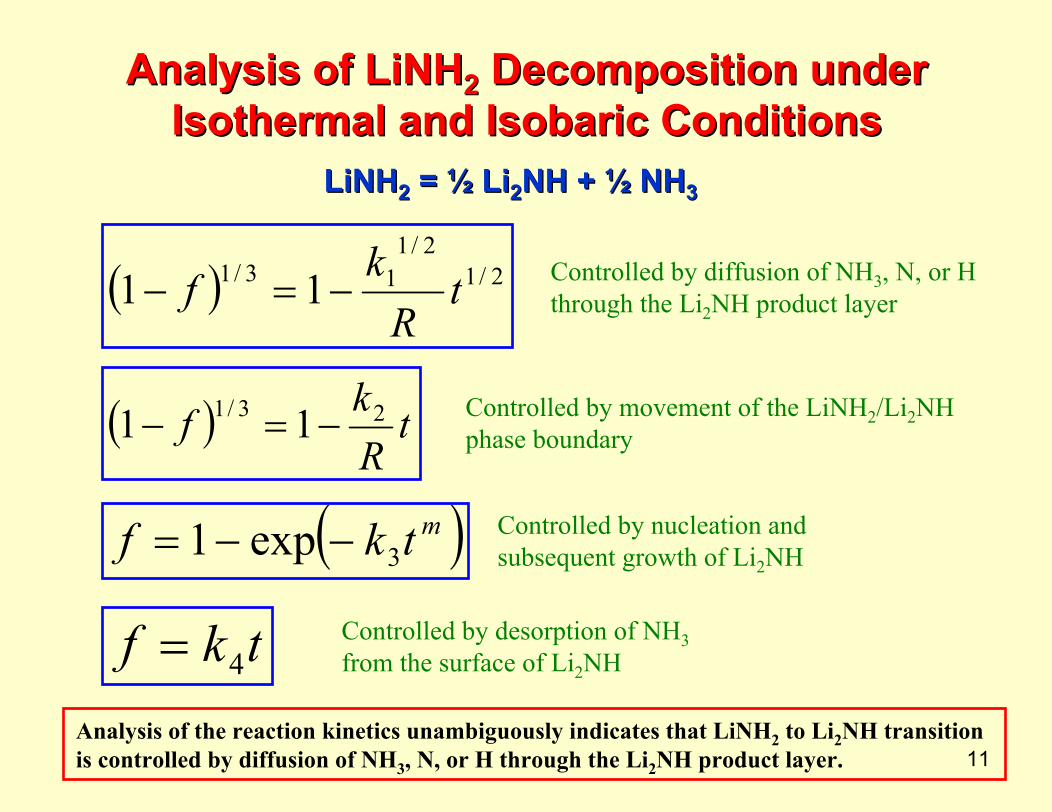
Analysis of LiNHAnalysis of LiNH22 Decomposition under Decomposition under Isothermal and Isobaric ConditionsIsothermal and Isobaric Conditions
Controlled by diffusion of NH3, N, or H through the Li2NH product layer( ) 2/1
2/113/1 11 tRk
f −=−
( ) tRkf 23/1 11 −=−
( )mtkf 3exp1 −−=
tkf 4=
LiNHLiNH22 = ½ Li= ½ Li22NH + ½ NHNH + ½ NH33
Controlled by movement of the LiNH2/Li2NH phase boundary
Controlled by nucleation and subsequent growth of Li2NH
Controlled by desorption of NH3from the surface of Li2NH
Analysis of the reaction kinetics unambiguously indicates that LiNH2 to Li2NH transition is controlled by diffusion of NH3, N, or H through the Li2NH product layer.

12
Summary of Enhancement of LiNHSummary of Enhancement of LiNH22 to to LiLi22NH and NHNH and NH33 TransitionTransition
1. Mechanical activation enhances the transition of LiNH2 to Li2NH and NH3, and reduces the onset temperature of the transition to room temperature.
2. Mechanical activation also decreases the apparent activation energy for decomposition of LiNH2. The more mechanical activation, the more reduction in the apparent activation energy.
3. The decomposition rate of LiNH2 to Li2NH and NH3 is controlled by diffusion of NH3, N, or H species through the Li2NH product layer.
1. Nano-engineering to decrease the diffusion distance.2. Increasing the composition gradient to enhance diffusion via advanced
catalysts.3. Increasing the diffusion coefficient to augment the diffusion rate via
mechanical activation and doping.
Challenges:Since decomposition of LiNH2 is the first step of dehydrogenation of the LiNH2 + LiH
mixture, how can we increase a diffusion-controlled decomposition to enhance dehydrogenation of the LiNH2 + LiH mixture? Three possible solutions are:
How can NH3 emission be avoided if the decomposition rate of LiNH2 has been increased substantially? The solution is:
Nano-engineering and mechanical activation to increase the reaction rate between LiH and NH3.
13
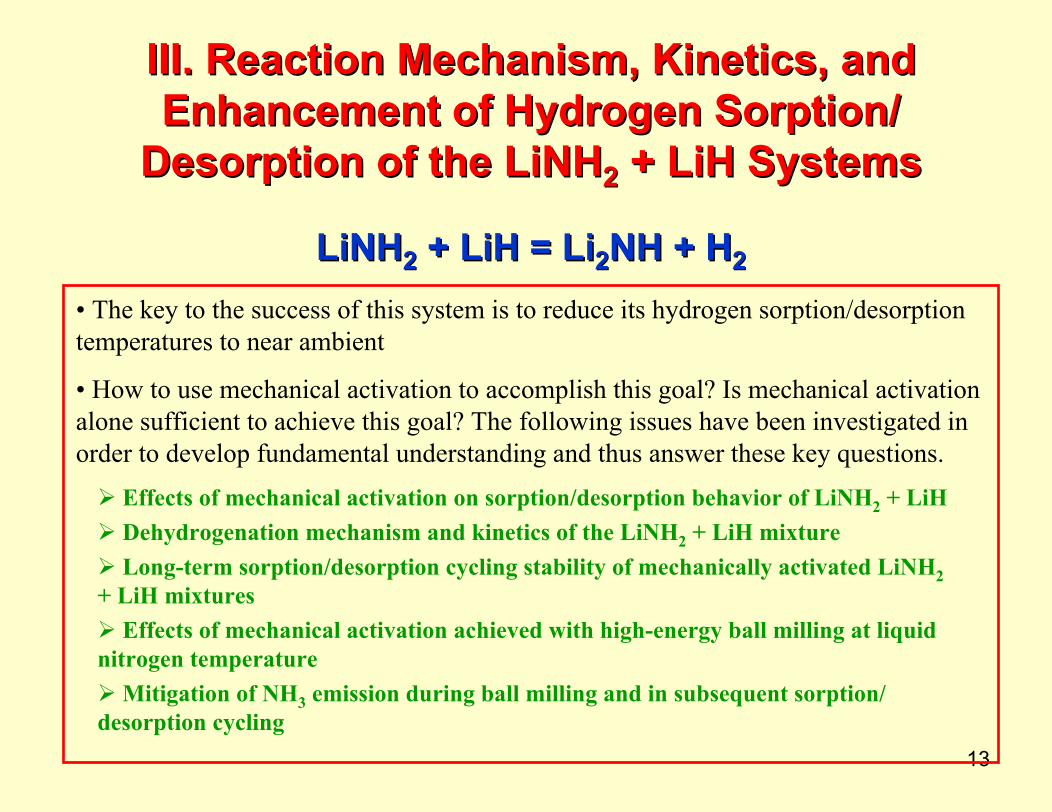
III. Reaction Mechanism, Kinetics, and III. Reaction Mechanism, Kinetics, and Enhancement of Hydrogen Sorption/ Enhancement of Hydrogen Sorption/
DesorptionDesorption of the LiNHof the LiNH22 + + LiHLiH SystemsSystems
LiNHLiNH22 + + LiHLiH = Li= Li22NH + HNH + H22
• The key to the success of this system is to reduce its hydrogen sorption/desorptiontemperatures to near ambient
• How to use mechanical activation to accomplish this goal? Is mechanical activation alone sufficient to achieve this goal? The following issues have been investigated in order to develop fundamental understanding and thus answer these key questions.
Effects of mechanical activation on sorption/desorption behavior of LiNH2 + LiHDehydrogenation mechanism and kinetics of the LiNH2 + LiH mixtureLong-term sorption/desorption cycling stability of mechanically activated LiNH2
+ LiH mixturesEffects of mechanical activation achieved with high-energy ball milling at liquid
nitrogen temperatureMitigation of NH3 emission during ball milling and in subsequent sorption/
desorption cycling

14
Enhancement of Dehydrogenation of LiNHEnhancement of Dehydrogenation of LiNH22 + + LiHLiH Mixtures via Mechanical ActivationMixtures via Mechanical Activation
90
92
94
96
98
100
102
104
0 100 200 300 400 500 600
Temperature (0C)
Wei
gth
(%)
No milling
Milled for 180 min @ RT
The onset temperature and the temperature for release of a large amount of H2 have been reduced substantially via ball milling.
The weight loss for the milled sample is about 5.5%, which is in excellent agreement with the theoretical prediction of Eq. (1) of Slide 7 if lithium oxides and 10% additional LiH in the starting powder mixture are considered.
The weight loss for the sample without milling is substantially larger than the theoretical prediction (~ 5.5 wt%). This is due to NH3 emission because of the incomplete reaction between ammonia and lithium hydride of Eq. (3) on Slide 7.
TGA Traces of LiNH2 + LiH
The TG analysis was conducted under a flowing argon condition with a heat rate of 100C/min.

15
Composition Analysis of the Effluent Gas from Composition Analysis of the Effluent Gas from LiNHLiNH22+LiH Mixtures during TG analysis+LiH Mixtures during TG analysis
The composition analysis of the effluent gas confirms that:
(i) the weight loss observed in the TGA trace of LiNH2 + LiH ball milled at RT for 180 min is due to hydrogen release;
(ii) there exists a small amount of NH3 in the effluent gas of LiNH2 + LiHwithout milling; this is especially true at temperatures between 400 and 6000C;
(iii) ball milling reduces the peak temperature for releasing H2 from 388 to 2500C; and
(iv) NH3 emission is a kinetic issue. Fast reaction between NH3 and LiH or slow generation of NH3 can all eliminate NH3 emission. See the next slide for more details.
1.00E-09
1.00E-08
1.00E-07
1.00E-06
1.00E-05
0 100 200 300 400 500 600 700 800
Temperature (OC)
Inte
nsity
(Tor
r.) H2
H2
OH*+NH3O2
N2
(a)
1.00E-09
1.00E-08
1.00E-07
1.00E-06
1.00E-05
0 100 200 300 400 500 600 700 800
Temperature (oC)
Inte
nsity
(Tor
r.) H2
H2O
O2
OH*+NH3 N2
(b)With milling for 180 min at RT
Without milling

16
Comparisons in the Ammonia Level of the Comparisons in the Ammonia Level of the Effluent Gas Among Different LiNHEffluent Gas Among Different LiNH22+LiH +LiH
Mixtures during TG analysisMixtures during TG analysis
0.00E+00
5.00E-11
1.00E-10
1.50E-10
2.00E-10
2.50E-10
3.00E-10
1 2 3 4A
mm
onia
Lev
el, t
orr/m
g
Quantification of the NH3 concentration in the effluent gas is based on analysis of the intensity of the signal at the mass-to-charge ratio of 17 from a mass spectrometer. The intensity of Mass 17, IMass 17, constitutes two components: the intensity of NH3
+ and the intensity of OH+:
The intensity of OH+ is also related to the intensity of H2O+ species:
Thus, the intensity of NH3+ species can be
calculated from
OHMass
NHMassMass III 17
31717 +=
1831717 212.0 Mass
NHMassMass III +=
1817317 212.0 MassMass
NHMass III −=
LiNH2 with 180 min milling
LiNH2+LiH without milling
LiNH2+LiH with 180
min milling
MgH2without milling
The data above shows that (i) the LiNH2–only sample exhibits the highest NH3 intensity because there is no LiH to “capture” NH3; (ii) the LiNH2+LiH mixture without ball milling displays the second highest NH3 intensity because of slow reaction between LiH and NH3; and (iii) the NH3 intensity for the LiNH2+LiH mixture with ball milling drops dramatically (by about 36 times); As a result, this intensity becomes lower than the detection limit of the mass spectrometer because MgH2 does not have NH3, but exhibits an NH3 intensity of 8.4 x 10⁻¹² Torr/mg MgH2.

17
Mechanical Activation Decreases Apparent Mechanical Activation Decreases Apparent Activation Energies of Various ReactionsActivation Energies of Various Reactions
0
50
100
150
200
250
300
0 200 400 600 800 1000 1200 1400 1600
Milling Time, min
Act
ivat
ion
Ener
gy, k
J/m
ol
The activation energy decreases with increase in the milling time for all reactions.Reaction 2 of Slide 7 is the first step of Reaction 1. However, the apparent activation
energy of Reaction 1 is lower than that of Reaction 2, suggesting that the presence of LiH can reduce the activation energy of Reaction 2.
The activation energy is also affected by the milling and mixing sequence, supporting the notion that LiH does have the catalytic effect on Reaction 2.
The apparent activation energies were determined using the Kissinger method based on the peak position of the reaction as a function of the heating rate measured from DSC traces.
LiNH2 onlyLiNH2 + LiH(mixing & milling)
LiNH2 + LiH(milling & mixing)
18
Identification of Reaction Mechanisms Identification of Reaction Mechanisms and Quantification of Reaction Kinetics of and Quantification of Reaction Kinetics of
LiNHLiNH22 + + LiHLiH Systems Systems
0
1
2
3
4
5
6
7
14 15 16 17 18 19
Time (hr)
Co
mp
osi
sito
n (
wt%
H2)
240C285C
0
1
2
3
4
5
6
7
0 10 20 30 40Time (hr)
Co
mp
osi
sito
n (
wt%
H2)
240C285C
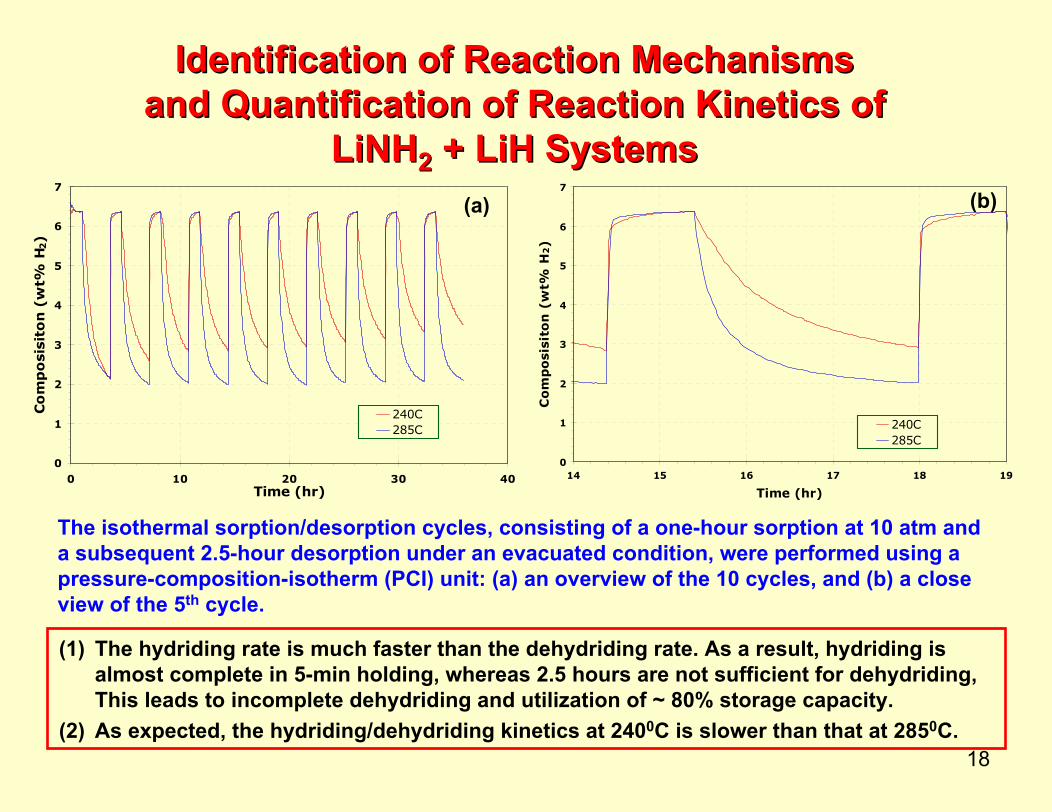
The isothermal sorption/desorption cycles, consisting of a one-hour sorption at 10 atm and a subsequent 2.5-hour desorption under an evacuated condition, were performed using a pressure-composition-isotherm (PCI) unit: (a) an overview of the 10 cycles, and (b) a close view of the 5th cycle.
(1) The hydriding rate is much faster than the dehydriding rate. As a result, hydriding is almost complete in 5-min holding, whereas 2.5 hours are not sufficient for dehydriding, This leads to incomplete dehydriding and utilization of ~ 80% storage capacity.
(2) As expected, the hydriding/dehydriding kinetics at 2400C is slower than that at 2850C.
(a) (b)
19
Mechanisms of the Mechanisms of the DehydridingDehydriding Reaction of Reaction of LiNHLiNH22 + + LiHLiH SystemsSystems
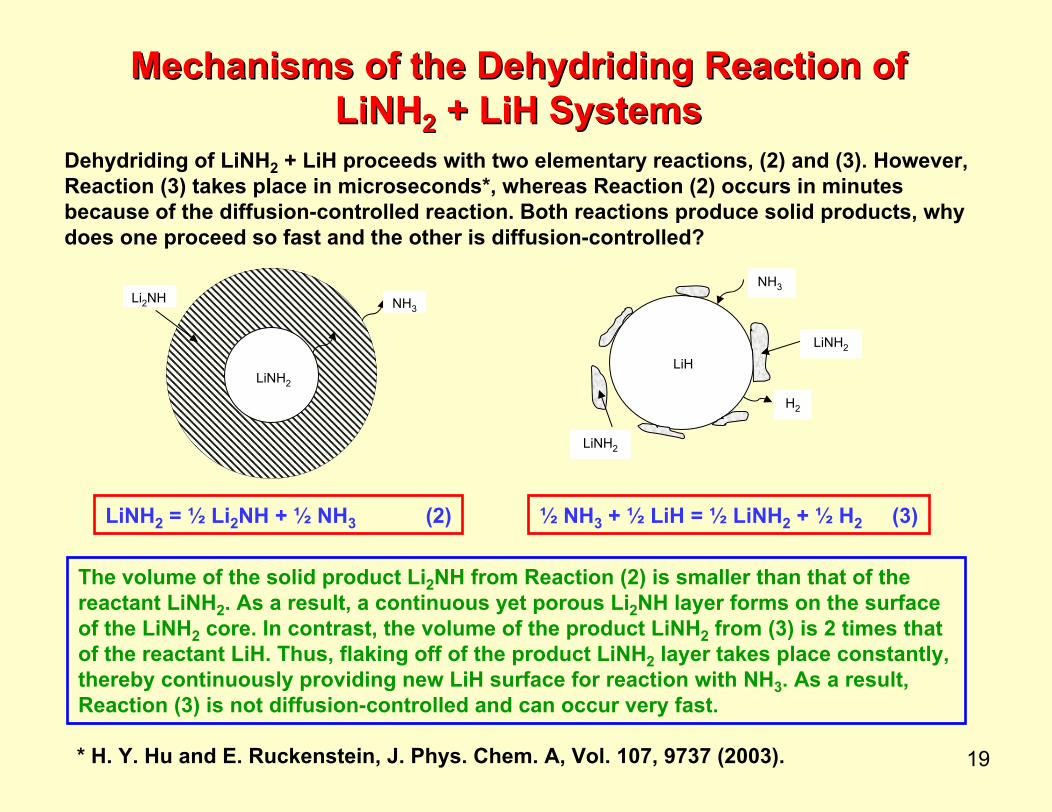
Dehydriding of LiNH2 + LiH proceeds with two elementary reactions, (2) and (3). However, Reaction (3) takes place in microseconds*, whereas Reaction (2) occurs in minutes because of the diffusion-controlled reaction. Both reactions produce solid products, why does one proceed so fast and the other is diffusion-controlled?
LiNH2
Li2NH NH3
LiHLiNH2
LiNH2
H2
NH3
LiNH2 = ½ Li2NH + ½ NH3 (2) ½ NH3 + ½ LiH = ½ LiNH2 + ½ H2 (3)
The volume of the solid product Li2NH from Reaction (2) is smaller than that of the reactant LiNH2. As a result, a continuous yet porous Li2NH layer forms on the surface of the LiNH2 core. In contrast, the volume of the product LiNH2 from (3) is 2 times that of the reactant LiH. Thus, flaking off of the product LiNH2 layer takes place constantly, thereby continuously providing new LiH surface for reaction with NH3. As a result, Reaction (3) is not diffusion-controlled and can occur very fast.
* H. Y. Hu and E. Ruckenstein, J. Phys. Chem. A, Vol. 107, 9737 (2003).
20
Reaction Pathway of Reaction Pathway of DehydridingDehydriding of of LiNHLiNH22 + + LiHLiH SystemsSystems
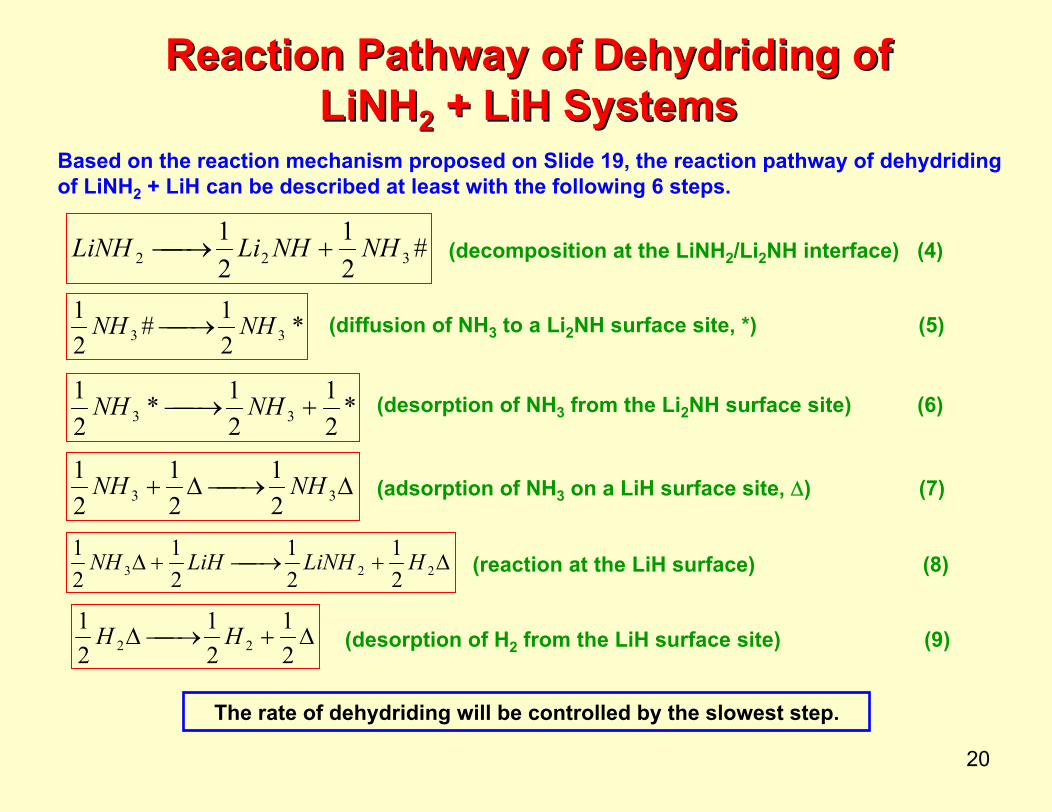
Based on the reaction mechanism proposed on Slide 19, the reaction pathway of dehydridingof LiNH2 + LiH can be described at least with the following 6 steps.
(decomposition at the LiNH2/Li2NH interface) (4)#21
21
322 NHNHLiLiNH +⎯→⎯
*21#
21
33 NHNH ⎯→⎯
*21
21*
21
33 +⎯→⎯ NHNH
Δ⎯→⎯Δ+ 33 21
21
21 NHNH
Δ+⎯→⎯+Δ 223 21
21
21
21 HLiNHLiHNH
Δ+⎯→⎯Δ21
21
21
22 HH
(diffusion of NH3 to a Li2NH surface site, *) (5)
(desorption of NH3 from the Li2NH surface site) (6)
(adsorption of NH3 on a LiH surface site, Δ) (7)
(reaction at the LiH surface) (8)
(desorption of H2 from the LiH surface site) (9)
The rate of dehydriding will be controlled by the slowest step.

21
0
0.2
0.4
0.6
0.8
1
1.2
0 25 50 75 100
t1/2, sec1/2
(1 -
f' f)1/
3
The analysis reveals that the fraction of H2 released, f, as a function of time, t, can be described well by a parabolic-rate law derived from Fick’s second law:
The 5th desorption at 2400C, R2 = 0.99
The 5th desorption at 2850C, R2 = 0.93
Reaction Kinetics of Reaction Kinetics of DehydridingDehydriding of of LiNHLiNH22 + + LiHLiH SystemsSystems
Reactions (7), (8) and (9) should proceed very fast because they are elementary steps of Reaction (3). Thus, the desorption rate shown on Slide 18 has been analyzed for 4 possible rate-limiting steps: (i) movement of the LiNH2/Li2NH phase boundary, (ii) diffusion of NH3, N, or H through the Li2NH layer, (iii) nucleation and growth of Li2NH into the LiNH2 core, and (iv) desorption of NH3 from the Li2NH surface.
where f’ is the fraction of H2 released at the end of the desorption cycle, R the average radius of LiNH2 particles, and k5 a constant related to the diffusion coefficient, D.
253/ 1)1( tR
ff ⋅−=⋅−11 k
Conclusions:
1. The rate-limiting step for dehydriding of LiNH2 + LiHis diffusion of NH3, N, or H through the Li2NH product layer.
2. The activation energy for diffusion is very low (only 19.3 kJ/mol).
22
LongLong--Term Cycling Stability of Mechanically Term Cycling Stability of Mechanically Activated LiNHActivated LiNH22 + + LiHLiH
0
1
2
3
4
5
6
7
0 50 100 150 200Time (hr)
Co
mp
osi
sito
n (
wt%
H2)
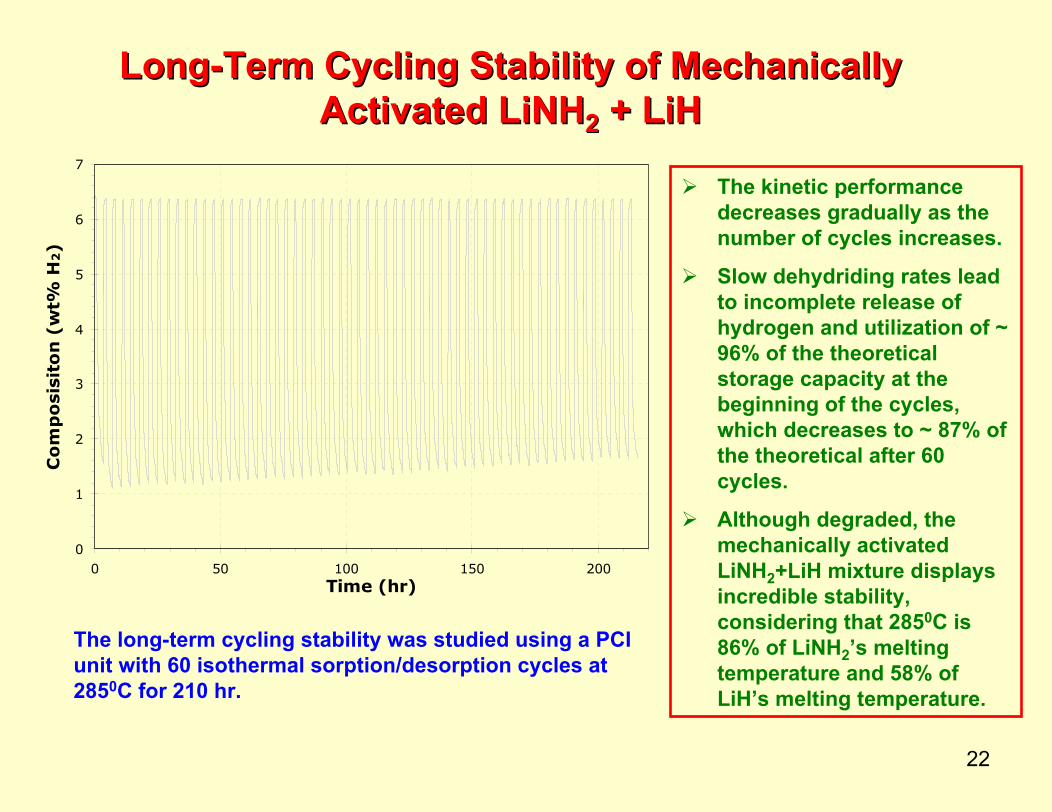
The long-term cycling stability was studied using a PCI unit with 60 isothermal sorption/desorption cycles at 2850C for 210 hr.
The kinetic performance decreases gradually as the number of cycles increases.
Slow dehydriding rates lead to incomplete release of hydrogen and utilization of ~ 96% of the theoretical storage capacity at the beginning of the cycles, which decreases to ~ 87% of the theoretical after 60 cycles.
Although degraded, the mechanically activated LiNH2+LiH mixture displays incredible stability, considering that 2850C is 86% of LiNH2’s melting temperature and 58% of LiH’s melting temperature.
23
0.01
0.1
1
10
100
-1 0 1 2 3 4 5
Composition (wt%
Post Long Term Cycling - AbsorptionPost Long Term Cycling - DesorptionAs Milled - AbsorptionAs Milled - Desorption
PressurePressure--CompositionComposition--Isotherms before and after 60 Isotherms before and after 60 Sorption/Sorption/DesorptionDesorption Cycles of Mechanically Activated Cycles of Mechanically Activated
(LiNH(LiNH22+LiH+5vol% graphite) Systems+LiH+5vol% graphite) Systems
Log
H2 (b
ars)
Composition (wt% H2)
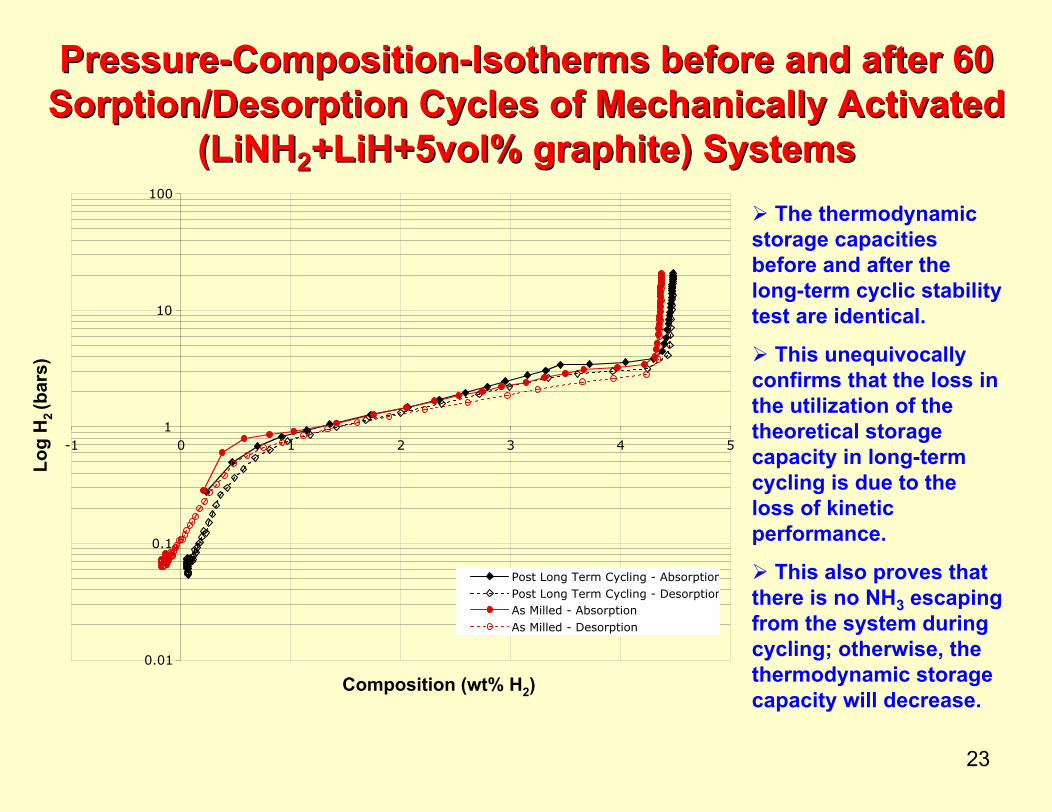
The thermodynamic storage capacities before and after the long-term cyclic stability test are identical.
This unequivocally confirms that the loss in the utilization of the theoretical storage capacity in long-term cycling is due to the loss of kinetic performance.
This also proves that there is no NH3 escaping from the system during cycling; otherwise, the thermodynamic storage capacity will decrease.
24
0.0
5.0
10.0
15.0
20.0
25.0
0 10 20 30 40 50 60 70
Absorption-Desorption Cycles
Gra
in S
ize [
nm
]
Pure - LiNH2
Pure - LiH0
10
20
30
40
50
60
0 10 20 30 40 50 60 70
Absorption-Desorption cycles
SSA
(m2 /g
)Mechanisms of LongMechanisms of Long--Term Cycling Stability of Term Cycling Stability of
Mechanically Activated LiNHMechanically Activated LiNH22 + + LiHLiH
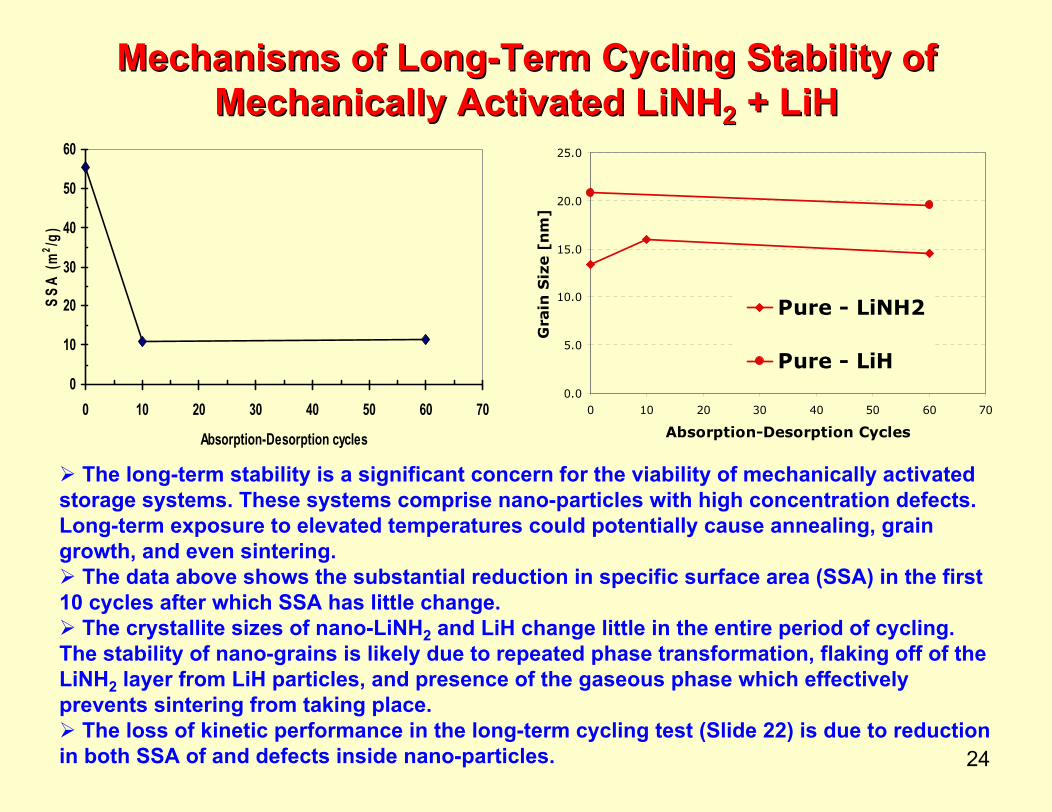
The long-term stability is a significant concern for the viability of mechanically activated storage systems. These systems comprise nano-particles with high concentration defects. Long-term exposure to elevated temperatures could potentially cause annealing, grain growth, and even sintering.
The data above shows the substantial reduction in specific surface area (SSA) in the first 10 cycles after which SSA has little change.
The crystallite sizes of nano-LiNH2 and LiH change little in the entire period of cycling. The stability of nano-grains is likely due to repeated phase transformation, flaking off of the LiNH2 layer from LiH particles, and presence of the gaseous phase which effectively prevents sintering from taking place.
The loss of kinetic performance in the long-term cycling test (Slide 22) is due to reduction in both SSA of and defects inside nano-particles.
25
Enhancement of Hydrogen Sorption/Enhancement of Hydrogen Sorption/DesorptionDesorptionof LiNHof LiNH22 + + LiHLiH Systems through Mechanical Systems through Mechanical Activation at Liquid Nitrogen TemperatureActivation at Liquid Nitrogen Temperature
0
1
2
3
4
5
6
7
0 5 10 15 20 25 30 35 40
Time [hr]
Co
mp
osi
tio
n [
wt%
H2]
RT MillLN2 MillCycling Temperature = 2850C
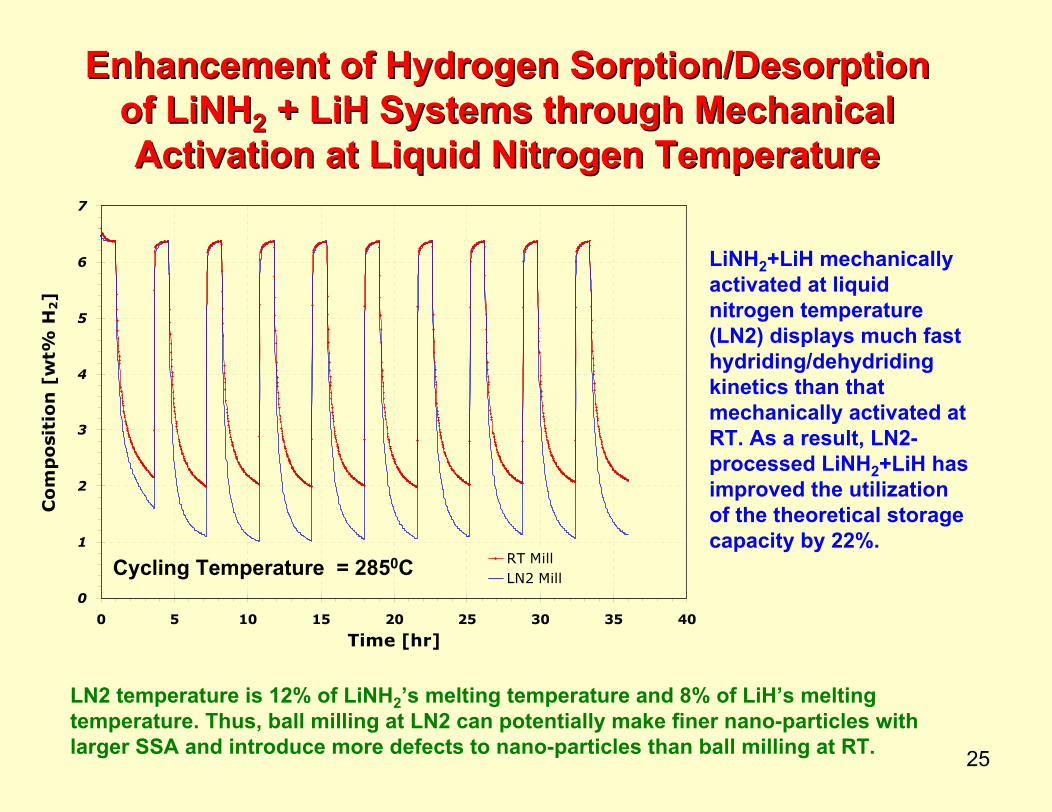
LiNH2+LiH mechanically activated at liquid nitrogen temperature (LN2) displays much fast hydriding/dehydridingkinetics than that mechanically activated at RT. As a result, LN2-processed LiNH2+LiH has improved the utilization of the theoretical storage capacity by 22%.
LN2 temperature is 12% of LiNH2’s melting temperature and 8% of LiH’s melting temperature. Thus, ball milling at LN2 can potentially make finer nano-particles with larger SSA and introduce more defects to nano-particles than ball milling at RT.
26
Mechanisms of Enhanced Hydrogen Mechanisms of Enhanced Hydrogen Sorption/Sorption/DesorptionDesorption through Mechanical through Mechanical
Activation at Liquid Nitrogen TemperatureActivation at Liquid Nitrogen Temperature
0
5
10
15
20
25
Room Temp Dry Ice Liquid N2Milling Temperature
Cry
sta
llit
e S
ize
[n
m]
LiNH2LiH
0
10
20
30
40
50
60
180 min mill at RT 180 min mill at LN2
SSA
(m2 /g
)
0
0.2
0.4
0.6
0.8
1
1.2
0 20 40 60 80 100 120
t1/2 (sec1/2)
(1 -
f' f)1/
3
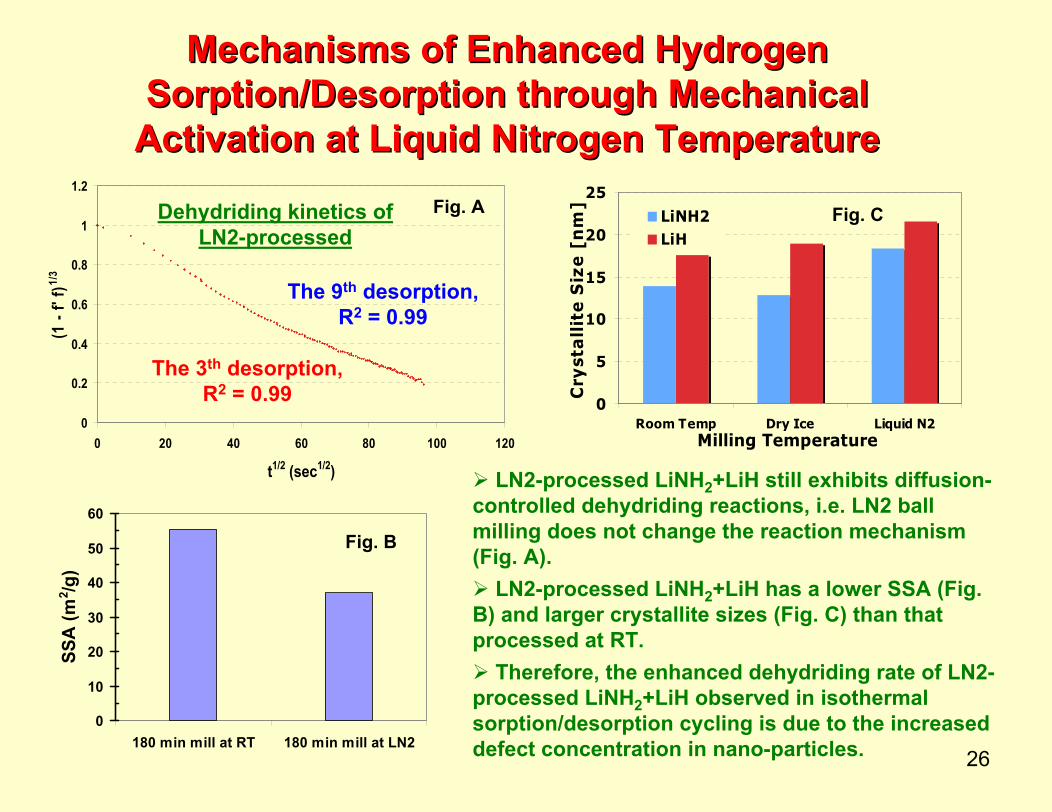
LN2-processed LiNH2+LiH still exhibits diffusion-controlled dehydriding reactions, i.e. LN2 ball milling does not change the reaction mechanism (Fig. A).
LN2-processed LiNH2+LiH has a lower SSA (Fig. B) and larger crystallite sizes (Fig. C) than that processed at RT.
Therefore, the enhanced dehydriding rate of LN2-processed LiNH2+LiH observed in isothermal sorption/desorption cycling is due to the increased defect concentration in nano-particles.
Fig. A Fig. C
Fig. B
The 9th desorption, R2 = 0.99
Dehydriding kinetics of LN2-processed
The 3th desorption, R2 = 0.99
27
0.01
0.1
1
10
100
0 1 2 3 4 5 6
Composition (wt.% H2)
Pres
sure
(atm
)
45min milling at RT180min milling at RT 180min milling at LN2
Effects of the Degree of Mechanical Activation Effects of the Degree of Mechanical Activation on Sorption/on Sorption/DesorptionDesorption PropertiesProperties
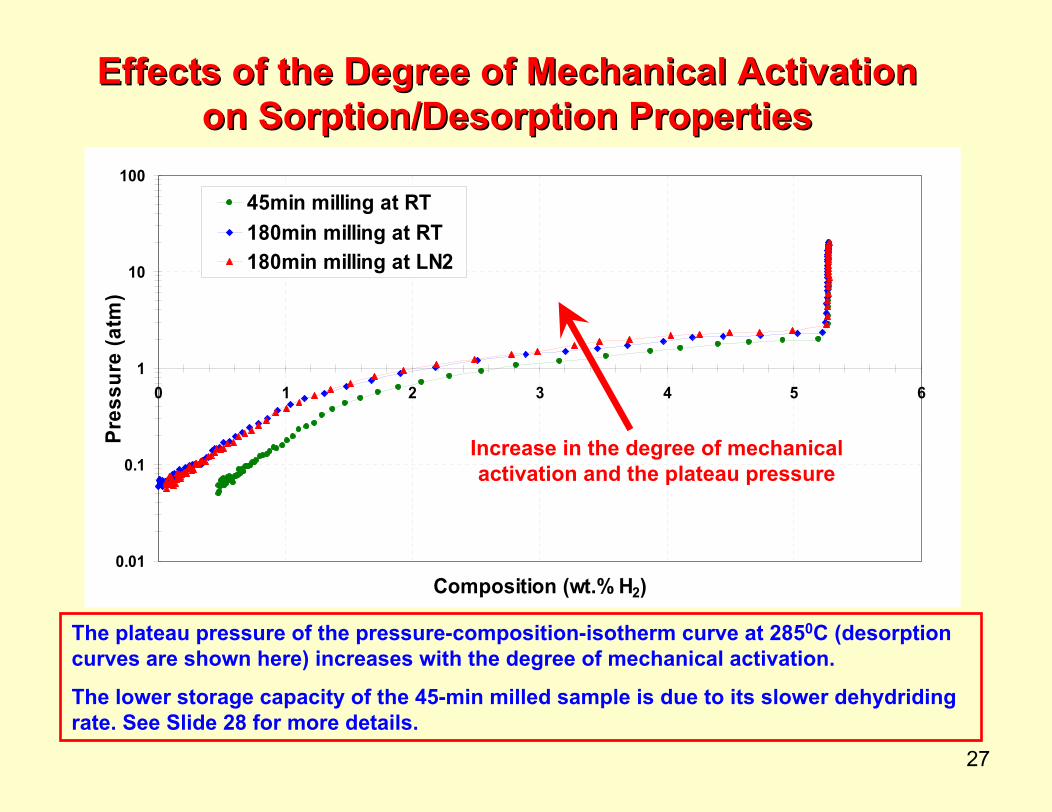
The plateau pressure of the pressure-composition-isotherm curve at 2850C (desorptioncurves are shown here) increases with the degree of mechanical activation.
The lower storage capacity of the 45-min milled sample is due to its slower dehydridingrate. See Slide 28 for more details.
Increase in the degree of mechanical activation and the plateau pressure

28
0.4
0.5
0.6
0.7
29000 30000 31000 32000 33000 34000
Time, second
Pres
sure
, atm
Effects of Effects of DesorptionDesorption Kinetics on the Kinetics on the DesorptionDesorption Isotherm Isotherm
0.5
0.6
0.7
0.8
0.9
1
1.1
1.2
1.3
21000 22000 23000 24000 25000
Time, second
Pres
sure
, atm
45min milling
180min milling
45min milling
180min milling
ΔP = 0.423
ΔP = 0.250
ΔP = 0.430
ΔP = 0.220
Desorption isotherms are measured by decreasing pressure step by step and letting pressure approach equilibrium in each step. 100% equilibrium will never be reached because it takes extremely long time to accomplish that for each step. As a result, the measurement condition and the desorption rate of the material will determine the percentage of equilibrium being reached, and ΔP in each pressure change step will determine how much H2 has been released in each step. Summation of all the steps gives the hydrogen storage capacity.
The analysis of ΔP in each pressure change step indicates that when pressure is at or above 1 atm (Fig. A), hydrogen released in each step is similar for 45min and 180min milled samples. However, when pressure is below 1 atm (Fig. B) the 45min milled sample releases less hydrogen in each step than the 180min milled sample (Fig. B). As a result, 45min milled sample shows less storage capacity (Slide 27).
Fig. A
Fig. B
29
III. Atomic Level Understanding of Effects of III. Atomic Level Understanding of Effects of Mechanical Activation via NMRMechanical Activation via NMR
Shield
Sample tube
RF coil
Vacuum
Liquid helium 4 Kelvin
Superconducting solenoid
Liquid nitrogen 77 Kelvin
RF circuit
To NMR processors
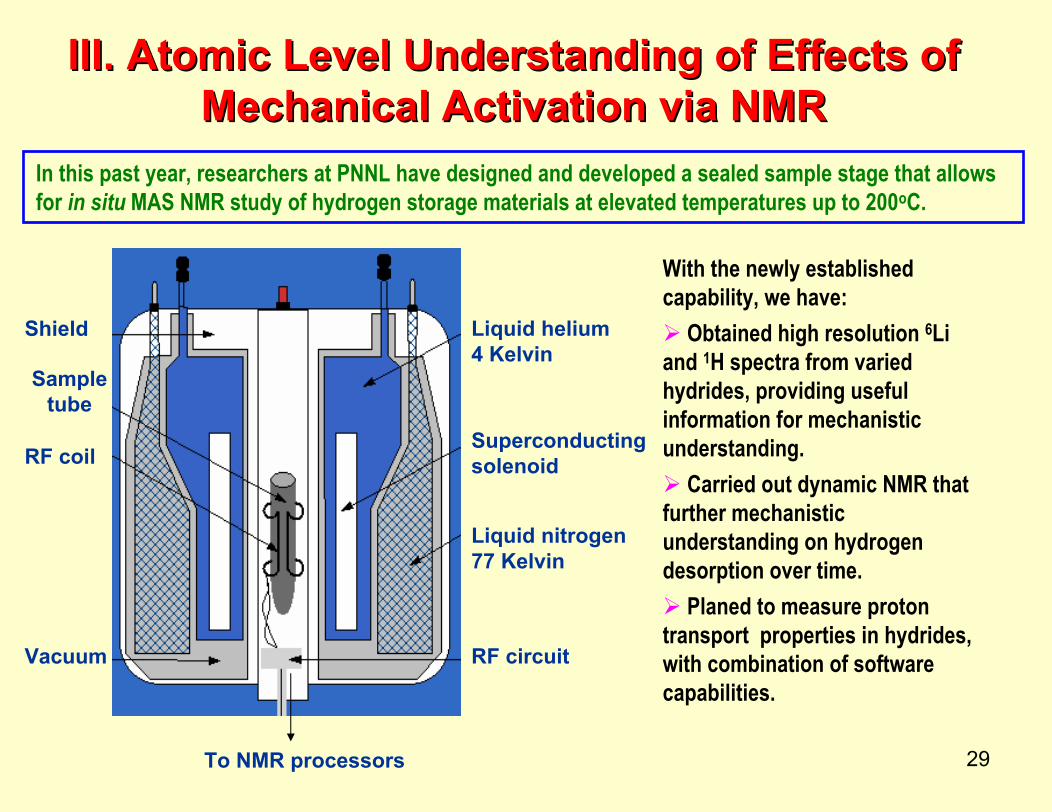
With the newly established capability, we have:
Obtained high resolution 6Li and 1H spectra from varied hydrides, providing useful information for mechanistic understanding.
Carried out dynamic NMR that further mechanistic understanding on hydrogen desorption over time.
Planed to measure proton transport properties in hydrides, with combination of software capabilities.
In this past year, researchers at PNNL have designed and developed a sealed sample stage that allows for in situ MAS NMR study of hydrogen storage materials at elevated temperatures up to 200oC.
30
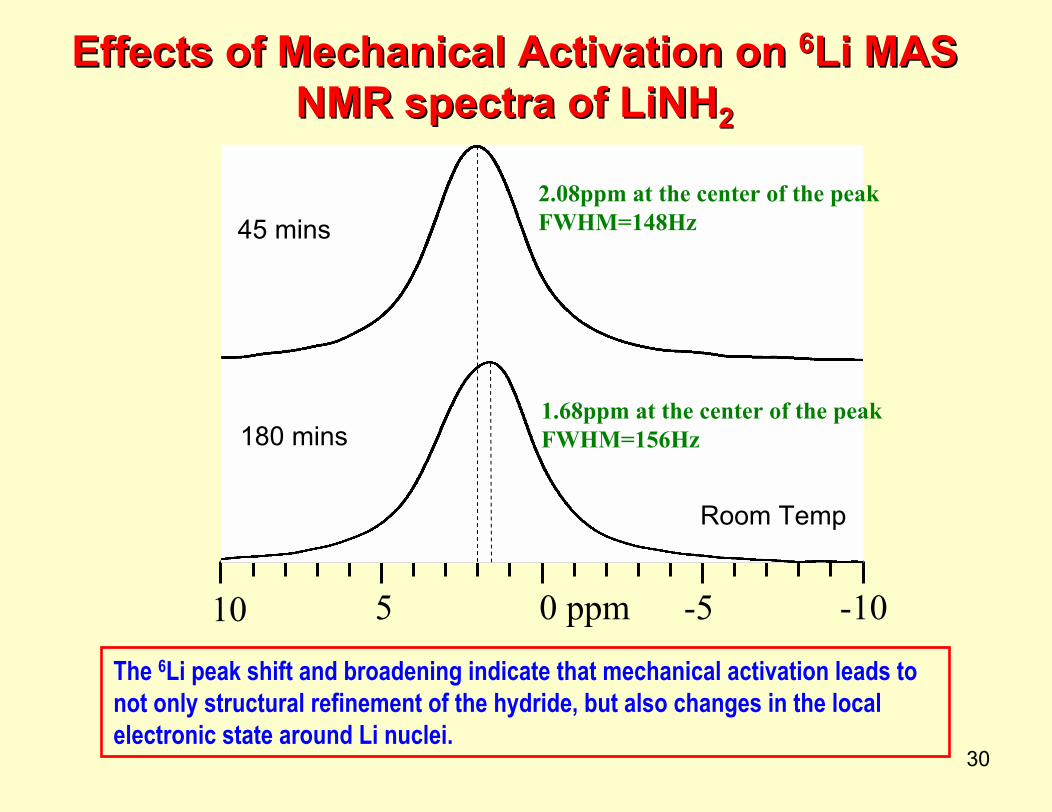
Effects of Mechanical Activation on Effects of Mechanical Activation on 66Li MAS Li MAS NMR spectra NMR spectra of LiNHof LiNH22
-10-50 ppm5
LiNH2 45 minutes mill
LiNH2 180 minutes mill
2.08ppm at the center of the peakFWHM=148Hz
1.68ppm at the center of the peakFWHM=156Hz
45 mins
180 mins
Room Temp
10
The 6Li peak shift and broadening indicate that mechanical activation leads to not only structural refinement of the hydride, but also changes in the local electronic state around Li nuclei.

31
-2-1.00ppm
No. 40
No. 31
No. 1
1
-50050ppm
NH3 strongly surface-adsorbed
1 5 10 15 20 25 30 35 40Spectral Index No
Phyisorbed NH3with certain motion freedom
Some gaseousNH3 formed
Increased peak height and FWHM
Dynamic In Situ Dynamic In Situ 11H MAS NMRH MAS NMRDynamic in situ 1H NMR was carried out in a closed sample tube at 50oC as a function of holding time with an acquiring time of 0.5 hour for each spectrum on LiNH2 milled at RT for 180 minutes. The study indicates the ammonia formed and strongly physisorbed on the surface first, then accumulated and gained motion freedom to become a gas phase.
32
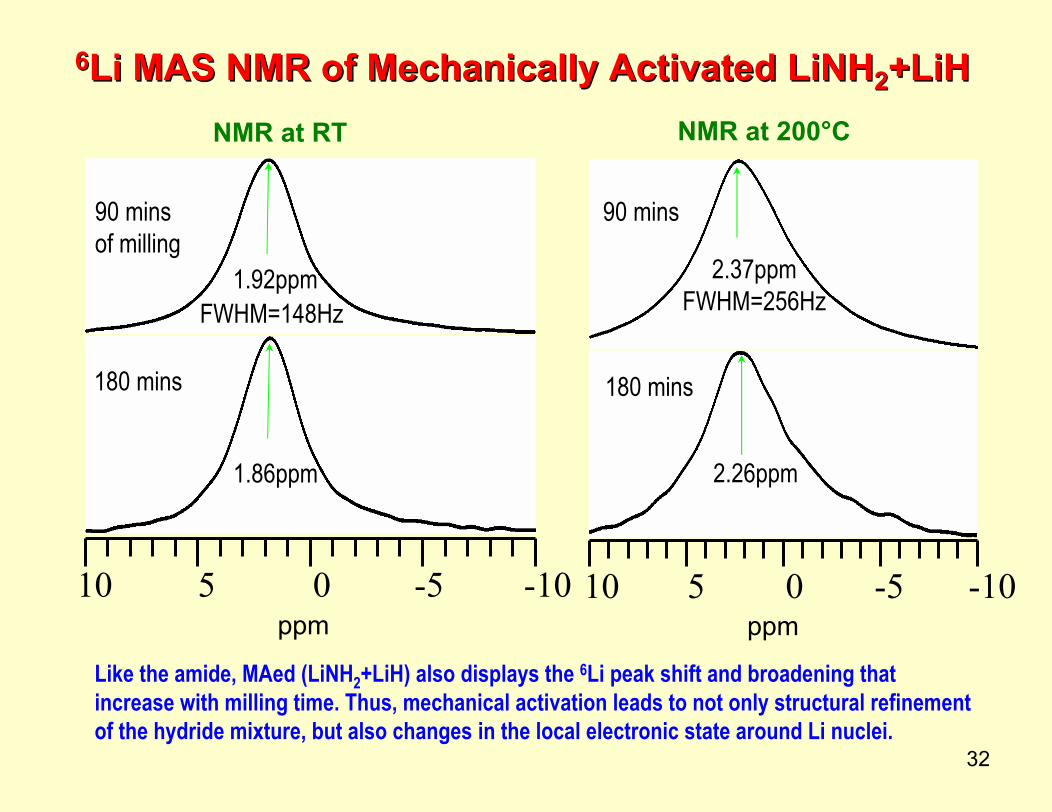
66Li MAS NMR of Mechanically Activated Li MAS NMR of Mechanically Activated LiNHLiNH22+LiH+LiH
-10-50510
2.37ppmFWHM=256Hz
2.26ppm
90 mins
180 mins
ppm
NMR at 200°C
-10-50510
90 minsof milling
1.92ppmFWHM=148Hz
180 mins
1.86ppm
ppm
NMR at RT
Like the amide, MAed (LiNH2+LiH) also displays the 6Li peak shift and broadening that increase with milling time. Thus, mechanical activation leads to not only structural refinement of the hydride mixture, but also changes in the local electronic state around Li nuclei.
33
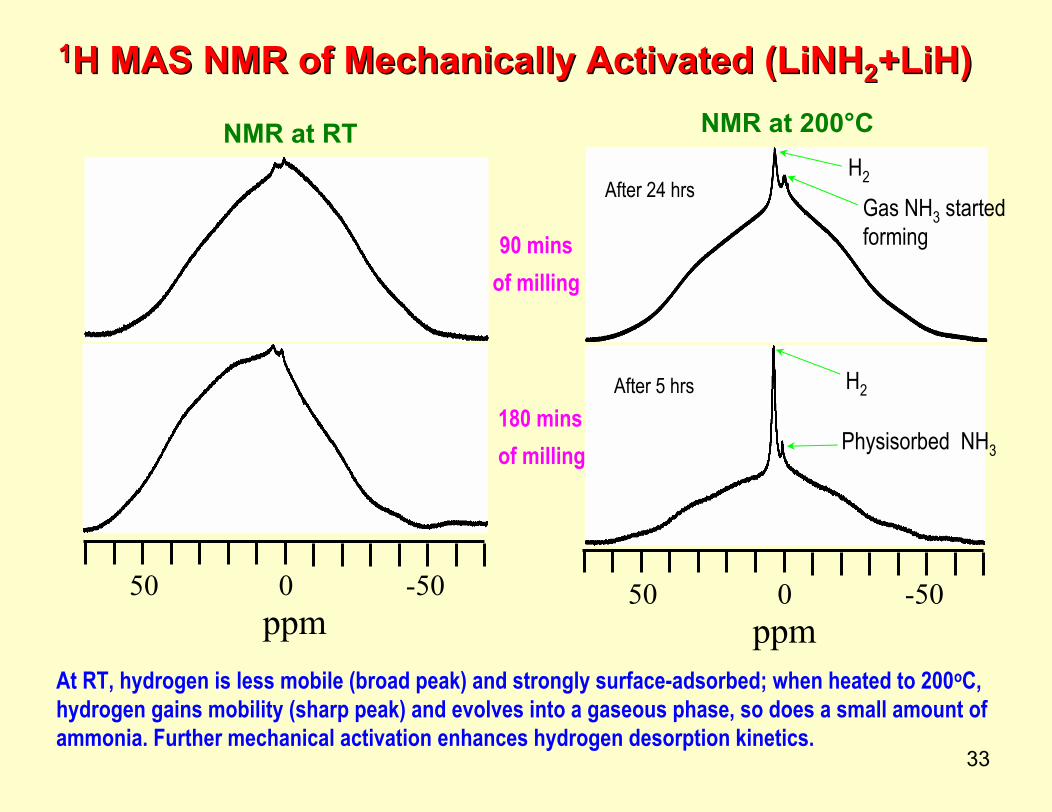
At RT, hydrogen is less mobile (broad peak) and strongly surface-adsorbed; when heated to 200oC, hydrogen gains mobility (sharp peak) and evolves into a gaseous phase, so does a small amount of ammonia. Further mechanical activation enhances hydrogen desorption kinetics.
11H MAS NMR of Mechanically Activated (H MAS NMR of Mechanically Activated (LiNHLiNH22+LiH)+LiH)
-50050ppm
-50050ppm
After 5 hrs H2
After 24 hrsGas NH3 started forming
H2
Physisorbed NH3
NMR at RT NMR at 200°C
90 minsof milling
180 minsof milling

34Spectral Index No.
1 5 10 15 20 25 30 35 401 5 10 15 20 25 30 35 401 5 10 15 20 25 30 35 40
H2
No.40
No.1
05 -510ppm
Strongly physisorbed
NH3
FWHM=342
FWHM=415
Dynamic In Situ Dynamic In Situ 11H MAS NMR on Mechanically H MAS NMR on Mechanically Activated (Activated (LiNHLiNH22+LiH)+LiH)
The dynamic 1H MAS (5.5 KHz) NMR was carried out at 180oC in a closed sample tube with an acquiring time of 0.6 hr for each spectrum. The study indicated that hydrogen gas formed at the very beginning and the desorption appeared to level off over the time; a small amount of NH3formed and strongly physisorbed on the surface at early stages and its release decreased over the time because of its reaction with LiH.
35
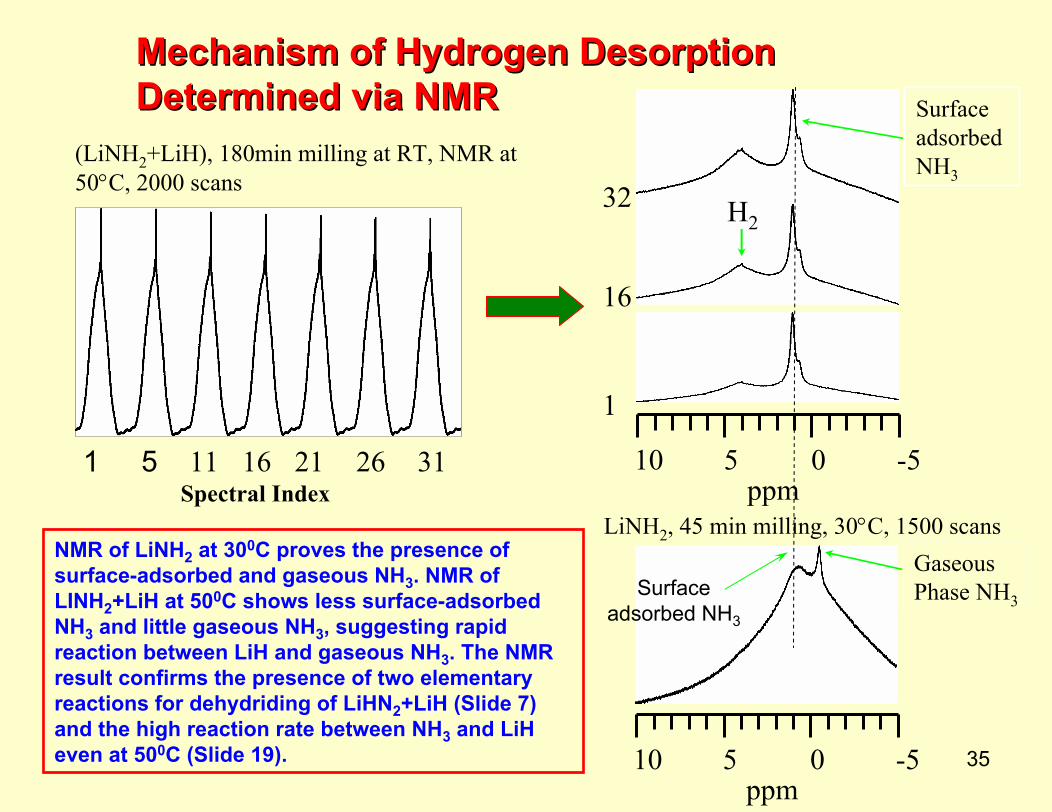
05 -510ppm
1
16
32 H2
Surfaceadsorbed NH3
05 -510ppm
Gaseous Phase NH3
(LiNH2+LiH), 180min milling at RT, NMR at 50°C, 2000 scans
Spectral Index1 5 16 21 3111 26
LiNH2, 45 min milling, 30°C, 1500 scans
Mechanism of Hydrogen Mechanism of Hydrogen DesorptionDesorptionDetermined via NMRDetermined via NMR
Surface adsorbed NH3
NMR of LiNH2 at 300C proves the presence of surface-adsorbed and gaseous NH3. NMR of LINH2+LiH at 500C shows less surface-adsorbed NH3 and little gaseous NH3, suggesting rapid reaction between LiH and gaseous NH3. The NMR result confirms the presence of two elementary reactions for dehydriding of LiHN2+LiH (Slide 7) and the high reaction rate between NH3 and LiHeven at 500C (Slide 19).

36
IV. Enhancement of Reaction Kinetics of IV. Enhancement of Reaction Kinetics of Mechanically Activated LiNHMechanically Activated LiNH22+LiH via +LiH via NanoNano--CeriaCeria
Addition of 1 mol% nano-ceria particles increases the hydriding/dehydriding rates.
Performance stability is improved too with the addition of nano-ceria because of the increased hydriding/dehydriding rates.
Analysis of the dehydriding kinetics indicates that the dehydriding reaction of the ceria-containing system is still diffusion-controlled. Thus, it is hypothesized that ceria is a catalyst that enhances desorption of NH3 from the Li2NH surface and thus creates a large composition gradient for diffusion within the Li2NH solid.
0
1
2
3
4
5
6
7
0 5 10 15 20 25 30 35 40Time (hr)
Co
mp
osi
sito
n (
wt%
)
Pure
Ceria

37
Future Work Future Work • Remainder of FY 2007:
• FY 2008:
Develop understanding of the mechanism responsible for the enhanced performance of LiH + LiNH2 mechanically activated at LN temperature (UConn)
Extend the NMR analysis of mechanically activated LiH + LiNH2 to cycled samples to obtain atomic level understanding of the change due to isothermal cycling (PNNL)
Study proton transport properties in hydrides with different degrees of mechanical activation via NMR (PNNL)
Further enhance hydriding/dehydriding rates and improve performance stability of LiH + LiNH2 by integrating mechanical activation, thermodynamic destabilization, and ceria-addition (UConn)
Shift the material system from LiNH2+LiH to LiBH4-based materials (UConn & PNNL)
Apply the understanding learned from LiNH2+LiH to LiBH4-based materials(UConn & PNNL)
Work with HRL Laboratories to enhance hydriding/dehydriding rates of LiBH4-based materials by integrating thermodynamically destablization and mechanical activation (UConn & PNNL)

38
Project Summary Project Summary Relevance: Explore fundamental mechanisms related to mechanical
activation necessary for improving kinetics of reversible hydrogen storage materials.
Approach: Investigate hydriding/dehydriding properties of LiNH2+LIH materials with different degrees of mechanical activation; Enhance storage performance based on the understanding developed.
Technical Accomplishments: (i) Established the effect of mechanical activation, including (a) reducing the onset temperature for dehydriding to room temperature, (b) enhancing hydriding/dehydriding rates at high temperatures (240 and 2850C), (c) increasing the plateau pressure of the sorption/desorption isotherm, (d) enhancing reaction between LiH and NH3 and thus alleviating NH3 emission issue; (ii) Identified the reaction mechanism and rate-controlling step in the dehydriding process; (iii) Demonstrated the unusual long-term sorption/desorption cycling stability of mechanically activated hydrogen storage materials; (iv) Developed atomic level understanding of the effect of mechanical activation; (v) Provedlow temperature milling can introduce a large amount of defects tonano-particles, which in turn can dramatically enhance hydriding
39
Technical Accomplishments (cont.): and dehydriding reactions even though particle sizes are larger and surface areas are smaller, and (vi) Enhanced hydriding/dehydriding performance of LiNH2+LiH systems via integration of mechanical activation and advanced catalysts to solve the rate-limiting step problem.
Future Research: (i) Further development of fundamental understanding of mechanisms of mechanical activation;
(ii) Further enhancement of hydriding/dehydriding properties viaintegration of mechanical activation, advanced catalysts, and thermodynamic destabilization;
(iii) Application of the understanding developed from the LiNH2+ LiH system to LiBH4-based systems.
Project Summary (Cont.)Project Summary (Cont.)