Effectiveness of Capital Outflow · PDF file · 2014-01-21This paper examines the...
34
WP/14/8 Effectiveness of Capital Outflow Restrictions Christian Saborowski, Sarah Sanya, Hans Weisfeld, and Juan Yepez
Transcript of Effectiveness of Capital Outflow · PDF file · 2014-01-21This paper examines the...

WP/14/8
Effectiveness of Capital Outflow Restrictions
Christian Saborowski, Sarah Sanya,
Hans Weisfeld, and Juan Yepez

© 2014 International Monetary Fund WP/14/8
IMF Working Paper
Strategy, Policy, and Review Department
Effectiveness of Capital Outflow Restrictions
Prepared by Christian Saborowski, Sarah Sanya, Hans Weisfeld, and Juan Yepez
Authorized for distribution by Ranil Salgado
January 2014
Abstract
This paper examines the effectiveness of capital outflow restrictions in a sample of 37 emerging
market economies during the period 1995-2010, using a panel vector autoregression approach
with interaction terms. Specifically, it examines whether a tightening of outflow restrictions
helps reduce net capital outflows. We find that such tightening is effective if it is supported by
strong macroeconomic fundamentals or good institutions, or if existing restrictions are already
fairly comprehensive. When none of these three conditions is fulfilled, a tightening of
restrictions fails to reduce net outflows as it provokes a sizeable decline in gross inflows,
mainly driven by foreign investors.
JEL Classification Numbers: F3, F65, E5
Keywords: Capital flows, Capital controls, Emerging economies
Authors’ E-Mail Addresses: [email protected], [email protected], [email protected],
and [email protected].
This Working Paper should not be reported as representing the views of the IMF.
The views expressed in this Working Paper are those of the author(s) and do not necessarily
represent those of the IMF or IMF policy. Working Papers describe research in progress by the
author(s) and are published to elicit comments and to further debate.

2
Contents Page
I. Introduction ............................................................................................................................3
II. Data and Empirical Approach ...............................................................................................7
III. Estimation Results .............................................................................................................14
IV. Robustness .........................................................................................................................25
V. Conclusion ..........................................................................................................................30
References ................................................................................................................................31
Tables
1. Country Sample .....................................................................................................................9
2. Definitions and Sources of Variables ....................................................................................9
3. Summary Statistics of Selected Variables, 1995-2010 ........................................................10
4. Outflow Restrictions (Schindler), 1995 and 2010 ...............................................................10
5. Selected Characteristics of Countries that use Outflow Controls ........................................11
Figures
1. Number of Emerging Market Countries Tightening Capital Outflow Restrictions, 1996-
2010..........................................................................................................................................11
2. Impulse Responses to an Unexpected Increase in the Outflow Controls Index ..................16
3a. Impulse Responses by Macroeconomic Fundamentals......................................................18
3b. Impulse Responses by Macroeconomic Fundamentals: Including Flows in Net Assets and
Net Liabilities as well as Gross Inflows and Gross Outflows Instead of Net Inflows.............19
4a. Impulse Responses by Government Effectiveness ............................................................21
4b. Impulse Responses by Government Effectiveness: Including Flows in Net Assets and Net
Liabilities as well as Gross Inflows and Gross Outflows Instead of Net Inflows ...................22
5a. Impulse Responses by Intensity of Capital Outflow Restrictions ......................................23
5b. Impulse Responses by Capital Control Intensity: Including Flows in Net Assets and Net
Liabilities as well as Gross Inflows and Gross Outflows Instead of Net Inflows ...................24
6a Robustness: Net Inflows Response to an Unexpected Increase in the Outflow Controls
Index for Good Macroeconomic Fundamentals ......................................................................27
6b Robustness: Net Inflows Response to an Unexpected Increase in the Outflow Controls
Index for High Government Effectiveness ..............................................................................28
6c. Robustness: Net Inflows Response to an Unexpected Increase in the Outflow Controls
Index for High Capital Control Intensity .................................................................................29
Boxes
1. Selected Country Experiences with Outflow Restrictions .....................................................5
3
I. INTRODUCTION1
1. There is a renewed interest among academics and policymakers in the use of
capital account restrictions for managing large and often volatile capital flows. In the
run-up to the global financial crisis, many countries, particularly in Central and Eastern
Europe, experienced capital inflow-fueled booms that initially led to appreciation pressures,
tied the hands of monetary policy makers, and, finally, resulted in busts as inflows dried up
or reversed. Such boom-bust cycles have hit a number of emerging market economies over
the years and often ended in protracted growth slowdowns (Reinhart and Reinhart, 2008).
Capital flow restrictions are one policy alternative that could help manage capital flows.2
2. The literature on capital account restrictions focuses on inflow restrictions
despite the fact that outflow restrictions could also be an effective policy tool. Several
studies have shown that in many cases a tightening of inflow restrictions successfully
reduced appreciation pressures, allowed for more independent monetary policy, and tilted the
composition of flows toward longer term investments (Dooley, 1996; Ariyoshi et al 2000;
Baba and Kokenyne 2011; Magud, Reinhart, and Rogoff, 2011; and Ostry et al, 2011). A
tightening of outflow restrictions, in turn, could help reduce net outflows once inflow
pressures reverse, providing time for more fundamental policy adjustment.
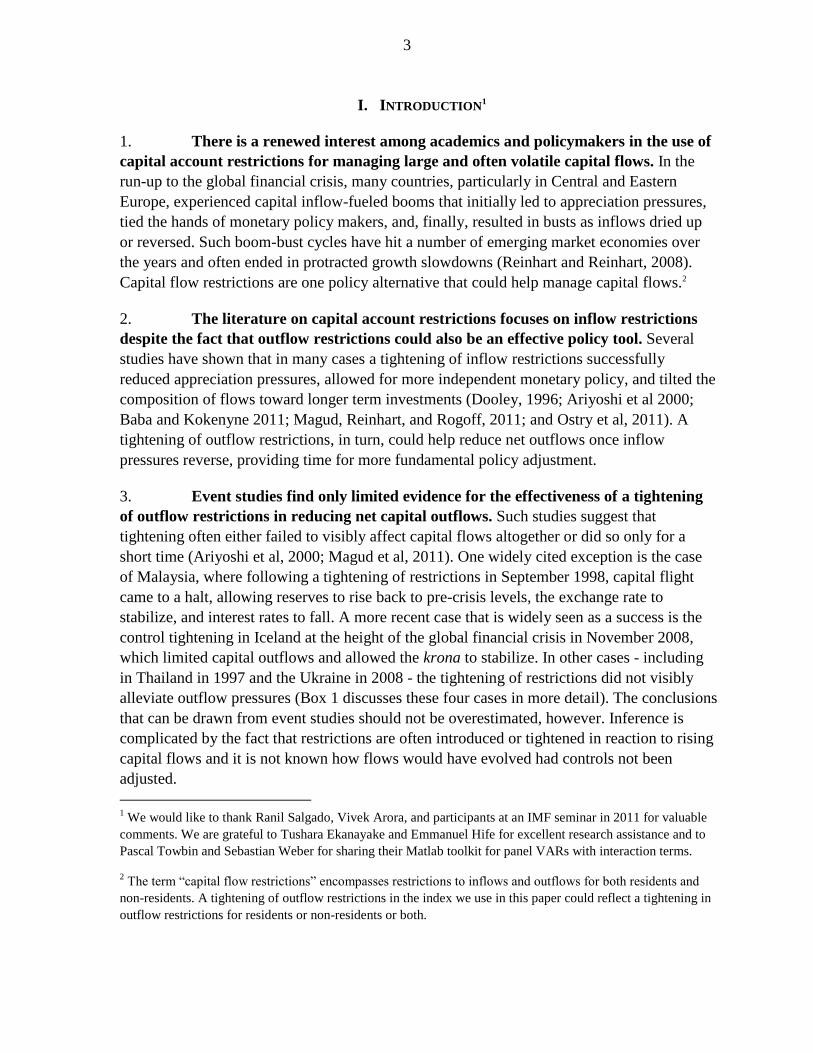
3. Event studies find only limited evidence for the effectiveness of a tightening
of outflow restrictions in reducing net capital outflows. Such studies suggest that
tightening often either failed to visibly affect capital flows altogether or did so only for a
short time (Ariyoshi et al, 2000; Magud et al, 2011). One widely cited exception is the case
of Malaysia, where following a tightening of restrictions in September 1998, capital flight
came to a halt, allowing reserves to rise back to pre-crisis levels, the exchange rate to
stabilize, and interest rates to fall. A more recent case that is widely seen as a success is the
control tightening in Iceland at the height of the global financial crisis in November 2008,
which limited capital outflows and allowed the krona to stabilize. In other cases - including
in Thailand in 1997 and the Ukraine in 2008 - the tightening of restrictions did not visibly
alleviate outflow pressures (Box 1 discusses these four cases in more detail). The conclusions
that can be drawn from event studies should not be overestimated, however. Inference is
complicated by the fact that restrictions are often introduced or tightened in reaction to rising
capital flows and it is not known how flows would have evolved had controls not been
adjusted.
1 We would like to thank Ranil Salgado, Vivek Arora, and participants at an IMF seminar in 2011 for valuable
comments. We are grateful to Tushara Ekanayake and Emmanuel Hife for excellent research assistance and to
Pascal Towbin and Sebastian Weber for sharing their Matlab toolkit for panel VARs with interaction terms.
2 The term “capital flow restrictions” encompasses restrictions to inflows and outflows for both residents and
non-residents. A tightening of outflow restrictions in the index we use in this paper could reflect a tightening in
outflow restrictions for residents or non-residents or both.

4
4. The few studies that analyze the workings of outflow restrictions
econometrically find some evidence in favor of their effectiveness in limited country
samples. Miniane and Rogers (2007) find capital flow restrictions to be ineffective in
insulating countries from foreign monetary policy shocks. However, this study does not
distinguish between inflow and outflow restrictions. Binici and others (2010) focus on
outflow restrictions and find that these are more effective in advanced economies than in
other countries, perhaps due, in part, to better institutional and regulatory quality.3 A concern
regarding this paper is that it treats capital flow restrictions as exogenously determined. Since
outflow restrictions tend to be introduced in response to rising capital outflows, a failure to
allow for endogeneity in the regressions would likely bias the results toward depicting
restrictions as less effective than they are.
3 Conversely, one could reasonably expect restrictions to be more effectively implementable in less developed
countries in which financial transactions are typically less complex financial markets are smaller.

5
Box 1. Selected Country Experiences with Outflow Restrictions
This Box examines the experiences of Thailand (1997), Malaysia (1998), the Ukraine (2008-09) and Iceland
(2008) with imposing or tightening capital outflow restrictions during crisis episodes. In all cases the desire of
the authorities to reduce capital outflows and stabilize exchange rates was a premier motive for the tightening.
Thailand
Faced with speculative attacks during the Asian crisis,
and amidst concerns that excessive interest rate hikes
would hamper economic activity, the Thai authorities
imposed capital flow restrictions in May 1997 to
restrict speculators’ access to funds denominated in
domestic currency. While these measures were mainly
aimed at foreign speculators, the restrictions also
affected residents. The measures included limits on
forward transactions, export surrender requirements,
and requirements for baht proceeds from sales of stocks
to be converted at the onshore exchange rate. The
implementation of these restrictions in Thailand did not
succeed in halting the depreciation of the exchange rate
(50 percent six months after implementation) and the
dramatic decline in reserves (20 percent six months
after implementation); interest rates continued to rise
after restrictions were implemented. Furthermore,
substantial differentials between offshore and onshore
rates provided incentives for investors to circumvent
the restrictions. The authorities had to abandon the peg
in July 1997, and lifted restrictions altogether in
January 1998 (Ariyoshi et al., 2000, and Edison and
Reinhart, 2000).
Malaysia
Amid concerns about the fragility of Malaysia’s
financial sector, the ringgit came under attack in the
fall of 1998. After trying to attenuate outflows by
increasing interest rates, the authorities imposed a
comprehensive set of restrictions in September 1998
that closed all legal channels for offshore trading of the
national currency. While these measures were mainly
aimed at foreign speculators, the restrictions also
affected residents. The restrictions included measures
to limit the international convertibility of the ringgit
such as a requirement of a 12-month waiting period for
non-residents to convert ringgit proceeds from the sale
of Malaysian securities (Ariyoshi et al., 2000, Abdelal
and Alfaro, 2003, and Sharma, 2003). The restrictions
provided room for the authorities to accumulate
reserves amid a stable exchange rate and enact policies
aimed at revitalizing the economy, such as reducing
interest rates.
Iceland
Following the onset of the global financial crisis in
2007-08 and the collapse of Iceland’s three largest
commercial banks — with very large short-term Source: IFS
Evolution of Economic Indicators Following Tightening of
Outflow Restrictions
(t=0 is month in which outflow control restrictions were tightened)
60
70
80
90
100
110
120
130
140
150
160
Malaysia Iceland Thailand Ukraine
t=0 6 months
Nominal Exchange Rates(Index=100 at t=0)
60
70
80
90
100
110
120
130
140
Malaysia Iceland Thailand Ukraine
t=0 6 months
International Reserves(Index=100 at t=0)
Nominal Interest Rates(Index=100 at t=0)
10
60
110
160
210
260
310
360
410
460
Malaysia Iceland Thailand Ukraine
t=0 6 months
6
foreign liabilities (600% of GDP) — the government introduced comprehensive outflow restrictions in
November 2008 to stabilize the exchange rate. Measures included restrictions on capital transactions for
residents and nonresidents alike, such as bans on the movement of capital with some exceptions below ISK 10
million and on the conversion of offshore krona to foreign exchange. Foreign exchange transactions with
respect to external trade remained unrestricted. The exchange rate stabilized shortly after restrictions were
imposed. The restrictions also provided room for a number of other stabilization policies including the easing of
monetary policy to help revitalize the economy. The authorities intend to lift restrictions gradually as conditions
allow.
Ukraine
The 2008 crisis affected Ukraine through a collapse of exports, a sharp deterioration of the terms of trade, and a
reversal of capital inflows, amidst vulnerabilities that were building up in the financial sector. At the peak of the
crisis, in an attempt to stem outflows and defend the exchange rate, the central bank introduced a number of
measures including the imposition of exchange restrictions and a 5-day waiting period for non residents to
convert hryvnia proceeds from investment transactions to foreign currency. While some measures may have
helped alleviate exchange rate pressures temporarily, they failed to alleviate a need for massive central bank
intervention (causing international reserves to plummet 30 percent six months after the tightening of exchange
restrictions). Policy slippages that constrained the government’s ability to restore confidence in the financial
system also undermined by the effectiveness of the capital flow restrictions.
5. This paper investigates econometrically whether, and under what conditions,
a tightening of outflow restrictions can be used effectively to reduce net capital
outflows. An additional criterion of effectiveness is the extent to which control tightening
facilitates exchange rate and interest rate stabilization, and allows policymakers to gain
monetary policy independence. The analysis covers a sample of 37 emerging market
economies during 1995-2010. We use a panel vector autoregression (PVAR) methodology to
allow for the endogeneity of capital flow restrictions. In order to identify conditions for
effectiveness, we follow Towbin and Weber (2011) and add interaction terms to the baseline
PVAR. The interaction terms are calculated as products between the right hand side variables
and indicators of structural characteristics that might determine the effectiveness of
restrictions. This allows us to compute impulse response functions that are conditional upon
these characteristics.
6. Candidate conditions include institutional quality, macroeconomic
fundamentals, and the tightness of pre-existing restrictions. This choice of conditions was
inspired in part by studies that conjectured that initial conditions such as solid
macroeconomic conditions (i.e., fiscal surpluses, low inflation, or robust GDP growth) or
strong institutions (i.e., political stability or government effectiveness) should receive part of
the credit for the fact that Malaysia got through its crisis better than many other countries
(Dornbusch, 2001, Hutchinson, 2001, and Johnson et al., 2006). The choice was also inspired
by the thought that restrictions may need to be fairly tight to be effective in the context of
rising economic strains that typically surrounds the tightening of outflow restrictions.

7
7. Our findings suggest that a tightening of outflow restrictions is effective if it
is supported by strong macroeconomic fundamentals or good institutions, or if pre-
existing restrictions are already fairly comprehensive.4 When estimating the PVAR in the
absence of any interaction terms, we find that a tightening of outflow restrictions on average
reduces gross capital outflows. However, there is also a contraction in gross inflows – mainly
driven by non-resident investors – which is larger in size than the contraction in outflows.
We thus find that for the average country, a tightening of outflow restrictions is ineffective as
net outflows increase as a result of it. However, adding interaction terms reflecting a variety
of structural country characteristics, we find that restrictions are effective if important
preconditions are in place: in countries with good macroeconomic fundamentals, a tightening
of restrictions leads to a sizable reduction in net capital outflows. This result is robust to a
variety of specification changes. Similarly, a tightening of restrictions is effective in
countries with strong institutions, although our findings are slightly less clear cut and robust
in this case. Finally, restrictions are effective if the outflow control index is already fairly
high at the time of control tightening; in other words, restrictions work if they attain a
sufficiently comprehensive level. When none of these three conditions is fulfilled, a
tightening of restrictions is ineffective.
8. The paper does not investigate the impact of long-standing restrictions on
capital flows, nor does it assess the benefits and costs of capital flow management
measures. Klein (2012) finds some empirical evidence that longstanding inflow restrictions
are effective in lowering values of variables associated with financial vulnerability. We are
not aware of similar work on longstanding outflow restrictions.
9. The paper is organized as follows: Section II presents the data and our empirical
approach. Section III presents the estimation results, section IV discusses robustness, and
Section V concludes.
II. DATA AND EMPIRICAL APPROACH
10. The analysis covers 37 emerging markets that were chosen based on data
availability (Table 1). In particular, for a country to be included in our sample, quarterly data
for the period 1995Q1-2010Q4 had to be available for all major variables in our model.5 We
measure outflow restrictions using Fund staff’s narrow de jure restrictiveness index.6
4 The three findings are independent of each other.
5 The sample has been selected on the basis of data availability at the required frequencies. An important
criterion has been the start of the data set before the Asian financial crisis during which a variety of emerging
market economies implemented capital outflow restrictions in order to prevent capital flight. We exclude
countries with capital control indices that were zero throughout the sample period.
6 The index was used in the studies underpinning the IMF’s new institutional view on capital controls:
http://www.imf.org/external/pubs/ft/survey/so/2012/POL120312A.htm.

8
Building on the index proposed by Schindler (2009), this index distinguishes outflow from
inflow restrictions and is available for a large sample of countries over an extended period of
time.7 Table 2 provides definitions and sources, Table 3 presents summary statistics of
selected variables, and Table 4 shows outflow restrictions based on the Schindler index for
the countries in our sample.
11. The paper uses net capital flow concepts in line with standard IFS
terminology, and gross capital flow concepts following Schindler (2009). IFS classifies
net capital inflows as the sum of net flows of assets and net flows of liabilities. Net flows of
assets is the sum of outward FDI, portfolio investment assets, and other investment assets;
net flows of liabilities the sum of inward FDI, portfolio investment liabilities, and other
investment liabilities.8 In the literature, net flows of assets is often called “gross outflows,”
and net flows of liabilities “gross inflows.” This terminology can be confusing, however,
since it allows “gross inflows” and “gross outflows” to be either positive or negative, while
normally gross concepts cannot be negative. In this paper, we therefore use crude measures
of gross inflows and gross outflows. In the absence of a better alternative, we follow
Schindler (2009) in assuming that any net inflow of assets (liabilities) represents a gross
inflow of assets (liabilities) of the same magnitude, and that any net outflow of assets
(liabilities) represents a gross outflow of assets (liabilities) of the same magnitude. We thus
define gross flows as follows: gross inflows reflects inflows of funds related to changes in
the holdings of assets and liabilities, subject to the adjustment that when changes in assets or
liabilities give rise to an outflow, the respective flow is set to zero (formally: gross inflows =
max (net assets flows, 0) + max (net liabilities flows, 0)). Similarly, gross outflows reflects
outflows of funds related to changes in the holdings of assets and liabilities, subject to the
adjustment that when changes in assets or liabilities give rise to an inflow, the respective
flow is set to zero (formally: gross outflows = max (-net assets flows, 0) + max (-net
liabilities flows, 0)). Gross in- and outflows will thus never be negative.
7 The index uses publicly available information from the IMF’s Annual Report on Exchange Arrangements and
Exchange Restriction (AREAER). It exploits the IMF’s post 1996 disaggregated reporting of different
categories of capital transactions. The difference between the Schindler index and staff’s narrow restrictiveness
index is that the former includes a limited qualitative assessment of restrictions while the latter does not. For the
period of the availability of the Schindler index (up to 2005), the correlation between the two indices is
92 percent. As the index is only available at annual frequency, the annual value was assigned for each quarter in
that year.
8 In IFS, all entries under assets denote net transactions between residents and non-residents concerning claims
on non-residents; and all entries under liabilities denote net transactions between residents and non-residents
concerning claims on residents. For all asset components and all liabilities components, a positive sign signals
an inflow into the home economy while a negative sign denotes an outflow.

9
Table 1. Country Sample
Table 2. Definitions and Sources of Variables
Argentina Iceland Poland
Armenia India Romania
Bangladesh Indonesia Russia
Bolivia Israel South Africa
Brazil Jordan Sri Lanka
Bulgaria Kazakhstan Thailand
Chile Korea Philippines
China Latvia Turkey
Colombia Lithuania Ukraine
Croatia Malaysia Venezuela
Czech Republic Mexico Singapore
Estonia Morocco
Hungary Peru
Variable Description Source
Net inflows Net assets plus net liabilities, in percent of GDP IMF, IFS
Outflow/Inflow control indices Index of Financial Openness: IMF staff compilation
ranges 0-1, from least to most regulated based on Schindler (2009)
Industrial production index Seasonally adjusted IMF, IFS
Interest rate Nominal, three months Haver Analytics
Real GDP In 2005 US dollars IMF, WEO
Inflation End of period, percent change IMF, WEO
Real exchange rate USD per LCU (CPI based) IMF, IFS
Institutional quality Government effectiveness World Bank, WGI
Macroeconomic fundamentals Growth IMF, WEO
Inflation IMF, WEO
Fiscal balance, in percent of GDP IMF, WEO
Current account, in percent of GDP IMF, WEO
Capital market size Stock market capitalization, in percent of GDP Standard & Poor's

10
Table 3. Summary Statistics of Selected Variables, 1995-2010
Table 4. Outflow Restrictions (Schindler), 1995 and 2010
Variable Mean Standard 10th 25th 50th 75th 90th
Deviation Percentile Percentile Percentile Percentile Percentile
Outflow control index 0.6 0.4 0.0 0.3 0.8 1.0 1.0
Net inflows/GDP 3.1 11.1 -5.0 -0.7 1.4 6.6 12.8
Gross inflows/GDP 10.1 19.3 0.0 1.1 4.8 12.3 21.1
Gross outflows/GDP 7.0 17.4 0.0 0.3 2.0 6.7 12.8
Net assets/GDP -5.4 18.6 -1.6 0.1 1.7 5.9 13.7
Net liabilitites/GDP 8.5 19.5 -1.0 0.8 4.1 11.2 20.0
Macro fundamentals index 16.0 5.3 9.0 12.3 16.3 19.8 22.5
o/w GDP growth (y/y percent change) 3.5 4.8 -2.7 1.1 4.2 6.4 8.9
Inflation (y/y percent change) 6.5 6.3 0.1 2.3 6.5 8.9 10.9
Current account surplus (as a share of GDP) -0.1 1.9 -2.0 -1.1 -0.3 0.7 2.2
Fiscal surplus (as a share of GDP) -2.4 4.4 -7.3 -4.8 -2.8 -0.5 2.6
Government effectiveness index 0.3 0.7 -0.6 -0.2 0.1 0.7 1.2
1995 2010 1995 2010
Argentina 0.33 0.83 Korea 0.67 0.00
Armenia 0.50 0.00 Latvia 0.00 0.00
Bangladesh 0.50 0.83 Lithuania 0.00 0.33
Bolivia 0.00 0.67 Malaysia 0.83 1.00
Brazil 0.25 0.67 Mexico 0.42 0.83
Bulgaria 0.83 0.00 Morocco 0.58 1.00
Chile 0.83 0.50 Peru 0.00 0.00
China 0.83 1.00 Poland 0.58 1.00
Colombia 0.75 0.83 Romania 0.83 1.00
Croatia 0.67 0.58 Russia 0.75 0.00
Czech Republic 0.67 0.75 South Africa 0.80 0.17
Estonia 0.00 0.00 Sri Lanka 0.00 0.17
Hungary 0.83 0.60 Thailand 0.75 0.92
Iceland 0.00 0.92 Philippines 0.80 1.00
India 0.83 1.00 Turkey 0.75 1.00
Indonesia 0.20 0.50 Ukraine 0.42 0.83
Israel 0.58 0.00 Venezuela 0.80 1.00
Jordan 0.58 0.00 Singapore 0.17 0.33
Kazakhstan 0.67 1.00

11
12. A deterioration of
macroeconomic conditions or a
reduction in net inflows typically
precedes the use of outflow controls.
Table 5 lists 24 periods of significant
outflow control tightening in our sample.
About two thirds of theses are associated
with deterioration in macroeconomic
conditions and/or net capital outflows.
Further, Figure 1 illustrates that control
tightening episodes tend to cluster around
crisis periods such as the Asian crisis, the
Argentinean economic crisis and the global
financial crisis.
Table 5. Selected Characteristics of Countries that use Outflow Controls
Country
Outflow Control
Tightening
Episodes
Crisis (curr or +/-
1 period) Net flows
Preexisting
control
1/ 3/ 5/ 6/
Argentina 1997 1
2001 1 1 1
2002 1 1 1
2003-2004 1 1
Bangladesh 1997 1
Bolivia 2007/2
Brazil 1997-1998 1 1
2000
2003 1 1
2009 1 1
Bulgaria 1997 1 1
2001 1 1
Chile 1997 1 1 1
2008/2
China 1997 1 1
2000 1 1
Colombia 1997 1 1 1
1999 1 1 1
2004 1
Croatia 1996 1 1
1999 1 1
2003 1 1 1
2007 1 1
2008 1 1
Czech Republic 1996/2
1 1 1
2003/2
Macroeconomic
Fundamental
4/
Figure 1. Number of Emerging Market Countries Tightening
Capital Outflow Restrictions, 1996-2010
0
5
10
15
20
25
30
1996 1998 2000 2002 2004 2006 2008 2010
Number of EMs tightening outf low controls
Asian crisis
The global financialcrisisArgentine Economic
crisis

12
Table 5 cont. Selected Characteristics of Countries that use Outflow Controls
Country
Outflow Control
Tightening
Episodes
Crisis (curr or +/-
1 period) Net flows
Preexisting
control
1/ 3/ 5/ 6/
Hungary 1997 1 1
2005/2
2006 1
Iceland 2000
2008 1 1 1
2009 1 1 1
India 1997 1 1
Indonesia 1997 1 1 1
2000 1 1
2008 1
Israel 1997 1 1
Kazhakstan 1996, 1997 1 1
Korea 1997 1 1 1
1998 1 1 1
2005 1 1
Lithuania 2008/2
Malaysia 1997 1 1
Mexico 1996/2
1
1997 1 1
2005 1 1
Morroco 1996 1
1997 1
2002/2
1 1
Poland 1997 1 1
2004 1 1 1
2009 1 1
Romania 1996, 1997 1 1 1
Russia 1997 1 1
2004/2
1
South Africa 1997 1 1
Sri Lanka 1996 1 1
Thailand 1997 1 1 1
2004/2
1 1
Philippines 1996 1 1
1997 1 1 1 1
Turkey 1997 1
1998 1 1
2001 1 1
2005 1
Venezuela 1997 1 1
2007 1
Singapore 1997/2
1
1998
2000
2008 1 1
Macroeconomic
Fundamental
4/
1/ Column 1 shows the years in which there was at least a one standard deviation increase in Outflow index (OCI).
2/ There was an increase in Outflow index (OCI) by more than 10% although this was less than one standard deviation.
3/ The country experienced a systemic, debt, or currency crisis either during, the year before or after the year of imposition of outflow countrols.
Data on crisis is from 'IMF Working Paper "Systemic Banking Crises Database: An Update" Luc Laeven and Fabian Valencia (2012)
4/ "1" is a deterioration in macrofundamentals during or in the year before the outflow control tightening episode.
5/ "1" is a decrease in net flow by at least 1 standard deviation during or in the year before the outflow control tightening episode.
6/ "1" means the level of the OCI at the time of the outflow control tightening episode is above the sample median.

13
13. The baseline model is a PVAR that includes the capital control index
alongside important controls such as a variety of capital flow variables. This approach,
previously used by Miniane and Rogers (2007), allows treating all variables as potentially
endogenous.9 In particular, in the baseline panel VAR, we assume that the relationships
between the variables of interest are governed by a system of structural equations that,
ignoring the constant term, can be written as:
(1)
where is a vector of endogenous variables including, in the benchmark
specification, the outflow control index, industrial production, the interest rate, inflation, the
local currency/USD exchange rate as well as a variable capturing net capital flows as a share
of GDP (Table 2).10 The net capital flow variable is selectively replaced by gross inflows and
gross outflows as well as net flows of assets and net flows of liabilities in different
specifications to gain a better understanding of how a control tightening affects inflows and
outflows as well flows of resident and non-resident investments. Here, = 1, … , is the
number of lags of the endogenous variables included in the VAR, is a vector of
shocks assumed to be uncorrelated with one another, and is a matrix of
coefficients.
14. Impulse response functions are identified by means of a Choleski ordering
according to which capital flow restrictions can affect all variables contemporaneously
with the exception of output. The Choleski ordering embodies assumptions about
contemporaneous relationships between the endogenous variables in the PVAR. Our baseline
ordering is as follows: 1) output, as captured by industrial production, 2) capital outflow
control index, 3) real exchange rate, 4) interest rate, 5) inflation, and 6) net capital flows. In
this ordering, capital flows are allowed to respond contemporaneously to changes in capital
flow restrictions while capital flow restrictions are assumed to respond to changes in flows
only with a lag. This ordering reflects the view that well-administered restrictions should be
fully effective immediately, on the other hand, the decision to use outflow restrictions takes
more time. A case could also be made for an ordering in which capital flows affect
restrictions contemporaneously and restrictions affect flows only with a lag. This ordering,
while assuming quick policy decision-making, would allow for potential delays in measures
to become fully effective (this is plausible especially since we use a de jure rather than a de
9 Some studies of capital (inflow) restrictions tried to address endogeneity by using generalized methods of
moments (GMM). The consistency of GMM hinges on the assumption that instruments are not weak. This
assumption is violated when the variables show high persistence, as is the case for capital flow restrictions.
10 We use industrial production rather than GDP since for a number of countries GDP data are not available at
quarterly frequency.

14
facto index of restrictions) and for delays in responses by investors to changes in
restrictions.11 As both orderings thus have their respective merits, we test the robustness of
our results to this alternative ordering (and others).
15. We augment the baseline specification with interaction terms to determine
whether the response to a control tightening depends on structural country
characteristics and policies. The augmented PVAR is based on a panel interaction VAR
framework as in Towbin and Weber (2011). The framework can be understood as a
generalized panel VAR regression that allows the dynamic interaction between the
endogenous variables to vary deterministically with structural country characteristics. We
include candidates of structural characteristics in the matrix .12 The
indicator cc represents the index of capital control restrictiveness, and qi, and mf are,
respectively, indicators of institutional quality and the quality of macroeconomic
fundamentals. In particular, in (1) is no longer modeled as a matrix of coefficients
but is now given by
(2)
where and are matrices of coefficients. 13
In other words, the PVAR now
includes not only the right hand side variables of the baseline PVAR but also interaction
terms of each of these variables with the structural characteristics in , one at a time,
that might be conducive to more effective outflow restrictions. The system in (1) and (2) thus
allows conditioning the dynamic relationships between the endogenous variables in the
PVAR on a set of structural country characteristics. What is more, we can now derive
conditional impulse response functions that can be evaluated at different points of the sample
distribution of the respective structural characteristic. In particular, we can evaluate impulse
response functions to a control tightening at the 25th
and the 75th
percentile of each
indicator’s sample distribution to understand whether the effect of a control tightening is
indeed conditional upon the respective indicator.
III. ESTIMATION RESULTS
16. We begin the empirical analysis by estimating the PVAR in the absence of
any interaction terms. We estimate both the baseline PVAR and the augmented PVAR
using two lags and Runkle’s bootstrapping technique (Runkle, 1987).14 In order to allow for
11
Cardoso and Goldfajn (1997) assume that investors may take time to react to changes in restrictions.
12 All four components of are calculated as time-invariant country specific averages of the
respective country characteristics.
13 For a more detailed explanation on the estimation and inference procedure see Towbin and Weber (2011).
14 We test the robustness of our results to different lag structures in the robustness section.

15
the heterogeneity of intercepts, we include a full set of country and time fixed effects. The
confidence intervals around our point estimates reflect the minimum distance that covers
90 percent of the estimates from 1,000 simulations. Impulse response functions are derived to
examine the average response of the main endogenous variables in the model to an
exogenous tightening in outflow restrictions. In all cases, the shock is normalized to
represent an increase of 0.25 in the index (a control tightening).15
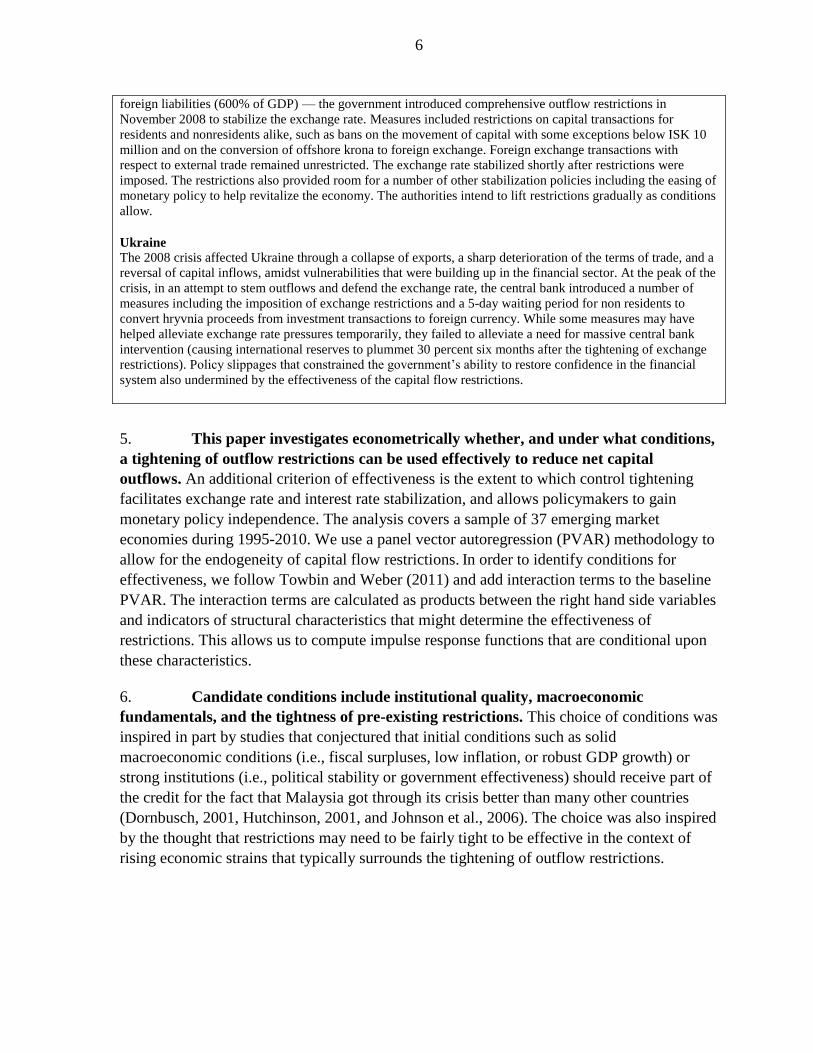
17. We find no evidence that a tightening of outflow restrictions is effective on
average in our sample. We estimate the benchmark model first including net inflows as a
capital flow variable, and subsequently including net flows in assets and net flows in
liabilities as well as, finally, gross inflows and gross outflows.16 The impulse responses of
these capital flow measures are compiled in Figure 2 along with the evolution of the outflow
control index. Solid lines represent impulse responses obtained from the OLS point
estimates, dashed lines show 90 percent confidence bands. We see that a control tightening
reduces gross outflows as intended. However, gross inflows also fall, leading to an increase
in net inflows (or a fall in net outflows) that is small and insignificant. The results further
suggest that residents respond to the tightening by repatriating investment while non-
residents reduce their investments in the domestic economy.. The reaction by non-residents
could reflect the expectation that the tightening of outflow restrictions will make non
residents’ future repatriation of potential investments more difficult.17
18. However, a tightening of outflow restrictions could be effective in countries
with favorable macroeconomic fundamentals. This might be the case for example because
markets may interpret good macroeconomic fundamentals as an indication of sound
policymaking and the ability to address economic challenges effectively. In this situation
15
In our sample, the index ranges between 0 (open) and 1 (closed), with a mean of 0.63 and a standard
deviation of 0.35 (Table 3).
16 We analyze the impact of an outflow control tightening on net capital inflows as well as net flows of assets
and liabilities and the gross inflow and outflow concepts defined as discussed above. While outflow restrictions
are typically designed to affect outflows they can also have an impact on inflows. In identifying the
effectiveness of a control tightening our focus is therefore mostly on its impact on net capital inflows.
17 It is important to note that the results are symmetric in nature. In other words, to the extent that a control
tightening raises net inflows, a controls loosening lowers net inflows. Given that in our sample includes many
episodes of outflow control liberalization (see Table 4), it could in principle be the case that these are the ones
driving the results. We tested the relevance of this concern by conditioning the impulse response functions on a
dummy variable that takes the value one if a control tightening occurs in the initial period. The results are fully
consistent with those found in the symmetric analysis. If anything, they indicate that control tightenings tend to
be somewhat more effective than loosenings. However, in both cases, the result holds that their effectiveness
depends on a range of factors such as macroeconomic fundamentals, institutions and pre-existing controls (see
below).
16
investors could still consider the country as an attractive investment destination.18 This
argument is in line with results presented in Forbes (2011) suggesting that capital flow
restrictions work mainly through changes in investor expectations and sentiment.
Figure 2. Impulse Responses to an Unexpected Increase in the Outflow Controls Index
18 In the case of Korea, the capital inflow control measures deployed in June and November 2010 were
associated with an increase in equity prices and appreciation of the won, consistent with an increase (rather than
a reduction) in inflows IMF (2011).
Figure 1. Impulse Responses to an Unexpected Increase in the Outflow Controls Index
Solid line OLS point estimates. Dashed lines are 90% confidence bands. The shock to the outflow control index is
normalized to be equal to 0.25. The responses of all variables are changes in percent of GDP.
1 2 3 4 5 6
0.22
0.24
0.26
Ou
tflo
w c
on
t. in
d.
1 2 3 4 5 6-2
0
2
4
Ne
t in
flow
s
1 2 3 4 5 6-10
-5
0
Gro
ss o
utfl
ow
s
1 2 3 4 5 6-10
-5
0
Gro
ss in
flow
s
1 2 3 4 5 6
0
5
10
15
Ne
t ass
ets
1 2 3 4 5 6
-15
-10
-5
0
Ne
t lia
bili
ties

17
19. In order to test this hypothesis, we construct a time-varying composite index of
macroeconomic fundamentals. We rank the countries in the sample along four dimensions -
growth, inflation, fiscal and current account balances - and compute a country’s overall
fundamentals rank at time t as the simple average of its four ranks in that period. Estimating the
PVAR with interaction terms based on this measure then allows us to derive conditional impulse
response functions which we evaluate at different points of their sample distribution to study
how the effects of outflow restrictions differ between countries with stronger (75th
percentile)
and weaker (25th
percentile) fundamentals relative to the rest of the sample. While our ranking
procedure can only inform about the relative quality of fundamentals in relation to the sample
distribution, our sample of 37 - mainly emerging – economies appears sufficiently large to be
representative of the emerging market universe. In particular, the 75th
percentile (25th
percentile)
of the sample distribution displays an average growth rate of 6.4 (1.1) percent, an average
inflation rate of 8.9 (2.3), an average current account balance of 0.7 (-1.1) percent of GDP and an
average fiscal balance of -0.5 (-4.8) percent of GDP (Table 3).
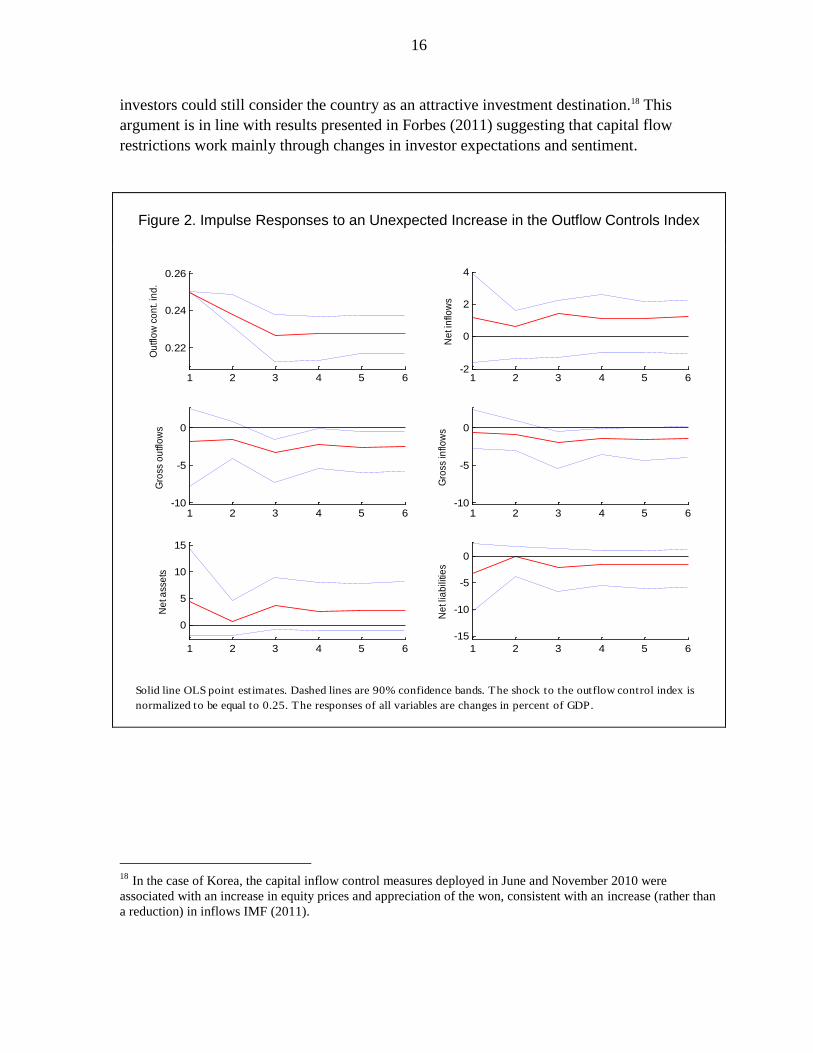
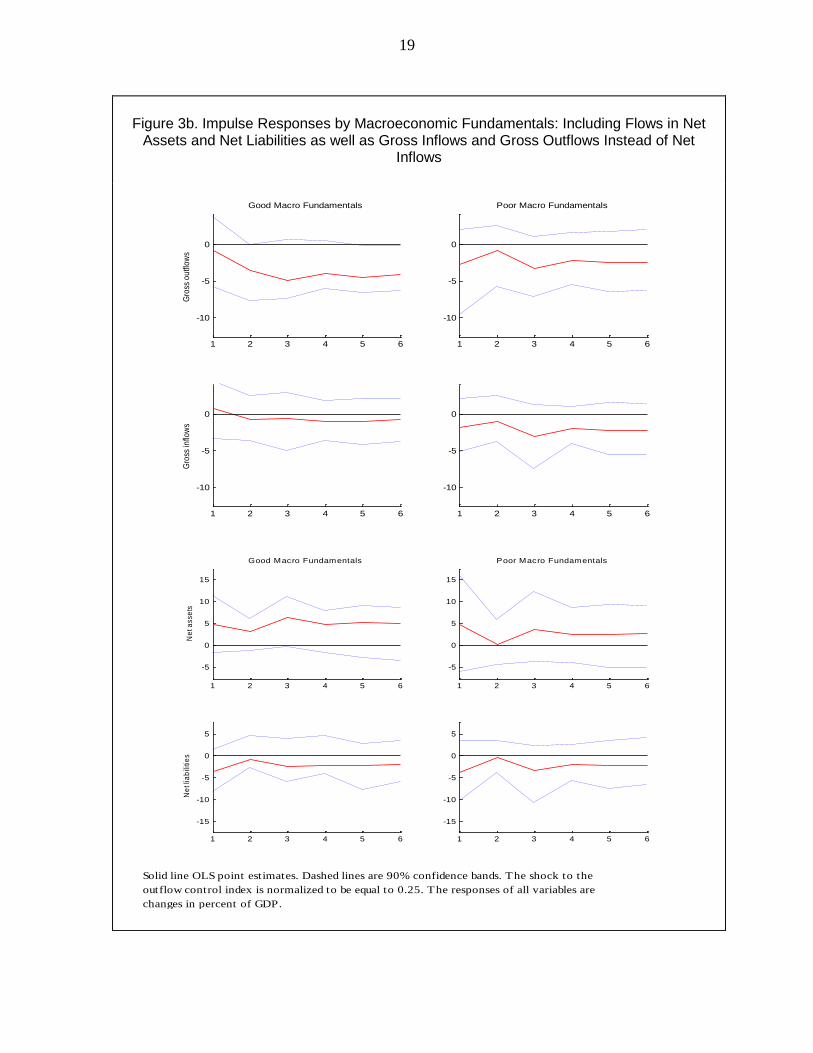
20. We find that restrictions are effective in countries with better macroeconomic
fundamentals. The findings suggest that a control tightening increases net inflows at the peak by
4 percent of GDP, keeping them elevated for more than one and a half years (Figures 3a and 3b).
There is only a small and statistically insignificant decline in gross inflows, and the substantial
fall in gross outflows dominates. At the same time, the real exchange rate appreciates, and
interest rate falls, even if not in a statistically significant manner. There is also a substantial boost
in industrial production, thanks possibly to higher net capital inflows and lower interest rates. In
sum, the results suggest that a control tightening leads to an increase in net capital inflows that
halts the depreciation of the exchange rate and gives policy space to allow for lower interest
rates, boosting economic activity.
21. Relatedly, outflow restrictions could be effective in countries with well
functioning institutions.19 Indeed, an additional reason why restrictions are effective in
economies with strong fundamentals might be that these countries tend to benefit from a
favorable institutional environment. Well-functioning institutions may help countries achieve
strong macroeconomic fundamentals. 20 They may also signal an ability to implement restrictions
effectively and in a manner that protects private property and creditor rights. In particular, strong
institutions may create more transparency, strengthen the rule of law and limit regulatory
uncertainty, for example with respect to exit strategies. A solid institutional environment should
thus increase investor confidence.
19
The findings for macro fundamentals, institutional quality and the comprehensiveness of restrictions are mutually
independent although a correlation between the three measures certainly exists,
20 North (1990) and Mauro (1995) argue that high levels of corruption and government ineffectiveness negatively
affect economic growth. Hall and Jones (1999) document that institutions and government policies determine cross -
country differences in investment, productivity, and output per worker. And Acemoglu, Johnson and Robinson
(2005) provided evidence that differences in economic institutions are the fundamental cause of differences in long-
run growth.

18
Figure 3a. Impulse Responses by Macroeconomic Fundamentals
Solid line OLS point estimates. Dashed lines are 90% confidence bands. The shock to the
outflow control index is normalized to be equal to 0.25. The responses of industrial production
and the real exchange rate are in percent. The response of inflation and the interest rate is in
percentage points. The responses of all the net inflow variable is in percent of GDP.
Figure 2a. Impulse Responses by Macroeconomic Fundamentals
1 2 3 4 5 60.2
0.22
0.24
0.26
0.28
Ou
t. c
on
tro
l in
d.
Good Macro Fundamentals
1 2 3 4 5 60.2
0.22
0.24
0.26
0.28
Poor Macro Fundamentals
1 2 3 4 5 6-2
0
2
4
6
8
Ne
t in
flo
ws
1 2 3 4 5 6-2
0
2
4
6
8
1 2 3 4 5 6
-10
-5
0
Int.
ra
te
1 2 3 4 5 6
-10
-5
0
1 2 3 4 5 6
0
2
4
Ou
tpu
t
Good Macro Fundamentals
1 2 3 4 5 6
0
2
4
Poor Macro Fundamentals
1 2 3 4 5 6
-4
-2
0
2
4
6
XR
1 2 3 4 5 6
-4
-2
0
2
4
6
1 2 3 4 5 6
-4
-2
0
2
Infla
tion
1 2 3 4 5 6
-4
-2
0
2
19
Figure 3b. Impulse Responses by Macroeconomic Fundamentals: Including Flows in Net
Assets and Net Liabilities as well as Gross Inflows and Gross Outflows Instead of Net Inflows
Figure 2b. Impulse Responses by Macroeconomic
Fundamentals: Including Flows in Net Assets and Net
Liabilities as well as Gross Inflows and Gross Outflows Instead
of Net Inflows
Solid line OLS point estimates. Dashed lines are 90% confidence bands. The shock to the
outflow control index is normalized to be equal to 0.25. The responses of all variables are
changes in percent of GDP.
1 2 3 4 5 6
-10
-5
0
Gro
ss o
utfl
ow
s
Good Macro Fundamentals
1 2 3 4 5 6
-10
-5
0
Poor Macro Fundamentals
1 2 3 4 5 6
-10
-5
0
Gro
ss in
flow
s
1 2 3 4 5 6
-10
-5
0
1 2 3 4 5 6
-5
0
5
10
15
Ne
t a
ss
ets
Good Macro Fundamentals
1 2 3 4 5 6
-5
0
5
10
15
Poor Macro Fundamentals
1 2 3 4 5 6
-15
-10
-5
0
5
Ne
t li
ab
ilit
ies
1 2 3 4 5 6
-15
-10
-5
0
5

20
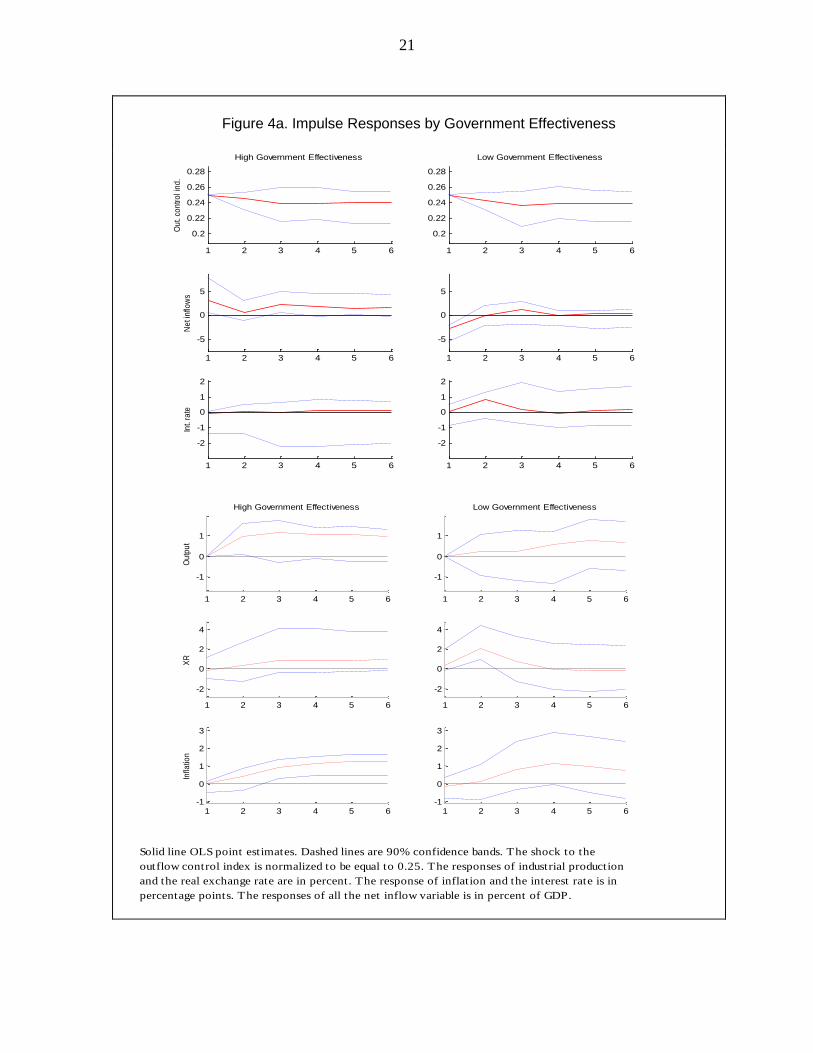
22. We do indeed find that control tightening is effective in countries with strong
institutions, notwithstanding the fact that the impulse responses are less pronounced than for
countries with good fundamentals. We measure the quality of institutions using the World
Bank’s government effectiveness index.21 Figures 4a and 4b present impulse response
functions at high and low levels of government effectiveness (75th
and 25th
percentiles of the
indicator or values of 0.7 and -0.2 respectively). We find that restrictions are indeed effective
at countering capital flight when institutional quality is high, although the responses of
interest rates and the real exchange rate are relatively muted. In particular, net inflows
increase by about 3 percent of GDP on impact and 2 percent thereafter in response to the
shock. Conversely, restrictions are ineffective in the presence of low institutional quality.
Similar results are obtained for different indicators of institutional quality such as measures
of political stability, regulatory quality, and control of corruption taken from the Worldwide
Governance Indicators project.
23. Further, the results suggest that further restrictions are effective in countries
with fairly comprehensive pre-existing controls. Stops or reversals in inflows are often
sudden events, suggesting feedback effects between investor decisions with correspondingly
strong investor incentives to pull funds out. Only comprehensive restrictions might be able to
slow such a “rush to the exit.” We evaluate impulse response functions at different starting
levels of the capital control index. Figures 5a and 5b show the impulse responses to an
increase in restrictions starting from high (75th
percentile of outflow control intensity or a
value of 1) and low (25th
percentile of outflow control intensity or a value of 0.3) levels of
pre-existing restrictions. Where pre-existing restrictions are fairly comprehensive, net
inflows increase significantly – by about 5 percent of GDP on impact and 2.5 percent for the
following 6 quarters – when these are further tightened. This is because the control tightening
leads to a larger decline in gross outflows than in gross inflows. Surprisingly, the exchange
rate depreciates in response to the tightening, the opposite of the expected effect, while
interest rates show a fairly muted response. In contrast, where restrictions are tightened but
do not attain a minimum level of comprehensiveness, a control tightening shows little effect
on gross or net flows. As a result, output increases in response to a tightening in the presence
of significant pre-existing controls while it does not in their absence.22
21
This index, based on 17 component sources, measures the quality of public services, the quality of the civil
service and the degree of its independence from political pressures, the quality of policy formulation and
implementation, and the credibility of the government’s commitment to such policies. The index values range
from -2.5 (very poor performance) to +2.5 (excellent performance).
22 Gupta et al (2007) document that the output contraction during a currency crisis is significantly smaller if
countries had restrictions on the capital account prior to the crisis.
21
Figure 4a. Impulse Responses by Government Effectiveness
Solid line OLS point estimates. Dashed lines are 90% confidence bands. The shock to the
outflow control index is normalized to be equal to 0.25. The responses of industrial production
and the real exchange rate are in percent. The response of inflation and the interest rate is in
percentage points. The responses of all the net inflow variable is in percent of GDP.
Figure 3a. Impulse Responses by Government Effectiveness
1 2 3 4 5 6
0.2
0.22
0.24
0.26
0.28O
ut.
con
tro
l in
d.
High Government Effectiveness
1 2 3 4 5 6
0.2
0.22
0.24
0.26
0.28
Low Government Effectiveness
1 2 3 4 5 6
-5
0
5
Ne
t in
flow
s
1 2 3 4 5 6
-5
0
5
1 2 3 4 5 6
-2
-1
0
1
2
Int.
rate
1 2 3 4 5 6
-2
-1
0
1
2
1 2 3 4 5 6
-1
0
1
Ou
tpu
t
High Government Effectiveness
1 2 3 4 5 6
-1
0
1
Low Government Effectiveness
1 2 3 4 5 6
-2
0
2
4
XR
1 2 3 4 5 6
-2
0
2
4
1 2 3 4 5 6-1
0
1
2
3
Infla
tion
1 2 3 4 5 6-1
0
1
2
3

22
Figure 4b. Impulse Responses by Government Effectiveness: Including Flows in Net Assets
and Net Liabilities as well as Gross Inflows and Gross Outflows Instead of Net Inflows
Solid line OLS point estimates. Dashed lines are 90% confidence bands. The shock to the
outflow control index is normalized to be equal to 0.25. The responses of all variables are
changes in percent of GDP.
Figure 3b. Impulse Responses by Government Effectiveness:
Including Flows in Net Assets and Net Liabilities as well as
Gross Inflows and Gross Outflows Instead of Net Inflows
1 2 3 4 5 6
-10
-5
0
5
Gro
ss o
utfl
ow
sHigh Government Effectiveness
1 2 3 4 5 6
-10
-5
0
5
Low Government Effectiveness
1 2 3 4 5 6
-10
-5
0
5
Gro
ss in
flow
s
1 2 3 4 5 6
-10
-5
0
5
1 2 3 4 5 6
-10
-5
0
5
10
Ne
t ass
ets
High Government Effectiveness
1 2 3 4 5 6
-10
-5
0
5
10
Low Government Effectiveness
1 2 3 4 5 6
-10
-5
0
5
10
Ne
t lia
bili
ties
1 2 3 4 5 6
-10
-5
0
5
10

23
Figure 5a. Impulse Responses by Intensity of Capital Outflow Restrictions
Figure 4a. Impulse Responses by Intensity of Capital Outflow Restrictions
Solid line OLS point estimates. Dashed lines are 90% confidence bands. The shock to the
outflow control index is normalized to be equal to 0.25. The responses of industrial production
and the real exchange rate are in percent. The response of inflation and the interest rate is in
percentage points. The responses of all the net inflow variable are in percent of GDP.
1 2 3 4 5 6
0.2
0.22
0.24
0.26
0.28O
ut.
con
tro
l in
d.
High Capital Controls
1 2 3 4 5 6
0.2
0.22
0.24
0.26
0.28
Low Capital Controls
1 2 3 4 5 6-5
0
5
10
Ne
t in
flow
s
1 2 3 4 5 6-5
0
5
10
1 2 3 4 5 6
-4
-2
0
2
Int.
rate
1 2 3 4 5 6
-4
-2
0
2
1 2 3 4 5 6
0
2
4
Ou
tpu
t
High Capital Controls
1 2 3 4 5 6
0
2
4
Low Capital Controls
1 2 3 4 5 6
-2
0
2
4
6
8
XR
1 2 3 4 5 6
-2
0
2
4
6
8
1 2 3 4 5 6
0
2
4
Infla
tion
1 2 3 4 5 6
0
2
4

24
Figure 5b. Impulse Responses by Capital Control Intensity: Including Flows in Net Assets
and Net Liabilities as well as Gross Inflows and Gross Outflows Instead of Net Inflows
Solid line OLS point estimates. Dashed lines are 90% confidence bands. The shock to the
outflow control index is normalized to be equal to 0.25. The responses of all variables are
changes in percent of GDP
Figure 4b. Impulse Responses by Capital Control Intensity:
Including Flows in Net Assets and Net Liabilities as well as
Gross Inflows and Gross Outflows Instead of Net Inflows
1 2 3 4 5 6
-15
-10
-5
0
5
Gro
ss o
utfl
ow
sHigh Capital Controls
1 2 3 4 5 6
-15
-10
-5
0
5
Low Capital Controls
1 2 3 4 5 6
-15
-10
-5
0
5
Gro
ss in
flow
s
1 2 3 4 5 6
-15
-10
-5
0
5
1 2 3 4 5 6
-5
0
5
10
15
20
25
Ne
t a
ss
ets
H igh C ap ita l C ontro ls
1 2 3 4 5 6
-5
0
5
10
15
20
25
Low C ap ita l C ontro ls
1 2 3 4 5 6
-25
-20
-15
-10
-5
0
5
Ne
t li
ab
ilit
ies
1 2 3 4 5 6
-25
-20
-15
-10
-5
0
5

25
IV. ROBUSTNESS
24. We proceed to test the robustness of our results to changes in variable
definitions and the econometric specification. We evaluate robustness by assessing the
extent to which these changes affect the impulse responses of net inflows at the
75th
percentile of the distribution of each of the indicators (quality of fundamentals, quality of
institutions, pre-existing capital flow restrictions intensity). First, we analyze whether our
findings still hold if real GDP takes the place of industrial production.23 This robustness
check is conducted to guard against the possibility that the results are affected by the
volatility of industrial production or by the fact that in many countries industrial production
represents only a small share of economic activity.24 Second, we augment our PVAR (6) to a
PVAR (7) that includes an inflow control index as an additional variable; this is to alleviate
omitted variable concerns with respect to the correlation between changes in intensity of
outflow and inflow restrictions. Third, we test whether our model is sensitive to different lag
specifications. Finally, we test the robustness of our findings to different orderings of the
variables included in the VAR. In the alternative ordering presented here, we allow outflow
restrictions to respond contemporaneously to capital flows.25
25. The finding that restrictions are effective in countries with strong
fundamentals is robust to all checks. Figure 6a illustrates this result. Neither the
substitution of the industrial production variables by GDP nor the inclusion of an index of
inflow control intensity nor the change in the ordering of the variables have an important
impact on the shape or the magnitude of the impulse response functions. The response is also
fairly robust to changes in the lag structure of the PVAR; only when reducing the lag
structure to 1 do we see a somewhat pronounced drop in the magnitude of the response.
26. The response of net flows to restrictions in countries with strong institutions
is robust to most checks. Figure 6b shows that the substitution of industrial production with
GDP or the inclusion of an index of inflow control intensity do not alter the shape or the
magnitude of the impulse responses much. Changes in the lag structure of the PVAR do
affect the shape of the impulse responses but the basic finding that the response of net capital
inflows is significantly positive remains. However, the finding that net inflows increase
significantly is not always robust to changes in the ordering of the variables. Changing the
ordering in such a way as to allow outflow restrictions to respond contemporaneously to
23
We included industrial production instead of GDP in the first place because GDP is not available at quarterly
frequency for all countries in the sample. For this robustness check GDP is extrapolated from annual to
quarterly frequency where necessary.
24 For purposes of the robustness check, GDP is assumed to be equal in every quarter of a given year for all
countries for which quarterly data is not available.
25 In addition, the ordering assumes that restrictions will not respond to changes in net inflows
contemporaneously.
26
capital flows leads to a response that is significantly more muted: the response is no longer
positive on impact and peaks at only about 0.5 percent of GDP.
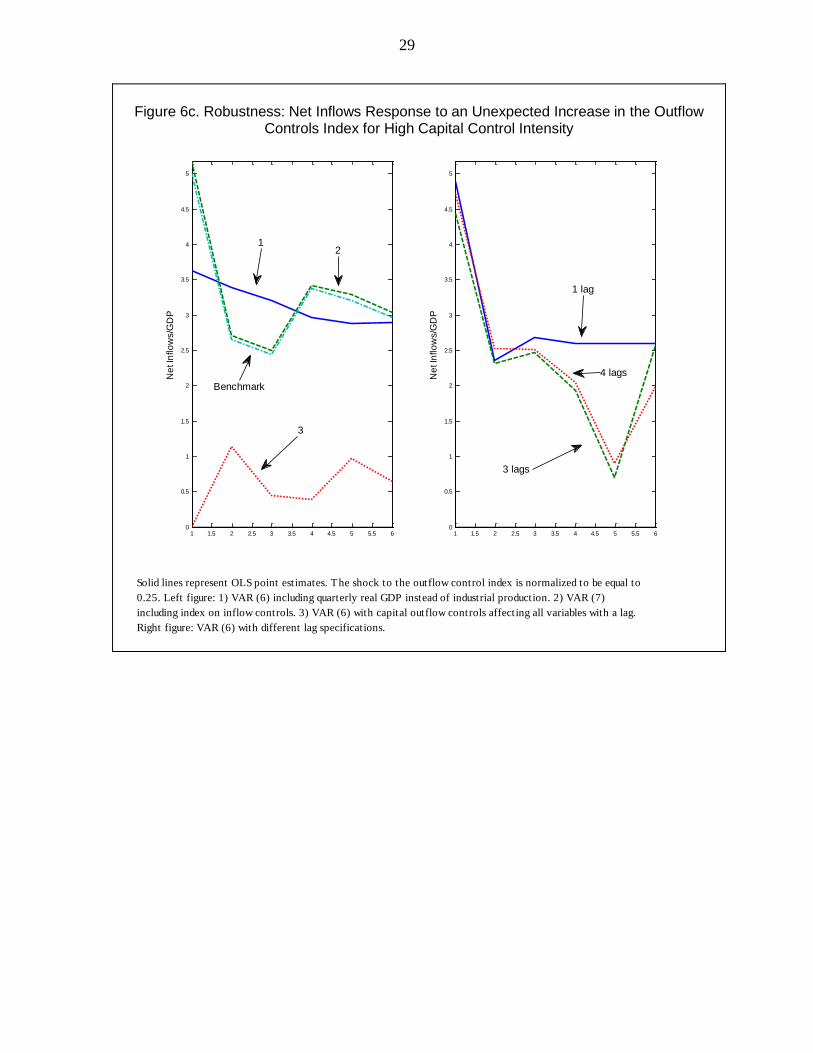
27. The finding that outflow restrictions need to be comprehensive to be effective
is relatively robust. Including real GDP in the regression instead of industrial production
does not impact the results notably; neither does the inclusion of an index of inflow control
intensity (Figure 6c). The path of the impulse response function is somewhat sensitive to
increasing the number of lags in the VAR, but the shapes of the responses only begin to vary
after about three quarters. Moreover, the response is positive across the horizon of six
quarters in all cases. The most notable change in the response function occurs when changing
the ordering of the variables in the VAR, allowing outflow restrictions to be affected
contemporaneously by all variables in the VAR. In this case the response of net inflows to an
increase in control intensity becomes much smaller. However, the response remains positive
across the response horizon and peaks at about 1.2 percent of GDP.
28. Finally, results are robust to excluding China and India from the analysis.
China and India have had longstanding capital flow restrictions. This suggests that the
effectiveness of a tightening of restrictions outflow restrictions may not necessarily depend
on restrictions having been in place for a long time.

27
Figure 6a. Robustness: Net Inflows Response to an Unexpected Increase in the Outflow
Controls Index for Good Macroeconomic Fundamentals
Figure 5a. Robustness: Net Inflows Response to an Unexpected Increase in the Outflow
Controls Index for Good Macroeconomic Fundamentals
Solid lines represent OLS point estimates. The shock to the outflow control index is normalized to be equal to
0.25. Left figure: 1) VAR (6) including quarterly real GDP instead of industrial production. 2) VAR (7)
including index on inflow controls. 3) VAR (6) with capital outflow controls affecting all variables with a lag.
Right figure: VAR (6) with different lag specifications.
1 1.5 2 2.5 3 3.5 4 4.5 5 5.5 60
0.5
1
1.5
2
2.5
3
3.5
4
4.5
5N
et In
flo
ws/G
DP
1 1.5 2 2.5 3 3.5 4 4.5 5 5.5 60
0.5
1
1.5
2
2.5
3
3.5
4
4.5
5
Ne
t In
flo
ws/G
DP
1
2
3
Benchmark
1 lag
3 lags
4 lags

28
Figure 6b. Robustness: Net Inflows Response to an Unexpected Increase in the Outflow Controls Index for High Government Effectiveness
Solid lines represent OLS point estimates. The shock to the outflow control index is normalized to be equal to
0.25. Left figure: 1) VAR (6) including quarterly real GDP instead of industrial production. 2) VAR (7)
including index on inflow controls. 3) VAR (6) with capital outflow controls affecting all variables with a lag.
Right figure: VAR (6) with different lag specifications.
Figure 5b. Robustness: Net Inflows Response to an Unexpected Increase
in the Outflow Controls Index for High Government Effectiveness
1 1.5 2 2.5 3 3.5 4 4.5 5 5.5 6
-0.5
0
0.5
1
1.5
2
2.5
Ne
t In
flo
ws/G
DP
1 1.5 2 2.5 3 3.5 4 4.5 5 5.5 6
-0.5
0
0.5
1
1.5
2
2.5
Ne
t In
flo
ws/G
DP
3
1
2
Benchmark
1 lag
4 lags
3 lags
29
Figure 6c. Robustness: Net Inflows Response to an Unexpected Increase in the Outflow
Controls Index for High Capital Control Intensity
Figure 5c. Robustness: Net Inflows Response to an Unexpected Increase
in the Outflow Restrictions Index for High Capital Control Intensity
Solid lines represent OLS point estimates. The shock to the outflow control index is normalized to be equal to
0.25. Left figure: 1) VAR (6) including quarterly real GDP instead of industrial production. 2) VAR (7)
including index on inflow controls. 3) VAR (6) with capital outflow controls affecting all variables with a lag.
Right figure: VAR (6) with different lag specifications.
1 1.5 2 2.5 3 3.5 4 4.5 5 5.5 60
0.5
1
1.5
2
2.5
3
3.5
4
4.5
5N
et In
flo
ws/G
DP
1 1.5 2 2.5 3 3.5 4 4.5 5 5.5 60
0.5
1
1.5
2
2.5
3
3.5
4
4.5
5
Ne
t In
flo
ws/G
DP
12
3
Benchmark
1 lag
4 lags
3 lags

30
V. CONCLUSION
29. In this paper, we investigate whether, and under what conditions, a
tightening of outflow restrictions helps reduce net capital outflows in a sample of 37
emerging market economies during 1995-2010. Our main criterion for effectiveness is the
impact of a tightening of outflow restrictions on net capital flows. An additional criterion is
the extent to which control tightening facilitates exchange rate and interest stabilization, and
allows policymakers to regain monetary policy independence.
30. We use a panel vector autoregression (PVAR) methodology to allow for the
endogeneity of capital flow restrictions. In order to identify preconditions for effectiveness,
we add interaction terms to the baseline PVAR which are calculated as products between the
right hand side variables and structural characteristics that might determine the effectiveness
of restrictions. These include indicators of institutional quality and macroeconomic
fundamentals as well as the tightness of pre-existing restrictions. This strategy allows us to
compute impulse response functions that are conditional upon the indicator variables and can
be evaluated at different percentiles of their sample distributions.
31. Our findings suggest that a tightening of outflow restrictions can indeed be
effective if supported by either strong macroeconomic fundamentals or good
institutions, or if existing restrictions are already fairly comprehensive. When estimating
the PVAR in the absence of any interaction terms, we find that a tightening of outflow
restrictions on average reduces gross capital outflows. However, there is also a contraction in
gross inflows – mainly driven by non-resident investors – which is larger in size than the
contraction in outflows. We thus find that for the average country, a tightening of outflow
restrictions is ineffective as net outflows increase as a result of it. However, adding
interaction terms reflecting a variety of structural country characteristics, we find that
restrictions are effective if important preconditions are in place: in countries with good
macroeconomic fundamentals, a tightening of restrictions leads to a sizable reduction in net
capital outflows. This result is robust to a variety of specification changes. Similarly, a
tightening of restrictions is effective in countries with strong institutions, although our
findings are slightly less clear cut and robust in these cases. Finally, restrictions are effective
if they are sufficiently comprehensive to slow a sudden “rush to the exit.”

31
REFERENCES
Ariyoshi, A., K. Habermeier, B. Laurens, I. Ötker-Robe, J.-I. Canales-Kriljenko, and A.
Kirilenko, 2000, Capital Controls: Country Experiences with Their Use and
Liberalization, IMF Occasional Paper 190 (Washington: International Monetary
Fund).
Abdelal, R., and L. Alfaro, 2003, “Capital and Control: Lessons from Malaysia”, Challenge,
Vol. 46, No. 4, July/August, pp. 36–53.
Acemoglu, D., S. Johnson, and J. A. Robinson, 2005, “Institutions as Fundamental Cause of
Long-Run Growth,” in Handbook of Economic Growth, Vol. 1A, ed. by P. Aghion
and S. N. Durlauf (Elsevier).
Baba, C., and A. Kokenyne, 2011, “Effectiveness of Capital Controls in Selected Emerging
Markets in the 2000s,” IMF Working Paper 11/281 (Washington: International
Monetary Fund).
Binici, M., M. Hutchison, and M. Schindler, 2010, “Controlling capital? Legal restrictions
and the asset composition of international financial flows,” Journal of International
Money and Finance, Vol. 29, No. 4.
Cardoso, E., and I. Goldfajn, 1997, “Capital Flows to Brazil: The Endogeneity of Capital
Controls,” IMF Working Paper 97/115 (Washington: International Monetary Fund).
Dooley, M., 1996, “A Survey of Literature on Controls Over International Capital
Transactions,” IMF Staff Papers, Vol. 43, No. 4, December, pp. 639–687
(Washington: International Monetary Fund).
Dornbusch, R. 2001, “Malaysia: Was It Different?” NBER Working Paper No. 8325
(Cambridge, Massachusetts: National Bureau of Economic Research).
Edison, H. J., and C. M. Reinhart, 2000, “Capital Controls During Financial Crises: the Case
of Malaysia and Thailand,” Board of Governors of the Federal Reserve System,
International Finance Discussion Paper 662.
Forbes, K., 2011, “Bubble thy Neighbor: Direct and Spillover Effects of Capital Controls,”
paper presented at the 12th
Jacques Polak Annual Research Conference, November
10-11, 2011.
Gupta, P., D. Mishra and R. Sahay, 2007. "Behavior of Output During Currency Crises,”
Journal of International Economics, Elsevier, vol. 72, No. 2.
32
Hall, R. E., and C. Jones, 1999, “Why Do Some Countries Produce So Much More Output
per Worker than Others?” Quarterly Journal of Economics, Vol. 114, pp. 83–116.
Hutchinson, M., 2001, “A Cure Worse Than the Disease? Currency Crises and the Output
Costs of IMF-Supported Stabilization Programs,” Economic Policy Research Unit,
Institute of Economics, University of Copenhagen.
International Monetary Fund, 2010, Iceland: Staff Report for Second Review Under Stand-By
Arrangement and Request for Extension of the Arrangement, Rephasing of Access
and Establishment of Performance Criteria, IMF Country Report No. 10/95
(Washington: International Monetary Fund).
International Monetary Fund, 2011, The Multilateral Aspects of Policies Affecting Capital
Flows (Washington: International Monetary Fund).
International Monetary Fund, 2012, Liberalizing Capital Flows and Managing Outflows
(Washington: International Monetary Fund).
Johnson, S., K. Kochhar, T. Mitton, and N. Tamirisa, 2006, “Malaysian Capital Controls:
Macroeconomics and Institutions,” IMF Working Paper 06/51 (Washington:
International Monetary Fund).
Klein, M., 2012, “Capital Controls: Gates and Walls,” mimeo (Washington: Brookings
Institution).
Mauro, P., 1995, “Corruption and Growth," Quarterly Journal of Economics, Vol. 110,
No. 3, pp. 681–713.
Magud, N., C. M. Reinhart, and K. S. Rogoff, 2011, “Capital Controls: Myth and Reality: A
Portfolio Balance Approach,” NBER Working Paper 16805 (Cambridge: National
Bureau of Economic Research).
Miniane, J., and J. H. Rogers, 2007, “Capital Controls and the International Transmission of
U.S. Money Shocks,” Journal of Money, Credit and Banking, Vol. 39, No. 5,
pp. 1003–1035.
North, D. C., 1990, Institutions, Institutional Change, and Economic Performance
(Cambridge: Cambridge University Press).
Ostry, J., A. Ghosh, K. Habermeier, L. Laeven, M. Chamon, M. Qureshi, and A. Kokenyne,
2011, “Managing Capital Inflows: What Tools to Use?” IMF Staff Discussion Note
11/06 (Washington: International Monetary Fund).

33
Reinhart, C., and V. Reinhart, 2008, “Capital Flow Bonanzas: An Encompassing View of the
Past and Present,” NBER Working Paper 14321 (Cambridge: National Bureau of
Economic Research).
Runkle, D. E., 1987, “Vector autoregressions and reality,” Journal of Business and
Economic Statistics, Vol. 5, No. 4, pp. 437-442.
Schindler, M., 2009, “Measuring Financial Integration: A New Data Set,” IMF Staff Papers,
Vol. 56, No. 1, pp. 222–238 (Washington: International Monetary Fund)
Sharma, S. D., 2003, “The Malaysian Capital Control regime of 1998: Implementation,
Effectiveness, and Lessons,” Asian Perspective, Vol. 27, No. 1, pp. 77–108.
Towbin, P. and S. Weber, 2011, “Limits of Floating Exchange Rates: The Role of Foreign
Currency Debt and Import Structure,” IMF Working Paper 11/42 (Washington:
International Monetary Fund).