Effectiveness and Accountability R eport...MG Math/MG Science 5-9 Middle Grades General Science 5-9...
29
Updated An Exec Claribel To Director o d May 2013 Ef cutive Sum orres‐Lugo of Assessmen “Educ 3 Colle ffectiven 2009‐ mmary t and Accredi cating Profess ge of Educat ness and ‐2010, 201 itation sionals Who I tion and Hu Accoun 0‐2011 an Impact the Li man Service tability R d 2011‐20 ves of Childre es Report: 012 en and Adults 1 | P a s” a ge
Transcript of Effectiveness and Accountability R eport...MG Math/MG Science 5-9 Middle Grades General Science 5-9...

Updated
An Exec
Claribel To
Director o
d May 2013
Ef
cutive Sum
orres‐Lugo
of Assessmen
“Educ
3
Colle
ffectiven2009‐
mmary
t and Accredi
cating Profess
ge of Educat
ness and ‐2010, 201
itation
sionals Who I
tion and Hu
d Accoun0‐2011 an
Impact the Li
man Service
tability Rd 2011‐20
ives of Childre
es
Report: 012
en and Adults
1 | P a
s”
a g e

Updated
Section
Section
Section
Section
Section
Section
Section
Section Section Section
The Coeducatoreport sprogramenrolledFor quesAccredit Sincerel Larry G.Dean, C
d May 2013
n 1 COEand 2
n 2 COESubje
n 3 UniveState
n 4 COEHthru 2
n 5 SatisfComp
n 6 Empl2009-
n 7 COEHof Teand 2
n 8 GraduProgr
n 9 Empl
n 10 P-12
llege of Edrs and admsummarize
m effectiven in COEHSstions aboutation, at ww
ly,
Daniel College of E
3
EHS Summa2011-2012
EHS Pass Rect Area Ex
ersity of Noe Compariso
HS Program2011-2012)
faction Survpleters (200
oyers’ Satis-2010 and 2
HS Averageacher Prep
2011-2012
uation Raterams
oyment Re
Impact Dat
ducation aministratorss data us
ness, curricS teacher prut this repoww.unf.edu
Education a
ary Data Fl
Rates Floridxam: 2009-
rth Florida’sons
m Complete)
vey Results09-2010 an
sfaction of 2010-2011
e Entrance paration Pro
es for Stude
tention Rat
ta: Florida’s
Int
nd Humans who will ised in imcular changreparation rt, contact
u/coehs/abo
nd Human
Index
orida Licen
da Teacher -2010, 2010
s State Rep
ers’ First Ye
s for all COd 2010-201
Beginning T
and Exit Gograms and
ents Admitt
tes of COE
s Value-Add
troduction
n Services mpact studportant de
ges, and thprograms aDr. Claribeout/
Services
nsure Exam
Certificatio0-2011, and
port Card-T
ear Employ
OEHS Teach11)
Teachers G
GPAs for Cad Advanced
ted and Enr
HS Program
ded Model
is commitdent learninecision-makhe quality oand in the yl Torres, D
m: 2009-201
on Exam (Fd 2011-201
Title II Repo
yment Data
her Educat
Graduated f
andidates ad Programs
rolled in CO
m Complet
(VAM) Sco
tted to the ng and achking proceof UNF’s gyears followirector of A
2 | P a
10, 2010-20
TCE) by 2
ort: Data wi
(2009-201
ion Program
from COEH
and Comples 2010-2011
OEHS
ers
ores
preparatiohievement.esses inclugraduates wwing graduaAssessment
a g e
011,
ith
0
ms
HS in
eters 1
on of This
uding while ation. t and

3 | P a g e Updated May 2013
Section 1 COEHS Summary Data for the Florida Licensure Exam: 2009-2010, 2010-2011, and 2011-2012 Section 1 and Section 2 Overview: Candidates in UNF teacher education programs leading to initial certification are required to pass all sections of the Florida Teacher Certification Exam (FTCE) prior to graduation. Upon admission to a teacher education program in the College, candidates are required to demonstrate competency in the areas of Mathematics, Reading, Writing, and English Language Skills by submitting passing scores on all portions of the General Knowledge (GK) test. Prior to graduation, a program evaluation review is conducted to determine if a candidate has successfully completed all program requirements. These exit reviews include passing scores on the Professional Education (PED) and Subject Area Exams (SAE) of the FTCE. As shown in 1.1 and 1.2 below, UNF has had a 100% institutional pass rate for completers in all programs. Data are also disaggregated by program as shown in section 2.
1.1 Summary of Program Completers Initial Teacher Preparation Programs*
Year Program
Completers # Taking the Exam
# Passing the Exam % Passing the Exam
2011-2012 265 265 265 100
2010-2011 337 337 337 100
2009-2010 332 332 332 100 Source: Florida Department of Education. *Art K-12, Biology 6-12, Chemistry 6-12, Elementary Education/ESOL K-6, English 6-12/ESOL, Exceptional Student Education ESOL K-12, Hearing Impaired K-12, Mathematics 6-12, MG Math/MG Science 5-9, Music K-12, PreK-Primary Education/ESOL, Physical Education K-12, Physics, Social Science 6-12, and the Educator Preparation Institute (EPI).
1.2 Summary of Program Completers for Other School Professional**
Degrees (2009-2010 - 2011-2012)
Year Program
Completers # Taking the Exam
# Passing the Exam % Passing the Exam
2011-2012 42 42 42 100
2010-2011 43 43 43 100
2009-2010 48 48 48 100 Source: Florida Department of Education. **Educational Leadership and Guidance and Counseling PK-12.

4 | P a g e Updated May 2013
Section 2 COEHS Pass Rates Florida Teacher Certification Exam (FTCE) per Subject Area Exam: 2011-2012
Initial Teacher Preparation
Programs-Title II
Name of Licensure Test
(Content)
# of Test
Takers
% Passing State
Licensure Test
Art K-12 Art K-12 3 100%
Biology 6-12 Biology 6-12 1 100%
Chemistry 6-12 Chemistry 6-12
Elementary Education/ESOL K-6 Elementary Education K-6 148 100%
English 6-12/ESOL English 6-12 6 100%
Exceptional Student Education ESOLK-12
Exceptional Student Education K-12 (Bachelor and Master’s Level) 21 100%
Hearing Impaired K-12 Hearing Impaired K-12 4 100%
Mathematics 6-12 Mathematics 6-12 7 100%
MG Math/MG Science 5-9 Middle Grades General Science 5-9 5 100%
Music K-12 Music K-12 5 100%
PreK-Primary Education/ESOL Age 3-Gr. 3 Prekindergarten/Primary PK-3 21 100%
Physical Education K-12 Physical Education 11 100%
Physics Physics 6-12
Social Science 6-12 Social Science 6-12 15 100%
Educator Preparation Institute Professional Education 18 100% Subtotal Pass Rate for Initial Preparation Title II Programs
265 100%
Note: Data provided by the FDOE (Title II Report and Standard Reports). All candidates are required to pass the Professional Education (PED) and the General Knowledge (GK) exams of the FTCE in order to be considered for graduation and a program completer.
Non-Title II Programs
Name of Licensure Test (Content)
# of Test
Takers
% Passing State
Licensure Test
Educational Leadership Florida Educational Leadership
Exam 24
100%
Guidance and Counseling PK-12 Guidance and Counseling PK-12 18
100% Subtotal Pass Rate for Non-Title II Programs
42 100%
Total Unit Overall Pass Rate 307 100% Note: Data provided by the FDOE (Title II and Standard Reports).

5 | P a g e Updated May 2013
Section 2 COEHS Pass Rates Florida Teacher Certification Exam (FTCE) per Subject Area Exam: 2010-2011
Initial Teacher Preparation Programs-Title II
Name of Licensure Test
(Content)
# of Test
Takers
% Passing State
Licensure Test
Art K-12 Art K-12 1 100%
Biology 6-12 Biology 6-12
Chemistry 6-12 Chemistry 6-12
Elementary Education/ESOL K-6 Elementary Education K-6 205 100%
English 6-12/ESOL English 6-12 13 100%
Exceptional Student Education ESOLK-12
Exceptional Student Education K-12 (Bachelor and Master’s Level) 23 100%
Hearing Impaired K-12 Hearing Impaired K-12 3 100%
Mathematics 6-12 Mathematics 6-12 7 100%
MG Math/MG Science 5-9 Middle Grades General Science 5-9 12 100%
Music K-12 Music K-12 3 100% PreK-Primary Education/ESOL Age 3-Gr. 3 Prekindergarten/Primary PK-3 31 100%
Physical Education K-12 Physical Education 6 100%
Physics Physics 6-12
Social Science 6-12 Social Science 6-12 16 100%
Educator Preparation Institute Professional Education 17 100% Subtotal Pass Rate for Initial Preparation Title II Programs
337 100%
Note: Data provided by the FDOE (Title II Report and Standard Reports). All candidates are required to pass the Professional Education (PED) and the General Knowledge (GK) exams of the FTCE in order to be considered for graduation and a program completer.
Non-Title II Programs
Name of Licensure Test
(Content)
# of Test Takers
% Passing State
Licensure Test
Educational Leadership Florida Educational Leadership
Exam (FELE) 27
100%
Guidance and Counseling PK-12 Guidance and Counseling PK-12 16
100% Subtotal Pass Rate for Non-Title II Programs
43 100%
Total Unit Overall Pass Rate 380 100% Note: Data provided by the FDOE (Title II and Standard Reports).

6 | P a g e Updated May 2013
Section 2 COEHS Pass Rates Florida Teacher Certification Exam (FTCE) per Subject Area Exam: 2009-2010
Initial Teacher Preparation Programs
Name of Licensure Test
(Content)
# of Test
Takers
% Passing State
Licensure Test
Art K-12 Art K-12 5 100%
Biology 6-12 Biology 6-12 3 100%
Chemistry 6-12 Chemistry 6-12 1 100%
Elementary Education/ESOL K-6 Elementary Education K-6 165 100%
English 6-12/ESOL English 6-12 12 100%
Exceptional Student Education ESOLK-12
Exceptional Student Education K-12 (Bachelor and Master’s Level)
14
100%
Hearing Impaired K-12 Hearing Impaired K-12 9 100%
Mathematics 6-12 Mathematics 6-12 5 100%
MG Math/MG Science 5-9
Middle Grades General Science 5-9
9
100%
Music K-12 Music K-12 1 100% PreK-Primary Education/ESOL Age 3-Gr. 3 Prekindergarten/Primary PK-3
46
100%
Physical Education K-12 Physical Education 11 100%
Physics Physics 6-12
Social Science 6-12 Social Science 6-12 22 100%
Educator Preparation Institute Professional Education 29 100%
Subtotal Pass Rate for Initial Preparation Title II Programs
332
100% Note: Data provided by the FDOE (Title II Report and Standard Reports). All candidates are required to pass the Professional Education (PED) and the General Knowledge (GK) exams of the FTCE in order to be considered for graduation and a program completer.
Non-Title II Programs Name of Licensure Test
(Content) # of Test Takers
% Passing State
Licensure Test
Educational Leadership Florida Educational Leadership
Exam (FELE) 28
100%
Guidance and Counseling PK-12 Guidance and Counseling PK-12 20
100% Subtotal Pass Rate for Non-Title II Programs
48 100%
Total Unit Overall Pass Rate 380 100% Note: Data provided by the FDOE (Title II and Standard Reports).

7 | P a g e Updated May 2013
Section 3 University of North Florida’s State Report Card-Title II Report: Data with State Comparisons
Section 3 Overview: In addition to collecting data for program completers as summarized in Sections 1 and 2, the College collects data on passing FTCE scores for students enrolled in courses other than the student internship or the final “capstone course.” The data below summarizes passing rates for students in teacher preparation programs who took the test during the 2010-2011 year as “other enrolled.” The results of the “other enrolled” students indicates that passing rates for these students, who are not yet considered program completers, are close if not higher than the Florida statewide average pass rate (see 3.1below).
3.1 FLDOE Comprehensive Assessment Data for All Sections in the Florida Teacher Certification Exam (FTCE) for “Other Enrolled Students 2010-2011).
Number
Taking Test
Number
Passing Test
COEHS Pass
Rate
Statewide Average Pass
Rate
Basic Skills or General Knowledge Test (GK)
435
427
98%
97%
Professional Education Test
115
108
94%
94%
Subject Area Exams
94
86
92%
93%
FTCE (All Sections)
436
416
95%
92% Note: Other enrolled students include the number of students enrolled in teacher preparation programs taking the FTCE prior to enrolling in an internship course or capstone course.

8 | P a g e Updated May 2013
Data quantifying the results of “other enrolled” students in the Educator Preparation Institute (EPI), a state approved alternative certification route at UNF, indicate that the passing rates of UNF’s EPI candidates are closely aligned with other Florida EPI statewide passing rates (see 3.2 below). The Subject Area Exam was the strongest area for the 2010-2011 cohort, with 100% passing rate exceeding the statewide average pass rate of 96%.
3.2 FLDOE Comprehensive Assessment Data for All Sections in the Florida Teacher Certification Exam (FTCE) for “Other Enrolled Students 2010-2011).
Number
Taking Test
Number
Passing Test
COEHS Pass
Rate
Statewide Average Pass
Rate
Basic Skills or General Knowledge Test (GK)
37
33
89%
90%
Professional Education Test
37
33
89%
93%
Subject Area Exams
44
44
100%
96% Note: “Other enrolled” students include the number of students enrolled in Educator Preparation Institute (EPI) taking the FTCE prior to program completion.

9 | P a g e Updated May 2013
Section 4 COEHS First Year Employment Data (2009-2010 thru 2011-2012) Section 4 Overview: Once a year, the state identifies program completers and matches them to employers. These data are used as part of the College’s continuous improvement efforts as evidenced in UNF’s Institutional Program Evaluation Plans (IPEPs), institutional strategic plans, institutional reports, departmental program reviews, and other uses as deemed appropriate. FDOE data indicates that in 2011-2013 52% of UNF’s completers from initial teacher certification programs, including Educator Preparation graduates, were hired in a public school in the state of Florida. Aggregated data for three years indicate that approximately 50% of program completers are placed in Florida public schools in their first year following graduation. These data exclude UNF program completers hired in private and/or out of state schools, and those who do not get employed in the year in which they graduated for personal, educational, and/or professional reasons. That is, if a program completer is hired two years after graduation he/she is not accounted in these figures.
4.1 Initial Teacher Preparation Programs* and Educator Preparation Institute # of Program Completers 2011-2012
# of Program Completers Hired in 2012-2013
(%) Program Completers Hired in 2012-2013
265 139 52 # of Program Completers 2010-2011
# of Program Completers Hired in 2011-2012
(%) Program Completers Hired in 2011-2012
337 135 40 # of Program Completers 2009-2010
# of Program Completers Hired in 2010-2011
(%) Program Completers Hired in 2010-2011
332 189 56 Source: Florida Department of Education Title II Data. *Art K-12, Biology 6-12, Chemistry 6-12, Elementary Education/ESOL K-6, English 6-12/ESOL, Exceptional Student Education ESOL K-12, Hearing Impaired K-12, Mathematics 6-12, MG Math/MG Science 5-9, Music K-12, PreK-Primary Education/ESOL, Physical Education K-12, Physics, Social Science 6-12, and the Educator Preparation Institute (EPI).
4.2 Other School Professional Degrees* # of Program Completers 2011-2012
# of Program Completers Hired in 2012-2013
(%) Program Completers Hired in 2012-2013
69 62 89 # of Program Completers 2010-2011
# of Program Completers Hired in 2011-2012
(%) Program Completers Hired in 2011-2012
43 36 83 # of Program Completers 2009-2010
# of Program Completers Hired in 2010-2011
(%) Program Completers Hired in 2010-2011
48 37 77 Source: Florida Department of Education. *Educational Leadership and Guidance and Counseling PK-12. UNF’s program completer employment data are provided yearly by the Florida Department of Education (FDOE).

10 | P a g e Updated May 2013
Section 5 Satisfaction Survey Results for all COEHS Teacher Education Program
Completers (2009-2010 and 2010-2011)
Section 5 Overview: The College tracks completers employed in public schools in the state of Florida using the state’s employment database as referenced in Section 4. Using these data COEHS solicits feedback from candidates and employers. Following is a summary of data for graduates of the 2009-2010 and 2010-2011 programs.
Satisfaction Survey Results for all COEHS Teacher Education Program Completers 2009-2010
2010-2011
My program of study at the COEHS at UNF prepared me to:
n
M
SD
n
M
SD
1. . . .use assessment strategies (traditional and
alternative) to assist the continuous development of learners.
64 4.1 .72 42 4.2 .82
2. . . .use effective communication techniques with
students and all other stakeholders. 64 4.4 .61
42
4.5 .77
3. . . .engage in continuous improvement for self and
school. 64 4.5 .64 42 4.4 .83
4. . . .use appropriate techniques and strategies to
promote and enhance critical, creative, and evaluative thinking capabilities of students.
64 4.3 .78 42 4.3 .73
5. . . .use teaching and learning strategies that reflect
students’ culture, learning styles, special needs, and socioeconomic backgrounds.
64 4.4 .83 42 4.5 .67
6. . . .adhere to the code of ethics and principles of
professional conduct of the education profession in Florida.
64 4.8 .38 42 4.7 .58
7. . . .use an understanding of learning and human
development to provide a positive learning environment which supports the intellectual, personal, and social development of all students.
64 4.5 .61 42 4.5 .74
8. . . .effectively teach in my subject area. 64 4.2 .89 42 4.5 .74
9. … create and maintain positive learning environments
in which students are actively engaged in learning, social interaction, cooperative learning and self-motivation.
64 4.5 .55 42 4.5 .63
10. … plan, implement, and evaluate effective instruction in a variety of learning environments.
64 4.4 .75 42 4.4 .74
11. . . .work with various education professionals, parents,
and other stakeholders in the continuous improvement of the educational experiences of students.
64 4.4 .70 42 4.2 1.03
12. . . .use and integrate appropriate technology in teaching
and learning processes. 64 4.3 .80 42 4.1 .99

11 | P a g e Updated May 2013
2009-2010
2010-2011
My program of study at the COEHS at UNF prepared me to:
n
M
SD
n
M
SD 13. . . .write and speak in a logical and understandable style
with appropriate grammar. 64 4.4 .79 42 4.3 .88
14. . . .recognize signs of students’ difficulty with reading
and computational processes. 64 4.0 .90 42 4.2 .95
15. . . .apply appropriate measures to improve students’
reading and computational processes. 64 4.0 .95 42 4.2 .79
16. . . .demonstrate knowledge and understanding of the
Sunshine State Standards. 64 4.4 .83 42 4.1 1.04
17. . . .maintain an orderly and disciplined classroom conducive to student learning.
64 4.4 .73 42 4.1 1.15
18. Use student performance data to facilitate and impact student learning.
64 4.0 1.05 42 3.9 1.19
19. Overall, how satisfied are you with the preparation you received at the College of Education and Human Services at UNF?
64 4.6 .52 42 4.5 .63
Note: All ratings were on a five-point scale. 1: Strongly Disagree; 2: Disagree; 3: No Opinion 4: Agree 5: Strongly Agree
Graduates’ perceptions about their level of satisfaction with the preparation received at UNF has been rated high consistently, 4.6(.52) and 4.5(.63) on a 5 point scale, for both the 2009-2010 and 2010-2011 academic years (see item 19). Data from 2009-2010 and 2010-2011 indicated graduates felt they were best prepared in the areas of ethics, continuous improvement, learning and human development, and learning environments (see items 3, 6, 7 and 9). In 2009-2010, the lowest ranked items included their ability to “recognize signs of students’ difficulty with reading and computational processes” (item 14), “application of measures to improve reading and computational processes” (item 15), and the “use of performance data to facilitate impact on student learning” (item 18). In 2010-2011, the lowest ranked items included the integration of technology (item 12), knowledge and understanding of sunshine state standards (item 16), classroom management (item 17), and the use of performance data to facilitate instruction and impact on student learning (item 19).
12 | P a g e Updated May 2013
Section 6 Employers’ Satisfaction of Beginning Teachers Graduated from COEHS in 2009-2010 and 2010-2011
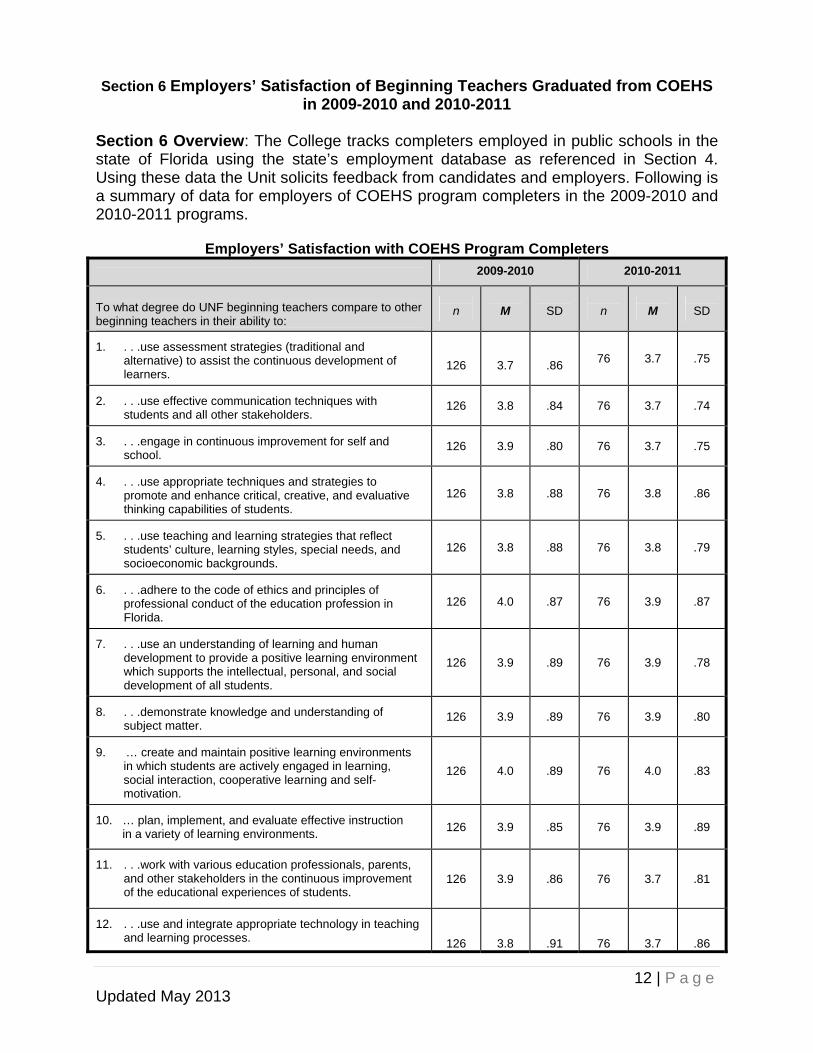
Section 6 Overview: The College tracks completers employed in public schools in the state of Florida using the state’s employment database as referenced in Section 4. Using these data the Unit solicits feedback from candidates and employers. Following is a summary of data for employers of COEHS program completers in the 2009-2010 and 2010-2011 programs.
Employers’ Satisfaction with COEHS Program Completers
2009-2010 2010-2011
To what degree do UNF beginning teachers compare to other beginning teachers in their ability to:
n
M
SD
n
M
SD
1. . . .use assessment strategies (traditional and
alternative) to assist the continuous development of learners.
126
3.7
.86
76 3.7 .75
2. . . .use effective communication techniques with
students and all other stakeholders. 126 3.8 .84 76 3.7 .74
3. . . .engage in continuous improvement for self and
school. 126 3.9 .80 76 3.7 .75
4. . . .use appropriate techniques and strategies to
promote and enhance critical, creative, and evaluative thinking capabilities of students.
126 3.8 .88 76 3.8 .86
5. . . .use teaching and learning strategies that reflect
students’ culture, learning styles, special needs, and socioeconomic backgrounds.
126 3.8 .88 76 3.8 .79
6. . . .adhere to the code of ethics and principles of
professional conduct of the education profession in Florida.
126 4.0 .87 76 3.9 .87
7. . . .use an understanding of learning and human
development to provide a positive learning environment which supports the intellectual, personal, and social development of all students.
126 3.9 .89 76 3.9 .78
8. . . .demonstrate knowledge and understanding of
subject matter. 126 3.9 .89 76 3.9 .80
9. … create and maintain positive learning environments
in which students are actively engaged in learning, social interaction, cooperative learning and self-motivation.
126 4.0 .89 76 4.0 .83
10. … plan, implement, and evaluate effective instruction in a variety of learning environments.
126 3.9 .85 76 3.9 .89
11. . . .work with various education professionals, parents,
and other stakeholders in the continuous improvement of the educational experiences of students.
126 3.9 .86 76 3.7 .81
12. . . .use and integrate appropriate technology in teaching
and learning processes.
126
3.8
.91
76
3.7
.86

13 | P a g e Updated May 2013
2009-2010 2010-2011
13. . . .write and speak in a logical and understandable style
with appropriate grammar. 126 3.9 .84 76 4.0 .77
14. . . .recognize signs of students’ difficulty with reading
and computational processes. 126 3.7 .86 76 3.7 .83
15. . . .apply appropriate measures to improve students’
reading and computational processes. 126 3.7 .89 76 3.8 .87
16. . . .demonstrate knowledge and understanding of the
Sunshine State Standards. 126 3.8 .89 76 3.8 .83
17. . . .maintain an orderly and disciplined classroom conducive to student learning.
126 3.9 .90 76 3.8 .89
18. ….use performance data to facilitate and impact student learning.
126 3.8 .92 76 3.8 .81
19. Overall, how satisfied are you with UNF’s first-year teachers’ performance as compared to other beginning teachers in your school?
126 4.1 .72 76 4.1 .88
Note: All ratings were on a five-point scale. 1: Much Weaker; 2: Weaker; 3: About the Same; 4: Stronger; 5: Much Stronger .
Employers’ perceptions of satisfaction with UNF’s first year teachers’ performance when compared with other first year beginning teachers were rated in a positive way, 4.1 on a 5 point scale for both the 2009-2010 and 2010-2011 academic years (see item 19). Data from employers from 2009-2010 and 2010-2011 showed that the strongest area for the COEHS graduates was their “ability to create and maintain positive learning environments in which students are actively engaged in learning, social interaction, cooperative learning and self-motivation” (item 9) and “ethics and principles of professional conduct” (see item 7). In 2009-2010, three items were perceived to be in need of improvement based on a 5-point scale. These items were item, or the “use of assessment strategies to assist in the continuous development of learners”, item 14, teachers’ ability to “recognize signs of students’ difficulty with reading and computational processes,” and item 15 the application of “appropriate measures to improve students’ reading and computational processes.” In 2010-2011, the lowest ranked items using a 5-point scale were item 1 or “use of assessment strategies to assist in the continuous development of learners”, item 2 or the “use of effective communication techniques”, item 3 “continuous improvement”, item 11 “collaboration with education professionals, parents, and other stakeholders”, item item 12 the ability to “use and integrate appropriate technology in teaching and learning processes,” and item 14 or their ability to recognize signs of student difficulty with reading and computational processes.” .

14 | P a g e Updated May 2013
Section 7 COEHS Average GPA for Completers of Teacher Preparation Programs and Advanced Programs 2010-2011, and 2011-2012
Section 7 Overview: All applicants seeking admission to the College’s initial teacher certification programs, at the undergraduate and graduate levels, must first be admitted to the institution in accordance with the University of North Florida’s established admission requirements and policies. Once admitted to UNF, applicants interested in initial teacher preparation or other school professional programs in the Unit must meet the state’s minimum GPA criteria for admissions. Criteria for admissions are governed by Florida’s Board of Education (BOE) rule and statute, 6A-5.066 and F.S. 1004.04(4)(b)(1)(2), respectively. The aforementioned state statute and rule not only determine minimum admission criteria for applicants but also specify processes and procedures to maintain continued program approval across all institutions with initial teacher preparation programs in the State of Florida. The minimum state required GPA for admission to and exit from teacher preparation programs in the College is 2.5. Data for two academic years indicate that the average entry and exit GPAs for completers of COEHS teacher education and advanced programs exceeded the minimum set by the state.
COEHS Entry and Exit Average GPA for of Teacher Education Programs and Candidates and Other School Professional Programs*
Academic Year
Average Entry GPA
Average Exit GPA
2011-2012
3.25
3.58
2010-2011
3.22
3.61
Source: Teacher Education File managed by the Office of Institutional Research at UNF. The following programs were included in the calculations: Art K-12, Biology 6-12, Chemistry 6-12, Elementary Education K-6, English 6-12/ESOL, Exceptional Student Education ESOL K-12, Hearing Impaired K-12, Mathematics 6-12, MG Math/MG Science 5-9, Music K-12, PreK-Primary Education/ESOL, Physical Education K-12, Physics, Social Science 6-12, and the Educator Preparation Institute (EPI), School Leadership and Guidance and Counseling K-12.
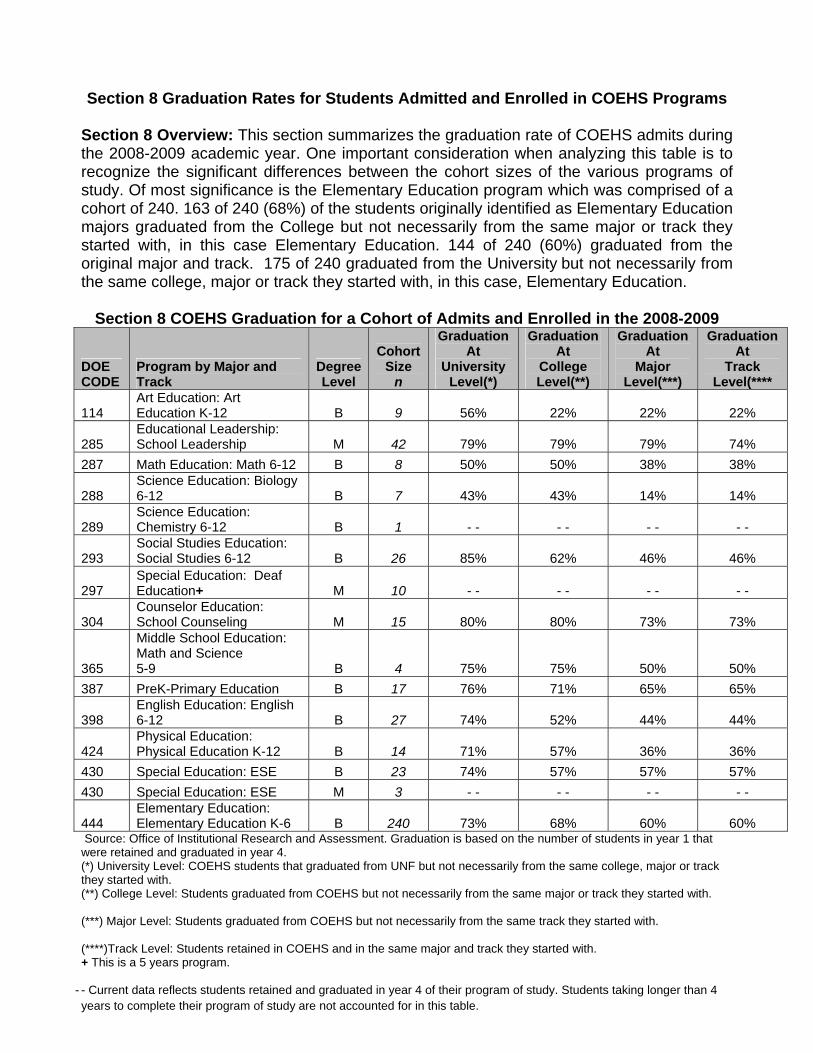
Section 8 Graduation Rates for Students Admitted and Enrolled in COEHS Programs Section 8 Overview: This section summarizes the graduation rate of COEHS admits during the 2008-2009 academic year. One important consideration when analyzing this table is to recognize the significant differences between the cohort sizes of the various programs of study. Of most significance is the Elementary Education program which was comprised of a cohort of 240. 163 of 240 (68%) of the students originally identified as Elementary Education majors graduated from the College but not necessarily from the same major or track they started with, in this case Elementary Education. 144 of 240 (60%) graduated from the original major and track. 175 of 240 graduated from the University but not necessarily from the same college, major or track they started with, in this case, Elementary Education.
Section 8 COEHS Graduation for a Cohort of Admits and Enrolled in the 2008-2009
DOE CODE
Program by Major and Track
DegreeLevel
Cohort Size
n
Graduation At
University Level(*)
Graduation At
College Level(**)
Graduation At
Major Level(***)
Graduation At
Track Level(****
114 Art Education: Art Education K-12 B 9 56% 22% 22% 22%
285 Educational Leadership: School Leadership M 42 79% 79% 79% 74%
287 Math Education: Math 6-12 B 8 50% 50% 38% 38%
288 Science Education: Biology 6-12 B 7 43% 43% 14% 14%
289 Science Education: Chemistry 6-12 B 1 - - - - - - - -
293 Social Studies Education: Social Studies 6-12 B 26 85% 62% 46% 46%
297 Special Education: Deaf Education+ M 10 - - - - - - - -
304 Counselor Education: School Counseling M 15 80% 80% 73% 73%
365
Middle School Education: Math and Science 5-9 B 4 75% 75% 50% 50%
387 PreK-Primary Education B 17 76% 71% 65% 65%
398 English Education: English 6-12 B 27 74% 52% 44% 44%
424 Physical Education: Physical Education K-12 B 14 71% 57% 36% 36%
430 Special Education: ESE B 23 74% 57% 57% 57%
430 Special Education: ESE M 3 - - - - - - - -
444 Elementary Education: Elementary Education K-6 B 240 73% 68% 60% 60%
Source: Office of Institutional Research and Assessment. Graduation is based on the number of students in year 1 that were retained and graduated in year 4. (*) University Level: COEHS students that graduated from UNF but not necessarily from the same college, major or track they started with. (**) College Level: Students graduated from COEHS but not necessarily from the same major or track they started with. (***) Major Level: Students graduated from COEHS but not necessarily from the same track they started with. (****)Track Level: Students retained in COEHS and in the same major and track they started with. + This is a 5 years program.
- - Current data reflects students retained and graduated in year 4 of their program of study. Students taking longer than 4 years to complete their program of study are not accounted for in this table.

16 | P a g e Updated May 2013
Section 9 Employment Retention Rates of COEHS Program Completers
Overview Section 9: Shown below is a College level summary of the percentage of completers retained after their first year of employment and after subsequent years. Using aggregated data approximately 89% of program completers are hired and retained in year 1 and year 2. The figures presented below exclude UNF program completers who were hired in private and/or out of state schools, those who did not get employment in the year in which they graduated for personal, educational, and/or professional reasons, and those who were hired by the second year after graduation. Retention disaggregated at the program level follows (see tables 9.1 thru 9.8).
Retention of Program Completers in Cohorts 2003-2004 through 2009-2010
Cohorts Based on Program
Completion Year
Completers Retained First
Year of Employment (%)*
Percent Retention**
2004‐2005 100% 66% Retained for 8 years
2005‐2006 91% 64% Retained for 7 years
2006‐2007 88% 64% Retained for 6 years
2007‐2008 92% 69% Retained for 5 years
2008‐2009 86% 71% Retained for 4 years
2009‐2010 81% 72% Retained for 3 years
2010‐2011 86% Data Not Yet Available
Note: *Calculations based on FDOE Employment Data. Completers’ first year retention was calculated by establishing a baseline using
first year employment data i.e., completers who were employed within a year of program completion and still employed on the
second year. **Calculations up to eight consecutive years of employment with no break in service.

17 | P a g e Updated May 2013
9.1 2004-2005 Graduates’ Retention Length of Stay in the Classroom: Retention per Program per Employment Year (Average Length of Stay
of 2004-2005 Program Completers in Full-Time Teaching Positions for School Years 2005-2006, 2006-2007, 2007-2008, 2008-2009, 2009-2010, 2010-2011, 2011-2012, and 2012-2013: No Break in Service).
# of Completers 2004‐2005
209
DOE CODE
Hired and Retained in 2005‐
06 (1 Year: Baseline)
*
Y 2 2005‐06 2006‐07
Y 3: 2005‐06, 2006‐07, 2007‐08
Y 4: 2005‐06, 2006‐07, 2007‐08, 2008‐09
Y 5: 2005‐06, 2006‐07, 2007‐08, 2008‐09, 2009‐10
Y 6: 2005‐06, 2006‐07, 2007‐08, 2008‐09, 2009‐10, 2010‐11
Y7 2005‐06, 2006‐07, 2007‐08, 2008‐09, 2009‐10, 2010‐11, 2011‐12
Y8 2005‐06, 2006‐07, 2007‐08, 2008‐09, 2009‐10, 2010‐11, 2011‐12, 2012‐13
Art K‐12 114 2 2(100%) 2(100%) 2(100%) 1(50%) 0% 0% 0%
Music K‐12 202 1 1(100%) 1(100%) 1(100%) 0% 0% 0% 0%
Reading K‐12* 212 1 1(100%) 1(100%) 1(100%) 0% 0% 0% 0%
PE 6‐12 278 1 1(100%) 1(100%) 1(100%) 1(100%) 1(100%) 1(100%) 1(100%)
ED Leadership**** 285 NA NA NA NA NA NA NA NA
Math 6‐12 287 0 NA NA NA NA NA NA NA
Biology 6‐12 288 1 1(100%) 1(100%) 1(100%) 1(100%) 1(100%) 1(100%) 1(100%)
Soc Sci 6‐12 293 3 3(100%) 3(100%) 3(100%) 3(100%) 3(100%) 2(67%) 2(67%)
Hearing Impaired K‐
12 297 4 4(100%) 4(100%) 4(100%) 4(100%) 4(100%) 4(100%) 4(100%)
Guidance/Counseling
PK‐12 304 8 8(100%) 8(100%) 8(100%) 7(88%) 7(88%) 7(88%) 6(75%)
MG Math/MG Science 5‐9 365 6 6(100%) 6(100%) 5(83%) 5(83%) 5(83%) 5(83%) 5(83%)
MG English/Soc. Science 5‐9* 366 1 1(100%) 1(100%) 1(100%) 1(100%) 1(100%) 1(100%) 1(100%)
PreK/Primary/ESOL
PK‐3 END 387 31 31(100%) 29(94%) 26(84%) 24(77%) 23(74%) 21(68%) 20(65%)
English/ESOL 398 2 2(100%) 2(100%) 1(50%) 1(50%) 1(50%) 0% 0%
Exceptional Student Education/ESOL 430 3 3(100%) 3(100%) 3(100%) 3(100%) 3(100%) 3(100%) 2(67%)
Elementary Education (K‐6)/ESOL 444 87 87(100%) 81(93%) 75(86%) 71(82%) 67(77%) 59(68%) 58(67%)
Total(%Retention) N=151 151(100%) 141(93%) 130(86%) 122(81%) 116(77%) 104(69%) 100(66%)
Note-*These program codes are no longer active or are no longer offered as state approved programs at UNF. Percent retention on the First Year of Employment was calculated based on the number of completers hired in public schools in the state of Florida in 2005-2006 (N = 151). Retention rates for years 2 through 8 were calculated based on the Baseline Year (N=151). The employment data excludes candidates not employed in Year 1 (Baseline) but who were later hired in subsequent employment years. ****DOE Code 285 had no data for the 05-06. This code (285) was accidentally removed from the DOE list of approved programs during this cycle of data collection. This numbers represent retention with no break in service.

18 | P a g e Updated May 2013
9.2 2005-2006 Graduates’ Retention Length of Stay in the Classroom: Retention per Program per Employment Year (Average Length of Stay of 2005-2006 Program Completers in their Full-Time Teaching Positions for School Years 2006-2007, 2007-2008, 2008-2009, and 2009-2010, 2010-11, 2011-12, and 2012-13: No Break in Service).
# of Completers 2005‐2006
329
DOE CODE
Hired and Retained in 2006‐07 (1 Y
Baseline)
Y 2 2006‐07 2007‐08
Y 3:
2006‐07, 2007‐08, 2008‐09
Y 4:
2006‐07, 2007‐08, 2008‐09, 2009‐ 10
Y 5:
2006‐07, 2007‐08, 2008‐09, 2009‐10, 2010‐11
Y6 2006‐07, 2007‐08, 2008‐09, 2009‐10, 2010‐11, 2011‐12
Y7 2006‐07, 2007‐08, 2008‐09, 2009‐10, 2010‐11, 2011‐12, 2012‐13
Art K‐12 114 1 1(100%) 1(100%) 1(100%) 1(100%) 1(100%) 1(100%)
Reading K‐12* 212 3 2(67%) 2(100%) 2(100%) 2(100%) 2(100%) 2(100%)
ED Leadership 285 25 24(96%) 22(88%) 22(88%) 21(84%) 20(80%) 20(80%)
Math 6‐12 287 2 2(100%) 2(100%) 2(100%) 1(50%) 1(50%) 1(50%)
Biology 6‐12 288 5 5(100%) 5(100%) 5(100%) 5(100%) 5(100%) 4(80%)
Social Science 6‐12 293 6 5(83%) 5(83%) 5(83%) 5(83%) 5(83%) 5(83%)
Hearing Impaired K‐12 297 6 5(83%) 5(83%) 5(83%) 4(67%) 4(67%) 4(67%)
Guidance/Counseling PK‐
12 304 11 9(82%) 9(82%) 9(82%) 8(73%) 8(73%) 5(45%)
MG Math/MG Sci 5‐9 365 13 12(92%) 10(77%) 10(77%) 10(77%) 10(77%) 10(77%)
PreK/Primary/ESOL PK‐3
END 387 32 29(91%) 25(78%) 24(75%) 22(69%) 18(69%) 16(50%)
English/ESOL 398 6 6(100%) 6(100%) 5(83%) 5(83%) 4(83%) 4(83%)
Physical Education K‐12 424 4 4(100%) 3(75%) 3(75%) 2(50%) 2(50%) 2(50%)
Exceptional Student Education/ESOL 430 18 17(94%) 14(78%) 14(78%) 14(78%) 11(78%) 11(78%)
Elementary Education (K‐6)/ESOL 444 115 103(90%) 93(81%) 90(78%) 85(74%) 81(74%) 73(63%)
Total(%Retention) N=247 224(91%) 202(82%) 197(80%) 185(75%) 172(70%) 158(64%)
Note‐*This program code is no longer active or are no longer offered as state approved programs at UNF. Percent retention on the
First Year of Employment was calculated based on the number of completers hired in public schools in the state of Florida in 2006‐
2007 (N = 247), a year after graduation. Retention rates for years 2 through 7 were calculated based on the Baseline Year (N=247).
The employment data excludes candidates not employed in Year 1 (Baseline) but who were later hired in subsequent employment
years. These numbers represent retention with no break in service.
19 | P a g e Updated May 2013
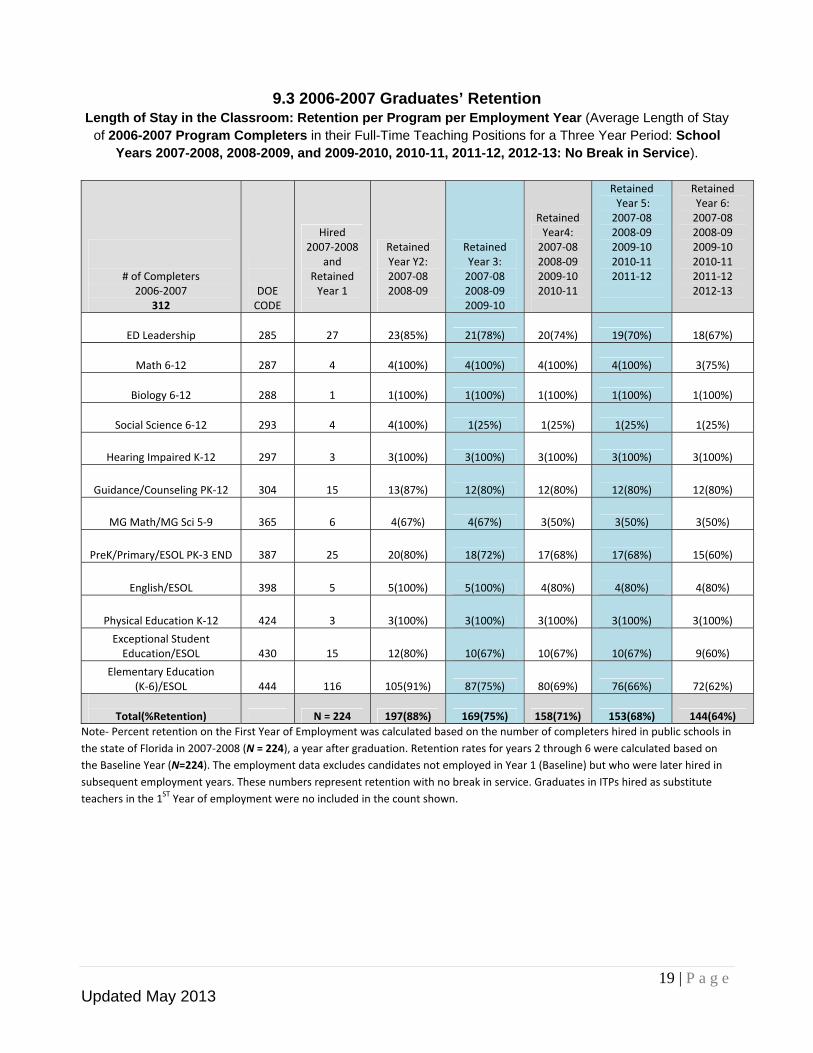
9.3 2006-2007 Graduates’ Retention Length of Stay in the Classroom: Retention per Program per Employment Year (Average Length of Stay
of 2006-2007 Program Completers in their Full-Time Teaching Positions for a Three Year Period: School Years 2007-2008, 2008-2009, and 2009-2010, 2010-11, 2011-12, 2012-13: No Break in Service).
# of Completers 2006‐2007
312
DOE CODE
Hired 2007‐2008
and Retained Year 1
Retained Year Y2: 2007‐08 2008‐09
Retained Year 3: 2007‐08 2008‐09 2009‐10
Retained Year4: 2007‐08 2008‐09 2009‐10 2010‐11
Retained Year 5: 2007‐08 2008‐09 2009‐10 2010‐11 2011‐12
Retained Year 6: 2007‐08 2008‐09 2009‐10 2010‐11 2011‐12 2012‐13
ED Leadership 285 27 23(85%) 21(78%) 20(74%) 19(70%) 18(67%)
Math 6‐12 287 4 4(100%) 4(100%) 4(100%) 4(100%) 3(75%)
Biology 6‐12 288 1 1(100%) 1(100%) 1(100%) 1(100%) 1(100%)
Social Science 6‐12 293 4 4(100%) 1(25%) 1(25%) 1(25%) 1(25%)
Hearing Impaired K‐12 297 3 3(100%) 3(100%) 3(100%) 3(100%) 3(100%)
Guidance/Counseling PK‐12 304 15 13(87%) 12(80%) 12(80%) 12(80%) 12(80%)
MG Math/MG Sci 5‐9 365 6 4(67%) 4(67%) 3(50%) 3(50%) 3(50%)
PreK/Primary/ESOL PK‐3 END 387 25 20(80%) 18(72%) 17(68%) 17(68%) 15(60%)
English/ESOL 398 5 5(100%) 5(100%) 4(80%) 4(80%) 4(80%)
Physical Education K‐12 424 3 3(100%) 3(100%) 3(100%) 3(100%) 3(100%)
Exceptional Student Education/ESOL 430 15 12(80%) 10(67%) 10(67%) 10(67%) 9(60%)
Elementary Education (K‐6)/ESOL 444 116 105(91%) 87(75%) 80(69%) 76(66%) 72(62%)
Total(%Retention) N = 224 197(88%) 169(75%) 158(71%) 153(68%) 144(64%)
Note‐ Percent retention on the First Year of Employment was calculated based on the number of completers hired in public schools in
the state of Florida in 2007‐2008 (N = 224), a year after graduation. Retention rates for years 2 through 6 were calculated based on
the Baseline Year (N=224). The employment data excludes candidates not employed in Year 1 (Baseline) but who were later hired in
subsequent employment years. These numbers represent retention with no break in service. Graduates in ITPs hired as substitute
teachers in the 1ST Year of employment were no included in the count shown.

20 | P a g e Updated May 2013
9.4 2007-2008 Graduates’ Retention Length of Stay in the Classroom: Retention per Program per Employment Year (Average Length of Stay
of 2007-2008 Program Completers in a Full-Time Teaching Position in their first, second, third, and fourth and fifth years of consecutive employment: Employment Years 2008-2009, 2009-2010, 2011-2012, 2011-
2012, 2012-2013).
# of Completers 2007‐2008
DOE CODE
Hired and Retained in 2008‐2009 Baseline Year 1
Year 2: 2008‐09 2009‐10
Year 3: 2008‐09 2009‐10 2010‐11
Year 4: 2008‐09 2009‐10 2010‐11 2011‐12
Year 5: 2008‐09 2009‐10 2010‐11 2011‐12 2012‐13
Art K‐12 114 2 1(50%) 1(50%) 1(50%) 1(50%)
Music K‐12 202 1 1(100%) 1(100%) 1(50%) 1(50%)
ED Leadership 285 47 45(96%) 39(83%) 38(81%) 38(81%)
Math 6‐12 287 5 3(60%) 3(60%) 3(60%) 3(60%)
Biology 6‐12 288 1 1(100%) 1(100%) 1(100%) 1(100%)
Chemistry 6‐12 289 1 1(100%) 1(100%) 1(100%) 1(100%)
Social Science 6‐12 293 5 4(80%) 2(40%) 2(40%) 1(20%)
Hearing Impaired K‐12 297 5 4(80%) 4(80%) 4(80%) 4(80%)
Guid/Counseling PK‐12 304 13 12(92%) 12(92%) 12(92%) 12(92%)
MG Math/MG Sci 5‐9 365 8 8(100%) 8(100%) 7(88%) 6(75%)
PreK/Primary/ESOL PK‐
3 END* 387 29 25(86%) 23(86%) 20(69%) 18(62%)
English/ESOL 398 5 5(100%) 5(100%) 5(100%) 3(60%)
Physical Education K‐12 424 1 1(100%) 0(0%) 0(0%) 0(0%)
Exceptional Student Education/ESOL 430 19 19(100%) 16(84%) 15(79%) 14(74%)
Elementary Education (K‐6)/ESOL 444 116 108(93%) 95(85%) 85(73%) 75(65%)
Total(%Retention) N = 258 238(92%) 211(82%) 195(76%) 178(69%)
Note‐ Percent retention on the First Year of Employment was calculated based on the number of completers hired in public schools in
the state of Florida in 2008‐2009 (N = 258), a year after graduation. Retention rates for years 2 through 5 were calculated based on
the Baseline Year (N=258). The employment data excludes candidates not employed in Year 1 (Baseline) but who were later hired in
subsequent employment years. These numbers represent retention with no break in service. Graduates in ITPs hired as substitute
teachers in the 1ST Year of employment were no included in the count shown.
21 | P a g e Updated May 2013
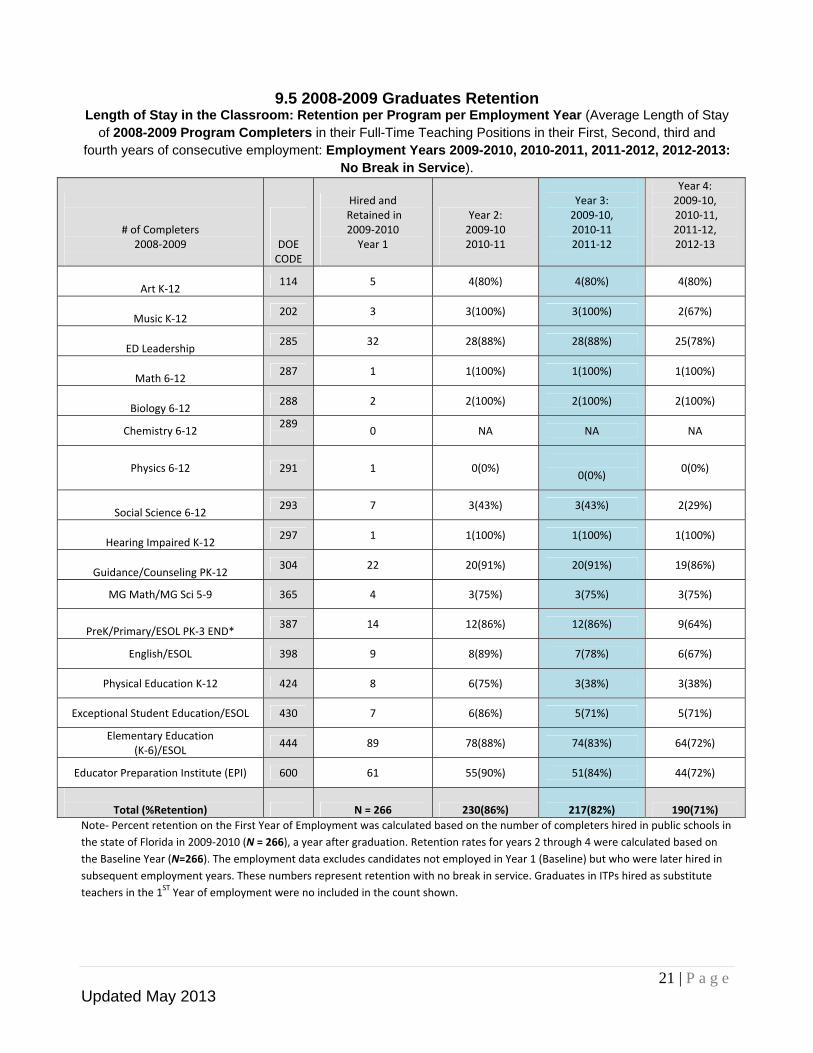
9.5 2008-2009 Graduates Retention Length of Stay in the Classroom: Retention per Program per Employment Year (Average Length of Stay
of 2008-2009 Program Completers in their Full-Time Teaching Positions in their First, Second, third and fourth years of consecutive employment: Employment Years 2009-2010, 2010-2011, 2011-2012, 2012-2013:
No Break in Service).
# of Completers 2008‐2009
DOE CODE
Hired and Retained in 2009‐2010 Year 1
Year 2: 2009‐10 2010‐11
Year 3: 2009‐10, 2010‐11 2011‐12
Year 4: 2009‐10, 2010‐11, 2011‐12, 2012‐13
Art K‐12
114 5 4(80%) 4(80%) 4(80%)
Music K‐12
202 3 3(100%) 3(100%) 2(67%)
ED Leadership
285 32 28(88%) 28(88%) 25(78%)
Math 6‐12
287 1 1(100%) 1(100%) 1(100%)
Biology 6‐12
288 2 2(100%) 2(100%) 2(100%)
Chemistry 6‐12 289
0 NA NA NA
Physics 6‐12 291 1
0(0%)
0(0%)
0(0%)
Social Science 6‐12
293 7 3(43%) 3(43%) 2(29%)
Hearing Impaired K‐12
297 1 1(100%) 1(100%) 1(100%)
Guidance/Counseling PK‐12
304 22 20(91%) 20(91%) 19(86%)
MG Math/MG Sci 5‐9 365 4 3(75%) 3(75%) 3(75%)
PreK/Primary/ESOL PK‐3 END*
387 14 12(86%) 12(86%) 9(64%)
English/ESOL 398 9 8(89%) 7(78%) 6(67%)
Physical Education K‐12 424 8 6(75%) 3(38%) 3(38%)
Exceptional Student Education/ESOL 430 7 6(86%) 5(71%) 5(71%)
Elementary Education (K‐6)/ESOL
444 89 78(88%) 74(83%) 64(72%)
Educator Preparation Institute (EPI) 600 61 55(90%) 51(84%) 44(72%)
Total (%Retention) N = 266 230(86%) 217(82%) 190(71%)
Note‐ Percent retention on the First Year of Employment was calculated based on the number of completers hired in public schools in
the state of Florida in 2009‐2010 (N = 266), a year after graduation. Retention rates for years 2 through 4 were calculated based on
the Baseline Year (N=266). The employment data excludes candidates not employed in Year 1 (Baseline) but who were later hired in
subsequent employment years. These numbers represent retention with no break in service. Graduates in ITPs hired as substitute
teachers in the 1ST Year of employment were no included in the count shown.

22 | P a g e Updated May 2013
9.6 2009-2010 Graduates’ Retention Length of Stay in the Classroom: Retention per Program per Employment Year (Average Length of Stay of 2009-2010 Program Completers in Full-Time Teaching Positions in their First, Second, third and fourth years of consecutive employment: Employment Years 2010-2011, 2011-2012, 2012-2013: No Break in
Service).
# of Completers 2009‐2010
380
DOE CODE
Hired and Retained in 2010‐2011
Baseline Year 1
Year 2: 2010‐11 2011‐2012
Year 3: 2010‐11 2011‐12 2012‐2013
Art K‐12 114
3 2(67%) 2(67%)
Music K‐12 202
1 1(100%) 1(100%)
ED Leadership 285
25 24(96%) 22(88%)
Math 6‐12 287
3 2(66%) 1(33%)
Biology 6‐12 288
1 1(100%) 1(100%)
Social Science 6‐12 293
10 7(70%) 6(60%)
Hearing Impaired K‐12 297
4 4(100%) 3(75%)
Guidance/Counseling PK‐12 304
12 10(83%) 10(83%)
MG Math/MG Sci 5‐9 365
7 6(86%) 4(57%)
PreK/Primary/ESOL PK‐3 END* 387
24 20(83%) 19(79%)
English/ESOL 398
9 8(89%) 8(89%)
Physical Education K‐12 424
3 2(67%) 2(67%)
Exceptional Student Education/ESOL 430
10 8(80%) 7(70%)
Elementary Education (K‐6)/ESOL 444
91 68(75%) 60(66%)
Educator Preparation Institute (EPI) 600
23 20(87%) 17(74%)
Total (%Retention) N =226 183(81%) 163(72%)
Note‐ Percent retention on the First Year of Employment was calculated based on the number of completers hired in public schools in
the state of Florida in 2010‐2011 (N = 226), a year after graduation. Retention rates for years 2 through 3 were calculated based on
the Baseline Year (N=226). The employment data excludes candidates not employed in Year 1 (Baseline) but who were later hired in
subsequent employment years. These numbers represent retention with no break in service. Graduates in ITPs hired as substitute
teachers in the 1ST Year of employment were no included in the count shown.

23 | P a g e Updated May 2013
9.7 2010-2011 Graduates’ Retention
Length of Stay in the Classroom: Retention per Program per Employment Year (Average Length of Stay of 2011-2012 Program Completers in Full-Time Teaching Positions in their First and Second years of
consecutive employment: Employment Years 2011-2012, 2012-2013: No Break in Service).
# of Completers 2010‐2011
380
DOE CODE
Hired and Retained in 2011‐2012
Baseline Year 1
Year 2: 2011‐12 2012‐2013
Art K‐12 114
1 1(100%)
Music K‐12 202
2 1(50%)
ED Leadership 285
26 22(85%)
Math 6‐12 287
3 2(67%)
Biology 6‐12 288
0 0
Social Science 6‐12 293
6 3(50%)
Hearing Impaired K‐12 297
2 2(100%)
Guidance/Counseling PK‐12 304
10 9(90%)
MG Math/MG Sci 5‐9 365 6
5(83%)
PreK/Primary/ESOL PK‐3 END* 387
9 9(100%)
English/ESOL 398 8
8(100)
Physical Education K‐12 424 0
0
Exceptional Student Education/ESOL 430 11
9(82%)
Elementary Education (K‐6)/ESOL 444
76 66(87%)
Educator Preparation Institute (EPI) 600 11
10(91%)
Total (%Retention) N = 171 147(86%)
Note‐ Percent retention on the First Year of Employment was calculated based on the number of completers hired in public schools in
the state of Florida in 2011‐2012 (N = 171), a year after graduation. Retention rate for year 2 through 3 was calculated based on the
Baseline Year (N=171). Graduates in ITPs hired as substitute teachers in the 1ST Year of employment were no included in the count
shown.

24 | P a g e Updated May 2013
9.8 2011-2012 Graduates’ Retention Length of Stay in the Classroom: Retention per Program per Employment Year (Average Length of Stay
for 2011-12 Program Completers in Full-Time Teaching Positions: Employment Years 2012-2013).
# of Completers 2011‐2012
334
DOE CODE
Hired and Retained in 2012‐2013
Baseline Year 1
Year 2: 2012‐13
2013‐2014 (Data NA)
Art K‐12 114 1
Music K‐12 202 2
ED Leadership 285 49
Math 6‐12 287 6
Biology 6‐12 288 0
Social Science 6‐12 293 9
Hearing Impaired K‐12 297 1
Guidance/Counseling PK‐12 304 13
MG Math/MG Sci 5‐9 365 3
PreK/Primary/ESOL PK‐3 END* 387 11
English/ESOL 398 3
Physical Education K‐12 424 6
Exceptional Student Education/ESOL 430 13
Elementary Education (K‐6)/ESOL 444 75
Educator Preparation Institute (EPI) 600 9
Total (%Retention) N = 201
Note‐ Percent retention on the First Year of Employment was calculated based on the number of completers hired in public schools in
the state of Florida in 2012‐2013 (N = 201), a year after graduation. Graduates in ITPs hired as substitute teachers in the 1ST Year of
employment were no included in the count shown.

25 | P a g e Updated May 2013
9.10 Summary of Retention at Year 3 and Year 5 COEHS retention rate for Year 3 appproximates 80% (cohort years 2004‐05 thru 2009‐10) and
73% (cohort years 2004‐05 thru 2007‐08)
Completion Year
Program Retention Y3 Retention Y5 2004-2005
NA NA
2005-2006 88% 84%
2006-2007 School Leadership 78% 70%
2007-2008
83% 81% 2008-2009 88%
2009-2010 88%
Completion Year
Program Retention Y3 Retention Y5 2004-2005
100% 88%
2005-2006 82% 73%
2006-2007 Guidance and Counseling 80% 80%
2007-2008
92% 92% 2008-2009 91%
2009-2010 83%
Completion Year
Program Retention Y3 Retention Y5 2004-2005
ART K-12
100% 50% 2005-2006 100% 100% 2006-2007 NA NA 2007-2008 50% 50% 2008-2009 80%
2009-2010 67%
Completion Year
Program Retention Y3 Retention Y5 2004-2005
Mathematics 6-12
2005-2006 100% 50% 2006-2007 100% 100% 2007-2008 60% 60% 2008-2009 100%
2009-2010 66%
Completion Year
Program Retention Y3 Retention Y5 2004-2005
MG Science and Math 5-9
100% 83% 2005-2006 77% 77% 2006-2007 67% 60% 2007-2008 100% 75% 2008-2009 75%
2009-2010 57%

26 | P a g e Updated May 2013
Completion Year
Program Retention Y3 Retention Y5 2004-2005
English Education
100% 50% 2005-2006
100% 83% 2006-2007 100% 80% 2007-2008 100% 100% 2008-2009 78%
2009-2010 89%
Completion Year
Program Retention Y3 Retention Y5 2004-2005
Social Studies Education
100% 100% 2005-2006 83% 83% 2006-2007 25% 25% 2007-2008 40% 20% 2008-2009 43% 2009-2010 60%
Completion Year
Program Retention Y3 Retention Y5 2004-2005
Biology Education
100% 100% 2005-2006 100% 100% 2006-2007 100% 100% 2007-2008 100% 100% 2008-2009 100%
2009-2010 100%
Completion Year
Program Retention Y3 Retention Y5 2004-2005
Exceptional Student Education
100% 100% 2005-2006 78% 78% 2006-2007 67% 67% 2007-2008 84% 74% 2008-2009 71%
2009-2010 70%
Completion Year
Program Retention Y3 Retention Y5 2004-2005
Deaf Education
100% 100% 2005-2006 83% 67% 2006-2007 100% 100% 2007-2008 80% 80% 2008-2009 100%
2009-2010 75%

27 | P a g e Updated May 2013
Completion Year
Program Retention Y3 Retention Y5 2004-2005
PreK Primary Education
94% 77% 2005-2006 78% 69% 2006-2007 72% 68% 2007-2008 86% 62% 2008-2009 64%
2009-2010 79%
Completion Year
Program Retention Y3 Retention Y5 2004-2005
Elementary Education
93% 82% 2005-2006 81% 74% 2006-2007 75% 66% 2007-2008 85% 65% 2008-2009 84%
2009-2010 66%
Completion Year
Program Retention Y3 Retention Y5 2004-2005
Educator Preparation Institute
2005-2006 2006-2007 2007-2008 2008-2009 84% 2009-2010 74%
Section 10 Impact Data: Florida’s Value-Added Model Scores
Overview Section 10: Value-Added: Candidates demonstrate impact on P-12 student learning based on student achievement data during the first year of teaching. The percentage of completers in the analyses is very low because the calculations used the total number of program completers each year even if they were not teaching in their first year after graduation or were employed in private schools or out of state. For UNF, the highest percentage of program completers with VAM scores was 17%. VAM mean scores for UNF program completers show COEHS program completers have VAM scores slightly below “0” indicating that on average students of completers from UNF did not perform better or lower than expected after controlling for all the factors in the model used to calculate the VAM scores. In comparison to all first year teachers in the state, UNF’s average VAM scores are similar to state VAM scores, except for scores for completers in Reading and ReadingProg in 2009-2010 which were slightly lower that the state’s average.

28 | P a g e Updated May 2013
10.1 Teacher Education Program Completer VAM Scores Completion Year Subject Completers
(n ) Completers in the Analysis (n)
% Completers with VAM Scores
Mean Completers’ VAM Score
SE Completers’ VAM Score
2007‐2008
All 401 65 16.2% ‐0.040 0.029
Math 401 48 12.0% ‐0.029 0.044
MathProg 203 35 17.2% ‐0.022 0.055
Reading 401 51 12.7% ‐0.041 0.021
ReadProg 197 34 17.3% ‐0.053 0.027
2008‐2009 2009‐2010
All 404 60 14.9% 0.014 0.044
Math 404 45 11.1% 0.047 0.055
MathProg 197 29 14.7% ‐0.055 0.070
Reading 404 47 11.6% ‐0.054 0.044
ReadProg 200 34 17.0% ‐0.065 0.056
All 353 60 17.0% ‐0.073 0.036
Math 353 39 11.0% ‐0.020 0.050
MathProg 179 30 16.8% ‐0.079 0.051
Reading 353 46 13.0% ‐0.109 0.043
ReadProg 177 36 20.3% ‐0.093 0.041
COEHS and State VAM Scores and Standard Error Trend for All Subject Areas
All‐UNF All 1158 185 16% ‐.0300 .022
All‐State All‐State 30730 6806 22.1% ‐0.030 0.005
All‐UNF Math All Math‐UNF 1158 132 11.4% .0000 .028
All‐State Math All‐State Math 30730 4133 13.4% ‐0.028 0.006
All‐UNF MathProg
All‐UNF MathProg
579 94 16.2 ‐.0500 .033
All‐State MathProg
All‐State MathProg
10127 1578 15.6% ‐0.057 0.008
All‐UNF Reading
All UNF‐Reading 1158 144 12.4% ‐.0670 .0210
All‐State Reading
All‐State Reading
30730 5037 16.4% ‐0.034 0.006
All‐UNF ReadingProg
All‐UNF ReadingProg
574 104 18.1 ‐.071 .024
All‐State ReadingProg
All‐State ReadingProg
11273 2073 18.4% ‐0.038 0.009
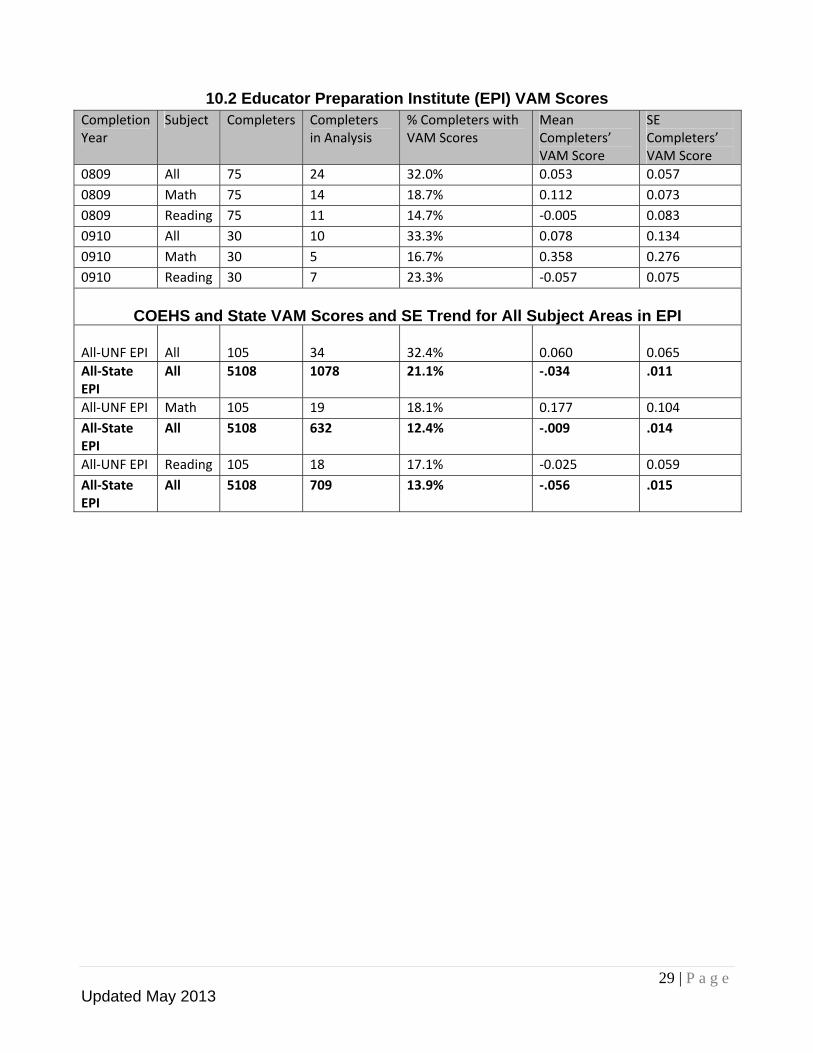
Similarly, data were reported for UNF’s EPI state approved program as shown in 10.2. The percentage of completers with VAM scores is slightly higher than those reported for the initial teacher preparation program as shown 10.1. For UNF, the highest percentage of EPI program completers included in the VAM calculation was 33.3% inclusive of all subjects in 2009-10.
VAM mean scores for UNF’s EPI program completers shown in 10.2 demonstrates that COEHS EPI completers have VAM scores slightly above“0.” A VAM score above 0 indicates that on average students of EPI completers from UNF performed better than expected or predicted by the VAM model. In comparison to all EPI completers in the state, UNF’s average VAM scores are higher. For example, on the average student of UNF’s EPI VAM math scores are 17.7% above the state average for growth in math.
29 | P a g e Updated May 2013
10.2 Educator Preparation Institute (EPI) VAM Scores Completion Year
Subject Completers Completers in Analysis
% Completers with VAM Scores
Mean Completers’ VAM Score
SE Completers’ VAM Score
0809 All 75 24 32.0% 0.053 0.057
0809 Math 75 14 18.7% 0.112 0.073
0809 Reading 75 11 14.7% ‐0.005 0.083
0910 All 30 10 33.3% 0.078 0.134
0910 Math 30 5 16.7% 0.358 0.276
0910 Reading 30 7 23.3% ‐0.057 0.075
COEHS and State VAM Scores and SE Trend for All Subject Areas in EPI All‐UNF EPI All 105 34 32.4% 0.060 0.065
All‐State EPI
All 5108 1078 21.1% ‐.034 .011
All‐UNF EPI Math 105 19 18.1% 0.177 0.104
All‐State EPI
All 5108 632 12.4% ‐.009 .014
All‐UNF EPI Reading 105 18 17.1% ‐0.025 0.059
All‐State EPI
All 5108 709 13.9% ‐.056 .015