EFFECTIVELY in mathematics education research · EFFECTIVELY IN MATHEMATICS EDUCATION RESEARCH ......
58
USING STATISTICS EFFECTIVELY in mathematics ® The American Statistical Association education research A report from a series of workshops organized by the American Statistical Association with funding from the National Science Foundation 2007
Transcript of EFFECTIVELY in mathematics education research · EFFECTIVELY IN MATHEMATICS EDUCATION RESEARCH ......

USING STATISTICS EFFECTIVELY in mathematics
®
The American Statistical Association
education research
A report from a series of workshops organized by the American Statistical Association with funding from the National Science Foundation
2007
USING STATISTICS EFFECTIVELY IN MATHEMATICS
EDUCATION RESEARCH
A report from a series of workshops organized by the American Statistical Association with funding from the
National Science Foundation
Working Group on Statistics in Mathematics Education Research Richard Scheaffer, Chair Martha Aliaga Marie Diener-West Joan Garfield Traci Higgins Sterling Hilton Gerunda Hughes Brian Junker Henry Kepner Jeremy Kilpatrick
Richard Lehrer Frank K. Lester Ingram Olkin Dennis Pearl Alan Schoenfeld Juliet Shaffer Edward Silver William Smith F. Michael Speed Patrick Thompson
2007

1
PREFACE This report had its genesis in a telephone call to the American Statistical Association (ASA) from the Education and Human Resources Directorate of the National Science Foundation. The essence of the questions asked was, “Can the statistics community offer any contributions to improving the quality of mathematics education research? If so, are you willing to contribute to discussions on the issue?” Knowing that mathematics education was in the national limelight and that statisticians value research on applied problems, the answer to both was a qualified “yes”, with the qualification being that ASA was not an education research organization and, if they were to be fruitful, the discussions would have to include mathematics education researchers. The initial discussion did, in fact, appear to be fruitful, leading to an NSF-funded project to hold a series of workshops that would bring together statisticians and mathematics education researchers for deeper discussions. Three workshops were held over a three-year period, each with about twenty participants nearly equally divided between mathematics educators and statisticians. The first concentrated on exchanging information on the “lay of the land” within the respective fields, with the mathematics educators giving an overview of the status of mathematics education research and the statisticians providing insights on modern statistical methods that could be more widely used in such research (longitudinal studies, hierarchical models, meta analysis, among them). Participants in the second workshop reviewed a series of research papers in mathematics education primarily to determine the types of information that was presented and, perhaps more importantly, the types that tended to be missing. These discussions led to an outline of guidelines for evaluating and reporting mathematics education research. During the third workshop these guidelines were revised and molded into a rough draft of the current report. Always kept at a professional level, the discussions consisted of amazingly frank and deep debates on issues surrounding the important research questions in mathematics education and the methodologies that might be employed to solve them. Both sides were open to new ideas and receptive to criticisms of old ones. All participants seemed pleased to have the opportunity to communicate with each other, and hoped for more such exchanges. Equally amazing was the consensus reached on the final report, which you now have before you. We hope that the reader will approach the document with the same sense of openness and opportunity that led to its development. We thank all the participants in the workshop for their many contributions and especially want to thank Geoffrey Birky and Toni Smith, then graduate students at the University of Maryland, for their excellent work as recorders during the workshops. Richard L. Scheaffer William B. Smith

2
CONTENTS
Page PREFACE
1
INTRODUCTION 3 Calls for Scientific Research in Education 4 The Need for Cumulative Research 4 Components of a Research Program 5 GUIDELINES FOR THE COMPONENTS OF A RESEARCH PROGRAM
7
Generate Research Ideas 7 Frame the Research Program 9 Examine the Research Program 17 Generalize the Research Program 19 Extend the Research Program 22 Appendix A: A STRUCTURED APPROACH TO MATHEMATICS EDUCATION RESEARCH
24
Core Documents 24 A Model for Mathematics Education Research: Background 27 A Typical Medical Model for Clinical Trials Research 27 Appendix B: IMPORTANT CONSIDERATIONS FOR SCIENTIFICALLY BASED RESEARCH IN MATHEMATICS EDUCATION
30
Measurement 30 Unit of Randomization versus Unit of Statistical Analysis in Designed Experiments or Sample Surveys; Group Randomized Designs
37
Experimental versus Observational Research 39 Pre-Post Scores (Gain Scores) 40 Appendix C: COMMENTS ON CRITICAL AREAS FOR COOPERATION BETWEEN STATISTICS AND MATHEMATICS EDUCATION RESEARCH
43
Qualitative Versus Quantitative Research 43 Educating Graduate Students and Keeping Mathematics Education Faculty Current in Education Research
44
Statistics Practices and Methodologies 44 Building Partnerships and Collaboratives 48 REFERENCES
50
WORKING GROUP ON STATISTICS IN MATHEMATICS EDUCATION RESEARCH
54

3
INTRODUCTION
No one would think of getting to the Moon or of wiping out a disease without research. Likewise, one cannot expect reform
efforts in education to have significant effects without research-based knowledge to guide them.
(National Research Council [NRC], 2002, p. 1)
The central idea of evidence-based education—that education policy and practice ought to be fashioned based on what is known
from rigorous research—offers a compelling way to approach reform efforts.
(NRC, 2005, p. vii)
The teaching and learning of mathematics in U.S. schools is in urgent need of improvement.
(RAND Mathematics Study Panel, 2003, p. xi)
As these quotations indicate, sound reform of education policy and practice must be based on sound research, and school mathematics would continue to benefit greatly from both such reform and such research. The three reports cited above call for promoting quality in research, building a knowledge base and infrastructure to guide research and practice, and strengthening the links between research and practice (see Appendix A for summaries of the reports). In that spirit, the present report is aimed at developing a stronger foundation of research in mathematics education, one that will be scientific, cumulative, interconnected, and intertwined with teaching practice. This report, which arose from structured conversations between statisticians and mathematics educators, is designed to show how and why researchers in mathematics education might use statistical methods more effectively in framing, conducting, and reporting their work. The goal is to describe some fundamental statistical issues that can arise in mathematics education research and to provide guidelines for reporting and evaluating that research. In recent years, many researchers in mathematics education have eschewed quantitative methods in favor of qualitative methods. That is unfortunate because both are necessary if research is adequately to inform mathematics teaching and learning. This report is intended to provide some guidance as to where and how the two can work in complementary fashion. After sketching some forces affecting current education research, we use the components of a research program in mathematics education to structure the presentation of guidelines for reporting and evaluating research studies. Four research practices (measurement, randomization, experimental versus observational research, and gain scores) in the field that are in need of special consideration and improvement are presented in Appendix B. Finally, some comments to the field regarding the debate over qualitative versus quantitative research, the statistical education of mathematics education researchers, relatively new statistical methodologies applicable to mathematics education
4
research, and the need for partnerships and collaboratives in education research—all of which expand opportunities for further interaction between the fields of statistics and mathematics education—are addressed in Appendix C. Calls for Scientific Research in Education Attention to the contributions of statistics to mathematics education research is especially important as educators and policy makers debate the nature of scientific research in education (NRC, 2002). The No Child Left Behind Act of 2001 (NCLB, 2002) calls for scientifically based research, which the act defines as “research that involves the application of rigorous, systematic, and objective procedures to obtain reliable and valid knowledge relevant to education activities and programs.” Scientifically based research
• Employs systematic empirical methods that draw on observations, sample surveys, or experimentation;
• Involves rigorous data analyses that are adequate to test the stated hypotheses and justify the general conclusions drawn;
• Relies on measurements or observational methods that provide reliable and valid data across evaluators and observers, across multiple measurements and observations, and across studies by the same or different investigators;
• Is evaluated, as appropriate, using qualitative, quantitative, exploratory, experimental, or quasi-experimental designs, with random assignment being preferred for studies that attempt to make generalizations to broad populations; and
• Ensures that experimental studies are presented in sufficient detail and clarity to allow for replication of both the experiment and the analyses.
Clearly, statistical concepts and methodologies permeate the requirements listed above. It is encouraged, therefore, that mathematics education researchers and statisticians work together and with others to provide guidance to those researchers seeking to conduct scientifically based research in mathematics education. We hope that the mathematics education research community, broadly defined, can benefit from open discussion and serious application of these guidelines to enhance the quality of mathematics education. The Need for Cumulative Research If research in mathematics education is to provide an effective influence on practice, it must become more cumulative in nature. New research needs to build on existing research to produce a more coherent body of work. (See Appendix A and the reports summarized there.) Researchers in mathematics education are, of course, and should continue to be, free to pursue the problems and questions that interest them. In order for such work to influence practice, however, it must be situated within a larger corpus. School mathematics is an excellent venue for small-scale studies because mathematics learning has many facets, and the classroom is a manageable unit that can be studied in depth and detail. Such studies can cumulate, however, only if they are connected. Studies cannot be linked together well unless researchers are consistent in their use of interventions; observation and measurement tools; and techniques of data collection, data

5
analysis, and reporting. What is done and how it is done—the observations and interventions made and the measures used—need to be reported in sufficient detail so that others can either add to the work or synthesize it easily. And as Raudenbush (2005) points out, a well-integrated research program demands methodological diversity. These guidelines are offered with a goal of promoting opportunities for mathematics education research to have a collective impact. Components of a Research Program Individual research studies in mathematics education can be classified along many dimensions. They can be seen as primarily basic or primarily applied. They can be categorized according to the type of data they collect, analyze, and report—whether quantitative, qualitative, or both—or according to the type of research questions they address. They can employ observation, addressing mathematics teaching and learning as they are, or they can employ intervention, addressing mathematics teaching and learning as they might be. All good research is ultimately grounded in theory, but an individual study may have any of several relations to theory, helping to generate it, elaborate it, test it, or refute it. Because there are so many possible classifications, the guidelines of this report are organized within the framework of a research program rather than an individual study. An individual study may not possess all the components of a research program, but it can certainly be situated somewhere within the framework. Figure 1 illustrates how a comprehensive research program might be structured. For simplicity, the figure displays the main components in a linear fashion, with the understanding that in an actual research program those components would be mutually interactive and cyclic. The first component—although not necessarily the point at which a given single research study would begin—is to generate. To launch a research program, mathematics educators need to generate some ideas about the phenomena of interest so that they can begin to explore them. Those ideas might emerge from theoretical considerations, previous research, or observations of practice. Research performed within this component might be analytic and not empirical, but it might also involve exploring an existing data set or analyzing a set of research studies in order to yield new insights. Once ideas have been generated, they need to be framed in some fashion. A frame is seen as involving clarification of the goals of the research program and definition of the constructs it entails, formulation of tools and procedures for the measurement of those constructs, and consideration of the logistics needed to put the ideas into practice and study their feasibility. The components within a frame are developed interactively as researchers decide what the program’s initial research questions or hypotheses should be and how studies might best be shaped and managed. Researchers begin exploratory empirical studies of the phenomena of interest. They might try out a proposed intervention to see if and how it works, or they might develop and test an instrument to measure a construct of interest.

6
Figure 1. Structure and components of a research program Framing the domain of study leads researchers to examine the phenomena more systematically. Research studies within this component are necessarily restricted in scale, whether in effort, time, or human and material resources. Their purpose is to understand the phenomena better and to get indicators of what might work under which conditions. The results of these studies may cycle back to the frame component, yielding modifications in constructs, instruments, research plans, or research questions. Or, if sufficiently robust, the results may lead to the next component. Once small-scale research studies have examined phenomena through observation or intervention, more comprehensive studies can be mounted that seek to generalize what has been found. That generalization can address questions of scale (studying different populations or sites, using more comprehensive measures, examining different implementation conditions), or it can be used to refine the theory or reframe the entire research program.
Frame
Generate
Goals & Constructs
Measurement Logistics & Feasibility
Examine
Generalize
Extend

7
A body of research that has yielded some generalizable outcomes can be extended in a variety of ways. Multiple studies can be synthesized; long-term effects can be examined; policies can be developed for effective implementation. Follow-up research studies can refine the instruments and procedures, include a greater variety of participants, and generalize the findings of earlier work still further. It is essential to understand that each component of the research model of Figure 1 has the possibility and potential to cycle back to any earlier component, and such cycling should be a conscious effort of the researchers. Progress in research is generally more of circular process than a linear one. In all of these activities, researchers must attend to ethical issues. Because every research study ought to promote the general welfare, researchers need to consider the effects of a study on those who participate in it and the social consequences of the resulting publication. Anyone proposing to study an intervention needs to ensure that all participants (including the school, parent and child) have given informed consent to participate and have knowledge of the risk of possible harm. They have the right to remain anonymous as well as the right to be informed of the outcomes of the research and its practical consequences. A Guide to Informed Consent is provided by the U.S. Food and Drug Administration at http://www.fda.gov/oc/ohrt/irbs/informedconsent.html. For more information on ethics in statistics, see the Ethical Guidelines for Statistical Practice of the American Statistical Association at http://www.amstat.org/profession/index.cfm?fuseaction=ethicalstatistics.
GUIDELINES FOR THE COMPONENTS OF A
RESEARCH PROGRAM
Generate Research Ideas Ideas about a phenomenon of interest for research come from many sources: personal experience, prior research, existing theory, logically determined conjectures, or intuitions and hunches. In other words, the seeds for a good research program do not spring from a single source. Activities within this component may be tentative and exploratory in nature, but nonetheless based upon careful examination of assumptions about the phenomenon and of the researcher’s own personal biases, beliefs, and experiences. It is important to stress that generation of ideas and questions is not a process that takes place only in the early stages of a research program. Indeed, coming up with ideas and questions should be a part of all components of any research program—new ideas can emerge, old ideas can reemerge, and current ideas can be discarded at any phase of a program. But, early in the development of a research program the researcher must take care to consider all ideas, questions, and conjectures as tentative. And, as Schoenfeld (in press) points out in a discussion of research methods in mathematics education:

8
From the onset of a study, the questions that one chooses to ask and the data that one chooses to gather have a fundamental impact on the conclusions that can be drawn. Lurking behind the framing of any study is the question of what is valued by the investigators, and what is privileged in the inquiry.
Consequently, especially during initial phases of generating ideas and questions, researchers must take care to come to terms with their own values, biases, and beliefs about the phenomenon of interest and give serious consideration to the sort of evidence that will be needed to answer the questions posed and support or reject specified hypotheses. Generative activity is perhaps best characterized by its focus on attempts to develop a conceptual framework for systematically studying the phenomenon. Such a framework is a structure that is used to justify the questions asked and methods used as well as to make it possible to interpret and explain the results. Thus, a conceptual framework is important because it helps the researcher determine (among other things):
• The nature of the questions asked. • The manner in which questions are formulated. • The way the concepts, constructs, and processes of the research are defined. • The principles of discovery and justification allowed for answering questions
about the phenomenon. The development of a conceptual framework should also take note of the reasons for adopting a particular theoretical perspective and should include an argument that the concepts chosen for investigation, and any anticipated relationships among them, will be appropriate and useful given the research problem under investigation. Because the framework should be based on previous research, as a research question begins to emerge, the researcher should undertake an exploratory review of the research literature on the question and a systematic review of previous conclusions. This initial review should aim to help the researcher sharpen ideas and make broad, general questions more specific. Some characteristic activities of this research component, listed below, may be helpful in organizing this critical initial phase of a research program. Characteristic Activities
• Identify ideas and questions about a topic of interest. • Ask questions such as: What specific research questions do I wish to investigate?
Can I make an argument as to why this question is worth investigating? Have I made explicit my own beliefs and assumptions about the topic?
• Peruse relevant secondary sources (e.g., literature reviews, conceptual and theoretical articles).
• Select and study a few appropriate general reference works to clarify the ideas and questions.
• Search general references for relevant primary sources. • Obtain and read relevant primary sources; note and summarize their key points. • Further clarify one’s own beliefs, biases, and assumptions about the research
topic.

9
• Undertake initial reviews of existing research (and nonresearch) literature to determine what the current state of knowledge is about the questions.
• Begin to determine the concepts and constructs associated with the topic. • Begin to develop a conceptual framework related to the topic that links the
concepts and constructs. • Identify research methods that can provide information about the concepts and
constructs in the conceptual framework (e.g., experimental methods might be appropriate for a summative evaluation of curricular materials, but cognitive modeling, participant observation, or some of the methods employed in design experiments1 might be useful as materials are being developed).
• Conduct a thorough review and synthesis of the relevant research in mathematics education as well as in related fields.
• Synthesize what is known about the research question to date, including a systematic review of previous conclusions.
Frame the Research Program Having generated ideas about a potential research program, researchers must then clarify the goals of the program, define the concepts and constructs involved, conceptualize the tools to be used to measure those concepts and constructs, and consider the various logistics and feasibility issues involved in undertaking the research program. Specific research questions begin to be determined at this stage in the research process. Often, these questions are rephrased in terms of a formal theory or theoretical perspective. The process of clarifying goals, defining constructs, developing measurement tools, and considering the logistics and feasibility of the components within the frame is not linear. There is a continual interplay between and among the framing components as researchers identify their research questions or hypotheses and address how these questions or hypotheses should be studied. Exploratory studies, instrument development, and small-scale intervention studies might be undertaken. The following detailed listings of characteristic activities and reporting guidelines for each component of the framing process are provided to aid in carrying out, reporting and evaluating the results of a research project. Providing the information called for in these guidelines will allow the reader to understand how the research was performed and to critically assess the value of the results. Illustrative examples of research activity for the framing component are provided at the end of this section.
Framing Component 1: Goals and Constructs This component begins with a thorough review and synthesis of research in the relevant area of mathematics education as well as in related fields such as cognitive psychology and sociology. Studies that use past data and observations for proposing prospective
1 A design experiment can be thought of as a real, in terms of instruction and students, field test for an instructional environment or curriculum.

10
hypotheses fall into this category, as do the preliminary ideas about design experiments for theory or construct development that might arise from such explorations. This component is rarely experimental or quasi-experimental because its purpose is to develop constructs. Exploration of past data and observations for prospective hypotheses may now lead to the design of intervention studies to determine whether one intervention is more effective than another. Characteristic Activities
• Formulate clearly the central ideas and underlying constructs of the proposed research program.
• Propose a framework that links the constructs; how the variables relate and interact (e.g., conceptual model).
• Conduct conceptual analysis of mathematical constructs with an eye toward informing prospective pathways of learning.
• Begin with a thorough review and synthesis of the relevant previous and ongoing research in mathematics education as well as in related fields.
• Investigate what is known about the research question and explore existing data and observations for proposed hypotheses.
• Design environments to support the emergence of the ideas identified through analyses of concept development to facilitate the study of the emerging ways of thinking. This activity entails generating hypotheses about the consequences of particular ways of understanding in the context of the learning environment.
• Identify relevant variables and relevant characterizations of them; provide operational definitions of variables.
• Make use of past data and observations for developing potential hypotheses. • Select research methods that will further illuminate the goals and constructs that
have been identified and that enable the researcher to propose potential research hypotheses. These methods are unlikely to include experimental or quasi-experimental methods, but they might include design experiments that make theory development possible.
• Identify relevant measures, or the need for new measures. • Gather empirical data in an exploratory manner to test the research framework. • Formulate a research question and outline a potential plan to answer the question.
The plan should include a clear description of the goals of the study as well as a description of the populations and procedures (such as interventions) being studied and the study methods.
Reporting Guidelines
• State the research question and identify and describe the research in related fields. • State conjectures rather than causal statements. • Define the variables and measures used. • Report outcome measures. • If gain scores (differences between pre- and post-test scores) are to be used,
discuss the possibility that they could lead to faulty conclusions. (Show awareness of the controversy surrounding the use of gain scores, which is discussed in Appendix B.)

11
• Describe the basic research that will guide the research project, showing how the proposed research will fill gaps in the accumulated knowledge.
• Provide exploratory and descriptive statistics with graphical representations, if appropriate, and appropriate interpretations to support the background and setting of the proposed research. (Attempts at rigorous statistical inference are neither needed nor appropriate at this stage.)
Framing Component 2: Measurement
Like the preceding component, this one begins with a thorough review and synthesis of the previous and ongoing research. The difference is that the review focuses on research in the use of common measures. Measures, especially scales, in mathematics education need to be transportable across studies. The development of appropriate measurement scales and adequate assessment of their properties (validity, reliability, and fairness) are critical. The key questions are: Can the essential background variables be measured? Are appropriate outcome measures and related measurement instruments already developed? Measures encompass all numerical and categorical variables being considered. These guidelines distinguish, for clarity, between educational assessments and nonassessment measures. Educational assessments are mainly measures of behavior in specific contexts (e.g., responses to tasks or test items in specific situations) that are used to infer behavior in a larger context, which may be described in terms of, for example, a “domain of behavior” or an underlying “construct.” Nonassessment measures include typical variables such as heights of children, highest degree obtained by teachers, and average number of calories in school lunches. The guidelines below are separated into those that are applicable to all measures, and those that apply primarily to assessments.
Guidelines for All Measures Variables can be operationalized and measured in more than one way. (There are various ways to operationalize socio-economic status of students, experience of teachers, or academic level of students, for example). Therefore, for every variable in every research process it is important to record, and report as appropriate how the variable is operationalized and measured and what relationships the variable has with other variables used in the research. Furthermore, for every measure in every research process it is essential to provide appropriately defensible evidence for the validity, reliability, and fairness of the measure. Validity, reliability, and fairness (defined below) are not inherent attributes of a variable, but are determined by its operationalization, measurement, and use in a particular context. Therefore, evidence of validity, reliability, and fairness must be specifically relevant to the context in which the measure will be used. Guidelines for Assessments The key considerations in developing and reporting on assessment measures used in education research have to do with the validity, reliability, and fairness of the assessments.

12
Validity, broadly defined as the extent to which a measure is meaningful, relevant, and useful for the research at hand. Reliability, broadly defined as the extent to which the measure is free of random error. Fairness, broadly defined as the extent to which the implementation of the measure is free of systematic error that would undermine validity for one or more subgroups.
See the Measurement section of Appendix B, as well as the Standards for Educational and Psychological Testing (American Educational Research Association [AERA], American Psychological Association [APA], National Council on Measurement in Education [NCME], 1999) and Wilson (in press) for further details on these important concepts. Validity and reliability depend on theoretical arguments about the assessment tasks or items themselves, on the population to which the assessment will be administered, and on details in the implementation of the assessment. For example, minimizing a quadratic function may tap only algebra knowledge (ability to complete the square) in a population that has not been exposed to calculus, but it may tap both algebra and calculus knowledge (finding the critical point of a twice differentiable function) in a population that has studied calculus. Fairness focuses attention on how the implementation of the assessment can introduce construct-irrelevant variations in performance that result in different meanings for different subgroups: for example, issues of sociological bias in test questions, accommodations for second-language learners or students with physical disabilities, etc., all enter into consideration of fairness. For every assessment that is used in every research process, it is essential to develop and report as appropriate: (1) information on the construct or behavioral domain that the assessment is intended to measure in the specific research process (which may or may not be different from the construct reported by the assessment provider), the alignment of that construct with the goals of the research, and the limitations of the assessment in this context; (2) information about the sample or population to which the assessment will be administered, the circumstances of administration or implementation of the assessment (e.g., physical setting, time limits), and ways in which these are similar to or different from the setting in which published validity, reliability, and fairness evidence (if any) was obtained; and (3) evidence of validity, reliability, and fairness that is specific to the setting in which the assessment is administered, the particular population to which it is administered, the way it is scored, and the use to which the scores are put. To promote comparability between studies, and to extend the knowledge base in education research, it is important to use existing “off the shelf” assessments whenever possible—even in conjunction with locally developed assessments when the off-the-shelf assessment only partially aligns with the goals of the research at hand.2 The costs and
2 General evidence of validity and reliability reported by the provider of an existing assessment (e.g.,
reliability and validity numbers in the assessment’s technical report or reported in peer-reviewed literature) should not be accepted without careful analysis of the comparability of the setting in which the assessment provider established that evidence and the setting in which the assessment will be used.

13
benefits of developing an assessment locally in order to customize it to one’s research purpose should be carefully considered. Research goals that involve gathering evidence for new theory that departs radically from existing constructs, or evaluating an intervention whose intended consequences cannot be measured by off-the-shelf assessments, may demand development of a local assessment instrument. Developing an assessment to gather evidence for initial explorations of a domain may focus on theoretical arguments that a particular set of tasks elicits a suitable range of possible behavior. Refining an assessment and building up suitably rigorous validity, reliability, and fairness evidence so that it can be used formally to evaluate interventions or address other causal questions typically takes time, perhaps years. Such assessment development should begin with the earliest stages of research and continue over the entire arc of a program of research, so that rich and rigorous validity, reliability, and fairness evidence can be accumulated. Drafting an assessment by assembling items or tasks from other pre-existing assessments does not appreciably shorten the development time, because most assessment development time is devoted to gathering appropriate evidence and refining the assessment and its implementation to improve validity, reliability, and fairness. Every assessment involves tradeoffs between development effort, validity, reliability, and fairness. These tradeoffs, in terms of the utility of the assessment to the research at hand, should be addressed explicitly. For example, a set of behavioral probes used to develop preliminary evidence and hypotheses about a mechanism or process may require greater focus on theoretical arguments of relevance, meaning, and low error than on quantitative evidence. An assessment used in a formal causal study may require stronger, more traditional quantitative evidence along the lines alluded to in the Standards for Educational and Psychological Testing (AERA-APA-NCME, 1999). An assessment developed for widespread use in a variety of contexts for a variety of purposes may require very detailed and rigorous quantitative and qualitative evidence of validity, reliability, and fairness that is built up over years of development and calibration studies (see e.g. Brookhart and Nitko, 2006). It is also important to keep in mind the continuing interplay between measurement, goals and constructs, and logistics & feasibility involved in framing the domain of study (Figure 1). Thus, before issues of systematic error (statistical bias) and reliability are considered, it is important to examine the construct validity of the measurement process – i.e. whether the measured values are an appropriate operationalization of the theoretical construct at hand. Researchers may evaluate construct validity by examining whether a measurement behaves in practice similar to how it is supposed to behave in theory - for example by evaluating its relationships to other variables related to the construct. Similarly, systematic error can be evaluated if a previously validated gold standard is available for comparisonfor example, in the case when an investigator wishes to replace a time consuming complex instrument with a simple one.

14
Researchers must make time in their research programs to explore feasibility and establish stable and reproducible observation and other data-collection protocols, for the assessments they will use, as well as for other parts of their study designs. With careful analysis and planning, it is often possible to adjust the circumstances under which the assessment will be used so as to reduce bias (improve fairness) and increase the validity or reliability—or both—of the assessment in the context of the research. Similar considerations will improve the experimental validity of the entire study design. Characteristic Activities
• Perform a comprehensive literature search, including a search for useful common measures.
• Examine previously used measures and see if it is necessary to create new measures.
• Identify relevant variables and relevant characterizations of them; develop operational definitions of variables.
• Create or identify measures that encapsulate what would normally require an interview or developed context (as in a design experiment). Example: Create or identify measures to categorize a child’s understanding of fractions.
• Investigate new or existing measures of the personal interaction between teacher and student or interviewer and interviewee (on both short and long time scales). Example: Can measures be created to encapsulate the essence of a teacher-student interaction in a lesson on fractions?
• Create or identify test items that differentiate among important ways of thinking; develop or identify items or tests that assess proficiency at a task.
Reporting Guidelines
• Provide a summary of the literature review regarding relevant measures. • Provide key details regarding development of new measures, and/or selection of
off-the-shelf measures. • For all measures, report how the variable is operationalized and measured and
what relationships the variable has with other variables used in the research. • For all measures, report evidence of validity, reliability, and fairness that is
specifically relevant to the context in which the measure will be used. • For assessment measures, the following aspects of reliability, and validity and
fairness are especially important to report: o What construct or behavioral domain is being measured, and how does it
align with the goals of the research? What are the limitations of the assessment in this context?
o To what sample or population will the assessment be administered? What are the circumstances of administration and implementation of the assessment? How do these (population and implementation) differ from the situation from which any published validity and reliability data were obtained?
o What evidence of validity, reliability and fairness is there, specific to the setting in which the assessment is being used in this research?

15
Framing Component 3: Logistics and Feasibility
Key questions include: Can the planned research be carried out in a feasible and meaningful way that will contribute to a body of knowledge in mathematics education? Can subjects meeting the design eligibility criteria be found? Can an ethical, feasible intervention be designed relatively uniformly with no serious risk (emotional, psychological, or educational) to the subjects? This component might also include pilot or feasibility studies that are carried out with only a few subjects. Characteristic Activities
• Consider the potential ethical and risk issues surrounding a proposed intervention study.
• Document and test the procedures to be used in an intervention study. • Design and conduct a qualitative component of a proposed intervention study to
assess measurement and feasibility. • Develop and test items that differentiate among ways of thinking; develop items
that assess proficiency at a task. • Formulate possible study designs; investigate how to deal with problems such as
study dropouts and missing data; make plans for avoiding bias; examine and evaluate threats to internal and external validity.
• Establish relationships with the school(s) where research will take place and develop trust within the research setting.
• Identify variables to be measured and provide operational definitions of variables. • Identify the population of interest as well as the sampling or experimental units. • Search for useful common measures that can be related to other research. • Develop (if necessary), test (to determine inter-rater reliability, internal validity,
and the like), and refine measures. • Pilot all instruments in an informal setting. • Conduct a formal field test or pilot study. • Develop a formative evaluation of an intervention. • Assess the variability associated with implementing an intervention and try to
constrain it. • Do all work and activities needed to meet institutional review board guidelines,
ensuring confidentiality and informed consent. • Anticipate problems in the field; develop an affordable contingency plan. • Plan for the coordination of work within an individual site or among multiple
sites. Reporting Guidelines
• Describe the study design of the project. • Describe the variables of interest. • Describe the population of interest versus the sample studied, including
demographic characteristics; discuss heterogeneity (population versus sample). • Describe the method of sampling (if used). • Discuss possible biases and how they are handled in the analysis. • Identify the sampling unit and the unit of analysis.

16
• Describe the treatment and measures in enough detail to allow replication. • Provide the characteristics of all instruments (e.g., inter-rater reliability, internal
validity). • Describe the pilot tests of instruments and interventions; these need not be
randomized studies. • Report empirical data in a complete fashion, including data on the characteristics
of subjects. • Provide descriptive statistics and graphical representations; rigorous statistical
inference is not needed and is most likely unwarranted at this stage. • Address time, training, and support services needed to perform the study. • Address confidentiality and consent issues.
Illustrative Research Scenarios for Framing the Research Project Three examples serve to illustrate the types of research activities that are involved in framing a research program. These scenarios emphasize the importance of clarifying the goals of a program, defining the concepts and constructs involved, conceptualizing the tools to be used to measure those concepts and constructs, and considering the various logistics and feasibility issues involved. Example 1: The teaching and learning of rational numbers and proportional reasoning have been active topics of research among mathematics educators for many years (see Lamon, in press). A considerable amount of attention has been paid by researchers to ascertain what it means to “understand” the concepts of fractions and proportional reasoning and to develop frameworks for studying these topics. In her review of the literature on these topics, Lamon notes that rational number researchers have conducted semantic/mathematical analyses of rational numbers and developed principles for qualitative reasoning and the teaching and learning of rational number concepts. A major result of these efforts in the 1980s was to recognize and measure quotient, ratio, and operator as distinct subconstructs. Collectively, this body of work underscores the necessity of carefully defining constructs and developing conceptual frameworks associated with the phenomenon or topic of interest. Example 2: Many who teach statistics call for more emphasis on statistical thinking. Indeed, “statistics is a rising star in the Grades K – 12 mathematics curriculum” (Konold & Higgins, 2003, p. 193). But, what is “statistical thinking”? A good answer to this question is essential to the development of material and methods to teach statistical thinking. Wild and Pfannkuch (1999), a statistician and a statistics teacher, conducted a study to answer this basic question. Through literature reviews and interviews with statisticians and students, they developed a four-dimensional model that encompasses statistical thinking, from the casual observer of data to the professional data analyst. One dimension emphasizes the problem–plan–data–analysis–conclusion cycle. Another develops the deeper perspective of recognizing a need for data, forming and changing data representations to learn about a phenomenon, embracing variation, and building models. This research has no planned intervention study as a goal, but it is basic to the design of future interventions that these researchers or others might undertake.

17
Example 3: There is widespread agreement about what algebra students should learn by the end of high school. But there is no consensus among mathematicians and mathematics educators about the appropriate placement of the study of algebra in the school curriculum. One major line of research related to “early algebra” has been to study how elementary school arithmetic concepts can be better aligned with the concepts and skills that students need to learn algebra (Carpenter, Levi, Franke, & Zeringue, 2005). These researchers consider the notion of “relational thinking” - thinking that attends to relations and fundamental properties of arithmetic operations rather than to procedures and calculations - as being better aligned with the concepts and skills needed by students to learn algebra. For the past several years, the research of Carpenter et al. has focused on understanding children’s conceptions and misconceptions related to relational thinking and how conceptions develop. The research program has included design experiments with classes and small groups of children. The researchers have established clearly defined goals and constructs, and by conducting a series of careful task-based interviews with children and design experiments, they have also developed tools and procedures that will be invaluable to the conduct of specific intervention studies. Examine the Research Program Framing activities may involve a small laboratory or classroom study (a pilot study) with only a few subjects. If such studies look promising, the hypotheses generated during the framing phase should then be examined in a larger community of subjects, usually within a single institution. Key questions are as follows. Do the results seen in a small-scale study carry over to a larger scale? How are results affected by qualities of larger-scale, such as greater diversity of learning environments or less direct influence of the designer of the intervention? Can the study, as designed, actually be carried out in a larger scale? Research projects in this category should incorporate most aspects of the rigorous study design fashioned in the framing stage, with responses being measured under experimental conditions as close as possible to those proposed and compared to controls or historical background data to assess evidence of significant effects. Examination studies in limited populations could, for example, be randomized studies in constrained populations, contextual studies, explorations of implementation and outcomes, or observational studies regarding intervention effects at different levels. Results of such studies might result in qualified causal conjectures, but not all studies at this level require all the characteristics of a study that could lead to formal statistical inference. A main goal here is to establish efficacy so that the research program can move on to studies that have the ability to establish causality. Characteristic Activities
• Specify a study design and the associated data analysis plan (may include statistical model if appropriate).
• Identify subpopulations of interest. • Explore and define the experimental setting in which the study is to be conducted. • Identify key variables of interest.
18
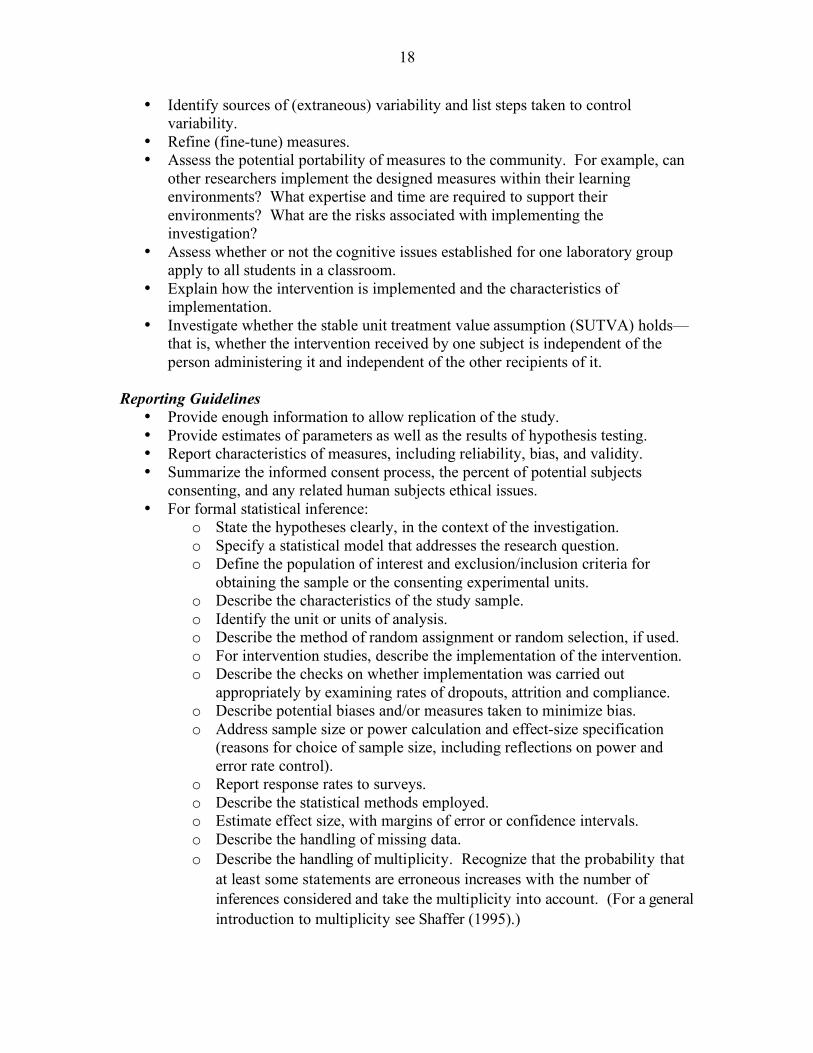
• Identify sources of (extraneous) variability and list steps taken to control variability.
• Refine (fine-tune) measures. • Assess the potential portability of measures to the community. For example, can
other researchers implement the designed measures within their learning environments? What expertise and time are required to support their environments? What are the risks associated with implementing the investigation?
• Assess whether or not the cognitive issues established for one laboratory group apply to all students in a classroom.
• Explain how the intervention is implemented and the characteristics of implementation.
• Investigate whether the stable unit treatment value assumption (SUTVA) holds— that is, whether the intervention received by one subject is independent of the person administering it and independent of the other recipients of it.
Reporting Guidelines
• Provide enough information to allow replication of the study. • Provide estimates of parameters as well as the results of hypothesis testing. • Report characteristics of measures, including reliability, bias, and validity. • Summarize the informed consent process, the percent of potential subjects
consenting, and any related human subjects ethical issues. • For formal statistical inference:
o State the hypotheses clearly, in the context of the investigation. o Specify a statistical model that addresses the research question. o Define the population of interest and exclusion/inclusion criteria for
obtaining the sample or the consenting experimental units. o Describe the characteristics of the study sample. o Identify the unit or units of analysis. o Describe the method of random assignment or random selection, if used. o For intervention studies, describe the implementation of the intervention. o Describe the checks on whether implementation was carried out
appropriately by examining rates of dropouts, attrition and compliance. o Describe potential biases and/or measures taken to minimize bias. o Address sample size or power calculation and effect-size specification
(reasons for choice of sample size, including reflections on power and error rate control).
o Report response rates to surveys. o Describe the statistical methods employed. o Estimate effect size, with margins of error or confidence intervals. o Describe the handling of missing data. o Describe the handling of multiplicity. Recognize that the probability that
at least some statements are erroneous increases with the number of inferences considered and take the multiplicity into account. (For a general introduction to multiplicity see Shaffer (1995).)

19
o Summarize the results of appropriate tests of assumptions, as much as possible.
o Summarize the results of statistical diagnostic tests as they relate to the model chosen (goodness of fit, etc.).
o Provide appropriate graphical or tabular representations, including sample size and measures of variability.
o Provide appropriate summary statistics and statistical tables with sufficient information to replicate the analysis.
o Provide plausible interpretations, where warranted, of the statistical information.
o Provide enough information to allow replication of the study methods and procedures.
o Provide, if allowed, access to unidentified data with appropriate confidentiality in place, for linking with other databases.
Illustrative Research Scenario Schwarz and Hershkowitz (1999) compared students’ concepts of function after studying the topic in a new curriculum using graphing calculators, multi-representational software, and open-ended activities versus a standard curriculum. One class of thirty-two students was assigned to the new curriculum and two classes totaling seventy-one students were assigned to the comparison group using the standard curriculum. The classes in the comparison group were selected on the basis of their similarities to the group using the new curriculum. Even without random assignment, the results provide some information on how technology might improve the students’ learning of the concept of function through examining prototypes. The information would be useful in designing a randomized study to generalize these results. Seven of the eight questions used to measure learning about functions were taken from questionnaires that had been validated in previous studies. Generalize the Research Program Once small-scale research studies have examined phenomena through observation or intervention and have established the potential for significant effects in the population of interest, more comprehensive studies can be mounted that seek to generalize what has been found. This research category generally involves larger studies, ideally in multiple institutions, that are planned and executed with adherence to strict guidelines established during the framing and examining phases of the research program. Intervention studies at this level should incorporate randomization of classes or groups (or individual subjects, if possible) to the intervention with appropriate within-study controls on the measurement processes. These design requirements are meant to reduce both variability and bias, and to provide a sound basis for statistical inference. Confirmation by statistical evidence generally requires fairly large validation studies examining contextual effects in equivalence classes or instructional settings. Such studies should be based on designs that allow the strongest possible interpretation of causal relationships. Good research in this component generally requires interdisciplinary activities and multidisciplinary work.

20
Characteristic Activities
• Assess the potential portability of measures to an even larger community, including multiple institutions in a wide variety of social contexts.
• Assess whether or not the cognitive issues “established” for a local community apply to students in multiple communities. For example: Does the categorization for understanding fractions found in one classroom represent students in a variety of socio-economic settings and with varying degrees of mathematical aptitude or maturity?
• Design and conduct a multi-institutional randomized study: For example, conduct a multi-school comparison of a new technology-based method for teaching fractions versus a standard method.
• Design and conduct a quasi-experiment, gathering information on comparison groups.
• Conduct a rigorous statistical analysis of the quantitative results of a multi-institutional study (a survey, an experiment or an observational study) using statistical methods appropriate to the unit of analysis.
• Design and conduct a large nonrandomized study. For example, for all schools agreeing to participate in the study, assess the effect of a new integrated high school mathematics curriculum on learning.
Reporting Guidelines
• Describe the research program and the materials being tested. • Summarize the informed consent process, the percent of eligible subjects
consenting, and any related human subjects ethical issues. • List testable research hypotheses and translate them into statistical hypotheses. • State the hypotheses clearly, in the context of the investigation. • Specify outcomes, intermediate outcomes (goals) and primary and secondary
outcomes. • Specify how covariates were defined, measured, and used. • Comment on possible effects of heterogeneity. • Specify the type of study design that addresses the hypothesis (experiment, quasi-
experiment, matching, repeated measures, etc.). • Specify a statistical model that addresses the research question. • Define the population of interest and exclusion/inclusion criteria for obtaining the
sample. • Identify the unit of randomization (or sampling unit) and the unit or units of
analysis. • Describe the implementation of the intervention. • Describe the checks on whether implementation was carried out appropriately;
report on rates of dropouts, attrition and compliance. • Describe potential sources of biases and measures taken to minimize bias. • Address the sample size or power calculation, effect-size specification (reasons
for choice of sample size, including reflections on power, error rate control, etc.) • Report response rates to surveys. • Describe the statistical methods of analysis employed.
21
• Describe the characteristics of the study sample. • Describe the handling of missing data. • Describe the handling of multiplicity. Recognize that the probability that at least
some statements are erroneous increases with the number of inferences considered and take the multiplicity into account.
• State assumptions and describe the methods used to check if they hold and to assess sensitivity if they do not hold (under modest perturbations).
• Summarize the results of appropriate tests of assumptions. • Summarize the results of statistical diagnostic tests as they relate to the model
chosen (goodness of fit, etc.). • Provide appropriate graphical or tabular representations, including sample sizes
and measures of variability. • Provide appropriate summary statistics and statistical tables with sufficient
information to replicate the analysis. • Provide enough information to allow replication of the study methods and
procedures. • Provide, if allowed, access to unidentified data with appropriate confidentiality
safeguards in place. Illustrative Research Scenarios Example 1: A frequently referenced educational study in the discussion of randomized field trials is the class size study carried out in Tennessee. It is summarized at http://www.heros-inc.org/star.htm#Overview. To quote from that site, The Student/Teacher Achievement Ratio (STAR) was a four-year longitudinal class-size study funded by the Tennessee General Assembly and conducted by the State Department of Education. Over 7,000 students in 79 schools were randomly assigned into one of three interventions: small class (13 to 17 students per teacher), regular class (22 to 25 students per teacher), and regular-with-aide class (22 to 25 students with a full-time teacher's aide). Classroom teachers were also randomly assigned to the classes they would teach. The interventions were initiated as the students entered school in kindergarten and continued through third grade. The analysis of academic achievement consistently and significantly (p<.01) demonstrated the advantage of small classes over regular size classes and regular sized classes with a teaching assistant. Example 2: Carnegie Learning’s Cognitive Tutors (CT) is a program that immerses and engages students in mathematical problem solving through the use of textbooks, classroom activities, and a software program, all built on sound cognitive models. The software assesses a student’s mathematical knowledge at each step of the curriculum and presents new material tailored to that student. Morgan and Ritter (2002) report on a randomized study of the effectiveness of the CT Algebra I curriculum, which was compared with a traditional middle school mathematics curriculum in a study conducted at five junior high schools in Moore, Oklahoma. Sections of the course were randomly assigned to either the CT or a traditional curriculum, and teachers were then assigned to sections so that most teachers had a section of each type. Students taking Algebra I in

22
ninth grade were assigned to classrooms using the school’s standard class scheduling system. The results showed that students in the CT curriculum scored better than those in the traditional curriculum in content knowledge and class grades, with an improved attitude as an extra bonus. Example 3: Can evidence-based mathematical reforms work in high-poverty areas? This question was investigated by Balfanz, MacIver, and Byrnes (2006) through use of a “Talent Development Middle School Model” for teaching mathematics, based on the University of Chicago School Mathematics Project (UCSMP) material. (UCSMP is a well-researched program.) The model was implemented in three high poverty middle schools, and results were compared with those from three matched schools in a quasi-experimental design. The Talent Development schools outperformed the control schools on multiple standard measures of achievement. Although not a randomized study, this research was designed quasi-experimentally to make comparisons among the schools in the study, and to formulate some cautious associations that might be generalizable to similar schools. Example 4: A study by Enders and Diener-West (2006) was carried out with graduate students, but it addresses certain statistical issues that are present in many education research projects and thus can be informative for studies in many other contexts. The study does not develop a conceptual framework and does not address validity and reliability of measures, as emphasized in this report, but it randomizes students to treatments and uses the types of statistical models that are often necessary in dealing with human subjects. Do interventions that involve cooperative learning or Internet-based activities improve the learning of introductory biostatistics among graduate students? Enders and Diener-West designed and conducted a study to help answer this question for students at Johns Hopkins University. A total of 256 consenting students were randomized to one of three types of instruction: the standard lecture plus laboratory course (control), the standard course augmented by Internet-based learning sessions, or the standard course augmented by cooperative learning sessions. In the Internet sessions, students worked individually on Web-based activities making use of applets and other methods designed to augment the classroom discussions. The cooperative learning sessions involved small groups working with hands-on activities. The randomized study was also stratified by degree programs. Three types of statistical models were used in the analysis, including models that accounted for decreases in the participation rate as the term progressed. Statistically significant gains in performance on exams were observed for the groups making use of Internet-based learning or cooperative-learning activities. Of particular interest were the planning and implementation of informed consent and randomization, the use of stratification to reduce variation, and the application of statistical models to account for declining participation rates and other factors. Extend the Research Program Once a research program has shown significant effects through a rigorous generalized study, the research can be extended by activities such as syntheses of multiple studies, longitudinal studies of long-term effects, and the development of implementation policy.

23
Long-term follow-up studies may be carefully designed longitudinal studies of an experimental or quasi-experimental nature, or they may be observational studies of how the intervention is performing in the field. Such studies should provide ongoing formative evaluations that are fed back to the research team for purposes of improvement of instruments and procedures. The evaluations may lead to the planning and conducting of much broader studies across differing groups of subjects and differing experimental conditions to assess whether the results can be generalized even further. Characteristic Activities
• Design and conduct a longitudinal study that allows rigorous statistical inferences over time.
• Design and conduct a long-term observational study with a goal of improving a curriculum over time.
• Document the need for program improvements and new experiments. • Observe and document the effectiveness of a nonrandomized intervention. For
example, evaluate an integrated high school mathematics curriculum over a period of years.
Reporting Guidelines
• Refer to previous components to check the reporting guidelines for the type of study being done.
• Describe the research program being studied. • Describe the nature of the long-term study (experimental, quasi-experimental,
sample survey, observational). • Describe the rate of dropouts over time and how this was handled in any analyses. • Describe the goals, methods and procedures of the study (monitoring for changes
in implementation, process improvement, gather information for new intervention study, etc.).
• Describe the data being collected. • Provide appropriate summaries of the data. • Provide the statistical inferences with attention to all applicable details from the
guidelines for generalizing research. Illustrative Research Scenario In a research project comparing mathematics achievement of eighth grade students using NSF-funded Standards-based materials with that of students using traditional materials, Reys, Reys, Lapan, Holliday, and Wasman (2003) studied three school districts that had used the nontraditional material for at least two years prior to the eighth grade. These schools were matched, based on student achievement and socioeconomic levels, with three schools using traditional materials. Achievement was measured using a state assessment already in place. This work is a multi-institutional follow-up study that helps to document the effectiveness of a nonrandomized intervention.

24
Appendix A
A STRUCTURED APPROACH TO MATHEMATICS EDUCATION RESEARCH
Research in education is carried out under heavy societal and ethical pressures, and often with inadequate resources to do the job properly. The social context of education research has not been conducive to sustained funding, infrastructure building, or commitment to long-term progress toward identified major goals. An additional complication arises because the complexity of human social behavior requires multiple perspectives that blend quantitative and qualitative approaches, and such a blend requires professionals from various fields of expertise to work together to identify and solve the problems at hand. Research in mathematics education has come under particularly intense scrutiny in recent years and is one of two disciplines singled out for early attention in government programs to improve the education of children, from pre-K to grade 12. Cognizant of the interest in the mathematics education research community to conduct high quality research in the midst of less-than-ideal circumstances, and of the external pressures to provide a scientific basis for educational claims, a group of mathematics education researchers and statisticians held a series of workshops, funded by the National Science Foundation, to explore possible guidelines for reporting and evaluating mathematics education research. This document is the product of those workshops. Core Documents The foundation for the present document came largely from three reports, two from the National Research Council (NRC) and the third from the RAND Corporation. A brief summary of key points found in these reports follows.
Scientific Research in Education (NRC, 2002) This report collects a number of exemplary studies, outlines guiding principles in scientific inquiry, catalogs challenging features of education and educational research, and lays out design principles for education research, as well as principles for funding such research. The report acknowledges that education research is complicated by features of the education process, including the following:
• Social and political consensus on the goals of education is in flux. • The educational process is confounded by issues of ethics, human volition, and
mobility. • There is great variability across educational systems and in incentives for change. • Education comprises hierarchical, multilayered systems with many “treatment
agents,” making it hard to define and study effects.

25
Consequently, special care is required in conducting education research. Researchers need rigorous definitions, a replicable methodology, and specific goals. They also must deal with difficulties in maintaining experimenter control and with the many ways in which ethical considerations work to reduce effect sizes, encourage selection effects, and so on. Multiple disciplinary perspectives and an interdisciplinary perspective are often needed in education research, which should be built around partnerships among researchers, professionals, practitioners, and clients.
Advancing Scientific Research in Education (NRC, 2005) Based on a series of five workshops, this report considers how to push forward the recommendations of Scientific Research in Education. The workshops addressed three goals:
• Promoting Quality Peer review with attention to quality, expertise, and diversity Appropriate, scientifically rigorous research designs Researcher-practitioner partnerships
• Building a Knowledge Base Data sharing through journals and professional organizations Structured abstracts; repositories and archives for knowledge accumulation
• Enhancing Professional Development Clearly articulated graduate competencies Training in research methods that combines broad meaningful research
experiences with methodological and substantive depth A manuscript review system that encourages professional growth
All of these goals are related to statistical practices in mathematics education research and serve as focal points around which to make recommendations for sound research practice. Both NRC reports take a broad view of strong research and appropriate methods. Although much recent attention has been given to randomized controlled trials (RCTs) in education, equal if not greater attention should be given to another feature that makes research successful—a partnership between the research team and the participating community. Such a partnership takes time to develop and requires mutual respect, trust, and a shared vision and values. Partnerships are essential for treatment fidelity, recruiting, and informed consent. By creating a feedback mechanism, they benefit the participants and provide resources to implement change, leading to productive, long-term relationships. After all, causal effects do not constitute the only interesting education research questions. One can ask meaningful questions about what is happening and why and how it is happening at many different levels.
Mathematical Proficiency for All Students (RAND, 2003) Two paragraphs from this document suggest its tenor and purpose:
Despite more than a century of efforts to improve school mathematics in the United States, efforts that have yielded numerous research studies and development projects, coordinated and sustained investments in research and development have been inadequate. Federal agencies (primarily the National Science Foundation and the U.S.

26
Department of Education) have contributed funding for many of these efforts. But the investments have been relatively small, and the support has been fragmented and uncoordinated. There has never been a long-range programmatic effort devoted solely to funding research in mathematics education, nor has research (as opposed to development) funding been organized to focus on knowledge that would be usable in practice. Consequently, major gaps exist in the knowledge base and in knowledge-based development. The absence of cumulative, well-developed knowledge about the practice of teaching mathematics and the fragile links between research and practice have been major impediments to creating a system of school mathematics that works. These impediments matter now more than ever. The challenge faced by school mathematics in the United States today—to achieve both mathematical proficiency and equity in the attainment of that proficiency—demands the development of new knowledge and practices that are rooted in systematic, coordinated, and cumulative research. (p. 5)
The report emphasizes a cycle of knowledge production and improvement of practice that moves through research and documentation of basic problems in teaching and learning; the development and testing of new theories and knowledge; the development of tools, materials, and methods; the creation of interventions such as materials and instructional programs; the use and documentation of those interventions in practice; and studies of program effects and practices that cycle back to more research. As in the NRC (2001a) report Adding It Up, the report uses the construct of mathematical proficiency, which is seen as involving the intertwined strands of adaptive reasoning, strategic competence, conceptual understanding, productive dispositions, and procedural fluency. A simplification and adaptation of the RAND report cycle to undergraduate education in Science, Technology, Engineering and Mathematics (STEM) is shown in Figure 2.
Figure 2. Cyclic model for knowledge production and improvement of practice in undergraduate STEM education (Source: NSF, 2006) Like the NRC reports, the RAND report emphasizes that a strategic research and development program in mathematics education must emphasize multiple disciplinary work and the building of partnerships. There exists no mechanism for multiple phases of
27
research in education as has been developed, for example, in medicine. Certain pieces of the research cycle are attractive to various researchers or academic departments, but no mechanisms are in place to build and inform the other phases of the research cycle. Education research is complex, and linkages among groups are essential; without them, the amount of funding does not matter. A Model for Mathematics Education Research: Background Medical research offers a phased approach under which knowledge accumulates and through which many areas of expertise work cooperatively. It is not surprising that some have suggested that the models for medical research should be adapted to education research. In fact, discussions of medical models for clinical trials served as a starting point for the project leading to this document. Over the last half of the twentieth century the medical field went through an evolutionary process to establish guidelines for research that are generally accepted by researchers, research institutions, and regulatory agencies. Although not perfect, the medical model for intervention studies has led to significant gains in knowledge and understanding of human health and medical practice. (The papers by Altman, 2002, and Nowak, 1994, outline some of the problems with modern medical research; most have counterparts in education research.) We hope that the framework for research developed here will lead to similar gains in education theory and practice. An outline of a typical medical model for clinical trials research is given below, with discussion of how that model relates to the RAND model for education research and to the framework for research programs developed earlier in this document. A Typical Medical Model for Clinical Trials Research
Pre-Clinical Phase or Pre-Study Phase
Preclinical studies involve formulating a research question and outlining a potential plan to answer the question. In medical research this phase includes the basic science (biochemistry, physiology, etc.) and animal research that leads to biological understanding as well as translational research that concentrates on how to take results from the lab and bring them into the clinical phases. Basic science experiments often focus on biological mechanisms such as the elucidation of pathways that might be exploited for possible clinical interventions. Laboratory safety assessments ensure that harmful properties of the drug candidate are identified. Related research might determine the best production processes for making the raw drug chemical and the optimal formulation of the drug in usable form (capsule, tablet, or other.) that maintains potency over the long term. This research must be completed before a single person takes the drug, and may represent nearly half of the effort in bringing a new drug or medical procedure to market. In summary, the preclinical phase should include a clear description of the goals of the study, a description of the populations and/or procedures (treatments) being studied and of what is known about this question to date (literature review), along with a preliminary description of the types of variables that will be measured during the investigation. This

28
phase should also include a description of the research team and a statement about their experience and ability to carry out the proposed investigation.
Phase I – Feasibility In this first phase of treating human beings a small study, usually in a single institution, is conducted to try to establish whether or not the planned research is feasible. Can subjects meeting the design eligibility criteria be found? Is the necessary equipment available? Can the background variables be defined operationally and measured? Can the treatment(s) be applied and an informative response measured? What are the proper dosages for effecting a response with a minimum of harmful side effects? Can the treatment be administered ethically and safely? This phase should be used to document the basic procedures to be used in the later phases of the research.
Phase II – Initial Efficacy
A study now moves closer to real experimental conditions, usually with a fairly small group of subjects from a single institution. Responses are measured for subjects under experimental conditions (as close as possible to those proposed) and compared with responses of controls or with historical background data to see if there is evidence of significant effects. Refinements are made to the design, including the measurement and analysis process. A key question: Does the theory appear to hold in practice?
Phase III – Confirming Efficacy This research phase usually entails larger studies, involving multiple institutions, planned and executed according to strict guidelines. Such studies should incorporate randomization of subjects to intervention, if possible, with appropriate within-study controls on the measurement processes. These design requirements are meant to reduce both variability and bias, and to provide a sound basis for statistical inference. A carefully executed study of this type will allow well-supported conclusions regarding the intervention effects among the populations being investigated.
Phase IV – Follow-Up In medical trials, the fourth phase is usually associated with post-marketing studies that are rarely experimental and generally are most helpful at identifying rare or long-term side effects. In general, this phase can be used to establish the need for planning much broader implementations across differing groups of subjects and differing experimental conditions, with long-term follow-up. Along the way, refinements may be made to the procedures and new questions may arise that will require another experiment to be designed and conducted, feeding back to earlier phases of the research. As an example of medical research that has some parallel characteristics to education research, consider a small pen-sized device to detect metastatic tumor cells during surgery. Trials to evaluate the efficacy of such a device would necessarily have a nested

29
design with many random patients treated by the same surgeon who is nested within a particular hospital (much more like students studying under the same teacher nested within a particular school). Because costs increase by an order of magnitude at each phase, it is important to stop early if the treatment is not reaping benefits at acceptable costs. Perhaps the most important reason that studies fail at subsequent phases is because of a poor foundation at an earlier – especially the pre-clinical – phase. This is an essential message to carry over to education research. The medical model and the research model proposed in the RAND (2003) report have common components that relate to the framework for research proposed here. The RAND report views the production of knowledge and the improvement of practice as a cycle that includes at least the components in the left column of the table below. These components can be mapped onto the medical model shown in the center column of the table. In turn, both sets of components help define the steps of the proposed research framework, outlined in the right column. Research Phase in the Rand Model
Research Phase in the Medical Model
Research Phase in the Proposed Framework
Studies of basic problems of learning and teaching - documentation of teaching and learning
Preclinical Generate - Formulate questions based on theory or practice
Development of tools, materials and methods
Preclinical Phase I - Feasibility
Frame – Determine goals, constructs, measures, logistics, feasibility
Development and testing of new theories and knowledge about learning and teaching
Phase I – Feasibility Phase II – Initial Efficacy
Frame and begin to Examine – conduct systematic small studies to define what might work
Interventions,— e.g. curriculum materials, professional development programs, instructional programs
Phase II – Initial Efficacy Phase III – Confirming Efficacy
Examine and, if successful, Generalize – conduct larger studies under varying conditions with proper controls
Use, development, and documentation of interventions in practice
Phase III – Confirming Efficacy Phase IV – Follow-up
Generalize and, if successful, Extend to broader studies with long-term follow-up.
Findings about program effects and practices - insights about problems -new questions and problems
Phase IV – Follow-up, with feedback to the preclinical and feasibility phases
Extend and provide feedback to the Generate and Frame phases.
30
The proposed framework for research is very much in the spirit of the RAND report, augmented by the model for medical research, with the aim of furthering the goals of that report. In related work, Alan Schoenfeld (in press) has proposed an Evidenced-Based Education Research and Development model for intervention studies in education research with parallels to the medical model and, hence, to the proposed framework. From these perspectives, it appears that a phased approach to education research programs (especially in mathematics) holds promise for moving research forward to a scientific basis that combines theory and application and allows the accumulation of knowledge that will be useful to researchers, practitioners and policy makers. Appendix B IMPORTANT CONSIDERATIONS FOR SCIENTIFICALLY BASED
RESEARCH IN MATHEMATICS EDUCATION Measurement
Introduction All variables in an empirical study, whether it is education research, astrophysics, paleoentomology, or marketing, have outcomes that result from measures in the sense that each variable is assigned a value that relates to the physical or situational circumstance encountered by each case. In many research areas, and in education research in particular, variables can be conveniently—if perhaps somewhat artificially—divided into two groups: assessment variables, and nonassessment variables. Nonassessment variables arise from measures of physical or social status with values and meanings that are largely uncontroversial. For example, the gender of a child, the highest formal academic degree received by a teacher, and the weight of an automobile when it leaves the factory, are all examples of nonassessment variables. Nonassessment variables can often be treated as essentially error-free, and even when measurement error exists, it is usually a minor nuisance rather than a key element in understanding the variable (e.g., the highest degree a teacher has earned may be observed with error owing to respondents’ poor memory or incomplete understanding of the survey question, but probably not due to the fact that a survey question is inherently incapable of eliciting full information about the teacher’s degree). Assessment variables, in education research at least, are often measures of behavior in specific contextsresponses to tasks, test items, or other probes, in specific situations that are used to infer behavior in a larger context. They generally acquire meaning indirectly, such as through a combination of theoretical arguments about the subject matter and quantification by statistical modeling, and their values may well be subject to

31
debate. The measurement error is usually associated with the idea that the assessment is based on a few probes only, none of which completely characterizes the construct being measured (e.g., level of proficiency in eighth-grade mathematics); this inherent inability to completely characterize the thing being measured by any finite set of probes is a root cause of controversy for assessment variables and their use in education research. The following sections review some ideas about what an educational assessment is and provide some rather general discussions of reliability, validity and fairness. The final section presents some short examples illustrating these ideas. This material is intended to provide some background and justification for the recommendations for measurement in the Framing section of this report.
Educational Assessment and Education Research There are many definitions of educational assessment in the assessment and measurement literatures. For example, Mislevy (2003) states, “Educational assessment is reasoning from observations of what students do or make in a handful of particular circumstances, to what they know or can do more broadly” (p. 237). The NRC (2001b) report Knowing What Students Know digs a little deeper to state:
Three foundational elements, comprising … the “assessment triangle,” underlie all assessments. These three elements—cognition, observation, and interpretation—must be explicitly connected and designed as a coordinated whole. If not, the meaningfulness of inferences drawn from the assessment will be compromised. (p. 54)
Unpacking these definitions a bit, we can see that assessment is
• Inductive: How can we characterize or predict behavior in a broad range of circumstances from behavior observed in a few rather particular and context-specific circumstances?
• Imputational: To what cognitive and developmental attributes can we impute individual differences in observed performance?
Moreover, as suggested in the NRC quote, these two features of assessment often intertwine. For example, if we can impute performance observed in the present circumstances to a small handful of attributes, then prediction of performance in a broader context based on these few attributes will generally be more reliable. It is useful also to remember the broad purposes of assessment. Again borrowing from NRC (2001b), assessments generally serve one or more of three purposes:3
• Formative: Assist (student) learning • Summative: Assess (student) achievement • Evaluative: Evaluate existing programs or new interventions
Although the purpose in most education research is in some sense evaluative, we often repurpose formative and summative assessments for this evaluative purpose. This can be 3 The term student has been placed in parentheses because although formative and summative assessment have traditionally been centered on student learning and achievement, in the present era of extensive teacher professional development and institutional accountability, one might equally well replace “student” with “teacher,” “school,” “district,” or other unit, for formative or summative assessment.

32
a good thing, because the use of common measures increases the comparability of studies, thereby increasing the useful knowledge base in education research (NRC, 2005, Advancing Scientific Research in Education). On the other hand, assessment measures are delicate objects (cf. NRC, 1999, Uncommon Measures) and repurposing can sometimes undermine the meaning, usefulness and reliability of assessments. Among the examples below we consider some effects that this repurposing can have.
Validity and Reliability Many methodology texts in education research (e.g., Trochim, 2006) give lists of “threats to validity” for experiments and other studies. Indeed much of statistical experimental design is about designing studies so as to eliminate, or isolate and control, such threats to the validity of a study. These threats are not our primary topic here, although of course they are vitally important to consider in designing any study. Those same texts often contain chapters on measurement, within which there are formal definitions for the reliability and validity of (assessment) measures. These definitions sometimes are highly quantitative and couched in the language of a particular statistical or psychometric model such as classical true score theory. Viewed from a sufficiently broad perspective, these definitions are quite useful for building intuition about (and sometimes even quantifying and adjusting for) reliability and validity of assessments—even when the models clearly do not apply directly to the assessment one is interested in. Highly focused texts such as Brookhart and Nitko (2006) are extremely valuable in developing tests that can be modeled in this way and do meet high traditional standards of reliability and validity, for example as alluded to in the AERA-APA-NCME (1999) Standards for Educational and Psychological Testing. Rather than review these technical definitions and show in detail how they can be linked to broader insights, this report starts from the broader definitions given in Framing Component 2. Reliability and validity have direct analogues in statistical thinking: A measurement is valid when systematic errors (statistical biases) are small, so that the measurement provides meaningful, relevant and useful information. A measurement is reliable if random errors (statistical variability) are small, so that repeating the measurement on the same subjects would give consistent results. Random error (unreliability) can be estimated through replication and accounted for in the analysis; systematic error (invalidity) cannot be helped by replication, and can be difficult to detect. Validity need not refer to a unidimensional4 construct, although interpretation of the assessment may be easier if it is. Traditional correlational measures of validity (e.g., 4 Unidimensional has both a technical meaning and an intuitive meaning here. Technically, a unidimensional variable is one whose values are numbers on the real line. Intuitively, a unidimensional construct is one that is easily and somewhat narrowly characterized, one that you could measure the “amount of” on an ordinal, interval or ratio scale. For example, “Mathematical proficiency” in general is probably not unidimensional, but “achievement in seventh grade algebra” might well be, especially if it is measured in a population that has been exposed to only one algebra curriculum.

33
convergent, discriminant, criterion and predictive validity) emphasize association with unidimensional reference variables, and so tend to work better with unidimensional constructs. Validity for multidimensional constructs can be warranted with other types of quantitative and qualitative evidence (e.g., multitrait-multimethod analyses, factor analysis and related methods, face and content validity arguments, analyses of talk-aloud protocols). Refining an assessment so as to maximize traditional correlational measures of internal-consistency reliability or test-retest reliability tends to narrow the assessment to a unidimensional construct. Reliability for tests measuring multidimensional constructs tends to focus more on reproducibility, differential likelihood (certainty or uncertainty of inferences) and credibility or trustworthiness. Reliability can sometimes be warranted with theoretical arguments but it is usually more convincing to establish reliability by fitting appropriate statistical or psychometric models (e.g., item response theory models, latent class models, Bayes network models) and showing reliability within the framework of well-fitting models.
Fairness A third concept, fairness, enters into high-stakes assessments, for example as summarized by Knowing What Students Know (NRC, 2001b):
When stakes are high, it is particularly important that the inferences drawn from an assessment be valid, reliable, and fair. … Validity refers to the degree to which evidence and theory support the interpretations of assessment scores. Reliability denotes the consistency of an assessment’s results when the assessment procedure is repeated on a population of individuals or groups. And fairness encompasses a broad range of interconnected issues, including the absence of bias in the assessment tasks, equitable treatment of all examinees in the assessment process, opportunity to learn the material being assessed, and comparable validity (if test scores underestimate or overestimate the competencies of members of a particular group, the assessment is considered unfair). (NRC, 2001b, p. 39)
Fairness collects together those aspects of validity that have to do with the test implementation: sociologically selective language and examples, inequitable treatment of examinees, and so forth, all can undermine the meaning, relevance and usefulness of a measurement. A test that is fully valid must, ipso facto, be fair. But it is useful to consider fairness separately for two reasons. First, it is easy to overlook the implementation of a test when considering validity, but once recognized, threats to validity in test implementation often are easy to fix. Second, especially for high-stakes personal or policy decisions, fairness will often be the first consideration of those who look critically at test results5.
Borrow a Test or Build a Test? 5 For this reason, fairness seems especially suited to high-stakes decisions. However, for some research purposes, not all aspects of fairness are appropriate to consider. For example, opportunity to learn is important to consider in high stakes decisions, but may be irrelevant or counterproductive to consider if the research question is about side effects of an intervention (e.g. do students in a conceptual math curriculum acquire sufficient facility with rote factual knowledge).

34
Whether adopting an “off the shelf” assessment or developing one from scratch, it is useful to return6 to the “Assessment Triangle” of NRC (2001b). Every assessment embodies three theories:
• Performance: What sort of behavior are we talking about? What psychological, social, or other processes lead to individual differences?
• Observation: What tasks should we select so that we minimize error characterizing performance more broadly? How should we control the circumstances of observation?
• Interpretation: How should we summarize the behavior we observe? What inferences can we make?
Good assessments tend to be based on careful, interlocking elaborations of a theory of performance, a theory of observation, and a theory of interpretation for examinee/respondent behavior. Poor assessments tend to be developed without one or more well-elaborated theories, or without deep connections among the three theories. What the NRC (2001b) report makes clear is that validity, reliability, and fairness—at the level at which we have defined them above—arise out of the interaction of these separate aspects of test development. For example, validity may depend on a good conception of performance and representative tasks to observe, and also on a scoring and interpretive framework that does not obscure the relevant behavior. Reliability may depend on a good scoring scheme (and, e.g., rater training if needed), and also on a performance construct sharp enough to allow one to recognize random error and try to reduce it. Fairness especially focuses attention on threats to validity in the implementation of the test (that is, the conditions under which you will observe or interpret the behavior that you want to make inferences or predictions from), leading to questions such as the following. Should assessment tasks be written or administered differently to minimize construct-irrelevant differences in response across different populations? Should the task stay the same but the interpretation of the response change? The type and depth of evidence for validity, reliability and fairness will vary greatly, depending on the assessment and the purpose of assessment. For example, a set of behavioral probes used to develop preliminary evidence and hypotheses about a mechanism or process may require greater focus on theoretical arguments of relevance, meaning, and low error, than on quantitative evidence. Development time may be devoted almost entirely to developing or collecting theoretically appropriate assessment tasks and may therefore be fairly short (days or weeks). Refining a locally built assessment and developing suitably rigorous validity and reliability evidence so that it can be used formally to evaluate interventions or address other causal questions typically takes more time (months to years). Such assessment development should begin with the earliest stages of research and continue over the entire arc of a program of research, so that rich and rigorous reliability and validity evidence can be accumulated. Drafting an assessment by assembling items or tasks from other 6 The assessment triangle was modified by replacing the “cognitive” corner with a more general “performance” corner, since good assessment need not rely on an exclusively cognitive view of behavior.
35
pre-existing assessments does not appreciably shorten the development time, since most assessment development time is devoted to gathering appropriate validity and reliability evidence and refining the assessment and its implementation to improve validity, reliability, and fairness. The same issues impact the use of “off the shelf” assessments. Evidence for reliability, validity and fairness depend on the population of examinees and the circumstances and implementation of the assessment, as well as on the assessment items; one must argue that the setting in which the off-the-shelf assessment will be used is similar to the setting in which reliability and validity data were collected, or one must provide new evidence of reliability, validity and fairness, focused on the particular setting in which the assessment will be used.
Some Examples Example 1: Informal assessment can inform theory building. A researcher is interested in learning what makes translating between algebra and English hard for seventh-grade mathematics students. She and her team formulate several hypotheses about what features of algebraic statements would undermine the translation process. They write a number of test items of the form “Write a story problem for the equation 3x + 4 = 7,” each one intended to reflect a different hypothesis. After the team gives the test to a group of seventh graders, the team members discuss at great length what each student’s response to each question shows about that student’s understanding and about the hypotheses that they made about the translation process. On the basis of this discussion they refine their hypotheses about translating from algebra to English, and propose a set of rubrics that might be used to score future students’ work. Example 2: Inadequate attention to the implementation of an assessment undermines the research question. A research group is interested in measuring the effects of a computer-based tutoring system on student learning in middle school mathematics. They decide on a two-group, pretest/posttest design, in which one group interacts with the computer tutor for several months, and the other group does not. Two test forms are created by picking questions from a list of released items from the end-of-year accountability test in that state. The forms are counterbalanced, so half the treatment group gets Form A as the pretest and Form B as the posttest, and half that group gets the reverse; the same is done with the control group. Unfortunately, the test takes a whole class period, and although the teachers were willing to contribute a whole period in September, they allow only 20 minutes for the test in March, when preparations for spring accountability exams are already underway. It

36
appears that test scores mostly went down in both groups, but the variability in the test scores is too large to draw any conclusions from the study. Example 3: The method of scoring tasks can change the thing being measuring. Sijtsma and Verweij (1999) present an example of a test of transitive reasoning for third-grade children based on current theory about transitive reasoning in schoolchildren and the influence of memory load (fuzzy trace theory) on choosing solution strategies. Test items (tasks) were selected to reflect these theories. It was found that when the test items were scored only as wrong or right only, a variety of solution strategies could lead to “correct answers” on different problems; the test had low scores on measures of internal consistency, for example. On the other hand, when the test items were scored “right” only if the child both gave the correct answer and gave a correct deduction-based reason for her or his answer, then the test was highly unidimensional—a single score indicating “number correct” efficiently summarized each child’s performance. Example 4: The value of a test depends on the context in which it will be used. Schoenfeld (2006, pp. 22ff.) gives an empirical example of two well-developed, commercially available seventh-grade mathematics assessments that are highly associated: Their correlation is highly significantly different from zero, and they agree on the proficiency of about 70 percent of students who take both. However, the conditional passing rates tell a different story: If a student scored “proficient” on Test A, she or he had a 95 percent probability of scoring “proficient” on Test B. On the other hand, if a student scored “proficient” on Test B, then there is less than a 60 percent chance—little more than a coin flip—of she or he scoring “proficient” on Test A. Now suppose a researcher is conducting a high-stakes (for the researcher) study of whether a new seventh-grade mathematics curriculum you are developing affects student achievement. Should the researcher use Test A or Test B? The answer depends on the purpose of the research. For example, to validate the intrinsic value of the intervention, the researcher should choose the test whose construct most closely matches the new curriculum. To show that the new curriculum prepares students for end-of-year accountability exams, the researcher should choose the test that is closer to those exams. Example 5: Developing a full-blown assessment takes time and effort. Crosson et al. (2006) describe the development of the Instructional Quality Assessment (IQA) over a several-year period. Many possible uses of the IQA are envisioned but its development was guided by one particular purpose: to evaluate the impact of teacher professional development (PD) on groups of teachers. The IQA is a set of rating scales for classroom observation and evaluation of teacher assignments for students, rooted in a conception of classroom practice called the Principles of Learning (Resnick et al., 2001). The effort took five years. The first two years were spent refining the performance construct, trying out items and scoring methods one at a time in local classrooms, and so

37
on. Then come a first field test that showed real weakness in the scoring rubrics, a second field test in which the IQA was able to distinguish a district that had had PD from one that did not have PD, and a validation study of the IQA in terms of student achievement on a state accountability assessment and from which moderate to high reliability (0.6 to 0.8) was obtained for overall measures. Unit of Randomization versus Unit of Statistical Analysis in Designed Experiments or Sample Surveys; Group Randomized Designs In many scientific studies or experiments, the individual subject is individually randomized to an intervention or treatment. In such studies, the subject is the unit of randomization (or the experimental unit) and, in turn, is the unit of analysis in the statistical analysis of the intervention effect. In the statistical analysis of a randomized trial, the responses of each subject are assumed to be independent of each other (unrelated to each other). In other words, the effect of the intervention on one individual does not influence the effect of the intervention on another individual. Many statistical techniques require the assumption of independence of the units of analysis. It is critical, therefore, to identify the appropriate unit of analysis. When individuals are not or cannot be randomly assigned individually to interventions, an entire group (such as a class or school) may be randomly assigned to receive the intervention; such a randomized design is known as a group randomized trial. The effect of the intervention may be more similar among members of a group who have the same environment and exposure; their responses will be related to each other (correlated, not independent). In this case, the independent unit in the statistical analysis is the group; the sample size is now reduced to the number of groups, rather than the number of individuals.
The unit of analysis must be accounted for in both sample size considerations and the statistical analysis plan. Random and fixed effects should be clearly delineated. Statistical methods assuming independence of observations must employ the appropriate unit of analysis. Also, more recent novel statistical techniques have been developed to account for the clustering (or lack of independence) of observations in a group randomized trial setting such as students in classrooms for which the classroom is randomized to an intervention. Appropriate multivariable modeling techniques such as longitudinal data analysis methods (which account for correlated or repeated measures) must be used. Similarly, nested hierarchical design (students within classrooms within schools) must account for the within-and between-level clustering of intervention effects; hierarchical linear modeling and other advanced multilevel statistical modeling techniques are helpful in the analysis of data from such designs.
Reference and Example
The following paragraphs portraying alternative sampling schemes are taken directly from the Web site of Gerard E. Dallal of Tufts University (http://www.tufts.edu/~gdallal/units.htm)

38
Consider a study of 800 tenth-grade high school students receiving one of two treatments, A and B. Experience has shown that two students selected at random from the same class are likely to be more similar than two students selected at random from the entire school who, in turn, are likely to be more similar than two students selected at random from the entire city, who are likely to be more similar than two students selected at random from the entire state, and so on.
Here are three of the many ways to carry out the study in a particular state.
1. Take a random sample of 800 tenth-grade students from all school students in the state. Randomize 400 to A and 400 to B.
2. Take a random sample of forty tenth-grade classes of 20 students each from the set of all 10th grade classes. Randomize twenty classes to A and twenty classes to B.
3. Take a random sample of twenty schools. From each school, randomly select two classes of twenty students each. Randomize the schools into two groups with classes from the same school receiving the same treatment.
Each study involves 800 students—400 receive A and 400 receive B. However, the units of analysis are different. In the first study, the unit of analysis is the individual student. The sample size is 800. In the second study, the unit of analysis is the class. The sample size is forty. In the third study, the unit of analysis is the school. The sample size is twenty.
…
Most of the time the units of analysis are the smallest units that are independent of each other or the smallest units for which all possible sets are equally likely to be in the sample. In the examples presented above
1. A random sample of students is studied. The students are independent of each other, so the student is the unit of analysis.
2. Here, students are not independent. Students in the same class are likely to be more similar than students from different classes. Classes are independent of each other because we have a simple random sample of them, so class is the unit of analysis.
3. Here, neither students nor classes are independent. Classes from the same school are likely to be more similar than classes from different schools. Schools are selected at random, so school is the unit of analysis.
It is important to note that the unit of randomization can be different from the unit of analysis. For example, students might be randomly assigned to classes, but if the intervention is provided at the class level, the class is still the unit of analysis, assuming

39
that classes have been randomized to treatments. Although not always feasible, the advantage of randomizing students to classes, over using classes set up in other ways, is that systematic student differences may affect the outcome in the latter case, and have to be considered. However, class differences (teacher, group interaction, and the like) make class the unit of analysis in such studies. Raudenbush (1997), among many others, provides sound guidance on the statistical analysis and optimal design for cluster randomized trials. Experimental versus Observational Research The difference between experimental and observational research is crucial in deciding on statistical methodology and acceptable inferences. In experimental studies, some intervention is enacted and the results observed. Ideally, the experimental units (units of randomization), whether individual students, classes, schools, or other, are randomly assigned to one or more experimental treatments, and results are subsequently compared. Randomization establishes a basis for causal inference, ensuring that the results are not biased by factors other than the intervention, although when possible, known relevant factors should be examined to see whether chance differences could be affecting the experimental outcome. If possible and practical, known important relevant factors should be controlled through more elaborate randomization designs, including stratification and clustering in various combinations. If the units are randomly sampled from some wider population, inferences can be extended to that population. Random sampling of this kind often is not possible. In that case, random assignment to conditions makes the inferences applicable to the units observed; inference then can be based on the distribution of the measured outcome over all possible random assignments within the specified design, from which the chance probability of an outcome as extreme as that found can be calculated. Generalization beyond the units observed then must rely on arguments similar to those needed in observational studies. In observational research, units are observed without any active intervention. Different conditions are not randomly assigned, so any observed differences may be due to preexisting unit differences, making inference more uncertain. Associations may be demonstrated, but causal implications are not as clear; any observed differences may be due to numerous other factors, some of which are observed and possibly many that are not observed. Design of such studies is crucial; careful consideration should be given to the choice of observed units as well as to the conditions of observation. Research is valuable to the extent that differences among units are examined and alternate causal possibilities are considered in light of all available evidence. In practice, the distinction between experimental and observational research is not that absolute. Interventions may be carried out without the possibility of randomization, for practical, ethical, institutional, or political reasons, making problems of inference in interventional studies similar to those in observational studies. In such cases, careful consideration must be given to choice of units to make them as comparable as possible. Even well-planned randomized experimental studies may become partly observational because of problems arising in carrying out treatments, such as changes in treatments in
40
response to student reactions, students moving in and out of schools or classes, and units dropping out for various reasons. Furthermore, although causal inference may be made with more confidence in experimental studies than in observational studies, the experimental conditions must be carefully planned and then scrutinized to see whether any differences might really be due to artifacts of the implementation rather than to the intended experimental factors. The statistical methodology used to analyze experimental and observational studies may often be very similar, but the experimental-observational distinction should be kept in mind in the discussion and in the conclusions. If experimental studies involve either complete or restricted randomization, causal analysis is on firmer ground than in nonrandomized experimental or in observational studies, in which only association should be claimed unless there is strong additional justification. Design issues are different, but equally crucial, in both types of studies. In practice, even studies that are designed with randomization usually involve some observational elements because of problems in implementation, as described above. Furthermore, statistical inference always involves uncertainty due to random fluctuations. Thus, causal conclusions, even in randomized studies, should be drawn with caution. In both experimental and observational studies, other issues as well as those of primary importance are often examined, such as additional outcome variables and the relation between outcome variables and demographic differences among units. Although such activities are useful in suggesting further research, strong conclusions based on extensive “data mining” should be avoided. Pre-Post Scores (Gain Scores) Serious questions about the statistical use of gain scores (difference scores) have been noted for almost a quarter of a century, starting in the early 1960s. As can be seen in Miller and Kane (2001), Nunnally (1975), and Willett (1989), there have been charges and counter charges about validity, bias, and other attributes by many esteemed scholars. As noted by Pike (2004)
In their tribute to Fredric Lord, Holland and Rubin (1983) noted that the basis for Lord’s Paradox is that an analysis of difference scores and an analysis of covariance are designed to answer different questions. An analysis of difference scores answers the question about whether students changed from the pretest to the posttest, whereas an analysis of covariance answers the question of whether students who have the same pretest scores will have different posttest scores. These are not the same questions and it is unrealistic to expect them to provide the same answers. (p. 352)
The use of gain scores is a controversial issue, but it is important that it be brought to the surface in a discussion directed toward good statistical practice in mathematics education research. Before formulating a key question, it should be pointed out that nearly all these “battles” are found in education journals. There is little on this issue in the statistics textbooks or in the statistics research journals. The one exception is the third volume of Milliken and Johnson (2001), a book by two very well known statisticians who have written extensively on analyzing messy data. They point out what they perceive to be a potential flaw in the use of gain scores. In recent years the use of gain scores has played
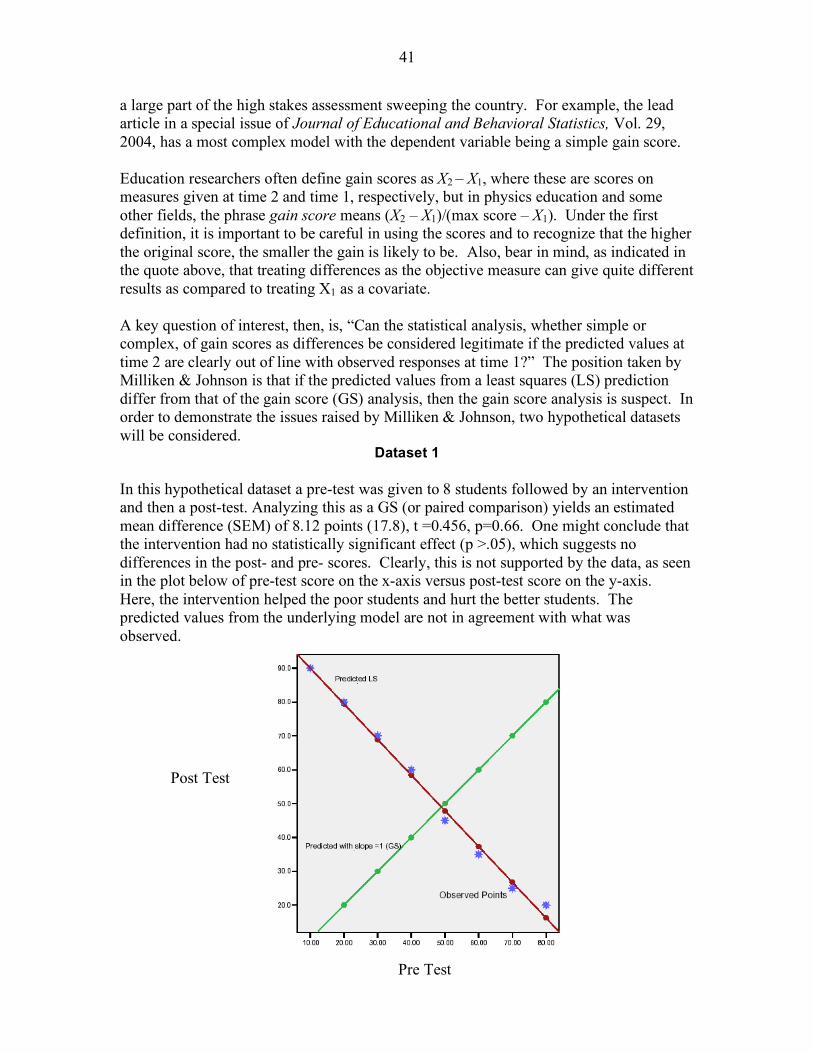
41
a large part of the high stakes assessment sweeping the country. For example, the lead article in a special issue of Journal of Educational and Behavioral Statistics, Vol. 29, 2004, has a most complex model with the dependent variable being a simple gain score. Education researchers often define gain scores as X2 – X1, where these are scores on measures given at time 2 and time 1, respectively, but in physics education and some other fields, the phrase gain score means (X2 – X1)/(max score – X1). Under the first definition, it is important to be careful in using the scores and to recognize that the higher the original score, the smaller the gain is likely to be. Also, bear in mind, as indicated in the quote above, that treating differences as the objective measure can give quite different results as compared to treating X1 as a covariate. A key question of interest, then, is, “Can the statistical analysis, whether simple or complex, of gain scores as differences be considered legitimate if the predicted values at time 2 are clearly out of line with observed responses at time 1?” The position taken by Milliken & Johnson is that if the predicted values from a least squares (LS) prediction differ from that of the gain score (GS) analysis, then the gain score analysis is suspect. In order to demonstrate the issues raised by Milliken & Johnson, two hypothetical datasets will be considered.
Dataset 1 In this hypothetical dataset a pre-test was given to 8 students followed by an intervention and then a post-test. Analyzing this as a GS (or paired comparison) yields an estimated mean difference (SEM) of 8.12 points (17.8), t =0.456, p=0.66. One might conclude that the intervention had no statistically significant effect (p >.05), which suggests no differences in the post- and pre- scores. Clearly, this is not supported by the data, as seen in the plot below of pre-test score on the x-axis versus post-test score on the y-axis. Here, the intervention helped the poor students and hurt the better students. The predicted values from the underlying model are not in agreement with what was observed.
Post Test
Pre Test

42
Dataset 2 In this hypothetical dataset a pre-test was given to 8 students followed by an intervention and then a post-test. Analyzing this as a GS (or paired comparison) yields an estimated mean difference (SEM) of 30.00 points (9.63), t =3.11, p=0.017). Here, one might conclude that the intervention has a statistically significant effect (p < .05) and thus one would estimate that the post-test score is, on average, 30 points greater than the pre-test score. Clearly, this is not supported by the data, as seen in the plot below of pre-test score on the x-axis versus post-test score on the y-axis. Although the intervention helped each student, the relationship is not linear. Again, the predicted values from the model do not agree with what was observed.
The use of gain scores is standard in the analysis of evaluation data. But the analysis of gain scores may lead to faulty conclusions unless the regression of the post-test score on the pre-test score is linear with slope nearly equal to unity. For a particular study, whether the use of gain scores is appropriate should be critically assessed through visual exploration of the data and use of alternative statistical methods and models for repeated measures.
Post Test
Pre Test

43
Appendix C
COMMENTS ON CRITICAL AREAS FOR COOPERATION BETWEEN STATISTICS AND MATHEMATICS EDUCATION
RESEARCH During the series of workshops that gave form and substance to this document, other issues concerning sound research in education emerged. Much of that discussion has been distilled into the four areas discussed below. These comments are intended to add both breadth and depth to the guidelines presented earlier in the report. Qualitative Versus Quantitative Research
Although mathematics education has a rich history of quantitative research, qualitative research has tended to dominate the scene for the past few decades. In some cases the qualitative study could have been a quantitative one or could have had a quantitative aspect, but students and faculty appeared to shy away from quantitative experimental designs and application of statistical methodology. For example, in a recent study of how teachers define and carry out mathematics in context, using applications and modeling, a doctoral student chose to observe and interview six “exemplary” teachers. Although the study could have been supplemented with a survey of a relatively large sample of teachers, the reasons for not doing so—whether the student lacked easy access to a large sample, may not have trusted or valued the data that a survey might provide, or may not have known how to create a good survey instrument—are not clear. There may have been good reasons for mathematics education researchers to move away from almost total reliance upon quantitative methods toward qualitative ones, but a middle ground would be more appropriate. In fact, good quantitative studies generally require a qualitative rationale. Mathematics education researchers, however, need to be well versed in both quantitative and qualitative methods—a tall order to be sure, given the almost bewildering number of quantitative and qualitative courses on offer. Yet, the alternative is unacceptable. Without a solid grounding in a variety of methods, dissertations in mathematics education will be replete with bad methods-comparison studies and bad case studies. Even the secondary analyses of existing data relevant to mathematics education appear reduced. For example, the AERA Grants Program (http://www.aera.net/grantsprogram/) provides funding for secondary analyses of data sets sponsored by National Center for Education Statistics and the NSF. Several of these data sets contain data from studies that address the teaching and learning of mathematics (TIMSS, NAEP, PISA, etc.); in recent years the program has received many applications from educational sociologists and economists but few from researchers in mathematics education. The importance of measurement in mathematics education research must be stressed. As mathematics education researchers see the need for improved analytical tools, the
44
opportunities for statistical research in education open up. It must be recognized that research in mathematics education also requires investigators who are strongly connected to psychology and statistics: mathematics education researchers, psychometricians, and statisticians are all needed. The separation between qualitative and quantitative research presents an opportunity for mathematics education researchers and statisticians to come together to explain and demonstrate how both kinds of research are necessary and can work together in a research program that is built around the cycle presented in the RAND report. Mixed methods require teams of people working together. These points are elaborated on below. Educating Graduate Students and Keeping Mathematics Education Faculty Current in Education Research As suggested in the previous section, many graduate students in education, including mathematics education, avoid taking courses in research design, research methods, and statistics. There is, however, a need for courses in education research design and modern statistical methodologies if the quality of education research is to meet the requirements that government policies and societal expectations are placing upon it. Doctoral programs in mathematics education have great variability, but every program should contain an emphasis on modern research methodologies, as well as an overview of the current state of research in mathematics education. Collaboration with statisticians is encouraged in order to build this emphasis. Today, education statistics is conducted largely at institutions like the Educational Testing Service, the American College Testing program, and the RAND Corporation, rather than at universities. The current emphasis on evidence-based educational programs and materials suggests that the time is right to build stronger emphases on education statistics in colleges and universities, and to do so in a way that builds a solid infrastructure for long-term development. We hope that education departments and statistics departments, among others, can join forces in these efforts. The field of biostatistics may be taken as a comparative example. Biostatistics grew during the last half of the twentieth century because
• Evidence-based medicine became the norm (with increased government funding and an information explosion).
• Pharmaceutical firms increased high-quality research and development, with Food and Drug Adminitration approval becoming part of the process.
• National Institutes of Health training grants became available to train biostatisticians.
Perhaps a similar growth model should be promoted for education.
Statistics Practices and Methodologies
Intervention Studies Statisticians can help education researchers with the central problems of design research. Mathematics and science education are design sciences whose goal is to try to create

45
(design) and study attitudes, attributes, or outcomes. For example, multiplicative reasoning in algebra is greatly underplayed in U.S. schools but quite prominent in many other countries. How do mathematics educators create a role and place for multiplicative reasoning in U.S. schools? Researchers must understand what has been created and the constraints under which it was created in order to understand the limits of generalizability. In the process, they learn things about students that are not reported in the literature. Design studies can seldom be simple comparative experiments because the researcher is trying to discover whether something is there (in student reasoning, for example) that was not there before the intervention. Researchers must understand the space of possibilities—they make decisions, but what if they had made different decisions? To implement a program on a larger scale, one must systematically consider the conditions under which it will be implemented (institutional structures and practices, for example). Definitions and problems of measurement are not easy and not trivial. The central problems of comparative research on curriculum and instruction can be described as follows:
• What are the treatments? This is a complex question because of varying perspectives and implementation issues (e.g., the intended, the implemented, or the achieved treatment).
• What is the context of the research? What are the characteristics of the population to be studied?
• What are the measures? Are they valid? Are they reliable? Are they fair? • What is the effect? That depends on the measure. Is it important? Is it valid for
both treatment and control? It also depends on the audience for the curriculum. A curriculum may put low achievers at a disadvantage; students may have very different experiences depending on their background and culture.
• What are the external influences on the study? Political activity, for example, affects both teachers and students.
• What is the larger context? The researcher must consider what is happening in other countries; for example, “rigorous testing” in the United States may not be very rigorous in comparison with educational testing in other venues.
Research needs to address key cognitive gatekeepers, such as multiplicative reasoning, with robust studies that will lead to the development of interventions to solve the problem and learn about student cognition. Such research will require multiple iterations because there may be many different approaches that work differently with different students, so that the interventions need to approach an idea in different ways. And students need time to grasp new concepts. Medical research is cumulative and minimizes patient harm stage by stage. In education, researchers often jump from the early stages of basic research to implementation. Few educational fields replicate studies, resulting in a lack of information in journals on many key problems and issues. Today’s emphasis is on randomized controlled trials as the gold standard for scientific evidence. As important and useful as such trials might be, they are neither necessary nor sufficient scientifically to cover the breadth and depth of research required in education

46
in general, or in mathematics education in particular. The standards of the What Works Clearinghouse tend to be much too strict as a general rule and care must be taken to avoid a plethora of randomized trials studying only what is easiest to measure.
Longitudinal Studies Improvement of almost any significant aspect of education is a long-term process and, as such, requires greater attention to longitudinal studies. Longitudinal studies look at causal relationships and systematic changes over time. Here are two good examples from education research:
• A doctoral student (Mayer, 1998) was able to show that teachers employing methods recommended by the National Association of Teachers of Mathematics produced higher growth rates in algebra achievement by eighth- and ninth-grade students in a large county district. Although the study did not employ randomization, control measures were used.
• Another doctoral student (Ma, 1999) performed survival analysis with existing data on courses taken by students during high school, finding that prior achievement was most influential in the earlier grades, but prior attitude was most influential in the later grades.
An examination of the literature reveals a great increase in longitudinal research over the past twenty years in the fields of health, education, and business. Increasingly, there is a great need to educate researchers and potential researchers about the development and correct application of modern statistical methods for analyzing longitudinal data. Some advantages of modern methods are their flexibility, their ability to identify temporal patterns, and their ability to accommodate predictors that change over time and whose effects vary over time. Statisticians and education researchers working together can help the field frame the questions to collect appropriate data so that these methods can be used effectively.
Causal Inference and Hierarchical Modeling Policy makers want to know “what if” before spending money, but the answers to such questions require expensive large-scale studies that may not be feasible. The information obtained per dollar invested can be maximized by careful choices of design and methods of analysis, with special emphasis on modern techniques of hierarchical modeling. There are similarities and differences between research on the impact of instructional regimes and medical clinical trials. In medicine, policy research is not done without knowing about the effects of surgeries, drugs, and other treatments. The key stable unit treatment value assumption (SUTVA)—the treatment is not dependent on the person administering it or on the other recipients of it—often holds true in medicine but not in education. SUTVA assumes, for example, that the impact of a drug does not depend on the physician (otherwise, one would have to randomly assign physicians).

47
In education research, the “resources as cause” model, begun twenty years ago, is a poor model because resources are used in such varying and complex ways. The “instruction as cause” model is more like that used in medicine. One first studies the effects of an instructional regime on student outcomes in ideal situations (expensive). Then, one makes the regime more cost effective and studies it in realistic situations. (A regime is a set of rules for a coherent approach to teaching, but not too fine-grained.) A regime can be assigned randomly at a variety of levels, but group assignment (school, classroom) is necessary in educational settings because the teacher does affect the outcome measures and must be randomly assigned. Hierarchical models are an appropriate tool for studying such group-randomized designs. In summary:
• Understanding the causal effects of instructional regimes is central to applied research in education.
• The standard simplifying assumptions in clinical trials (SUTVA) do not apply. • Group-randomized experiments are the norm. • Problems of scale and cost must be considered. • Alternative designs (e.g., use of blocking, covariates) must be found for
increasing precision. • Models for the learning from instruction must be developed to get at the effects of
the instruction received. • Multiyear studies are a challenge but are essential. • There is enough work here for a new brigade of educational statisticians!
ASA could provide a great service by supporting the development and dissemination of statistical methods appropriate to education research.
Synthesis of Research Results Over the years, education research has consisted of many relatively small studies by investigators somewhat disconnected from one another. Thus, the synthesis of research results (meta-analysis) is a key component of the effective use of research results. A good example of meta-analysis is the Teacher Qualifications and the Quality of Teaching (TQ-QT) project, by researchers at Florida State University and Michigan State University, which is synthesizing studies of teacher qualifications and teaching quality. The project is examining more than 450 studies, both qualitative and quantitative, at the K–12 level (including studies using data from the National Educational Longitudinal Study). (See http://www.msu.edu/user/mkennedy/TQQT/ for further details.) Many statistical issues arise in this project, including questions regarding how to represent complex study results, the mutual dependence of multiple outcomes per study and multiple reports on large samples, and methods for synthesizing slopes and other indices. Related issues involve how to handle alternative certification programs (they include older students but studies do not control for age, and programs vary by state) and how to deal with subject-matter knowledge that is measured in many ways. Some commercially available tests bought by schools to select teachers appear to be

48
instruments that can be faked, with significant range restriction problems that are not documented. In general, many studies were poorly designed studies of convenience that did not control for potential confounders. The research did not always accumulate or build on other research; many studies were dissertations that did not seem to capitalize on prior work. Although such problems in combining information exist, meta-analysis is useful in identifying the gaps in research. Building Partnerships and Collaboratives
Many of the issues discussed earlier in this report highlight a strong need for partnerships among the research team, the schools or school districts in which intervention research may be done, and the teachers who are the cooperating practitioners. The most successful research projects appear to be those that spend time developing partnerships and good relationships with the schools and districts they study. It also appears that a great variety of scientific and education skills need to be present in the research teams so that they are truly multidisciplinary. Education research needs to accumulate knowledge by organizing research teams into collaboratives, much as is done in medical research. Much work needs to be done to develop cooperative research in education at the levels of individual researchers, research teams, and collaboratives. (See, for example, Burkhardt & Schoenfeld, 2003) The barriers to collaboration in research begin at the university level, where departmental structures do not naturally foster such collaboration. In many schools and colleges of education, moreover, a focused, coherent research agenda is needed to cultivate collaboration. Other settings for graduate programs may serve as examples. In some of the social and physical sciences and in medicine, a graduate student is often part of a large research group and can carve off one small piece of a larger study that might be multi-institutional. Collaborative groups allow teams of researchers to build small, focused designs and then collaborate across diverse settings for purposes of randomization and generalizability. In statistics education research, a collaborative among a number of university departments is in the formative stages. The Consortium for Advancing Undergraduate Statistics Education (CAUSE) has a research component that has already put together a large literature base, lists of people working in the field, and information on conferences that have a statistics education research component. (See www.causeweb.org/.) One important part of the literature base is the relatively new Statistics Education Research Journal published by the education section of the International Statistics Institute. Basic to the notion of accumulating a body of knowledge is data sharing. Researchers need to make data (or portions of the data) available so that others can reanalyze it. Ways must be found to encourage and facilitate this practice. In some disciplines (economics, for example), certain journals require that accepted papers be accompanied by the data, for print or posting on a Web site. Perhaps this practice should be adopted by research

49
journals in mathematics education. Paramount to publication and sharing of data are the guidelines for reporting and evaluating that research espoused by this report.

50
REFERENCES American Educational Research Association, American Psychological Association, &
National Council on Measurement in Education. (1999). Standards for educational and psychological testing. Washington, DC: American Educational Research Association.
Altman, D.G. (2002). Poor-quality medical research: What can journals do? Journal of
the American Medical Association, 287, 2765–67. Balfanz, R. B., MacIver, D. J., & Byrnes, V. (2006). The implementation and impact of
evidence-based mathematics reforms in high-poverty middle schools: A multi-site, multi-year study. Journal for Research in Mathematics Education, 37, 33–64.
Brookhart, S. M., & Nitko, A. J. (2006). Educational assessment of students (5th ed.).
Upper Saddle River, NJ: Prentice Hall. Burkhardt, H., & Schoenfeld, A. H. (2003). Improving educational research: toward a
more useful, more influential, and better funded enterprise. Educational Researcher 32(9), 3-14.
Carpenter, T. P., Levi, L., Franke, M. L., & Zeringue, J. K. (2005). Algebra in
elementary school: Developing relational thinking. Zentralblatt für Didaktik der Mathematik, 37(1), 53–59.
Crosson, A. C., Boston, M., Levison, A, Matsumura, L. C., Resnick, L. B., Wolf, M. K.,
& Junker, B. W. (2006). Beyond summative evaluation: The instructional quality assessment as a professional development tool (CSE Report 691). Los Angeles: University of California at Los Angeles, National Center for Research on Evaluation, Standards and Student Testing (CRESST). Available from the CRESST Web site, http://www.cse.ucla.edu
Enders, F. B., & Diener-West, M. (2006). Methods of learning in statistical education: A
randomized trial of public health graduate students. Statistics Education Research Journal, 5(1), 5–19.
Holland, P. W., & Rubin, D. B. (1983). On Lord’s Paradox. In H. Wainer & S. Messick
(Eds.), Principles of modern psychological measurement: A festschrift for Frederic M. Lord (pp. 3–26). Hillsdale, NJ: Erlbaum.
Konold, C., & Higgins, T. L. (2003). Reasoning about data. In J. Kilpatrick, W. G.
Martin, & D. Schifter (Eds.), A research companion to principles and standards for school mathematics (pp. 193–215). Reston, VA: National Council of Teachers of Mathematics.
51
Lamon, S. J. (in press). Rational numbers and proportional reasoning: Toward a theoretical framework for research. In F. K. Lester (Ed.), Second handbook of research on mathematics teaching and learning. Charlotte, NC: Information Age Publishing.
Ma, X. (1999). Dropping out of advanced mathematics: The effects of parental
involvement. Teachers College Record, 101, 60–81. Mayer, D. P. (1998). Do new teaching standards undermine performance on old tests?
Educational Evaluation and Policy Analysis, 20, 53–73. Miller, T. B., & Kane, M. (2001). The precision of change scores under absolute and
relative interpretations. Applied Measurement in Education, 14, 307–327. Milliken, G. A., & Johnson, D. E. (2001). Analysis of messy data, Vol. 3: Analysis of
covariance. New York: Chapman & Hall/CRC. Mislevy, R. J. (2003). Substance and structure in assessment arguments. Law,
Probability and Risk, 2, 237–258. Morgan, P., & Ritter, S. (2002). An experimental study of the effects of Cognitive
Tutor® Algebra I on student knowledge and attitude. Pittsburgh, PA: Carnegie Learning. Retrieved October 5, 2006, from http://www.carnegielearning.com/web_docs/originalstudy.pdf
National Research Council. (1999). Uncommon measures (M. Feuer, P. W. Holland, B.
F. Green, M. W. Bertenthal & F. C. Hemphill, Eds.). Washington, DC: National Academy Press.
National Research Council. (2001a). Adding it up: Helping children learn mathematics
(J. Kilpatrick, J. Swafford, & B. Findell, Eds.). Washington, DC: National Academy Press.
National Research Council. (2001b). Knowing what students know (J. Pellegrino, N.
Chudowsky & R. Glaser, Eds.). Washington, DC: National Academy Press. National Research Council. (2002). Scientific research in education (R. J. Shavelson &
L. Towne, Eds.). Washington, DC: National Academy Press. National Research Council. (2004). On evaluating curricular effectiveness: Judging the
quality of K–12 mathematics evaluations (J. Confrey & V. Stohl, Eds.). Washington, DC: National Academy Press.
National Research Council. (2005). Advancing scientific research in education (L.
Towne, L. L. Wise, & T. M. Winters, Eds.). Washington, DC: National Academy Press.

52
National Science Foundation. (2006). Course, curriculum, and laboratory improvement
(Program Announcement No. 06536). Retrieved October 5, 2006 from http://www.nsf.gov/publications/pub_summ.jsp?ods_key=nsf06536
No Child Left Behind Act of 2001, Pub. L. No. 107-110, 115 Stat. 1425 (2002). Nowak, R. (1994). Problems in clinical trials go far beyond misconduct. Science, 264,
1538–41. Nunnally, J. C. (1975). The study of change in evaluation research: Principles concerning
measurement, experimental design, and analysis. In E. L. Struening & M. Guttentag (Eds.), Handbook of evaluation research (pp. 231–272). Beverly Hills, CA: Sage.
Pike, G. R. (2004). Lord’s Paradox and the assessment of change during college. Journal
of College Student Development, 45, 348–353 RAND Mathematics Study Panel. (2003). Mathematical proficiency for all students:
Toward a strategic research and development program in mathematics education (MR-1643.0-OERI). Santa Monica, CA: RAND.
Raudenbush, S. W. (1997). Statistical analysis and optimal design for cluster randomized
trials. Psychological Methods, 2, 173–185. Raudenbush, S. W. (2005). Learning from attempts to improve schooling: The
contribution of methodological diversity. Educational Researcher, 34(5), 25–31. Resnick, L., Hall, M. W., & Fellows of the Institute for Learning. (2001) The principles
of learning: Study tools for educators [CD-ROM]. Pittsburgh, PA: University of Pittsburgh, Learning Research and Development Center, Institute for Learning.
Reys, R., Reys, B., Lappan, R., Holliday, G., & Wasman, D. (2003). Assessing the
impact of standards-based middle grades mathematics curriculum material on student achievement. Journal for Research in Mathematics Education, 34, 74–95.
Schoenfeld, A. (in press). Method. In F. K. Lester (Ed.), Second handbook of research
on mathematics teaching and learning. Charlotte, NC: Information Age Publishing.
Schwarz, B. B., & Hershkowitz, R. (1999). Prototypes: Brakes or levers in learning the
function concept? The role of computer tools. Journal for Research in Mathematics Education, 30, 362–389.
53
Sijtsma, K., & Verweij, A. C. (1999). Knowledge of solution strategies and IRT modeling of items for transitive reasoning. Applied Psychological Measurement, 23, 55–68.
Shaffer, J.P. (1995), Multiple hypothesis testing. In J.T. Spence (Ed.), Annual Review of Psychology, 46, 561-584. Trochim W. (2006). The research methods knowledge base. Cincinnati: Atomic Dog
Press. Wild, C. J., & Pfannkuch, M. (1999). Statistical thinking in empirical inquiry.
International Statistical Review, 67, 223–265. Wilson, L. D. (in press). High stakes testing in mathematics. In F. K. Lester (Ed.),
Second handbook of research on mathematics teaching and learning. Charlotte, NC: Information Age Publishing.
Willett, J. B. (1989). Some results on reliability for the longitudinal measurement of
change: Implications for the design of studies of individual growth. Educational and Psychological Measurement, 49, 587–602.

54
WORKING GROUP ON STATISTICS IN MATHEMATICS EDUCATION RESEARCH
Martha Aliaga American Statistical Association 732 North Washington St Alexandria, VA 22314-1943 [email protected] Marie Diener-West Department of Biostatistics John Hopkins University-School of Public Health 615 N Wolfe St Baltimore, MD 21205-2103 [email protected] Joan Garfield Department of educational Psychology University of Minnesota 178 Pillsbury Dr SE 315 Burton Hall Minneapolis, MN 55455-0296 [email protected] Traci Higgins TERC 2067 Massachusetts Avenue Cambridge, MA 02140 [email protected] Sterling Hilton Department of Educational Leadership and Foundations Brigham Young University 306A McKay Building Provo, UT 84602 [email protected] Gerunda Hughes Department of Curriculum and Instruction Howard University 2400 Sixth Street, NW, Washington, DC 20059 [email protected]
Brian Junker Department of Statistics 132E Baker Hall Carnegie Mellon University Pittsburgh, PA 15213 USA [email protected] Henry Kepner Department of Curriculum and Instruction University of Wisconsin-Milwaukee School of Education P.O. Box 413 Milwaukee, WI 53201-0413 [email protected] Jeremy Kilpatrick Department of Mathematics Education University of Georgia Athens, GA 30602 [email protected] Richard Lehrer Department of Teaching and Learning Vanderbilt University 230 Appleton Place Nashville, TN 37203-5721 [email protected] Frank K. Lester Department of Curriculum and Instruction School of Education Indiana University 201 North Rose Ave. Bloomington, IN 47405-1006 [email protected] Ingram Olkin Department of Statistics Stanford University Stanford, CA 94305 [email protected]
55
Dennis Pearl Department of Statistics The Ohio State University 1958 Neil Ave 404 Cockins Hall Columbus, OH 43210-1247 [email protected] Richard Scheaffer Department of Statistics University of Florida Gainesville, FL 32611 [email protected] Alan Schoenfeld Cognition and Development Graduate School of Education University of California Berkeley, CA 94720-1670 [email protected] Juliet Shaffer Department of Statistics University of California Berkeley, CA 94720-0001 [email protected]
Edward Silver Graduate School of Education University of Michigan 610 East University Avenue, Ann Arbor, Michigan 48109-1259 [email protected] William Smith American Statistical Association 732 North Washington St Alexandria, VA 22314-1943 [email protected] F. Michael Speed Department of Statistics Texas A&M University College Station, TX 77843-3143 [email protected] Patrick Thompson Department of Mathematics and Statistics Arizona State University Tempe, AZ 85287 [email protected]