Effective Schools: Teacher Hiring, Assignment, Development ... final submission... · 1 Effective...
52
1 Effective Schools: Teacher Hiring, Assignment, Development, and Retention Susanna Loeb Stanford University 520 Galvez Mall Drive Stanford, CA 94305 [email protected] Demetra Kalogrides (corresponding author) Stanford University 520 Galvez Mall Drive Stanford, CA 94305 [email protected] Tara Béteille World Bank [email protected] Running Head: Effective Schools Acknowledgements: This research was supported by grants from the Hewlett Foundation and the Spencer Foundation. Any errors or omissions are the responsibility of the authors.
Transcript of Effective Schools: Teacher Hiring, Assignment, Development ... final submission... · 1 Effective...
1
Effective Schools: Teacher Hiring, Assignment, Development, and Retention
Susanna Loeb
Stanford University
520 Galvez Mall Drive
Stanford, CA 94305
Demetra Kalogrides (corresponding author)
Stanford University
520 Galvez Mall Drive
Stanford, CA 94305
Tara Béteille
World Bank
Running Head: Effective Schools
Acknowledgements: This research was supported by grants from the Hewlett Foundation and the
Spencer Foundation. Any errors or omissions are the responsibility of the authors.
2
Abstract
The literature on effective schools emphasizes the importance of a quality teaching force
in improving educational outcomes for students. In this paper, we use value-added methods to
examine the relationship between a school’s effectiveness and the recruitment, assignment,
development and retention of its teachers. Our results reveal four key findings. First, we find
that more effective schools are able to attract and hire more effective teachers from other schools
when vacancies arise. Second, we find that more effective schools assign novice teachers to
students in a more equitable fashion. Third, we find that teachers who work in schools that were
more effective at raising achievement in a prior period improve more rapidly in a subsequent
period than do those in less effective schools. Finally, we find that more effective schools are
better able to retain higher-quality teachers. The results point to the importance of personnel, and
perhaps, school personnel practices, for improving student outcomes.
3
<A> Introduction
The literature on effective schools emphasizes the importance of a quality teaching force
in improving educational outcomes for students. The effect of teachers on student achievement is
well established. Quality teachers are one of the most important school-related factors found to
facilitate student learning (Nye, Konstantopoulos, and Hedges 2004; Rockoff 2004). Not all
schools are able to attract and retain the same caliber of teachers (Lankford, Loeb, and Wyckoff
2002). Teacher preferences for student characteristics and school location explain some of the
sorting (Boyd, Lankford, Loeb, and Wyckoff 2005; Hanushek, Kain, and Rivkin 2004; Scafidi,
Sjoquist, and Stinebrickner 2008); however, school personnel practices are also likely to play an
important role. Schools can control the quality of their teaching force through at least three
mechanisms: recruiting quality teachers, strategically retaining quality teachers (and removing
low-quality teachers) and developing the teachers already at their school. In addition, they can
allocate teachers more or less effectively across classrooms. In this paper, we examine the extent
to which more effective schools are better able to recruit, assign, develop, and retain effective
teachers and remove less effective teachers.
To examine the relationship between school effectiveness and teachers’ careers, we use
seven years of administrative data on all district staff and students in one of the largest public
school districts in the United States, Miami-Dade County Public Schools (M-DCPS). From these
data we generate measures of school and teacher value-added and use these two effectiveness
measures to better understand the importance of personnel practices. Our results reveal four key
findings. First, among teachers who switch schools, higher value-added elementary school
teachers transfer to schools with higher school-level value-added. Second, we find that more
effective schools provide more equitable class assignments to their novice teachers. Novice
4
teachers in more effective schools receive students with similar average prior achievement to
their colleagues, which is not the case in less effective schools. Third, we find that more
effective schools are better able to develop their teachers’ ability to raise student achievement.
Teachers’ value-added improves more between years when they work in schools that were more
effective in a prior period. Fourth and finally, we find that more effective schools are better able
to retain effective teachers. Teachers who are in the top quartile of teacher value-added are
substantially less likely to leave when employed in more effective schools than when employed
in less effective schools.
<A> Background
Although academic ability and family backgrounds of students are important
determinants of achievement, schools with similar student profiles can vary widely in the
learning gains of their students (Sammons, Hillman, and Mortimore 1995; Willms and
Raudenbush 1989). A huge body of research, often termed the Effective Schools Research, has
sought to understand why some schools are more effective than others (see Jansen 1995; Purkey
and Smith 1983 for examples of the many reviews). In this paper we define effective schools
similarly to much of this prior literature as schools in which students learn more than expected
given their background characteristics over the course of a school year (e.g., Mortimore 1991).
However, unlike much of the early Effective Schools research our study is based on an analysis
of a range of schools in a given geographic area, not solely based on case studies of more or less
effective schools. By using detailed and linked longitudinal data on students, teachers and
schools, we are able to build upon this earlier research on school effectiveness using more
5
rigorous statistical approaches to examine the extent to which personnel practices distinguish
more and less effective schools.
Quality teachers are one of the most important school-related factors found to facilitate
student learning, and likely explain at least some of the difference in effectiveness across schools
(Aaronson, Barrow, and Sander 2007; Kane, Rockoff, and Staiger 2008; Nye, Konstantopoulos,
and Hedges 2004; Rivkin, Hanushek, and Kain 2005; Rockoff 2004; Sanders and Rivers 1996).
Aaronson, Barrow, and Sander (2007) find that a one standard deviation improvement in math
teacher quality, as measured by the test score gains of their students, raises students’ math scores
by the equivalent of 0.13 grade equivalents per semester. Kane, Rockoff, and Staiger (2008) find
that the difference in effectiveness between the top and bottom quartile of elementary school
teachers leads to a 0.33 standard deviation difference in student test score gains in a school year.
For middle school teachers the standard deviation difference is about 0.20 standard deviations
(Kane, Rockoff, and Staiger 2008).
Teachers are clearly one of schools’ most important resources. Teachers are not,
however, randomly assigned to schools or students. Schools vary considerably in the types of
teachers they employ. Some of these differences are largely outside of a school’s control and due
to teachers’ preferences for certain types of students or for schools located in certain geographic
areas. Teacher preferences make it easier for some types of schools to attract candidates for open
positions (Boyd, Lankford, Loeb, Ronfeldt, and Wyckoff 2011) and easier for some types of
schools to retain their effective teachers because they are more appealing places to work.
Though the quality of a school’s teaching force is partially driven by teachers’
preferences for certain types of schools, it is also likely to be at least partially the result of school
policies and practices of school leaders. School leaders can control the quality of the teaching

6
force at their school by hiring high-quality teachers; by strategically retaining good teachers and
removing poor teachers; and by developing the teachers already at their school. Moreover, they
can maximize the effectiveness of their available teachers by assigning them to classes for which
they are best suited and through which provides the most benefit to their school. Schools are
likely to vary in their capacity to engage in each of these personnel practices. We know little
about the extent to which these practices are defining features of effective schools.
A first step in effective personnel practices is an ability to identify strengths and
weaknesses of teachers and teacher candidates. There is evidence that many school leaders can
distinguish highly effective teachers both during the hiring process and from among the teachers
currently employed at their school. While, Rockoff, Jacob, Kane, and Staiger (2008) point out
that information available on candidates at the time of hire may be limited making it difficult for
school administrators to recognize a good teacher when they are looking to hire one, Boyd,
Lankford, Loeb, Ronfeldt, and Wyckoff (forthcoming) find that, on average, school leaders are
able to recognize teacher effectiveness in the hiring process, especially when hiring teachers with
prior teaching experience. Feng and Sass (2011) also find evidence consistent with these
findings. In their study of Florida schools, they find that the most effective teachers tend to
transfer to schools whose faculties are in the top quartile of teacher quality (Feng and Sass 2011).
However, whether such schools are better at selecting quality teachers or if quality teachers are
attracted to such schools remains unclear. There is even stronger evidence that school
administrators can identify differences between the effectiveness of teachers currently working at
their school. Jacob and Lefgren (2008) find that principals can identify the teachers at their
school who are most and least effective at raising student achievement, though they have less
ability to distinguish between teachers in the middle of the quality distribution. Jacob (2010)
7
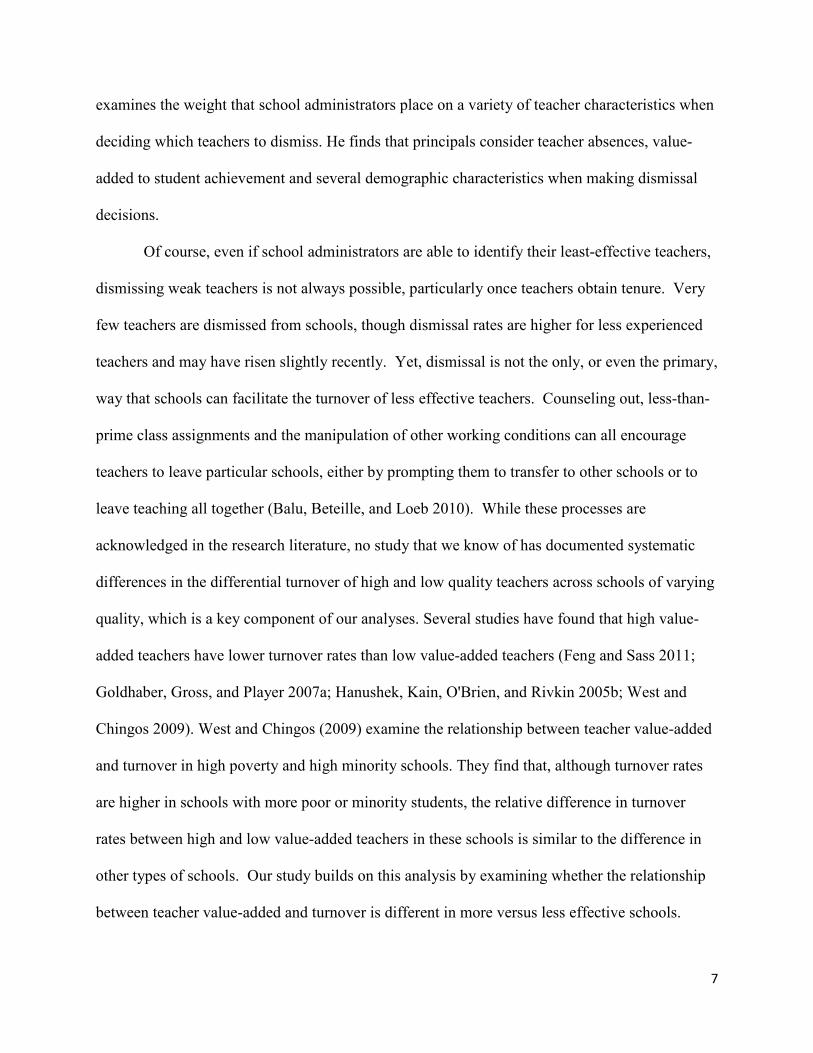
examines the weight that school administrators place on a variety of teacher characteristics when
deciding which teachers to dismiss. He finds that principals consider teacher absences, value-
added to student achievement and several demographic characteristics when making dismissal
decisions.
Of course, even if school administrators are able to identify their least-effective teachers,
dismissing weak teachers is not always possible, particularly once teachers obtain tenure. Very
few teachers are dismissed from schools, though dismissal rates are higher for less experienced
teachers and may have risen slightly recently. Yet, dismissal is not the only, or even the primary,
way that schools can facilitate the turnover of less effective teachers. Counseling out, less-than-
prime class assignments and the manipulation of other working conditions can all encourage
teachers to leave particular schools, either by prompting them to transfer to other schools or to
leave teaching all together (Balu, Beteille, and Loeb 2010). While these processes are
acknowledged in the research literature, no study that we know of has documented systematic
differences in the differential turnover of high and low quality teachers across schools of varying
quality, which is a key component of our analyses. Several studies have found that high value-
added teachers have lower turnover rates than low value-added teachers (Feng and Sass 2011;
Goldhaber, Gross, and Player 2007a; Hanushek, Kain, O'Brien, and Rivkin 2005b; West and
Chingos 2009). West and Chingos (2009) examine the relationship between teacher value-added
and turnover in high poverty and high minority schools. They find that, although turnover rates
are higher in schools with more poor or minority students, the relative difference in turnover
rates between high and low value-added teachers in these schools is similar to the difference in
other types of schools. Our study builds on this analysis by examining whether the relationship
between teacher value-added and turnover is different in more versus less effective schools.
8
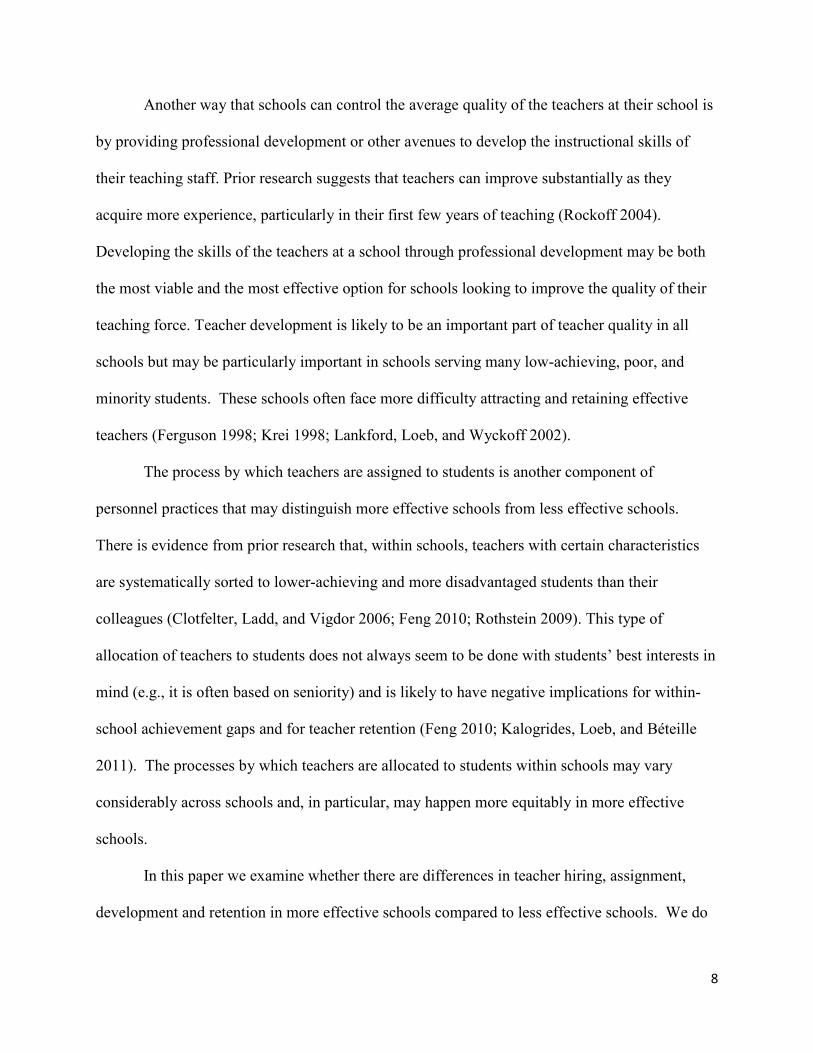
Another way that schools can control the average quality of the teachers at their school is
by providing professional development or other avenues to develop the instructional skills of
their teaching staff. Prior research suggests that teachers can improve substantially as they
acquire more experience, particularly in their first few years of teaching (Rockoff 2004).
Developing the skills of the teachers at a school through professional development may be both
the most viable and the most effective option for schools looking to improve the quality of their
teaching force. Teacher development is likely to be an important part of teacher quality in all
schools but may be particularly important in schools serving many low-achieving, poor, and
minority students. These schools often face more difficulty attracting and retaining effective
teachers (Ferguson 1998; Krei 1998; Lankford, Loeb, and Wyckoff 2002).
The process by which teachers are assigned to students is another component of
personnel practices that may distinguish more effective schools from less effective schools.
There is evidence from prior research that, within schools, teachers with certain characteristics
are systematically sorted to lower-achieving and more disadvantaged students than their
colleagues (Clotfelter, Ladd, and Vigdor 2006; Feng 2010; Rothstein 2009). This type of
allocation of teachers to students does not always seem to be done with students’ best interests in
mind (e.g., it is often based on seniority) and is likely to have negative implications for within-
school achievement gaps and for teacher retention (Feng 2010; Kalogrides, Loeb, and Béteille
2011). The processes by which teachers are allocated to students within schools may vary
considerably across schools and, in particular, may happen more equitably in more effective
schools.
In this paper we examine whether there are differences in teacher hiring, assignment,
development and retention in more effective schools compared to less effective schools. We do
9
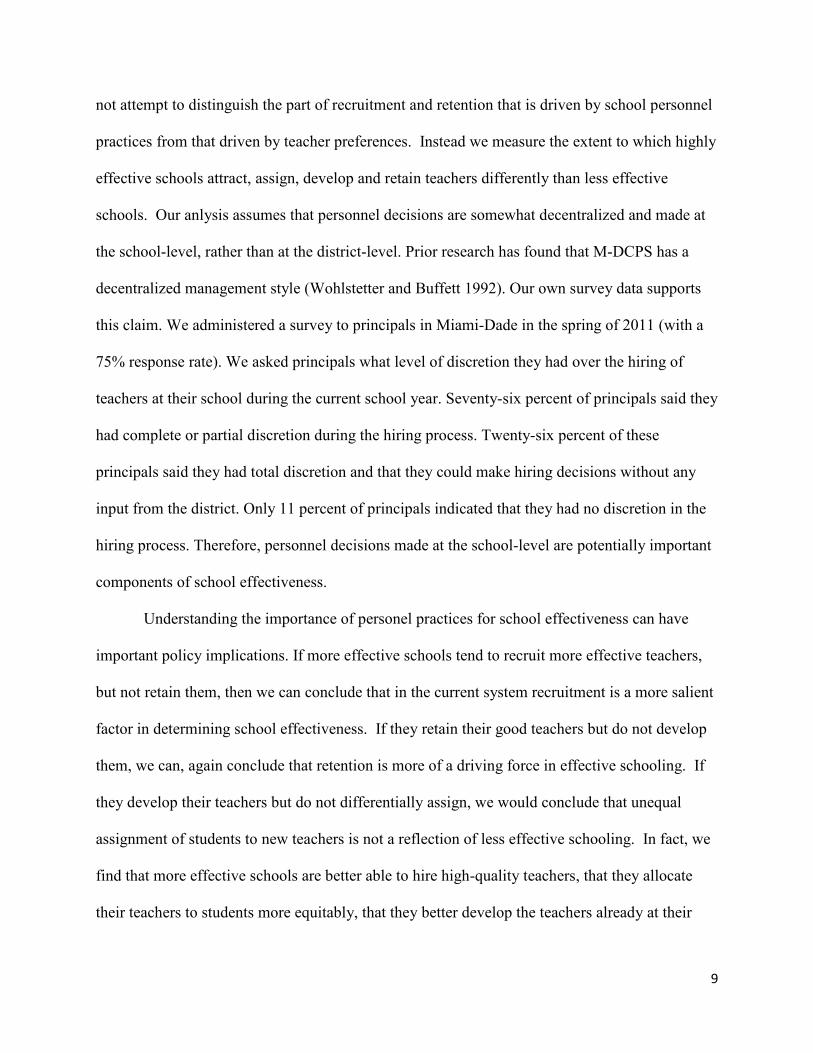
not attempt to distinguish the part of recruitment and retention that is driven by school personnel
practices from that driven by teacher preferences. Instead we measure the extent to which highly
effective schools attract, assign, develop and retain teachers differently than less effective
schools. Our anlysis assumes that personnel decisions are somewhat decentralized and made at
the school-level, rather than at the district-level. Prior research has found that M-DCPS has a
decentralized management style (Wohlstetter and Buffett 1992). Our own survey data supports
this claim. We administered a survey to principals in Miami-Dade in the spring of 2011 (with a
75% response rate). We asked principals what level of discretion they had over the hiring of
teachers at their school during the current school year. Seventy-six percent of principals said they
had complete or partial discretion during the hiring process. Twenty-six percent of these
principals said they had total discretion and that they could make hiring decisions without any
input from the district. Only 11 percent of principals indicated that they had no discretion in the
hiring process. Therefore, personnel decisions made at the school-level are potentially important
components of school effectiveness.
Understanding the importance of personel practices for school effectiveness can have
important policy implications. If more effective schools tend to recruit more effective teachers,
but not retain them, then we can conclude that in the current system recruitment is a more salient
factor in determining school effectiveness. If they retain their good teachers but do not develop
them, we can, again conclude that retention is more of a driving force in effective schooling. If
they develop their teachers but do not differentially assign, we would conclude that unequal
assignment of students to new teachers is not a reflection of less effective schooling. In fact, we
find that more effective schools are better able to hire high-quality teachers, that they allocate
their teachers to students more equitably, that they better develop the teachers already at their
10
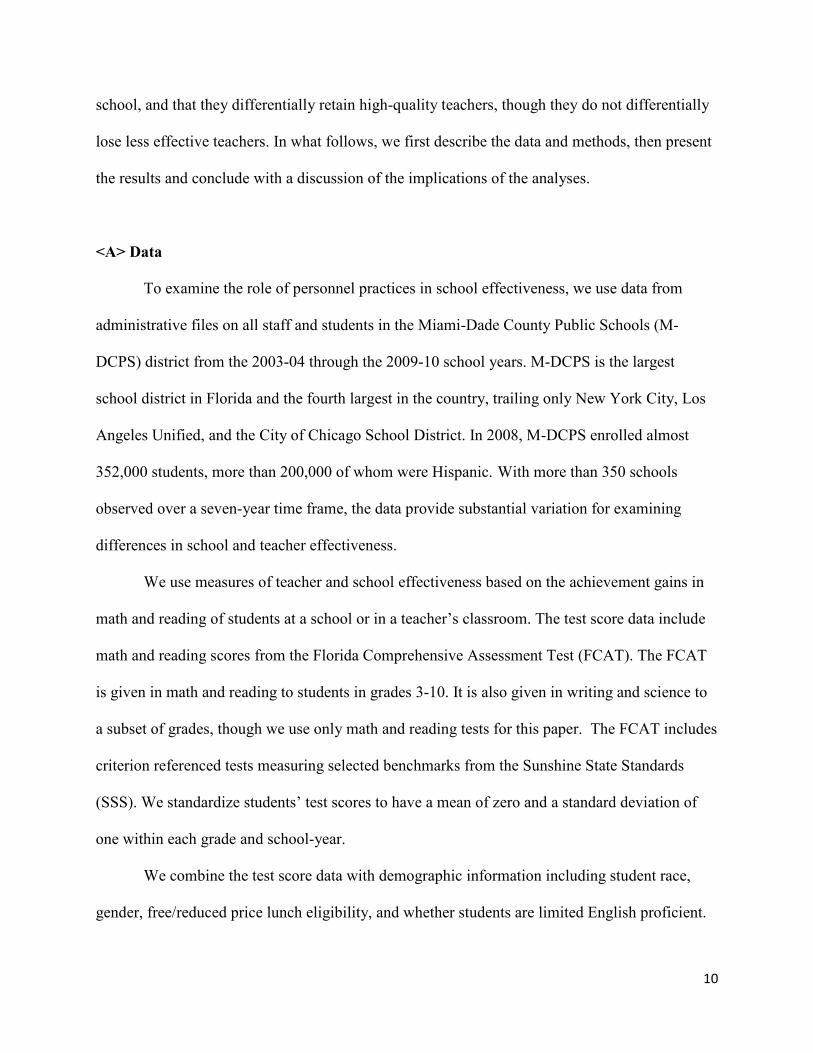
school, and that they differentially retain high-quality teachers, though they do not differentially
lose less effective teachers. In what follows, we first describe the data and methods, then present
the results and conclude with a discussion of the implications of the analyses.
<A> Data
To examine the role of personnel practices in school effectiveness, we use data from
administrative files on all staff and students in the Miami-Dade County Public Schools (M-
DCPS) district from the 2003-04 through the 2009-10 school years. M-DCPS is the largest
school district in Florida and the fourth largest in the country, trailing only New York City, Los
Angeles Unified, and the City of Chicago School District. In 2008, M-DCPS enrolled almost
352,000 students, more than 200,000 of whom were Hispanic. With more than 350 schools
observed over a seven-year time frame, the data provide substantial variation for examining
differences in school and teacher effectiveness.
We use measures of teacher and school effectiveness based on the achievement gains in
math and reading of students at a school or in a teacher’s classroom. The test score data include
math and reading scores from the Florida Comprehensive Assessment Test (FCAT). The FCAT
is given in math and reading to students in grades 3-10. It is also given in writing and science to
a subset of grades, though we use only math and reading tests for this paper. The FCAT includes
criterion referenced tests measuring selected benchmarks from the Sunshine State Standards
(SSS). We standardize students’ test scores to have a mean of zero and a standard deviation of
one within each grade and school-year.
We combine the test score data with demographic information including student race,
gender, free/reduced price lunch eligibility, and whether students are limited English proficient.
11
We also link students to their teachers via a database that lists the course title, classroom
identifier, and teacher of every course in which a student was enrolled in each year (including
elementary school students who simply have the same teacher and classroom listed for each
subject). We use the classroom identifier to generate classroom measures such as the percent of
minority students, the percent of students receiving free or reduced priced lunches, and average
student achievement in the prior school year. We obtain M-DCPS staff information from a
database that includes demographic measures, prior experience in the district, highest degree
earned, current position, and current school for all district staff.
Table 1 lists the means and standard deviations of all variables used in our analyses.
There are 351,888 unique tested students included in our estimation of value-added, each of
whom is included for an average of three years. Nearly 90 percent of students in the district are
black or Hispanic and more than 60 percent qualify for free or reduced-price lunches. We were
able to compute value-added estimates for about 10,000 teachers who taught students who were
tested in math and reading. These teachers average approximately eight years of experience in
the district; they are predominantly female (79 percent); and their racial composition is similar to
that of students in that the majority are Hispanic.
<A> Methods
<B> Estimating Value-Added
The goal of value-added models is to statistically isolate the contribution of schools or
teachers to student outcomes from all other factors that may influence outcomes (Meyer 1997;
Rubin, Stuart, and Zanutto 2004). Isolating causal effects is important given that differences in
student and family characteristics account for more of the variation in student outcomes than
12
school-related factors (Coleman 1990; Downey, Hippel, and Broh 2004) and that students are not
randomly assigned to teachers or schools (Lankford, Loeb, and Wyckoff 2002; Rothstein 2009).
A student’s achievement level in any given year is a cumulative function of current and
prior school, family, and neighborhood experiences. While researchers seldom have access to
complete information on all factors that would predict a student’s current achievement level
(Rivkin, Hanushek, and Kain 2005), much of the confounding influence of unobserved student
academic and family characteristics can be eliminated by focusing on gains in student
achievement over specific time periods, usually of one school year. The inclusion of prior
achievement as a way of controlling for prior student or family experiences reduces the potential
for unobserved factors to introduce bias in the estimation of teacher or school effectiveness. Yet,
there still may be unobservable differences between students that influence the amount they learn
each year in addition to their score at the beginning of the year. Factors such as innate ability,
motivation, familial support for education, or parental education could all have an impact on
student learning gains. We can control for some of these differences by including student-level
covariates in the model; however, the information available in administrative datasets such as
ours is limited. One way of controlling for all observed and unobserved student characteristics
that may be associated with achievement gains is to include a student fixed effect in the value-
added estimation. Such a specification is appealing because it allows for the examination of
differences in learning within the same student in years they are in a class with a different
teacher or in years they are in different schools.
Equation (1) describes our school value-added model which predicts the achievement
gain between year t-1 and year t for student i with teacher j in school s as a function of time-
13
varying student characteristics )( ijstsX , classroom characteristics )( jtC , time-varying school
characteristics, )( stS , student fixed effects )( iπ and a school by year fixed effect )( stδ .
ijststistjtijsttijsijst SCXAA εδπγηβ +++++=− − )1( (1)
The parameter reflects the contribution of a given school to growth in student achievement
after controlling for all observed time-varying student characteristics, observed and unobserved
time invariant student characteristics, and characteristics of students’ classrooms that may be
associated with learning. It captures all of the school-level factors that influence growth in
student achievement. Note that these models account for all unobserved time-invariant attributes
of students that may be associated with learning (via the student fixed effect), but not for
differences across schools in unobservable time-varying student characteristics that are
associated with learning. We use achievement gains as the outcomes in these models (rather
than current year achievement as the outcome with prior year achievement on the right-hand
side) because they include student fixed effects—therefore, these models show a school’s effect
on student achievement gains relative to students’ average gains in years they attend other
schools.
The model in Equation 1 is identified from students who attend multiple schools during
the observation period. Students may attend multiple schools for a variety of reasons including
residential relocation, expulsion, or transfers that result when students transition away from a
school after completing the final offered grade. Since we have seven years of test data and
students are tested in a wide range of grades (3-10), we observe over half of tested students (52
percent) in two or more schools. However, given concerns that this group of students may not be
representative of the full population of tested students, we compare the estimates derived from
Equation 1 with those derived from a similar model that excludes the student fixed effect and
14
uses students’ current year test score as the outcome with a control for their prior year test score
on the right hand side.1 Our school fixed effects estimates from these two specifications
correlate fairly highly at .81 in math and .52 in reading.2 In what follows, we present estimates
from models that use the measure of school value-added that is estimated with the student fixed
effect. However, in results not shown we also estimate all of our models using the measure of
school value-added that is estimated without a student fixed-effect. The results are substantively
similar.
We estimate teacher value-added using a similar model as described by Equation 1. We
replace the school by year fixed effect with a teacher by year fixed effect. In the teacher value-
added equation the parameter reflects the contribution of a given teacher to growth in student
achievement each year, conditional on the characteristics described above. It shows whether the
achievement gain for a given student is higher or lower the year they have a particular teacher
relative to their average gains from years they are in classes with other teachers. In addition to
the specification of teacher value-added with a student fixed effect and gain scores on the left-
hand side of the equation, we also generate measures of teacher value-added from two alternative
specifications: 1) a model that includes a school fixed effect (without a student fixed effect),
achievement in the current year as the outcome, achievement in the prior year on the right-hand
side, and all other parameters as discussed above for Equation 1; 2) a model that excludes
1 The student fixed-effects models identify school effectiveness by whether a given student has greater gains in that
school (controlling for time-varying student characteristics, classroom characteristics and school characteristics)
than that same student has when he or she attends a different school. The models without student fixed-effects
identify school effectiveness by whether a given student has greater gains in that school (controlling for student
characteristics, classroom characteristics and school characteristics) than an observably similar student does in a
different school. 2 There is no relationship between either measure of school value-added and school average test scores. In math, for
example, the correlation of school average math score with school value-added estimated without student fixed
effects is -.03 and with school value-added estimated with student fixed effects is .05. These correlations are not
statistically significant. The school value-added measures, therefore, are not picking up differences in average
achievement levels between schools.
15
student and school fixed effects, includes achievement in the current year as the outcome,
achievement in the prior year on the right-hand side, and all other parameters as discussed above
for Equation 1. We show the correlations among estimates from the alternative school and
teacher value-added specifications in Table 2. The three teacher value-added measures correlate
fairly highly in math (between .64-.94). The correlations are a bit lower for reading value-added,
especially for the models with student fixed effects. In the analysis presented below, we compare
the results using all three measures of teacher value-added.
The test scores used to generate the value-added estimates are the scaled scores from the
FCAT, standardized to have a mean of zero and a standard deviation of one for each grade in
each year. Subscripts for subjects are omitted for simplicity but we estimate Equation 1
separately for student achievement gains in math and reading. Gains in math and reading
attributed to teachers of self-contained elementary school classrooms for students in grades 5 and
below. For older students (who have multiple teachers), gains in math and reading are attributed
to math and English teachers. These teachers are identified from student course records, which
list the course title and instructor for each of a student’s courses in each year.
Since we use a lagged test score to construct our dependent variables (or as a control
variable on the right hand side in some specifications), the youngest tested grade (grade 3) and
the first year of data we have (2003) are omitted from the analyses though their information is
used to compute a learning gain in grade 4 and in 2004. The time-varying student characteristics
used in our analyses are whether the student qualifies for free or reduced priced lunch, whether
they are currently classified as limited English proficient, whether they are repeating the grade in
which they are currently enrolled, and the number of days they missed school in a given year due
to absence or suspension. Student race and gender are absorbed by the student fixed effect but
16
are included in models that exclude the student fixed effect. The class and school-level controls
used in the models include all of the student-level variables aggregated to the classroom and
school-levels.
After estimating Equation 1 we save the school by year and teacher by year fixed effects
and their corresponding standard errors. The estimated coefficients for these fixed effects include
measurement error as well as real differences in achievement gains associated with teachers or
schools. We therefore shrink the estimates using the empirical Bayes method to bring imprecise
estimates closer to the mean (see Appendix 1). There is greater imprecision in our estimates of
teacher value-added than school value-added since teachers’ class sizes are smaller than the total
school enrollment in a given year. The number of students per teacher varies meaningfully.
Teachers who teach small or few classes tend to have more imprecise estimates since their
estimates are based on fewer students. In addition to shrinking the estimates, we limit the sample
to teachers who have at least 10 students in a given year. Shrinking the school fixed effects tends
not to change the estimates very much given large samples in each school but does change the
teacher fixed effects measures somewhat. The correlation between our original school by year
fixed effect estimate and the shrunken estimate is about .99 for both math and reading. The
correlation between our original teacher by year estimate and the shrunken estimate is .84 for
math and .81 for reading for the teacher value-added estimates that include a student fixed effect.
After shrinking the value-added estimates, we standardize them to have a mean of 0 and a
standard deviation of 1 in each year to facilitate interpretation.3
3 School value-added fluctuates somewhat over time but there are fairly high correlations within schools between
current and prior year value-added. In versions of school value-added that are estimated without student fixed
effects, the correlation between current year value-added and prior year value-added is .50 in both math and reading.
In versions of school value-added that are estimated with student fixed effects, the correlation between current year
value-added and prior year value-added is .73 in reading and .82 in math. Variation in school value-added over time
could be due to a variety of factors, such as changes to the leadership or changes to the faculty composition.
However, we do not examine what contributes to these changes over time.
17
Teacher and school value-added as measured by student achievement gains on state tests
are clearly not perfect measures of effectiveness. While measuring effectiveness by how much
students learn makes sense if we care about student learning, current test scores are a limited
measure of students’ learning outcomes that we care about. This is especially true at the
secondary school level where outcomes such as graduation rates and college preparedness may
also be important measures of school effectiveness.4 There also may be bias in attributing student
test score gains to teachers even though our measures adjust for a rich set of student and
classroom characteristics. On the positive side, recent research has demonstrated that higher
value-added teachers, as measured in ways similar to those employed here, tend to exhibit
stronger classroom practices as measured by observational protocol such at the Classroom
Assessment Scoring System (CLASS) (La Paro, Pianta, and Stuhlman 2004) and Protocol for
Language Arts Teaching Observation (PLATO) (Grossman, Loeb, Cohen, Hammerness,
Wyckoff, Boyd, and Lankford 2010). Nonetheless, there is clearly measurement error in our
estimates of teacher effectiveness and there may be bias as some teachers teach a higher
proportion of students with negative shocks to their learning in that year and some teachers likely
teach relatively better in areas not covered as well by the standardized tests.
<B> Teacher Recruitment, Assignment, Development and Retention
We ask four questions in this study. First, to what extent do more effective schools hire
more effective teachers when vacancies arise? Second, do more effective schools handle teacher
class assignments more equitably than less effective schools? Third, do teachers improve in
effectiveness more rapidly when they work in more effective schools? And, finally, to what
4 We do not have data on these types of non-test score outcomes so cannot evaluate school effectiveness based on
these measures. However, to the extent that students who learn more in high school are better prepared for college
and are more likely to graduate from high school, evaluating secondary schools based on student learning gains
remains a relevant endeavor.
18
extent do more effective schools retain more effective teachers and remove less effective
teachers?
<C> Recruitment and Hiring: Effective schools may hire more effective teachers when
vacancies arise. In order to examine this issue, we ask whether more effective teachers transfer to
more effective schools. We are unable to examine whether more effective schools hire higher-
quality new teachers because our measure of effectiveness cannot be computed for teachers who
have not taught students in a tested subject for at least one year. Therefore, this analysis is
restricted to teachers who transfer in the following year and for whom we have value-added
measures in the year before they switch schools.5 In particular, we ask whether the teachers who
transfer to more effective schools had higher value-added (in the year before they transfer) than
teachers who transfer to less effective schools.
The following equations describe the models:
jgxstgtxtjgxst SETE εππβα ++++= )(1 (2a)
jgxstgtjxstxtjgxst TSETE εππββα +++++= 21 )( (2b)
jgxstgtstjxstxtjgxst STSETE εππβββα ++++++= 321 )( (2c)
jgxstgtxtstjxstxtjgxst SSTSETE εππββββα +++++++= 4321 )( (2d)
In the base model, Equation 2a, the effectiveness (TE) in year t of teacher j who worked in
school s in time t and transferred to school x in time t+1 is a function of the effectiveness of the
school he or she transferred to (SE) measured in year t, as well as year )( tπ and grade )( gπ
indicators. For example, suppose we observe a teacher in school s in 2006. In 2007 the teacher is
5 Teachers who transfer are systematically different in many ways than those who never transfer during our sample
period. They tend to have more experience (8.6 vs. 7.5 years), are less likely to be Hispanic (39 percent vs. 45
percent), are a bit older (42 vs. 40 years), and are less likely to hold a masters' degree (36 percent vs. 40 percent).
Teachers who transfer also have lower value-added in math and reading compared to teachers who stay in the same
school.
19
observed in school x. In this case the teacher’s value-added in 2006 is the outcome and the value-
added in 2006 of school x is the predictor. The coefficient on SE measures whether more
effective schools differentially attract more effective teachers. We cluster the standard errors by
the level of the hiring school, since school value-added is measured at that level. Since teacher
value-added is the outcome variable in these analyses, we use the raw (standardized) fixed
effects for teachers in this analysis as opposed to the shrunk estimates. Using the empirical Bayes
shrinkage to account for measurement error in the teacher fixed effects is only necessary for
unbiased estimates when these measures are used on the right-hand side of our equations, though
the results are similar when using either method. We estimate these models pooled by grade level
and separately by grade level.
While Equation 2a answers the research question, we are interested in exploring a
number of explanations for the observed relationship, β1. Equations 2b-2d describe this
exploration. First we introduce other teacher characteristics (T) including experience, highest
degree earned, age, race, and gender. This model (2b) asks whether the relationship between
teacher and school effectiveness is explained by other observable teacher characteristics that
these more effective schools might base hiring on. Next we add in additional controls for the
characteristics of the hiring school (Sx). The model (2c) asks whether the relationship between
teacher and school effectiveness is driven by other characteristics of the hiring school that might
attract teacher such as size or student characteristics, instead of effectiveness. More and less
effective schools may differ in the number of vacancies they have each year. This could induce a
correlation between teacher and school effectiveness even if both types of schools select the most
competent applicants from the same population, since less effective schools would have to go
further down the effectiveness distribution to fill all openings. To adjust for this possibility,
20
model 2c includes a control variable for the number of first-year transfer teachers working at the
school in a given year. This is the number of teachers at a school who taught at a different school
in the district in the prior year.
The final model (2d) adds in controls for the school in which the teacher taught the year
before their transfer (Ss). This inclusion helps to uncover whether more effective schools are
hiring teachers from specific kinds of schools, particularly those that produce high value-added
transferring teachers. It may be, for example, that the hiring school does not have a good
estimate of the value-added of each teacher but judges them based on the school from which they
came and, in that way is able to identify more effective teachers.
While models 2b-2c provide suggestive evidence on some of the mechanisms behind the
univariate relationship between school value-added and the value-added of transfers, we do not
have data on applications and offers and, thus, we are not able to discern whether more effective
schools hire more effective transferring teachers because more effective teachers apply to more
effective schools or because more effective schools are better able to identify the most effective
teachers out of their pool of applications.
<C> Novice Teacher Assignments: Our second research question is whether novice
teachers receive different types of class assignments when they work in more effective schools.
The following equation describes the model:
itsgstgitsgitsgstitsgitsg TNoviceXSENoviceY επββββ +++++= 3210 )()( (3)
We predict a class characteristic for teacher i in year t in school s and in grade g, itsgY , as a
function of whether the teacher is a first or second year teacher (which is our definition of a
novice teacher); teacher background measures (race, gender, age, and highest degree earned),

21
itsgT , an interaction between school effectiveness and the novice teacher indicator; and a school
by year by grade fixed effect, stgπ .
The estimate 1β shows the difference in the attributes of the students assigned to novice
versus more experienced teachers in schools that are of average effectiveness (i.e., where school
effectiveness is 0). The estimate 2β shows whether the magnitude of this relationship varies by
school effectiveness. Our inclusion of the school by year by grade fixed effect means that our
estimates reflect differences in class assignments for teachers of varying experience or
demographic characteristics teaching the same grade and in the same school in the same year.
The main effect on school value-added is absorbed by the school by year by grade fixed effect.
Our outcomes include the average prior achievement of teachers’ current students in math and
reading and the proportion of teachers’ current students scoring in the highest and lowest FCAT
proficiency levels in the prior year in math and reading. We conduct these analyses separately by
school level since there may be more opportunities for teacher sorting at the middle/high school
grades than at the elementary school grades due to curricular differentiation. We also exclude
special education teachers from these models since they have lower scoring students in their
classes and the assignment process likely works differently for these types of teachers.
<C> Teacher Development: Our third set of models tests whether the value-added of
teachers changes more across years when they are in an effective school. To examine this we test
whether teachers’ value-added changes more between years when they are employed at a school
that was more effective in a prior period. We regress teacher value-added in the current year on
teacher value-added in the prior year and school value-added measured two years prior. We use a
two year lag of the school’s value added so that school and teacher effectiveness are not
estimated from the same test score data. For example, suppose the outcome (teacher value-
22
added) is measured in 2008: 2007 and 2008 test data are used to compute teacher value-added in
2008; 2006 and 2007 data are used to compute prior year’s (2007) teacher value-added; and 2005
and 2006 data are used to compute school value-added two years ago (2006). Although school
value-added fluctuates over time either due to real changes in school performance or to
measurement error, the correlation between current and prior year school value-added is between
.65 and .80 as is the correlation between current year and twice lagged school value-added. Since
we control for the lag of teacher value-added, the coefficients on the other variables in the model
indicate change in their value-added as a function of a covariate. All specifications control for
school year, grade taught, and teacher experience which is entered as dummy variables. We
control for grade taught since students may exhibit lower learning gains in some grades than in
others and control for teacher experience since prior studies suggest that the rate at which
teachers improve tends to flatten after their first few years of teaching.
The model is shown by the following equation which predicts the effectiveness of a
teacher as a function of the school’s prior effectiveness:
jgmtgtjgmttmtjgmjgmt TSETETE εππβββα ++++++= −− 3)2(2)1(1 )exp()()( (4)
Where jgmtTE is teacher effectiveness in subject m in the current year, )1( −tjgmTE is teacher
effectiveness in the prior year, )2( −tmSE is school effectiveness two years ago, Texp are dummy
variables for teacher experience and tπ and gπ are year and grade fixed effects. We estimate this
model for all teachers regardless of whether they changed schools since the year prior but also
compare these estimates to those from a model restricted to teachers who remain in the same
school and find similar results.
One worry with the model described in equation 4 is that measurement error in prior year
teacher effectiveness biases the estimation. Shrinking the estimates accounts for sampling error
23
but there could be other types of error in this particular analysis that we may need to worry about
– error that comes from factors that produce variation in teacher effectiveness from year to year
such as a barking dog when students are taking the test. In particular, consider two teachers with
equal value-added in a given year. The teacher in the better school may normally be a better
teacher and thus has a tendency to revert back to his or her higher average, while a teacher in a
less effective year may normally be a worse teacher and similarly reverts back to his or her lower
average value-added. This would be a classic case of mean reversion and would upwardly bias
our estimate of the relationship between school effectiveness and growth in teacher
effectiveness. To adjust for this error, we instrument for prior year value-added in a given
subject using prior year value-added in the other subject. That is, in analyses that examine
changes to math value-added, we instrument for prior math value-added using prior reading
value-added and vice versa. These analyses are necessarily restricted to elementary school
teachers who have classes with students tested in both subjects. We present the IV estimates
along with the OLS estimates in the results section—both methods produce similar results.
<C> Retention: Fourth and finally, we examine the association between teacher turnover,
teacher effectiveness, and school effectiveness using logit models to predict whether a teacher
leaves his or her school at the end of a year as a function of school value-added, teacher value-
added and the interaction between the two. Here we are asking whether more effective teachers
are differentially more likely to leave (or stay at) more effective schools. Equation 5 describes
the model:
jstsjststststjstjst
f
f
ist
TEXSESESTETf
where
e
eY
επβββββ ++++++=
+==
)(
1)1Pr(
54321
(5)
24
The outcome Y is the probability that teacher j in school s in time t will not return to their
school in time t+1 and is estimated as a function of the teacher's own characteristics not
including effectiveness (T), his or her effectiveness (TE), the school's characteristics (S), the
school’s effectiveness (SE), and the interaction between the school’s and the teacher's
effectiveness. The model also includes school fixed effects so that comparisons of turnover rates
are made among teachers who vary in effectiveness at the same school. The coefficient on the
interaction in this model, β5, tells us whether there are differential career paths for teachers of
varying effectiveness as a function of the school’s effectiveness. We cluster the standard errors
in these models at the school level since the observations are not independent.
In addition to using continuous measures of school and teacher value-added, we also
estimate models that use quartiles of these measures. Prior research suggests that principals have
difficulty distinguishing among teachers at their school who are in the middle of the quality
distribution but that they are able to distinguish between those at the top and bottom in terms of
effectiveness (Jacob and Lefgren 2008). If principals are to target their retention efforts on
particular teachers, then they must be able to distinguish among the best and worst teachers at
their school. We therefore generate quartiles of teacher value-added (within each school) and
include dummy variables flagging teachers in the top and bottom quartiles. For this analysis we
also use a measure that distinguishes schools that are in the top quartile of school value-added
(generated within each year and school-level) instead of using the continuous measure.
Since teacher and school value-added are each measured separately in each year, these
estimates tell us whether schools that were more effective in one year are better able to keep their
more effective teachers and remove their less effective teachers the following year. Our use of
measures of value-added that vary by year is important for our estimation strategy. Though
25
pooling value-added measures across years may be preferable given small samples for some
teachers and measurement error in tests (McCaffrey, Sass, Lockwood, and Mihaly 2009), in our
case this makes the causal ordering of these measures ambiguous. In the teacher turnover
analyses, for example, we want to test whether more effective schools are able to keep good
teachers and remove ineffective ones. We also want to be able to rule out an alternative
explanation (of a reversal in causal ordering) that schools look like they have higher value-added
only because they happened to have particularly good teachers. For example, if we estimated
school value-added in the year after less-effective teachers left and more effective teachers
stayed, the school would look more effective regardless of its practices in the prior years that led
to this differential turnover. While the year-by-year measures of school and teacher
effectiveness are less precise than measures averaged over all years, the value-added based on
prior years allows us to examine how school effectiveness in a given period influences teacher
turnover behavior in a subsequent period and helps us avoid the problems described above. 6
<A> Results
<B> Recruitment and Hiring
More effective schools may hire higher value-added teachers when vacancies arise. This
differential hiring may be driven by pro-active recruitment efforts by such schools, better ability
to distinguish among job candidates, or by teachers' preferences for more effective schools.
While we can't separate the possible mechanisms, Table 3 shows some evidence of differential
6 There is some concern in the value-added literature about issues with non-persistent teacher effects (McCaffrey,
Sass, Lockwood, and Mihaly 2009). McCaffrey et al. (2009), for example, find that between 30-60 percent of the
variation in measured teacher effectiveness is due to “noise” in student test scores rather than to real differences
between teachers. The proposed solution is to either average teacher effects over multiple years or to take teacher by
year fixed effects and estimate the true signal variance by the covariance of these effects across years. However, this
method will not work in our case. For the analyses described below we require measures of value-added for teachers
and schools that are estimated separately in each year to avoid problems such as circularity and reverse causation.

26
hiring among elementary school teachers. In these models we take all teachers who transfer and
regress the value-added of the teacher who transfers (measured in the year prior to their transfer)
on the effectiveness of the school to which they transfer (measured in the year prior to the
teacher’s transfer). We estimate each of these models for the version of teacher value-added that
include and exclude student fixed effects. We do not show estimates using the version of teacher
value-added that includes school fixed effects because we are not interested in comparing
teachers in the same school for these analyses.
The coefficients are positive across all specifications for elementary school teachers
suggesting that higher value-added teachers tend to transfer to more effective schools. The
estimates, however, lack precision given the limited number of transferring teachers we observe
for whom we are also able to estimate value-added. The magnitudes of the coefficients change
little across models with the introduction of additional teacher and school-level control variables.
This suggests that teacher effectiveness is not associated with other teacher characteristics that
more effective schools look for when hiring (e.g., teacher experience) and that observable school
characteristics that might influence teachers’ transfer decisions bear little association with school
value-added.
Taken together, these findings provide some evidence that more effective elementary
school teachers tend to move to more effective schools, though we cannot discern whether this
results from differential personnel practices or from teachers’ preferences for more effective
schools. There is no evidence that more effective middle and high schools hire higher value-
added transferring teachers. Value-added may be harder to observe among teachers at this level
since only a subset of teachers provide instruction in tested subjects and since the learning gains
of older students are likely to be smaller.
27
<B> Novice Teacher Assignments
Table 4 describes variation in novice teachers’ class assignments by school effectiveness
separately by school-level. We show the results using both current school value-added to predict
class assignments and prior year school value-added, in case current effectiveness is influenced
by the distribution of teachers to students. The results are largely the same in direction and
magnitude.
The table shows consistent evidence that novice teachers are assigned lower achieving
students than their colleagues across all types of schools. However, the magnitudes of these
relationships are weaker in more effective schools—especially among elementary school
teachers. For example, the main effect on novice teacher in the first column under the first panel
shows that novice teachers are assigned students whose average prior achievement in math is .05
standard deviations lower than the average prior achievement of their more experienced
colleagues at their school (in schools at the mean of effectiveness). The interaction between
novice teacher and school value-added in this model is a positive .04 suggesting that the effect is
only about a quarter as large in schools that are one standard deviation above the mean of school
value-added. For elementary school teachers, the results are similar for the average prior reading
achievement of teachers’ students as well as for the percentage of teachers’ students who scored
at the highest and lowest proficiency level on the FCAT in the prior year.7 For middle/high
school teachers, the coefficients on the interaction terms are smaller in size but are in the
expected directions. The size of these differences is relatively large. The within school-grade-
year standard deviation in average classroom prior math achievement is about .50 in both
7 One factor that could influence the extent to which schools assign novice teachers to lower achieving students is
the standard deviation of achievement within schools. We found only a very weak relationship between school
value-added and the standard deviation of math achievement. The correlations are -.04 in elementary schools and
-.10 in high schools.
28
elementary school and middle/high school. Therefore, the first column and row of Table 4 shows
that novice teachers’ classrooms are one-tenth of a standard deviation lower achieving in math
than the classrooms of their more experienced colleagues.
To more easily see these results, we plot the estimates in Figure 1. The model on which
the figure is based includes the average prior math achievement of teachers’ current students as
the outcome. The estimates that are graphed show the novice-non novice teacher gap in the prior
average math achievement of their assigned students by school value-added. In elementary
schools two standard deviations below the mean of school value-added, novice teachers are
assigned students whose average prior math achievement is about .12 standard deviations lower
than the average prior achievement of their colleagues’ students. In elementary schools two
standard deviations above the mean of school value-added, novice teachers are assigned students
whose average prior math achievement is similar, if not slightly higher, than the average prior
achievement of their colleagues’ students. The trend is similar among middle/high school
teachers though the slope of line is not as steep. These results provide clear and consistent
evidence that more equitable assignments for novice teachers distinguishes effective elementary
schools from less effective elementary schools, though the assignment of lower achieving
students to novice teachers happens to a similar extent in more and less effective middle/high
schools.
<B> Teacher Development
Next, we investigate whether teachers improve their ability to raise student achievement
more rapidly when working in effective schools. We restrict these analyses to teachers who have
been employed in the district for five years or fewer. Prior research suggests that teachers’ ability
to raise student achievement increases considerably over the first few years in the teaching
29
profession but remains relatively stable thereafter. (Clotfelter, Ladd, and Vigdor 2006; Rivkin,
Hanushek, and Kain 2005). The potential for school processes to influence teachers’
effectiveness, therefore, is greater during the first few years of teaching experience. In Table 5
we examine the relationship between the change in teacher value-added between the current and
prior year and the school’s effectiveness two years ago. The reason we measure school value-
added two years ago is that we worry that if we used concurrent value-added the effects might be
circular since the teacher’s value-added in the prior year is also in the model and the teacher and
school measures were estimated on the same data. We use measures of teacher value-added that
are estimated with and without student fixed effects. We exclude the version of teacher value-
added estimated using school fixed effects because in these analyses we are not interested in
comparing teachers within the same school but, rather, teachers who teach in different schools
(i.e., more and less effective schools). We present both OLS estimates (in the first four columns
of Table 5) and the IV estimates (in the final four columns of Table 5).
Both the OLS and IV estimates show a fairly consistent relationship between school
effectiveness and teacher improvement in math value-added. The estimates are positive and
significant for reading value-added when we use the version of teacher value-added that includes
student fixed effects but are about 0 and not significant in the version of teacher value-added that
excludes student fixed effects. When we look at the IV estimates for the version of teacher value-
added estimated with student fixed effects (bottom panel of Table 4), we find that a one standard
deviation increase school value-added (measured 2 years ago) is associated with a .08-.10 greater
increase in teacher value-added over a one year period. The size of these estimates is fairly
large—an increase in teacher value-added of .10 is about the average improvement experienced
30
by teachers from their first to second years.8 Therefore, working in a more effective school
improves teachers’ ability to raise student achievement by a similar amount as gaining an extra
year of experience early in their career. These results are consistent when we restrict the models
to teachers who taught at the same school in the years in which we measure change in their
value-added.
<B> Retention
Finally, we examine whether more effective schools are better able to retain their best
teachers and remove their least effective teachers. In Table 6 we show results from logistic
regression models that predict whether a teacher leaves their school at the end of the year as a
function of their own value-added, their school value-added, and the interaction between the two.
All models include controls for teacher and school characteristics and school fixed effects. We
control for teacher and school characteristics to adjust for factors that might be associated with
teacher turnover and teacher effectiveness. We include the school fixed effect so our
comparisons are made only among teachers who vary in effectiveness within schools. Note that
the main effects on school value-added (not shown) are identified from within school variation
(over time) in value-added but that interactions between school and teacher value-added are
identified from both within and between school variation in value-added since teacher value-
added varies within school-years. Both school and teacher value-added have been standardized
to have a mean of 0 and a standard deviation of 1 within each school year. We restrict these
analyses to teachers who have been employed in the district for five years or fewer. Rates of
transfer and attrition from the district are more than twice as large for less experienced teachers
8 The difference in effectiveness between first and second year teachers was estimated by predicting teacher value-
added as a function of indicators for teacher experience, year and grade dummies, and a teacher fixed effect (for
elementary school teachers). The size of this estimate is similar in math and reading and for different ways of
specifying the value-added equation.
31
relative to older and more experienced teachers. The latter set of teachers is much less likely to
leave their school or the district.9 In addition to using continuous measures of value-added, we
also break these measures into quartiles and examine the retention of low (bottom quartile) and
high (top quartile) teachers in the most effective schools (top quartile). As with the previous
analyses, we show these results using three different measures of teacher value-added. The first
3 columns of the table show odds ratios and t-statistics while the last 3 columns show the
marginal differences in probabilities and their corresponding standard errors.
The models that use the continuous measures of math value-added suggest that teachers
who are more effective at raising math achievement are less likely to leave their school, which is
consistent with prior research (Boyd, Grossman, Lankford, Loeb, and Wyckoff 2008; Goldhaber,
Gross, and Player 2007b; Hanushek, Kain, O'Brien, and Rivkin 2005a). For example, the main
effect on teacher value-added in the first column suggests that a one standard deviation increase
in teacher math value-added is associated with a 20 percent decline in the odds of leaving one’s
current school (in schools that are of average effectiveness). This corresponds to a .03 decline in
the probability of leaving, from a baseline probability of .18. While the overall probability that a
teacher leaves their current school at the end of the year is .18, it is only .15 among teachers one
standard deviation above the mean of value-added.
The table also shows that the likelihood that more effective teachers leave their school is
even lower when they work in more effective schools—i.e., the school-by-teacher value-added
interactions are all negative and statistically significant for math. Each standard deviation
increase in school value-added further reduces the probability that higher value-added teachers
leave their school by about 1 percent. For example, a one standard deviation increase in teacher
9 The findings discussed here are similar in direction when all teachers are included (i.e., experienced and novice)
but smaller in magnitude and generally not statistically significant.
32
value-added reduces the probability of leaving by about 3 percent in schools of average
effectiveness but decreases the probability of leaving by about 4 percent in schools that are one
standard deviation above the mean of effectiveness. The interactions are also negative for
reading value-added but are not statistically significant. These findings hold across all three
methods of computing teacher value-added. The results are similar when we break teacher value-
added up into quartiles. Here we find that the most effective schools (top quartile) are better able
to keep their best (top quartile) teachers. They are not, however, differentially able to remove
their least effective (bottom quartile) teachers. Using quartile measures, model 1 for math shows
that teachers in the top quartile of value-added that work in schools in the top quartile of school
value-added are 6 percent less likely to leave than top quartile teachers who work in less
effective schools. These results hold across all versions of teacher value-added for math and are
in the expected direction but not statistically significant for reading.10
In Figure 2 we graph the regression equation using continuous measures of teacher and
school value-added in math using the estimates from column 6 in Table 6. We show the
relationship between school value-added and the probability that a teacher leaves their school at
the end of the year for teachers at different levels of effectiveness. All other covariates are set to
their sample means. The probability that low value-added teachers (those 2 standard deviations
below the mean) leave their school is about .18 when they work at a low value-added school
(those 2 standard deviations below the mean) but is about .27 when they work in a high value-
added school (those 2 standard deviations above the mean). On the other hand, the probability
that a high value-added teacher leaves their school at the end of the year is about .15 when they
work in a low value-added school and is about .11 when they work at a high value-added school.
10
In results not shown, we conduct these analyses separately for elementary school teachers and middle/high school
teachers. The results are similar for both groups of teachers so we only present the pooled estimates here.
33
<A> Discussion
Not surprisingly, teachers in more effective schools demonstrate more positive career
trajectories. The results presented above have shown that teachers in high value-added schools
improve more rapidly from year to year. On average, in schools that are one standard deviation
more effective, teachers’ value-added increases by up to 10 percent of a standard deviation more
in a given year, though these results vary by specification. Effective schools also differentially
retain more effective teachers. The odds that a teacher who is in the top quartile of effectiveness
will leave in a given year is 30 to 40 percent lower in top quartile school, though we do not find
differential attrition of the least effective teachers relative to teachers demonstrating average
value-added in more effective schools. More effective schools also assign teachers to students
more equitably. While novice teachers systematically teach students with lower entering test
scores than their more senior colleagues, these relationships are approximately half as large in
schools that are one standard deviation more effective. The analyses provide some evidence that
schools are able to attract more effective teachers when teachers transfer across schools, though
these results are not consistent.
Two caveats are warranted in interpreting these results. First, the results we found, while
in the same direction when effectiveness is defined in terms of value added to students’ reading
achievement as they are when value-added is defined by math achievement, the results for
reading are not as consistently statistically different from zero. This is not the first study to find
clearer effects for mathematics than for English language arts, however, the difference is still
worth noting.
The second caveat is that we have not attempted to identify the cause of the patterns we
observe. While the more equitable assignment of teachers to classrooms is likely to be the result

34
of school practices, we do not know whether these practices are driven by teachers or by the
school leadership. The differential hiring of more effective transferring teachers might not even
be driven by school practices. Teachers may be attracted to these schools because they are more
effective. Similarly, less effective teachers may choose to leave these more effective schools not
because they are encouraged to leave but because they feel out of place.
Nonetheless, while we cannot definitely attribute the patterns of recruitment, assignment,
development and retention to school leadership, the results suggest that school leadership and
particular school personnel practices may be a driving force in effective schooling. Not only are
school leaders responsible for personnel practices, but recent prior work has highlighted the
importance of personnel practices and other organizational management practices for
distinguishing (if not causing) effective schools (Grissom and Loeb Forthcoming; Horng, Klasik,
and Loeb 2010). This hypothesis is also consistent with the traditional Effective Schools research
which emphasizes the importance of school leadership (Sammons, Hillman, and Mortimore
1995). The results, moreover, are not surprising. Teachers strongly affect students’ educational
opportunities. Higher performing schools seem better able to build a staff of strong teachers
through differential retention of good teachers, through recruitment and hiring, and through
providing supports for teacher improvement. This paper provides some empirical evidence that
more effective schools are doing all three. In addition, these schools appear to use their teaching
resources more efficiently, not assigning new teachers to lower performing students.
A slew of other papers have shown that teachers matter for student learning gains;
however, the results of this study are novel in drawing attention to the multiple processes that
together affect teachers and teaching – particularly teacher improvement, teacher retention, and
effective use of teachers within the school. Improving teaching is not only about getting the best
35
teachers in the school, nor only about keeping the better teachers once teaching – though the
differential in the retention of more effective teachers between more and less effective schools is
large. These retention dynamics are a feature of effective schools but so are the supports that
lead to teacher improvement and so are the effective use of resources as illustrated by the more
equitable assignment of teachers to students. This paper provides little direct insights into the
practices associated with the observed relationships between personnel dynamics and student
learning; that is for further work. It does suggest that this area would be a productive avenue both
for expanding understanding of effective schooling and for school improvement itself.
36
<A> References
Aaronson, Daniel, Lisa Barrow, and William Sander. 2007. "Teachers and Student Achievement
in Chicago Public High Schools." Journal of Labor Economics 25:95-135.
Balu, Rekha, Tara Beteille, and Susanna Loeb. 2010. "Examining Teacher Turnover: The Role
of School Leadership." Politique Americaine 15:55-79.
Boyd, Donald, Pam Grossman, Hamilton Lankford, Susanna Loeb, and James Wyckoff. 2008.
"Who Leaves? Teacher Attrition and Student Achievement." National Bureau of
Economic Research, Working Paper 14022: http://www.nber.org/papers/w14022.pdf,
Cambridge, MA.
Boyd, Donald, Hamilton Lankford, Susanna Loeb, Matthew Ronfeldt, and James Wyckoff. 2011.
"The Role of Teacher Quality in Retention and Hiring: Using Applications-to-Transfer to
Uncover Preferences of Teachers and Schools." Journal of Policy Analysis and
Management 30:88-110.
Boyd, Donald, Hamilton Lankford, Susanna Loeb, Matthew Ronfeldt, and James Wyckoff.
forthcoming. "The Role of Teacher Quality in Retention and Hiring: Using Applications-
to-Transfer to Uncover Preferences of Teachers and Schools." Journal of Policy Analysis
and Management.
Boyd, Donald, Hamilton Lankford, Susanna Loeb, and James Wyckoff. 2005. "The Draw of
Home: How Teachers' Preferences for Proximity Disadvantage Urban Schools." Journal
of Policy Analysis and Management 24:113-132.
Clotfelter, Charles T., Helen Ladd, and Jacob L. Vigdor. 2006. "Teacher-Student Matching and
the Assessment of Teacher Effectiveness." Journal of Human Resources 41:778-820.
37
Coleman, James S. 1990. "Equality of Educational Opportunity." in Equality and Achievement in
Education, edited by J. S. Coleman. Boulder: Westview Press.
Downey, Douglas B., Paul T. von Hippel, and Beckett A. Broh. 2004. "Are Schools the Great
Equalizer? Cognitive Inequality During the Summer Months and the School Year."
American Sociological Review 69:613-635.
Feng, Li. 2010. "Hire Today, Gone Tomorrow: New Teacher Classroom Assignments and
Teacher Mobility." Education Finance and Policy 5:278-316.
Feng, Li and Tim R. Sass. 2011. "Teacher Quality and Teacher Mobility." Center for Analysis of
Longitudinal Data in Education Research, Working Paper #57.
Ferguson, Ronald. 1998. "Can Schools Narrow the Black-White Test Score Gap?" Pp. 318-374
in The Black-White Test Score Gap, edited by C. Jencks and M. Phillips. Washington,
DC: Brookings.
Goldhaber, Dan, Betheny Gross, and Daniel Player. 2007a. "Are Public Schools Really Losing
their "Best"? Assessing the Career Transitions of Teachers and their Implications for the
Quality of the Teacher Workforce." Center for Analysis of Longitudinal Data in
Education Research, Working Paper #12.
Goldhaber, Dan, Betheny Gross, and Daniel Player. 2007b. "Are Public Schools Really Losing
Their Best? Assessing the Career Transitions of Teachers and Their Implications for the
Quality of the Teacher Workforce." National Center for Analysis of Longitudinal Data in
Education Research (CALDER):
http://www.caldercenter.org/PDF/1001115_Public_Schools.pdf.
Gordon, Robert, Thomas J. Kane, and Douglas O. Staiger. 2006. "Identifying Effective Teachers
Using Performance on the Job."
38
Grissom, Jason and Susanna Loeb. Forthcoming. "Triangulating Principal Effectiveness: How
Perspectives of Parents, Teachers, and Assistant Principals Identify the Central
Importance of Managerial Skills." American Educational Research Journal Available
Online:
http://aer.sagepub.com/content/early/2011/03/26/0002831211402663.full.pdf+html.
Grossman, Pamela, Susanna Loeb, Julia Cohen, Karen Hammerness, James Wyckoff, Donald
Boyd, and Hamilton Lankford. 2010. "Measure for Measure: The Relationship betweeen
Measures of Instructional Practice in Middle School English Language Arts and
Teachers' Value-Added Scores." National Bureau of Economic Research Working Paper
#16015, Cambridge, MA.
Hanushek, Eric A., John F. Kain, Daniel M. O'Brien, and Steven G. Rivkin. 2005a. "The Market
for Teacher Quality." National Bureau of Economic Research, Working Paper 11154,
Cambridge.
Hanushek, Eric, John F. Kain, and Steven G. Rivkin. 2004. "Why Public Schools Lose
Teachers." Journal of Human Resources 39:326-354.
Hanushek, Eric, John Kain, Daniel O'Brien, and Steven Rivkin. 2005b. "The Market for Teacher
Quality." Cambridge, MA: National Bureau of Economic Research, Working Paper
#11154
Horng, Eileen, Daniel Klasik, and Susanna Loeb. 2010. "Principal's Time Use and School
Effectiveness." American Journal of Education 116:491-523.
Jacob, Brian A and Lars Lefgren. 2005. "Principals As agents: Subjective performance
measurement in education." in NBER Working Paper Series. Cambridge: NBER.
39
Jacob, Brian A. and Lars Lefgren. 2008. "Can Principals Identify Effective Teachers? Evidence
on Subjective Performance Evaluation in Education." Journal of Labor Economics
26:101-136.
Jansen, Jonathan D. 1995. "Effective Schools?" Comparative Education 31:181-200.
Kalogrides, Demetra, Susanna Loeb, and Tara Béteille. 2011. "Power Play? Teacher
Characteristics and Class Assignments." in Annual Meetings of the Association for
Education Finance and Policy. Seattle, WA.
Kane, Thomas J., Jonah E. Rockoff, and Douglas O. Staiger. 2008. "What Does Certification
Tell Us About Teacher Effectiveness? Evidence from New York City." Economics of
Education Review 27:615-631.
Krei, Melinda. 1998. "Intensifying the Barriers: The Problem of Inequitable Teacher Allocation
in Low-Income Urban Schools." Urban Education 33:71-94.
La Paro, Karen M., Robert C. Pianta, and Megan Stuhlman. 2004. "Classroom Assessment
Scoring System (CLASS): Findings from the Pre-K Year." Elementary School Journal
104:409-426.
Lankford, Hamilton, Susanna Loeb, and James Wyckoff. 2002. "Teacher Sorting and the Plight
of Urban Schools: A Descriptive Analysis." Educational Evaluation and Policy Analysis
24:37-62.
McCaffrey, Daniel F., Tim R. Sass, J.R. Lockwood, and Kata Mihaly. 2009. "The Intertemporal
Variability of Teacher Effect Estimates." Education Finance and Policy 4:572-606.
Meyer, Robert H. 1997. "Value-Added Indicators of School Performance: A Primer." Economics
of Education Review 16:283-301.
40
Mortimore, Peter. 1991. "The Nature and Findings of School Effectiveness in the Primary
Sector." in School Effectiveness Research: Its Messages for School Improvement, edited
by S. R. a. S. Brown. London: HMSO.
Nye, Barbara, Spyros Konstantopoulos, and Larry V. Hedges. 2004. "How Large Are Teacher
Effects?" Educational Evaluation and Policy Analysis 26:237-257.
Purkey, Steward C. and Marshall S. Smith. 1983. "Effective Schools: A Review." The
Elementary School Journal 83:427-62.
Rivkin, Steven G., Erik A. Hanushek, and John F. Kain. 2005. "Teachers, Schools, and
Academic Achievement." Econometrica 73:417-458.
Rockoff, Jonah. 2004. "The Impact of Individual Teachers on Student Achievement: Evidence
from Panel Data." American Economic Review 94:247-252.
Rothstein, Jesse. 2009. "Student Sorting and Bias in Value-Added Estimation: Selection on
Observables and Unobservables." Education Finance and Policy 4:537-571.
Rubin, Donald, Elizabeth A Stuart, and Elaine L. Zanutto. 2004. "A Potential Outcomes View of
Value-Added Assessment in Education." Journal of Educational and Behavioral
Statistics 29:103-116.
Sammons, Pam, Josh Hillman, and Peter Mortimore. 1995. "Key Characteristics of Effective
Schools: A Review of School Effectiveness Research." International School
Effectiveness and Improvement Center. Institute of Education, University of London.,
London.
Sanders, William and June Rivers. 1996. "Cumulative and Residual Effects of Teachers on
Future Student Academic Achievement." Knoxville: University of Tennessee Value-
Added Research and Assessment Center.
41
Scafidi, Benjamin, David L. Sjoquist, and Todd R. Stinebrickner. 2008. "Race, Poverty, and
Teacher Mobility." Economics of Education Review 26:145-159.
West, Martin R. and Matthew M. Chingos. 2009. "Teacher Effectiveness, Mobility, and Attrition
in Florida." Pp. 251-272 in Performance Incentives: Their Growing Impact on American
K-12 Education, edited by M. G. Springer: Brookings Institution Press
Willms, J Douglas and Stephen W. Raudenbush. 1989. "A Longitudinal Hierarchical Linear
Model for Estimating School Effects and their Stability." Journal of Educational
Measurement 26:209-232.
Wohlstetter, Priscilla and Thomas Buffett. 1992. "Decentralizing Dollars Under School-Based
Management: Have Policies Changed." Education Policy 6:35-54.
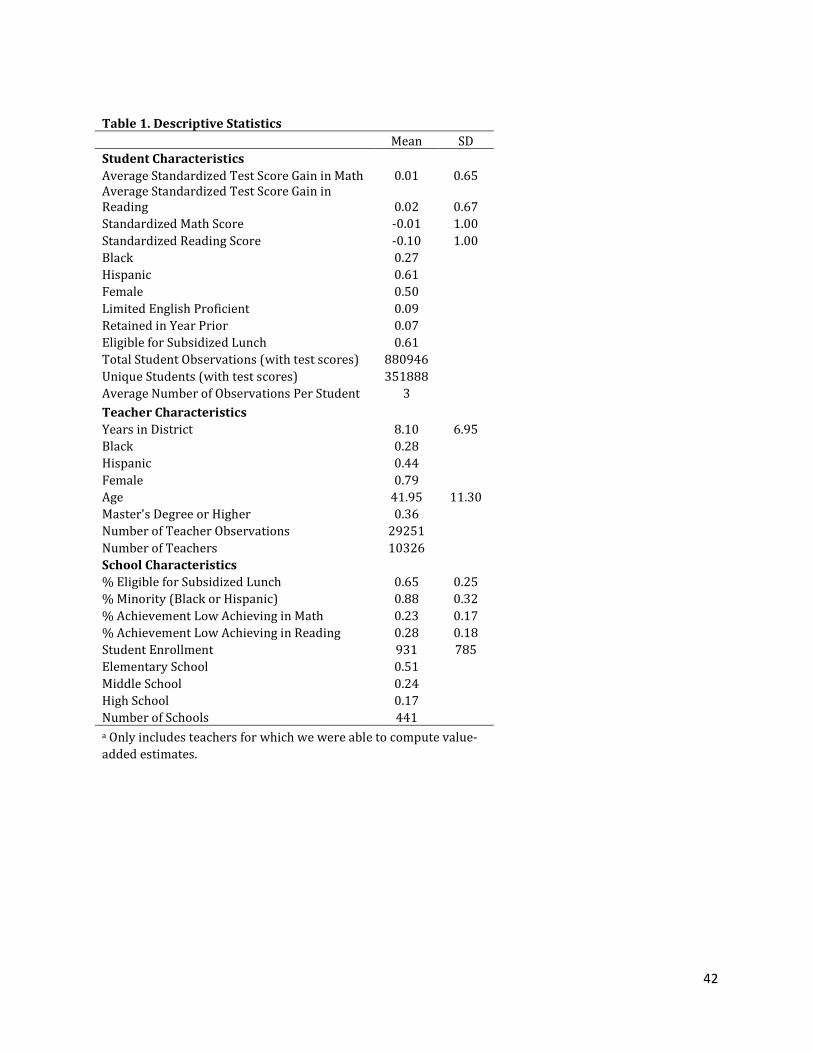
42
Table 1. Descriptive Statistics
Mean SD
Student Characteristics
Average Standardized Test Score Gain in Math 0.01 0.65
Average Standardized Test Score Gain in
Reading 0.02 0.67
Standardized Math Score -0.01 1.00
Standardized Reading Score -0.10 1.00
Black 0.27
Hispanic 0.61
Female 0.50
Limited English Proficient 0.09
Retained in Year Prior 0.07
Eligible for Subsidized Lunch 0.61
Total Student Observations (with test scores) 880946
Unique Students (with test scores) 351888
Average Number of Observations Per Student 3
Teacher Characteristics
Years in District 8.10 6.95
Black 0.28
Hispanic 0.44
Female 0.79
Age 41.95 11.30
Master's Degree or Higher 0.36
Number of Teacher Observations 29251
Number of Teachers 10326
School Characteristics
% Eligible for Subsidized Lunch 0.65 0.25
% Minority (Black or Hispanic) 0.88 0.32
% Achievement Low Achieving in Math 0.23 0.17
% Achievement Low Achieving in Reading 0.28 0.18
Student Enrollment 931 785
Elementary School 0.51
Middle School 0.24
High School 0.17
Number of Schools 441
a Only includes teachers for which we were able to compute value-
added estimates.
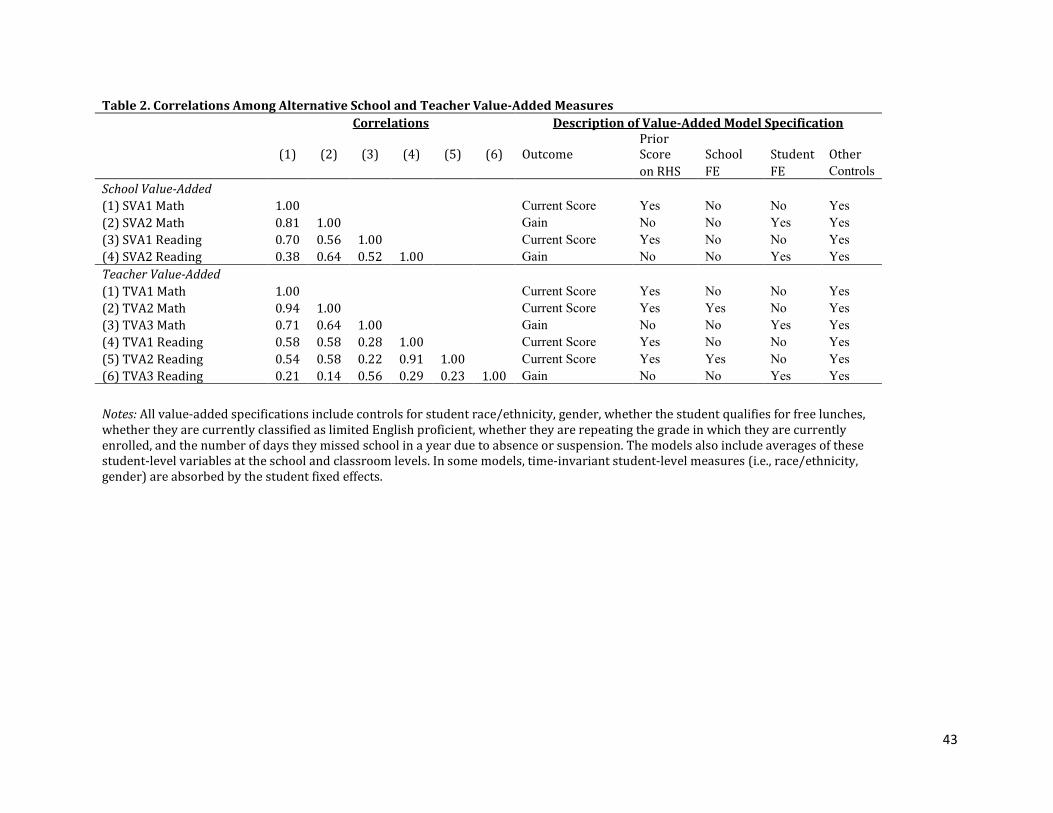
43
Table 2. Correlations Among Alternative School and Teacher Value-Added Measures
Correlations Description of Value-Added Model Specification
(1) (2) (3) (4) (5) (6) Outcome
Prior
Score School Student Other
on RHS FE FE Controls
School Value-Added
(1) SVA1 Math 1.00 Current Score Yes No No Yes
(2) SVA2 Math 0.81 1.00 Gain No No Yes Yes
(3) SVA1 Reading 0.70 0.56 1.00 Current Score Yes No No Yes
(4) SVA2 Reading 0.38 0.64 0.52 1.00 Gain No No Yes Yes
Teacher Value-Added
(1) TVA1 Math 1.00 Current Score Yes No No Yes
(2) TVA2 Math 0.94 1.00 Current Score Yes Yes No Yes
(3) TVA3 Math 0.71 0.64 1.00 Gain No No Yes Yes
(4) TVA1 Reading 0.58 0.58 0.28 1.00 Current Score Yes No No Yes
(5) TVA2 Reading 0.54 0.58 0.22 0.91 1.00 Current Score Yes Yes No Yes
(6) TVA3 Reading 0.21 0.14 0.56 0.29 0.23 1.00 Gain No No Yes Yes
Notes: All value-added specifications include controls for student race/ethnicity, gender, whether the student qualifies for free lunches,
whether they are currently classified as limited English proficient, whether they are repeating the grade in which they are currently
enrolled, and the number of days they missed school in a year due to absence or suspension. The models also include averages of these
student-level variables at the school and classroom levels. In some models, time-invariant student-level measures (i.e., race/ethnicity,
gender) are absorbed by the student fixed effects.
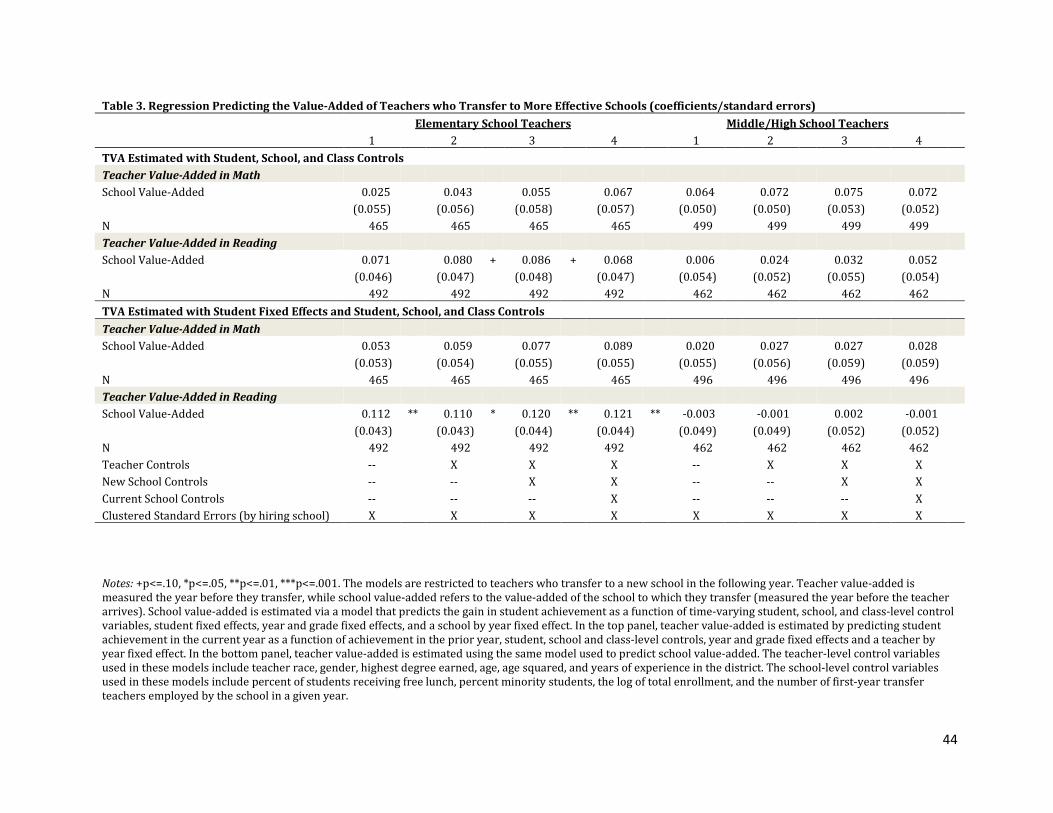
44
Table 3. Regression Predicting the Value-Added of Teachers who Transfer to More Effective Schools (coefficients/standard errors)
Elementary School Teachers
Middle/High School Teachers
1 2 3 4 1 2 3 4
TVA Estimated with Student, School, and Class Controls
Teacher Value-Added in Math
School Value-Added 0.025 0.043 0.055 0.067
0.064 0.072 0.075 0.072
(0.055) (0.056) (0.058) (0.057)
(0.050) (0.050) (0.053) (0.052)
N 465 465 465 465
499 499 499 499
Teacher Value-Added in Reading
School Value-Added 0.071 0.080 + 0.086 + 0.068
0.006 0.024 0.032 0.052
(0.046) (0.047) (0.048) (0.047)
(0.054) (0.052) (0.055) (0.054)
N 492 492 492 492
462 462 462 462
TVA Estimated with Student Fixed Effects and Student, School, and Class Controls
Teacher Value-Added in Math
School Value-Added 0.053 0.059 0.077 0.089 0.020 0.027 0.027 0.028
(0.053) (0.054) (0.055) (0.055) (0.055) (0.056) (0.059) (0.059)
N 465 465 465 465
496 496 496 496
Teacher Value-Added in Reading
School Value-Added 0.112 ** 0.110 * 0.120 ** 0.121 ** -0.003 -0.001 0.002 -0.001
(0.043) (0.043) (0.044) (0.044) (0.049) (0.049) (0.052) (0.052)
N 492 492 492 492 462 462 462 462
Teacher Controls --
X
X
X
--
X
X
X
New School Controls --
--
X
X
--
--
X
X
Current School Controls --
--
--
X
--
--
--
X
Clustered Standard Errors (by hiring school) X X X X X X X X
Notes: +p<=.10, *p<=.05, **p<=.01, ***p<=.001. The models are restricted to teachers who transfer to a new school in the following year. Teacher value-added is
measured the year before they transfer, while school value-added refers to the value-added of the school to which they transfer (measured the year before the teacher
arrives). School value-added is estimated via a model that predicts the gain in student achievement as a function of time-varying student, school, and class-level control
variables, student fixed effects, year and grade fixed effects, and a school by year fixed effect. In the top panel, teacher value-added is estimated by predicting student
achievement in the current year as a function of achievement in the prior year, student, school and class-level controls, year and grade fixed effects and a teacher by
year fixed effect. In the bottom panel, teacher value-added is estimated using the same model used to predict school value-added. The teacher-level control variables
used in these models include teacher race, gender, highest degree earned, age, age squared, and years of experience in the district. The school-level control variables
used in these models include percent of students receiving free lunch, percent minority students, the log of total enrollment, and the number of first-year transfer
teachers employed by the school in a given year.
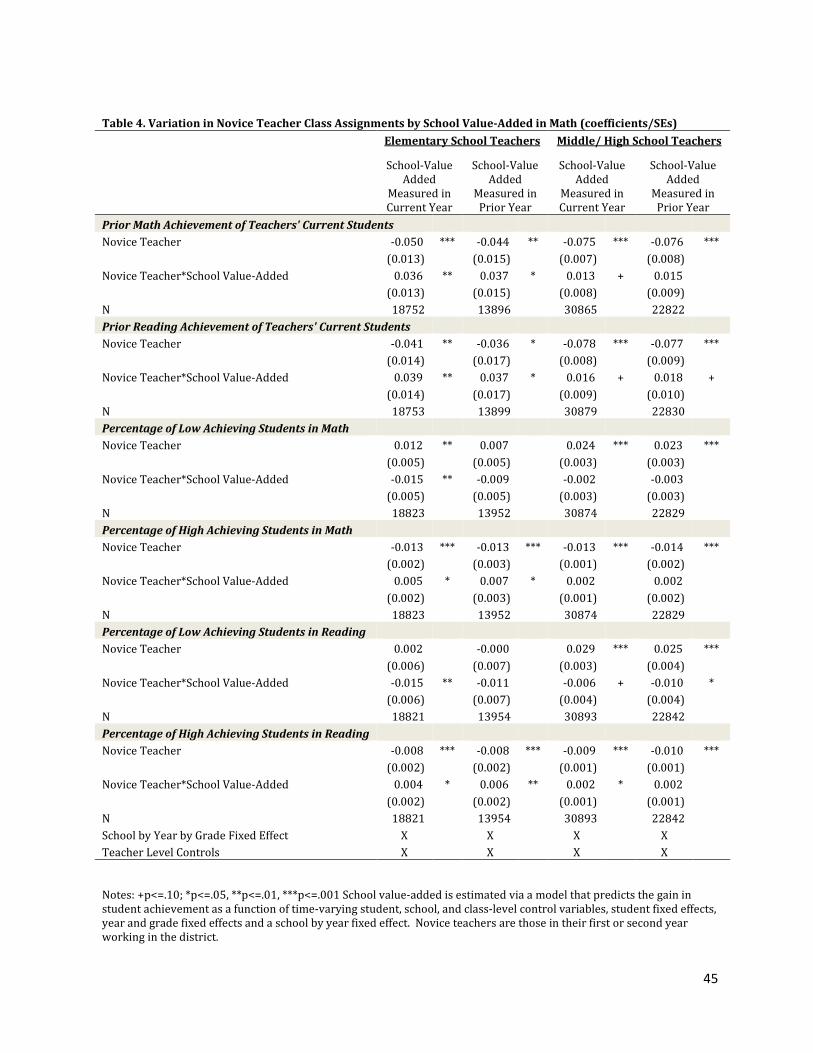
45
Table 4. Variation in Novice Teacher Class Assignments by School Value-Added in Math (coefficients/SEs)
Elementary School Teachers Middle/ High School Teachers
School-Value
Added
Measured in
Current Year
School-Value
Added
Measured in
Prior Year
School-Value
Added
Measured in
Current Year
School-Value
Added
Measured in
Prior Year
Prior Math Achievement of Teachers' Current Students
Novice Teacher -0.050 *** -0.044 ** -0.075 *** -0.076 ***
(0.013) (0.015) (0.007) (0.008)
Novice Teacher*School Value-Added 0.036 ** 0.037 * 0.013 + 0.015
(0.013) (0.015) (0.008) (0.009)
N 18752 13896
30865 22822
Prior Reading Achievement of Teachers' Current Students
Novice Teacher -0.041 ** -0.036 * -0.078 *** -0.077 ***
(0.014) (0.017) (0.008) (0.009)
Novice Teacher*School Value-Added 0.039 ** 0.037 * 0.016 + 0.018 +
(0.014) (0.017) (0.009) (0.010)
N 18753 13899
30879 22830
Percentage of Low Achieving Students in Math
Novice Teacher 0.012 ** 0.007
0.024 *** 0.023 ***
(0.005) (0.005)
(0.003) (0.003)
Novice Teacher*School Value-Added -0.015 ** -0.009
-0.002 -0.003
(0.005) (0.005)
(0.003) (0.003)
N 18823 13952
30874 22829
Percentage of High Achieving Students in Math
Novice Teacher -0.013 *** -0.013 *** -0.013 *** -0.014 ***
(0.002) (0.003) (0.001) (0.002)
Novice Teacher*School Value-Added 0.005 * 0.007 * 0.002 0.002
(0.002) (0.003) (0.001) (0.002)
N 18823 13952
30874 22829
Percentage of Low Achieving Students in Reading
Novice Teacher 0.002 -0.000
0.029 *** 0.025 ***
(0.006) (0.007)
(0.003) (0.004)
Novice Teacher*School Value-Added -0.015 ** -0.011
-0.006 + -0.010 *
(0.006) (0.007)
(0.004) (0.004)
N 18821 13954
30893 22842
Percentage of High Achieving Students in Reading
Novice Teacher -0.008 *** -0.008 *** -0.009 *** -0.010 ***
(0.002) (0.002) (0.001) (0.001)
Novice Teacher*School Value-Added 0.004 * 0.006 ** 0.002 * 0.002
(0.002) (0.002) (0.001) (0.001)
N 18821 13954
30893 22842
School by Year by Grade Fixed Effect X
X
X
X
Teacher Level Controls X X X X
Notes: +p<=.10; *p<=.05, **p<=.01, ***p<=.001 School value-added is estimated via a model that predicts the gain in
student achievement as a function of time-varying student, school, and class-level control variables, student fixed effects,
year and grade fixed effects and a school by year fixed effect. Novice teachers are those in their first or second year
working in the district.
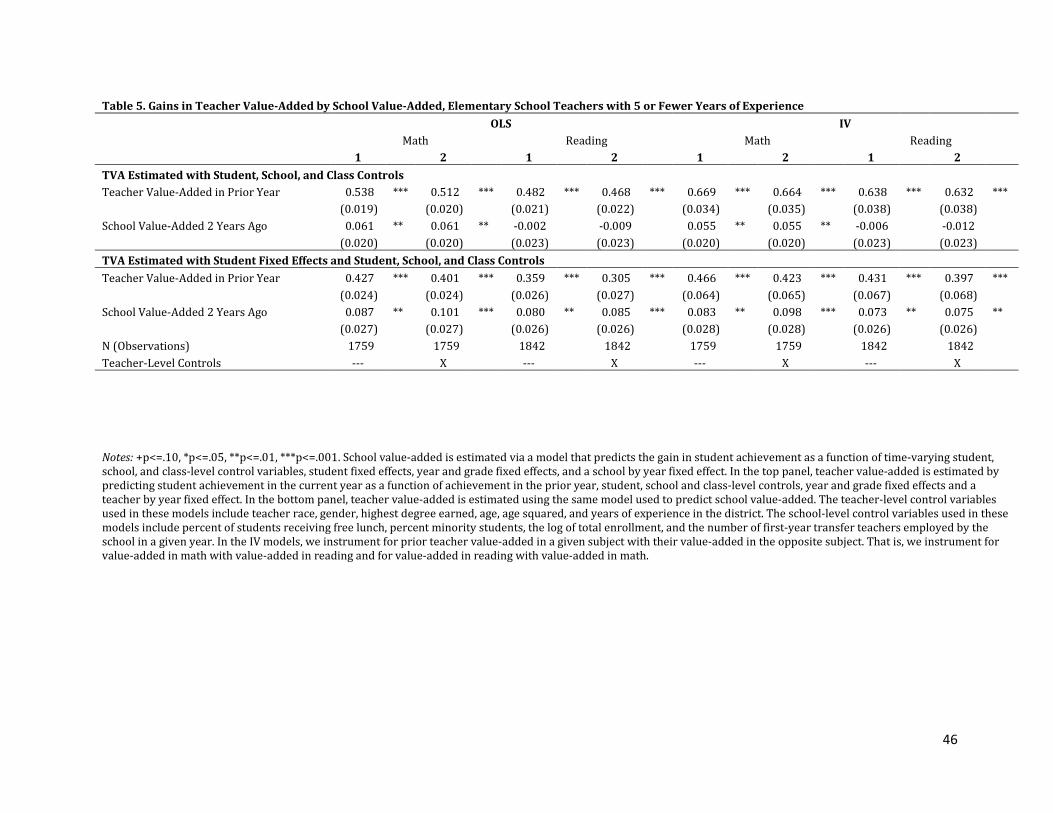
46
Table 5. Gains in Teacher Value-Added by School Value-Added, Elementary School Teachers with 5 or Fewer Years of Experience
OLS IV
Math Reading Math Reading
1 2 1 2 1 2 1 2
TVA Estimated with Student, School, and Class Controls
Teacher Value-Added in Prior Year 0.538 *** 0.512 *** 0.482 *** 0.468 *** 0.669 *** 0.664 *** 0.638 *** 0.632 ***
(0.019) (0.020) (0.021) (0.022) (0.034) (0.035) (0.038) (0.038)
School Value-Added 2 Years Ago 0.061 ** 0.061 ** -0.002 -0.009 0.055 ** 0.055 ** -0.006 -0.012
(0.020) (0.020) (0.023) (0.023) (0.020) (0.020) (0.023) (0.023)
TVA Estimated with Student Fixed Effects and Student, School, and Class Controls
Teacher Value-Added in Prior Year 0.427 *** 0.401 *** 0.359 *** 0.305 *** 0.466 *** 0.423 *** 0.431 *** 0.397 ***
(0.024) (0.024) (0.026) (0.027) (0.064) (0.065) (0.067) (0.068)
School Value-Added 2 Years Ago 0.087 ** 0.101 *** 0.080 ** 0.085 *** 0.083 ** 0.098 *** 0.073 ** 0.075 **
(0.027) (0.027) (0.026) (0.026) (0.028) (0.028) (0.026) (0.026)
N (Observations) 1759 1759 1842 1842 1759 1759 1842 1842
Teacher-Level Controls --- X --- X --- X --- X
Notes: +p<=.10, *p<=.05, **p<=.01, ***p<=.001. School value-added is estimated via a model that predicts the gain in student achievement as a function of time-varying student,
school, and class-level control variables, student fixed effects, year and grade fixed effects, and a school by year fixed effect. In the top panel, teacher value-added is estimated by
predicting student achievement in the current year as a function of achievement in the prior year, student, school and class-level controls, year and grade fixed effects and a
teacher by year fixed effect. In the bottom panel, teacher value-added is estimated using the same model used to predict school value-added. The teacher-level control variables
used in these models include teacher race, gender, highest degree earned, age, age squared, and years of experience in the district. The school-level control variables used in these
models include percent of students receiving free lunch, percent minority students, the log of total enrollment, and the number of first-year transfer teachers employed by the
school in a given year. In the IV models, we instrument for prior teacher value-added in a given subject with their value-added in the opposite subject. That is, we instrument for
value-added in math with value-added in reading and for value-added in reading with value-added in math.
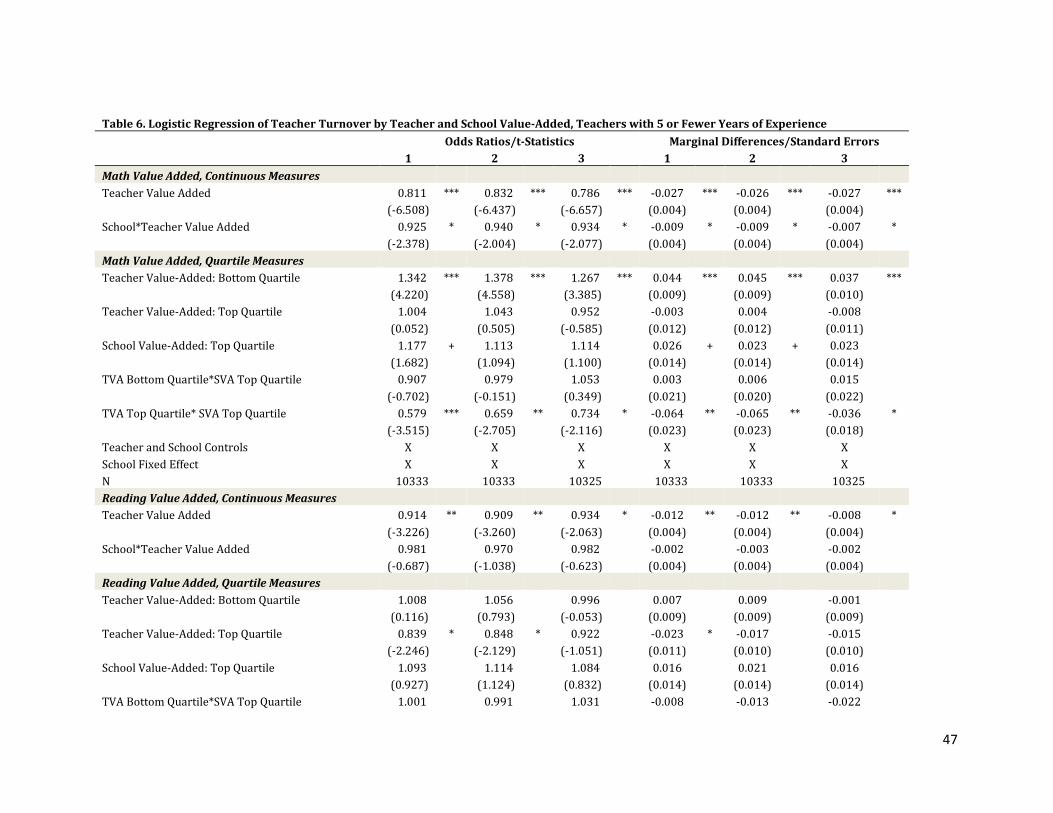
47
Table 6. Logistic Regression of Teacher Turnover by Teacher and School Value-Added, Teachers with 5 or Fewer Years of Experience
Odds Ratios/t-Statistics Marginal Differences/Standard Errors
1 2 3 1 2 3
Math Value Added, Continuous Measures
Teacher Value Added 0.811 *** 0.832 *** 0.786 *** -0.027 *** -0.026 *** -0.027 ***
(-6.508) (-6.437) (-6.657) (0.004)
(0.004)
(0.004)
School*Teacher Value Added 0.925 * 0.940 * 0.934 * -0.009 * -0.009 * -0.007 *
(-2.378) (-2.004) (-2.077) (0.004)
(0.004)
(0.004)
Math Value Added, Quartile Measures
Teacher Value-Added: Bottom Quartile 1.342 *** 1.378 *** 1.267 *** 0.044 *** 0.045 *** 0.037 ***
(4.220) (4.558) (3.385) (0.009)
(0.009)
(0.010)
Teacher Value-Added: Top Quartile 1.004 1.043 0.952 -0.003
0.004
-0.008
(0.052) (0.505) (-0.585) (0.012)
(0.012)
(0.011)
School Value-Added: Top Quartile 1.177 + 1.113 1.114 0.026 + 0.023 + 0.023
(1.682) (1.094) (1.100) (0.014)
(0.014)
(0.014)
TVA Bottom Quartile*SVA Top Quartile 0.907 0.979 1.053 0.003
0.006
0.015
(-0.702) (-0.151) (0.349) (0.021)
(0.020)
(0.022)
TVA Top Quartile* SVA Top Quartile 0.579 *** 0.659 ** 0.734 * -0.064 ** -0.065 ** -0.036 *
(-3.515) (-2.705) (-2.116) (0.023)
(0.023)
(0.018)
Teacher and School Controls X
X
X
X
X
X
School Fixed Effect X
X
X
X
X
X
N 10333 10333 10325
10333 10333 10325
Reading Value Added, Continuous Measures
Teacher Value Added 0.914 ** 0.909 ** 0.934 * -0.012 ** -0.012 ** -0.008 *
(-3.226) (-3.260) (-2.063) (0.004)
(0.004)
(0.004)
School*Teacher Value Added 0.981 0.970 0.982 -0.002
-0.003
-0.002
(-0.687) (-1.038) (-0.623) (0.004)
(0.004)
(0.004)
Reading Value Added, Quartile Measures
Teacher Value-Added: Bottom Quartile 1.008 1.056 0.996 0.007
0.009
-0.001
(0.116) (0.793) (-0.053) (0.009)
(0.009)
(0.009)
Teacher Value-Added: Top Quartile 0.839 * 0.848 * 0.922 -0.023 * -0.017
-0.015
(-2.246) (-2.129) (-1.051) (0.011)
(0.010)
(0.010)
School Value-Added: Top Quartile 1.093 1.114 1.084 0.016
0.021
0.016
(0.927) (1.124) (0.832) (0.014)
(0.014)
(0.014)
TVA Bottom Quartile*SVA Top Quartile 1.001 0.991 1.031 -0.008
-0.013
-0.022
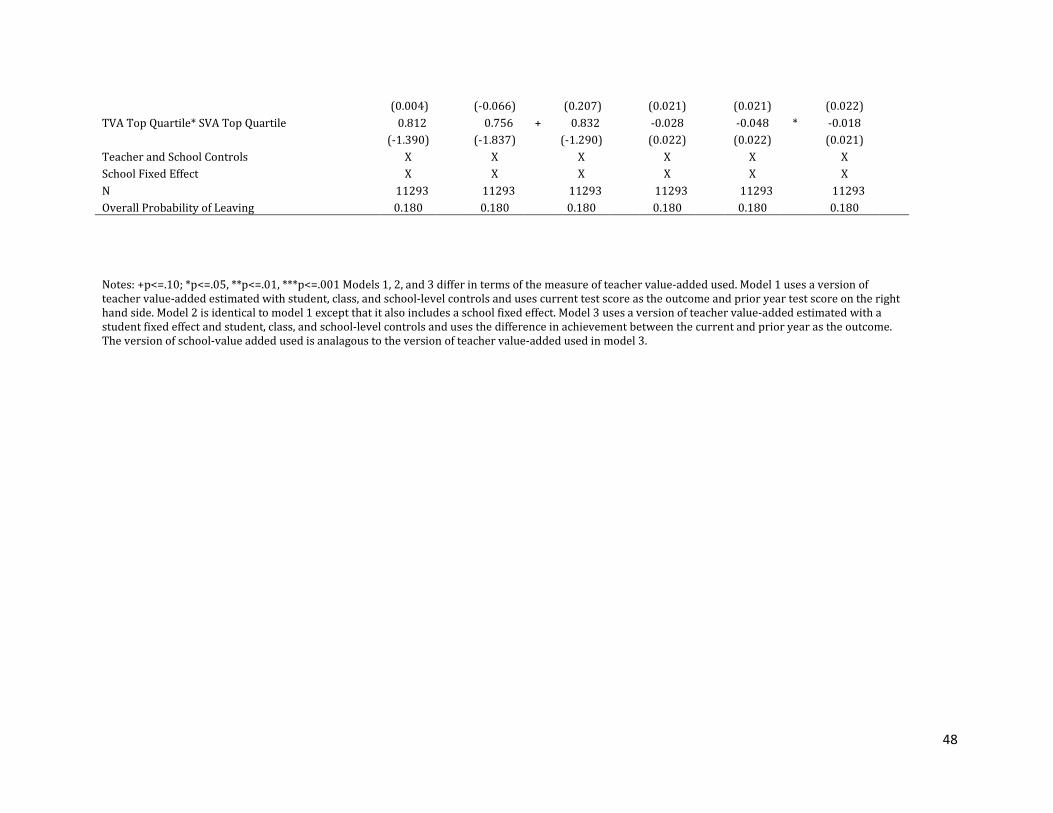
48
(0.004) (-0.066) (0.207) (0.021)
(0.021)
(0.022)
TVA Top Quartile* SVA Top Quartile 0.812 0.756 + 0.832 -0.028
-0.048 * -0.018
(-1.390) (-1.837) (-1.290) (0.022)
(0.022)
(0.021)
Teacher and School Controls X
X
X
X
X
X
School Fixed Effect X
X
X
X
X
X
N 11293 11293 11293
11293 11293 11293
Overall Probability of Leaving 0.180
0.180
0.180
0.180 0.180 0.180
Notes: +p<=.10; *p<=.05, **p<=.01, ***p<=.001 Models 1, 2, and 3 differ in terms of the measure of teacher value-added used. Model 1 uses a version of
teacher value-added estimated with student, class, and school-level controls and uses current test score as the outcome and prior year test score on the right
hand side. Model 2 is identical to model 1 except that it also includes a school fixed effect. Model 3 uses a version of teacher value-added estimated with a
student fixed effect and student, class, and school-level controls and uses the difference in achievement between the current and prior year as the outcome.
The version of school-value added used is analagous to the version of teacher value-added used in model 3.
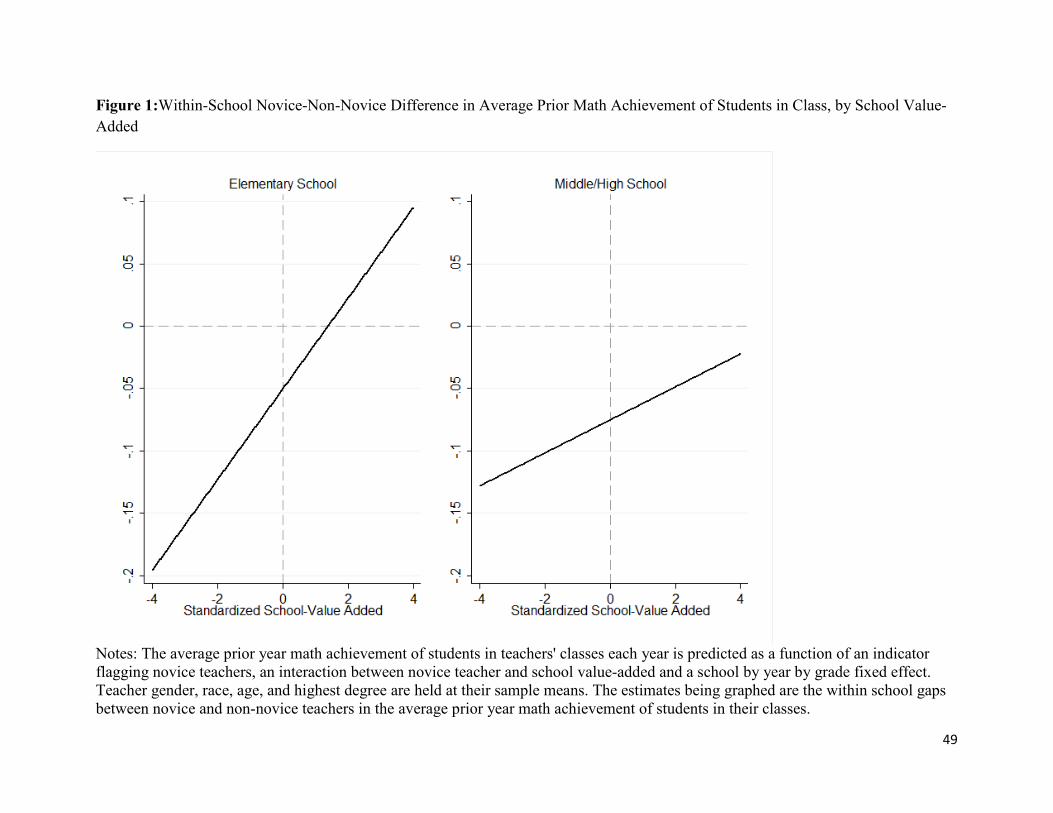
49
Figure 1:Within-School Novice-Non-Novice Difference in Average Prior Math Achievement of Students in Class, by School Value-
Added
Notes: The average prior year math achievement of students in teachers' classes each year is predicted as a function of an indicator
flagging novice teachers, an interaction between novice teacher and school value-added and a school by year by grade fixed effect.
Teacher gender, race, age, and highest degree are held at their sample means. The estimates being graphed are the within school gaps
between novice and non-novice teachers in the average prior year math achievement of students in their classes.
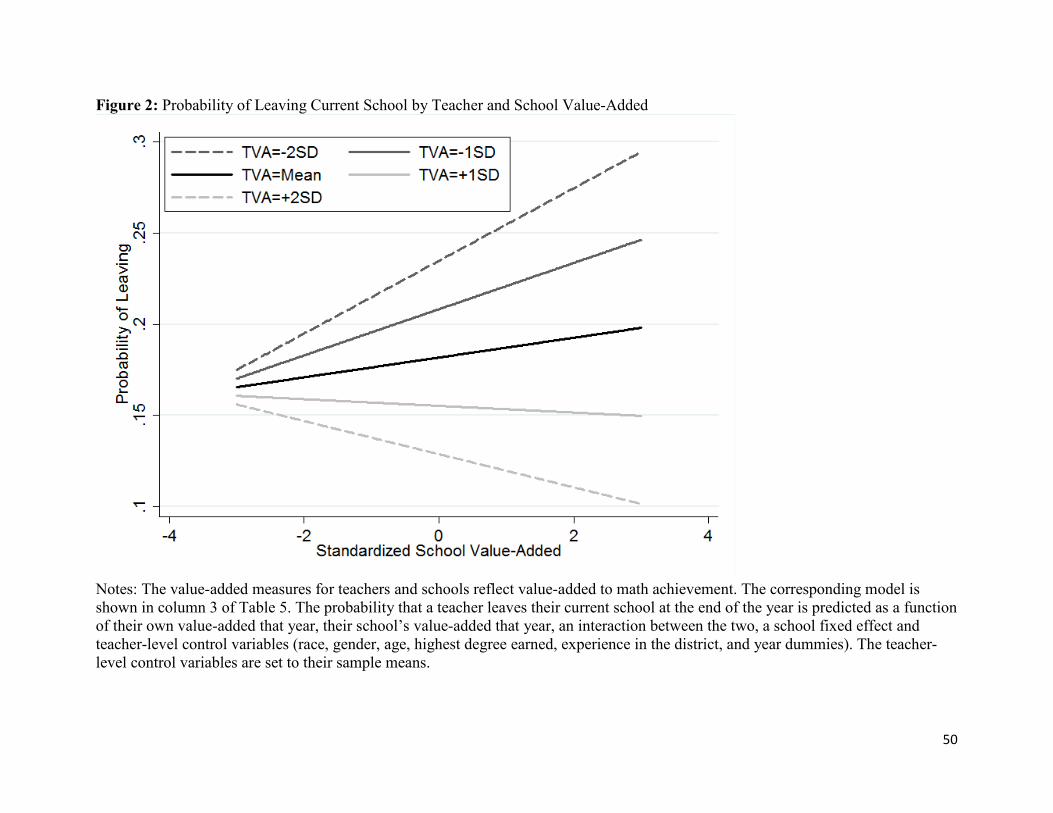
50
Figure 2: Probability of Leaving Current School by Teacher and School Value-Added
Notes: The value-added measures for teachers and schools reflect value-added to math achievement. The corresponding model is
shown in column 3 of Table 5. The probability that a teacher leaves their current school at the end of the year is predicted as a function
of their own value-added that year, their school’s value-added that year, an interaction between the two, a school fixed effect and
teacher-level control variables (race, gender, age, highest degree earned, experience in the district, and year dummies). The teacher-
level control variables are set to their sample means.
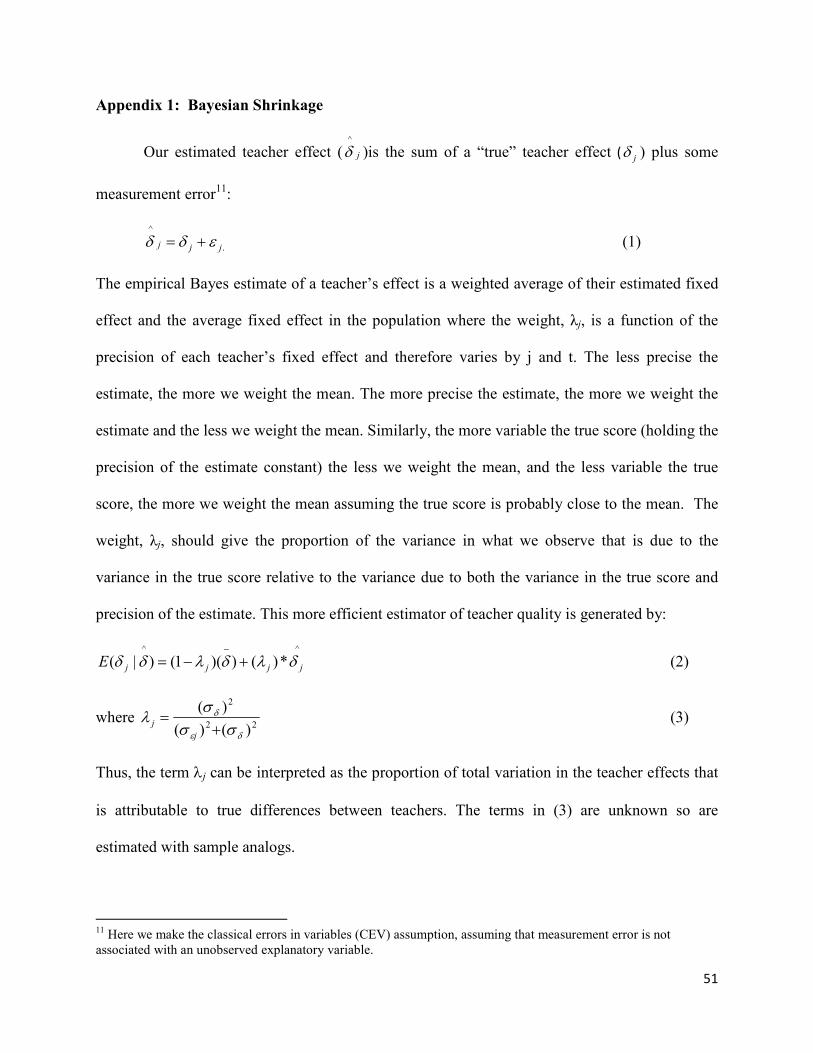
51
Appendix 1: Bayesian Shrinkage
Our estimated teacher effect ( j
^
δ )is the sum of a “true” teacher effect ( jδ ) plus some
measurement error11
:
.
^
jjj εδδ += (1)
The empirical Bayes estimate of a teacher’s effect is a weighted average of their estimated fixed
effect and the average fixed effect in the population where the weight, λj, is a function of the
precision of each teacher’s fixed effect and therefore varies by j and t. The less precise the
estimate, the more we weight the mean. The more precise the estimate, the more we weight the
estimate and the less we weight the mean. Similarly, the more variable the true score (holding the
precision of the estimate constant) the less we weight the mean, and the less variable the true
score, the more we weight the mean assuming the true score is probably close to the mean. The
weight, λj, should give the proportion of the variance in what we observe that is due to the
variance in the true score relative to the variance due to both the variance in the true score and
precision of the estimate. This more efficient estimator of teacher quality is generated by:
^^
*)())(1()|( jjjjE δλδλδδ +−=−
(2)
where 22
2
)()(
)(
δε
δ
σσ
σλ
+=
j
j (3)
Thus, the term λj can be interpreted as the proportion of total variation in the teacher effects that
is attributable to true differences between teachers. The terms in (3) are unknown so are
estimated with sample analogs.
11
Here we make the classical errors in variables (CEV) assumption, assuming that measurement error is not
associated with an unobserved explanatory variable.
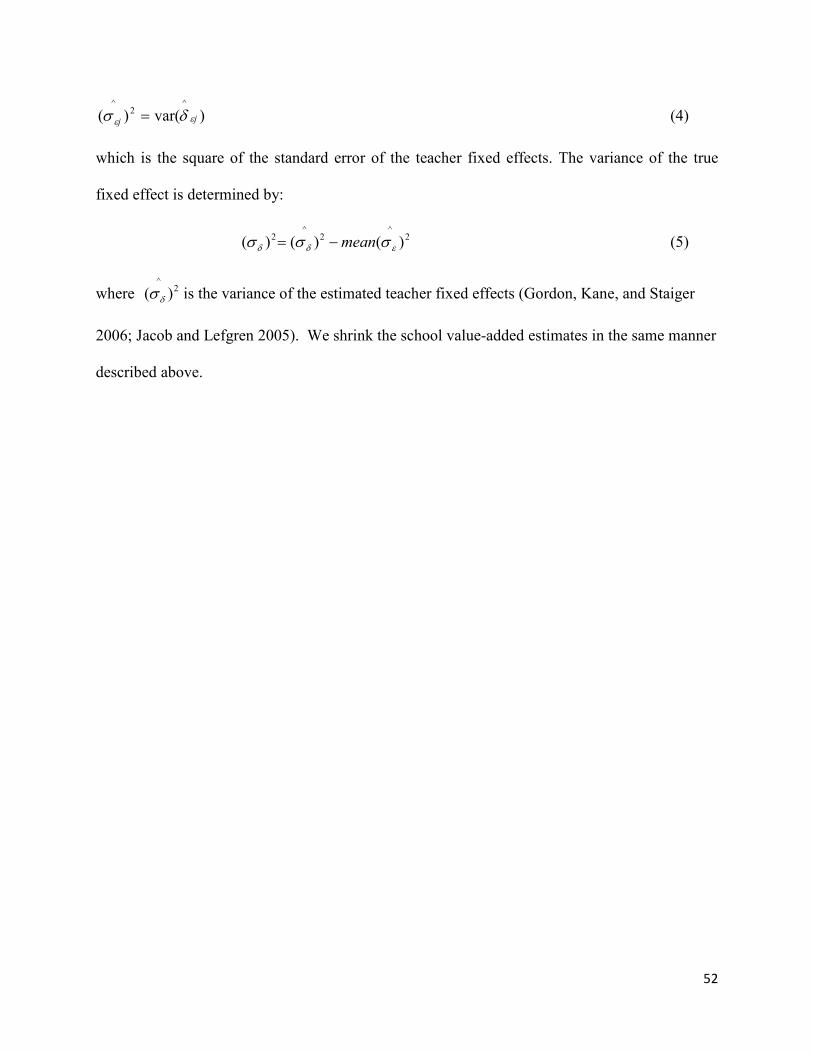
52
)var()(^
2^
jj εε δσ = (4)
which is the square of the standard error of the teacher fixed effects. The variance of the true
fixed effect is determined by:
2^
2^
2 )()()( εδδ σσσ mean−= (5)
where 2^
)( δσ is the variance of the estimated teacher fixed effects (Gordon, Kane, and Staiger
2006; Jacob and Lefgren 2005). We shrink the school value-added estimates in the same manner
described above.