
EFFECTIVE LEAF AREA INDEX RETRIEVING FROM TERRESTRIAL ...
8
EFFECTIVE LEAF AREA INDEX RETRIEVING FROM TERRESTRIAL POINT CLOUD DATA: COUPLING COMPUTATIONAL GEOMETRY APPLICATION AND GAUSSIAN MIXTURE MODEL CLUSTERING S. Jin a, * , M. Tamura b , J. Susaki b a Kyoto University, Graduate School of Global Environmental Studies, Kyoto, Japan - [email protected] b Kyoto University, Civil and Earth Resources Engineering, Kyoto, Japan - (tamura.masayuki.2w, susaki.junichi.3r)@kyoto-u.ac.jp KEY WORDS: Point Cloud Data, Effective Leaf Area Index, Curvature Threshold, Clustering Analysis ABSTRACT: Leaf area index (LAI) is one of the most important structural parameters of forestry studies which manifests the ability of the green vegetation interacted with the solar illumination. Classic understanding about LAI is to consider the green canopy as integration of horizontal leaf layers. Since multi-angle remote sensing technique developed, LAI obliged to be deliberated according to the observa- tion geometry. Effective LAI could formulate the leaf-light interaction virtually and precisely. To retrieve the LAI/effective LAI from remotely sensed data therefore becomes a challenge during the past decades. Laser scanning technique can provide accurate surface echoed coordinates with densely scanned intervals. To utilize the density based statistical algorithm for analyzing the voluminous amount of the 3-D points data is one of the subjects of the laser scanning applications. Computational geometry also provides some mature applications for point cloud data (PCD) processing and analysing. In this paper, authors investigated the feasibility of a new application for retrieving the effective LAI of an isolated broad leaf tree. Simplified curvature was calculated for each point in order to remove those non-photosynthetic tissues. Then PCD were discretized into voxel, and clustered by using Gaussian mixture model. Subsequently the area of each cluster was calculated by employing the computational geometry applications. In order to validate our application, we chose an indoor plant to estimate the leaf area, the correlation coefficient between calculation and measurement was 98.28%. We finally calculated the effective LAI of the tree with 6 × 6 assumed observation directions. 1. INTRODUCTION Leaf area index (LAI) is a key variable used to model many phys- ical processes, such as canopy photosynthesis and transpiration. It determines the size of the plant-atmosphere interface and thus plays a critical role in the exchange of energy and mass between the canopy and the atmosphere (Weiss et al., 2004). Therefore, obtaining LAI effectively and accurately by using remote sensing data has been discussed for decades. LAI is first defined as one-sided of photosynthetic tissue per unit ground horizontal area (Watson, 1947). At the beginning of the LAI studies the canopy structural parameters are measured di- rectly. It is accurate, however, time consuming and destructive to plants (Lang and Xiang, 1986). According to the botanical structure of the vegetation, we only consider the green plants on the ground; leaves from the canopy are with low visible light re- flectance except of green light. Theoretically it is possible to re- trieve the leaf area from the canopy using optical sensed data. Since 1960s people attempt to indirectly retrieve canopy struc- tural parameters from optical images (Jonckheere et al., 2004). Several ground-based commercial instruments for LAI collec- tion have been testified, the advantages and drawbacks of each instrument have been presented as well; moreover the potential of the laser instruments for LAI measurement has been pointed out acutely (Welles and Cohen, 1996). Landsat TM data and ground-based measurements of LAI have been correlated for es- timating effective LAI, which is the product of LAI and clumping index. Some issues have been discussed for the LAI estimation, which were correlated to the LAI retrieving from Landsat images in spite the limitations of TM image (Chen and Cihlar, 1996). The development of the optical sensor resolution improves LAI measurement accuracy and mathematical modeling. An applica- * Email:[email protected]; Tel/Fax: +81 075-383-3303. tion with spectral and textural information was used for mapping the LAI of different vegetation types, has been presented by us- ing IKONOS images (Colombo et al., 2003). Moreover when the land cover is stratified, spectral and textural relations are consid- erably better for mapping LAI spatial variability for different crop types. Encouraging result in LAI estimation by using optical data has been obtained via data fusion process for high spatial resolu- tion images of the LAI. For achieving reliable result over a large area, LAI measurement with auxiliary variables such as NDVI computed from Landsat images have been combined(Hernndez et al., 2014). However, due to the assumption of randomly located foliage elements within the canopy, LAI obtained from gap frac- tion (Pearcy et al., 1989) theory is not the actual LAI (Zheng and Moskal, 2009), thus effective LAI has been proposed to describe the result more accurately, which is obtained by considering the clumping index affection. Recent studies propose to utilize laser scanner for LAI estimation since it holds good performance at range detection and the con- sistency of the precision. Morsdorf and his colleagues evaluated the potential of deriving effective LAI proxy by estimating a frac- tion of first and last echo types inside the canopy. Based on the regression results, LAI has been computed for a region, and com- pared qualitatively to the result based on imaging spectrometry, revealing similar spatial patterns and ranges of values (Morsdorf et al., 2006). Effective LAI has been calculated by referring em- pirical model from airborne LiDAR data. Due to the narrow scan angle of the LiDAR, the parameters of the model have been es- timated from the field investigation (Korhonen et al., 2011). An accurate application has been developed for calculating leaf area density (LAD) and cumulative LAI profiles of small trees (Hosoi and Omasa, 2006). This voxel based 3-D modeling application is implemented in the study. This model allows the LAD and LAI of trees, which have complex spatial distributed foliage, to be computed by direct counting of the beam-contact frequency in ISPRS Annals of the Photogrammetry, Remote Sensing and Spatial Information Sciences, Volume II-7, 2014 ISPRS Technical Commission VII Symposium, 29 September – 2 October 2014, Istanbul, Turkey This contribution has been peer-reviewed. The double-blind peer-review was conducted on the basis of the full paper. doi:10.5194/isprsannals-II-7-23-2014 23
Transcript of EFFECTIVE LEAF AREA INDEX RETRIEVING FROM TERRESTRIAL ...
EFFECTIVE LEAF AREA INDEX RETRIEVING FROM TERRESTRIAL POINT CLOUDDATA: COUPLING COMPUTATIONAL GEOMETRY APPLICATION AND GAUSSIAN
MIXTURE MODEL CLUSTERING
S. Jina, ∗, M. Tamurab, J. Susakib
a Kyoto University, Graduate School of Global Environmental Studies, Kyoto, Japan - [email protected] Kyoto University, Civil and Earth Resources Engineering, Kyoto, Japan - (tamura.masayuki.2w, susaki.junichi.3r)@kyoto-u.ac.jp
KEY WORDS: Point Cloud Data, Effective Leaf Area Index, Curvature Threshold, Clustering Analysis
ABSTRACT:
Leaf area index (LAI) is one of the most important structural parameters of forestry studies which manifests the ability of the greenvegetation interacted with the solar illumination. Classic understanding about LAI is to consider the green canopy as integration ofhorizontal leaf layers. Since multi-angle remote sensing technique developed, LAI obliged to be deliberated according to the observa-tion geometry. Effective LAI could formulate the leaf-light interaction virtually and precisely. To retrieve the LAI/effective LAI fromremotely sensed data therefore becomes a challenge during the past decades. Laser scanning technique can provide accurate surfaceechoed coordinates with densely scanned intervals. To utilize the density based statistical algorithm for analyzing the voluminousamount of the 3-D points data is one of the subjects of the laser scanning applications. Computational geometry also provides somemature applications for point cloud data (PCD) processing and analysing. In this paper, authors investigated the feasibility of a newapplication for retrieving the effective LAI of an isolated broad leaf tree. Simplified curvature was calculated for each point in orderto remove those non-photosynthetic tissues. Then PCD were discretized into voxel, and clustered by using Gaussian mixture model.Subsequently the area of each cluster was calculated by employing the computational geometry applications. In order to validate ourapplication, we chose an indoor plant to estimate the leaf area, the correlation coefficient between calculation and measurement was98.28%. We finally calculated the effective LAI of the tree with 6× 6 assumed observation directions.
1. INTRODUCTION
Leaf area index (LAI) is a key variable used to model many phys-ical processes, such as canopy photosynthesis and transpiration.It determines the size of the plant-atmosphere interface and thusplays a critical role in the exchange of energy and mass betweenthe canopy and the atmosphere (Weiss et al., 2004). Therefore,obtaining LAI effectively and accurately by using remote sensingdata has been discussed for decades.
LAI is first defined as one-sided of photosynthetic tissue per unitground horizontal area (Watson, 1947). At the beginning of theLAI studies the canopy structural parameters are measured di-rectly. It is accurate, however, time consuming and destructiveto plants (Lang and Xiang, 1986). According to the botanicalstructure of the vegetation, we only consider the green plants onthe ground; leaves from the canopy are with low visible light re-flectance except of green light. Theoretically it is possible to re-trieve the leaf area from the canopy using optical sensed data.Since 1960s people attempt to indirectly retrieve canopy struc-tural parameters from optical images (Jonckheere et al., 2004).Several ground-based commercial instruments for LAI collec-tion have been testified, the advantages and drawbacks of eachinstrument have been presented as well; moreover the potentialof the laser instruments for LAI measurement has been pointedout acutely (Welles and Cohen, 1996). Landsat TM data andground-based measurements of LAI have been correlated for es-timating effective LAI, which is the product of LAI and clumpingindex. Some issues have been discussed for the LAI estimation,which were correlated to the LAI retrieving from Landsat imagesin spite the limitations of TM image (Chen and Cihlar, 1996).
The development of the optical sensor resolution improves LAImeasurement accuracy and mathematical modeling. An applica-∗Email:[email protected]; Tel/Fax: +81 075-383-3303.
tion with spectral and textural information was used for mappingthe LAI of different vegetation types, has been presented by us-ing IKONOS images (Colombo et al., 2003). Moreover when theland cover is stratified, spectral and textural relations are consid-erably better for mapping LAI spatial variability for different croptypes. Encouraging result in LAI estimation by using optical datahas been obtained via data fusion process for high spatial resolu-tion images of the LAI. For achieving reliable result over a largearea, LAI measurement with auxiliary variables such as NDVIcomputed from Landsat images have been combined(Hernndez etal., 2014). However, due to the assumption of randomly locatedfoliage elements within the canopy, LAI obtained from gap frac-tion (Pearcy et al., 1989) theory is not the actual LAI (Zheng andMoskal, 2009), thus effective LAI has been proposed to describethe result more accurately, which is obtained by considering theclumping index affection.
Recent studies propose to utilize laser scanner for LAI estimationsince it holds good performance at range detection and the con-sistency of the precision. Morsdorf and his colleagues evaluatedthe potential of deriving effective LAI proxy by estimating a frac-tion of first and last echo types inside the canopy. Based on theregression results, LAI has been computed for a region, and com-pared qualitatively to the result based on imaging spectrometry,revealing similar spatial patterns and ranges of values (Morsdorfet al., 2006). Effective LAI has been calculated by referring em-pirical model from airborne LiDAR data. Due to the narrow scanangle of the LiDAR, the parameters of the model have been es-timated from the field investigation (Korhonen et al., 2011). Anaccurate application has been developed for calculating leaf areadensity (LAD) and cumulative LAI profiles of small trees (Hosoiand Omasa, 2006). This voxel based 3-D modeling applicationis implemented in the study. This model allows the LAD andLAI of trees, which have complex spatial distributed foliage, tobe computed by direct counting of the beam-contact frequency in
ISPRS Annals of the Photogrammetry, Remote Sensing and Spatial Information Sciences, Volume II-7, 2014ISPRS Technical Commission VII Symposium, 29 September – 2 October 2014, Istanbul, Turkey
This contribution has been peer-reviewed. The double-blind peer-review was conducted on the basis of the full paper.doi:10.5194/isprsannals-II-7-23-2014 23

(a)
ScanPos001
ScanPos002
ScanPos003
ScanPos004 ScanPos005
ScanPos006
(b)
Figure 1: (a) The tree (Cinnamomum Camphora) used in this study. (b) Six stations for laser scanning, ScanPos001 is taken as assumedoriginal point of the coordinate system we used.
each layer using a point-quadrat method. The non-photosynthetictissue has to be removed as redundancy in the application so thatthe damage to the plant cannot be avoided. A computational ge-ometry based application has been published for retrieving the ef-fective leaf area using terrestrial laser scanner (TLS) data (Zhengand Moskal, 2012). Due to the high sampling density of TLS,this method can be taken as a calibration tool for airborne laserscanning and optical sensing. PCD have been discretized intoslides and the leaf area within each one has been calculated, butthe non-photosynthetic structure still cannot be removed. Non-photosynthetic tissue removing is a challenging issue of the laserscanner utilized LAI estimation study, especially for the canopieswhich are not dense.
As a consequence of the 3-D scanners development, the prob-lem of high quality geometrical characteristic extraction fromdense PCD is receiving increased attention (Fabio, 2003). It ispossible to distinguish leaves from non-photosynthetic structure(branch and trunk), if one considers their geometry pattern fea-tures from PCD. One leaf is a patch of an infinite surface, yetthe non-photosynthetic structure could be taken as the integra-tion of cylinder segments. Surface curvature is considered as thebending and distortion of surface patches, which holds the po-tential to distinguish between leaves (distorted like a hinge) andbranches (composed from cylindrical segments). Intuitively, thebranch curvature should be smaller and more regular than thatof leaves, while the curvature of leaf surfaces should be sensi-tively changed according to the leaf bend. Removing the non-photosynthetic structures of the canopy is thus constrained byonly geometric properties that differ from leaves, though otherissues can be overcome.
PCD can be considered as the aggregation of multivariate dis-tributed clusters according to the object location in Cartesian space.If the point clusters in a sub-space, a voxel, can be distinguished,the PCD can be classified into several clusters, which hold signifi-cance for leaf area retrieval. Leaf area calculation can be achievedby using computer scientific libraries like Computational Geom-
etry Algorithms Library (CGAL). For clustering the points wechoose the clustering analysis packages from R platform basedon Gaussian mixture model, which is an iterative expectation-maximization (EM) processing method for determining maximumlikelihood via a statistical model (Reynolds, 2009). We here fo-cus on the feasibility of applying this to PCD clustering, ratherthan discussing a detailed statistical algorithm for the Gaussianmixture model. The Gaussian mixture model is an option for han-dling PCD clustering that can provide an unsupervised solution.After resolving the clusters, the complexity of PCD is highly re-duced. Leaf is considered as a fitting plane which is computedfrom computational geometry algorithms. Leaf surface is recon-structed according to the points by using triangulation algorithm,which is a commonly employed technique of computational sci-ence.
This study aims to investigate the feasibility for retrieving theeffective LAI from PCD, which using the combination of com-putational geometry application and distribution-based clusteringalgorithm. The data processing is as follows: first, we estimatethe PCD curvature and set the curvature threshold for filteringthe non-photosynthetic structure. Second, we discrete the filteredPCD into voxel matrices that can hold even the largest leaf, thencluster the PCD in each voxel according to the Gaussian mix-ture model. Third, we reconstruct the surface of each cluster ineach voxel by using the computational geometry algorithm. Theaccumulation of the entire canopy clusters area is taken as the ef-fective leaf area of the tree, which is calculated according to thedifferent observation geometry. The effective LAI is finally cal-culated which is the ratio of the effective leaf area of the canopyand the volume from the convex hull of the entire canopy.
Five parts are presented in this paper. In the second part we in-troduce the data collection, theoretical foundations and data pro-cessing. Thirdly, we show some results, including the validationexperiment and retrieved effective LAI of an isolated broad leaftree. We discuss several issues related to the study in the fourthpart; finally a conclusion will be made.
ISPRS Annals of the Photogrammetry, Remote Sensing and Spatial Information Sciences, Volume II-7, 2014ISPRS Technical Commission VII Symposium, 29 September – 2 October 2014, Istanbul, Turkey
This contribution has been peer-reviewed. The double-blind peer-review was conducted on the basis of the full paper.doi:10.5194/isprsannals-II-7-23-2014 24

2. MATERIALS AND METHODOLOGY
2.1 Data Collection
A well-isolated broad leaf tree (Cinnamomum Camphora, Fig-ure 1a ) was used in this study, which is located in Kyoto Uni-versity Katsura Campus (N34◦58′55.61′′, E135◦40′43.54′′) inKyoto Prefecture, Japan. We set six directions around the treefor collecting data. Raw data were assigned to an assumed co-ordinate system, in which the original point was set to the firststation (ScanPos001). Cartesian coordinates (x, y, z) units werein meters (m) (Figure 1b). Both vertical and horizontal scanningintervals were set to 0.02◦.
2.2 Methodology
2.2.1 Simplified Curvature Estimation: PCD give the aver-age Cartesian or polar coordinates of the object surface patch.The curvature of a point can therefore be estimated by consid-ering the normals of its neighboring points. Assume there is apoint set PN
* which contains N points, whose element pi* is
the 3-D coordinates (x, y, z) of the Cartesian space. The amountof the point is determined by both vertical and horizontal scan-ning intervals. The set of neighboring points Pn is determinedby the searching radius r centering on the query point pq , whichis Pn = {pi : ‖pq − pi‖2 ≤ r} , (i = 1, 2, ..., n). A simplifiedcurvature cq of point pq is given by (Rusu, 2009):
cq =λ1
λ1 + λ2 + λ3, (λ1 ≤ λ2 ≤ λ3), (1)
where λj(j = 1, 2, 3) is the eigenvalue given by Cov · xj =λj ·xj , Cov is the covariance matrix of Pn determined by Cov =
1n
n∑i=1
(pi − p)(pi − p)T, xj is the eigenvector of Cov. p is the
center of Pn, which is given by:
p =1
n
n∑i=1
pi. (2)
2.2.2 Gaussian Mixture Model: Voluminous points amountand complexity are the principal property of PCD. PCD carry theCartesian coordinates from the patch of an object interacting withthe laser impulse by receiving objects surface echo. Points there-fore correspond to heterogeneous distributions, like multivariateclusters, of discrete objects within a sample space according totheir positions. Exploring constructional information is one of themajority purposes for PCD users. We used the mclust package ofthe R platform to cluster the point set observations for reducingthe complexity of the PCD. It provides functions for model-basedclustering (covariance parameterization and number of clustersselected via Bayesian information criterion (BIC)), which givesthe maximized loglikelihood for the number of components in thedata. In general, the larger value of BIC, the stronger the evidencefor the number of clusters (Fraley et al., 2012). It attempted to it-erate group sets of objects according to a rule stating that objectswithin the same cluster were more optimized to each other thanthose in other groups. The detailed algorithm explanation waspresented by the articles (Fraley and Raftery, 1998, Fraley andRaftery, 2002).
2.2.3 Leaf Orientation Retrieving: This study assumed thatone leaf is a fitting plane retrieved from point cluster which wasobtained by mclust (see 2.2.2). We chose the principal com-ponent analysis routine from CGAL to calculate the plane (Al-liez et al., 2014). Suppose the plane equation we computed is:Ax + By + Cz + D = 0. The orientation of the plane can becalculated by:
θL =
{arccos( C
‖np‖2 ) : C ≥ 0
π − arccos( C‖np‖2 ) : C < 0
,
ϕL = arccos(A√
A2 +B2),
(3)
where ‖np‖2 =√A2 +B2 + C2, θL and ϕL are the zenith
and azimuth angle of the plane normal, respectively. Leaf normalcalculation is a key step to retrieve the leaf area we discuss in fol-lowing section.
2.2.4 Effective Leaf Area Calculation: In order to find thegeometrical boundary of the cluster, the 3-D convex hull functionof CGAL for generating the convex hull, which contained all thepoints of the cluster, was selected (Hert and Schirra, 2014). As-sume the convex hull contains m points as vertices, the leaf areacan be approximately calculated as the topological closure of thepoints that vertices projected on the fitting plane which we com-puted from section 2.2.3.
Suppose PV = {pk(xk, yk, zk) : k = 1, 2, ...,m} are the ver-tices projection on the fitting plane, the center pv(xv, yv, zv) ofPV can be calculated by (2). If the points are ordered sequently,according to the triangulation mesh function of CGAL, the leafarea could be computed by accumulating the triangles:
S =
m∑l=1
sl, (4)
where sl is the triangle area constructed by pv , pk and pk+1.When k = m, pk+1 = p1. Those points inside the closure areskipped. The effective leaf area S* can be computed by consid-ering the projection coefficient (Ross, 1981):
S* = cos−−→rLrvS,
cos−−→rLrv = cos θv cos θL + sin θv sin θL cos(ϕv − ϕL),(5)
where rv(θv, ϕv) and rL(θL, ϕL) are view direction and leafnormal, respectively.
2.3 Data Processing
Effective leaf area retrieving algorithm was designed as follows(Figure 2). We calculated the simplified curvature of each point,see (1), and then defined the searching radius r (r = 4cm) ac-cording to the average long axis of the leaves. Points whosecq > T1 (T1 = 0.21) were taken as D1, which were mostly fromleaves, and points whose cq ≤ T1 were taken as D2 (Figure 3c).In D2, there were points from leaves as well, which should berestored to D1. Hence we detected the D2 points within a sphere(the radius is T2 = 0.01m), which centered at each point of D1.The point(s) in D2 located in each sphere were merged to D1 asleaf data (Figure 3d). The leaf data were voxelized with each lat-tice size 8×8×8 cm, which could contain the maximum leaf size.The data within each voxel were clustered according to section2.2.2. Those clusters containing less than thirty (T3 = 30) points
ISPRS Annals of the Photogrammetry, Remote Sensing and Spatial Information Sciences, Volume II-7, 2014ISPRS Technical Commission VII Symposium, 29 September – 2 October 2014, Istanbul, Turkey
This contribution has been peer-reviewed. The double-blind peer-review was conducted on the basis of the full paper.doi:10.5194/isprsannals-II-7-23-2014 25

Figure 2: Data processing algorithm.
were rejected due to the possibility of low reliability. The leafarea were calculated for each cluster according to section 2.2.4,and then the accumulated area for entire canopy was calculated.Finally the effective LAI was computed according to proposed6× 6 observation directions.
3. RESULTS AND VALIDATION
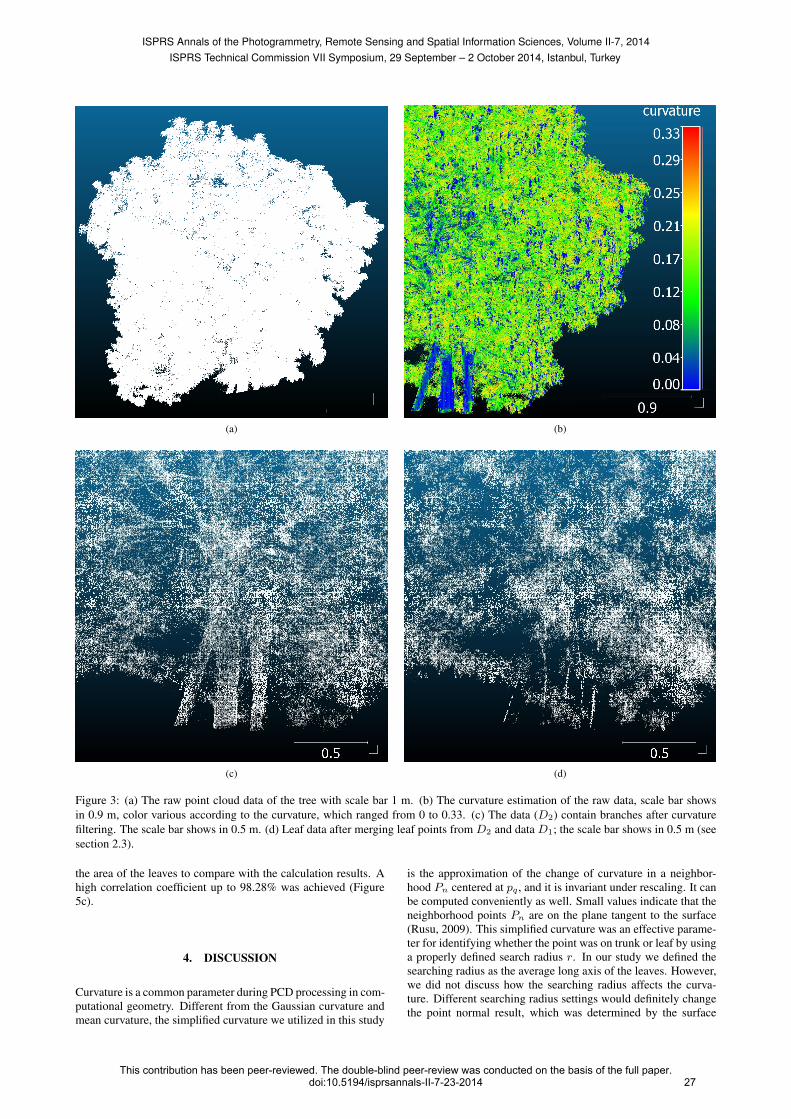
Raw data points amount was over 9.7×10⁶ (Figure 3a). Aftercurvature estimation (Figure 3b), 76.13% data were rejected ac-cording to the threshold, many of them were from leaves. There-fore, we employed the method in 2.3 to restore the excessively re-moved points. The result of rejected data and leaf data are shownin Figure 3c and 3d, individually. The leaf data accordingly in-creased to 52.33% and the opposite data were 47.67%. The leafdata were effectively restored.
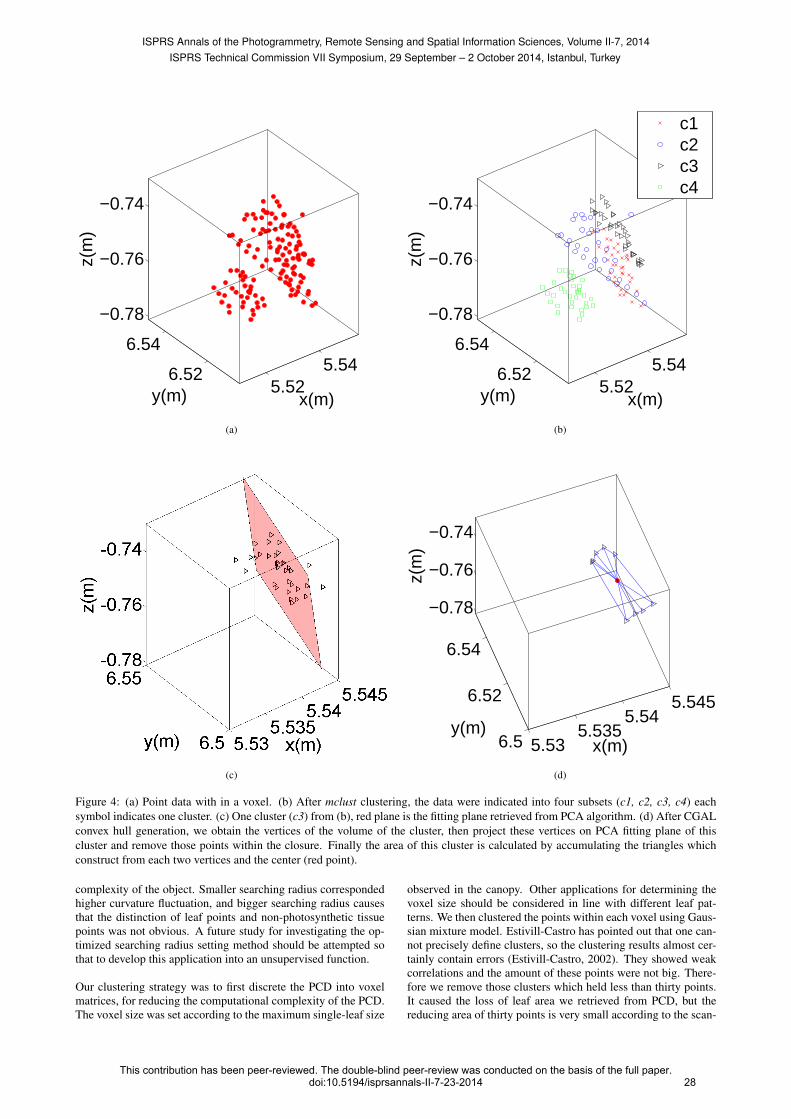
The algorithm of data processing within a voxel is indicated inFigure 4. The initial condition of the data in the voxel is shown inFigure 4a, which is out-of-order arranged. After mclust function(see 2.2.2) processing, points were distinguished into four clus-ters: c1, c2, c3 and c4 (Figure 4b). We picked one (c3) of them asan example for retrieving the cluster area, red plane (Figure 4c)was obtained by using PCA function of CGAL (see 2.2.3). First,we generated the convex hull of this cluster by using 3-D convexhull generation function from CGAL, then obtained the verticesof this convex hull. Vertices were projected on the fitting plane ofthe cluster and those points within the convex hull were removed.Finally the area of this cluster was calculated by accumulatingthe triangles which are constructed from each two vertices and
the center (red point in Figure 4d). The volume of this canopywas calculated as V = 33.918 m3 from 3-D convex hull as well.For the light travel length we assumed the canopy was containedby a sphere, according the maximum and minimum coordinatesof the PCD, we calculated the effective LAI by:
ELAI =Dη
V,
D =∆x+ ∆y + ∆z
3,
η =
I∑χ=1
J∑ω=1
S*χω,
∆x = xmax − xmin,
∆y = ymax − ymin,
∆z = zmax − zmin,
(6)
where D is the average light traveling distance, η is the effectiveleaf area of the entire canopy, χ is the index of the voxel (from1 to I), ω is the index of the cluster within the χth voxel (from1 to J), S*
χω is the effective area of each cluster within a voxel,∆x = 4.64 m, ∆y = 4.61 m, ∆z = 4.79 m, respectively.
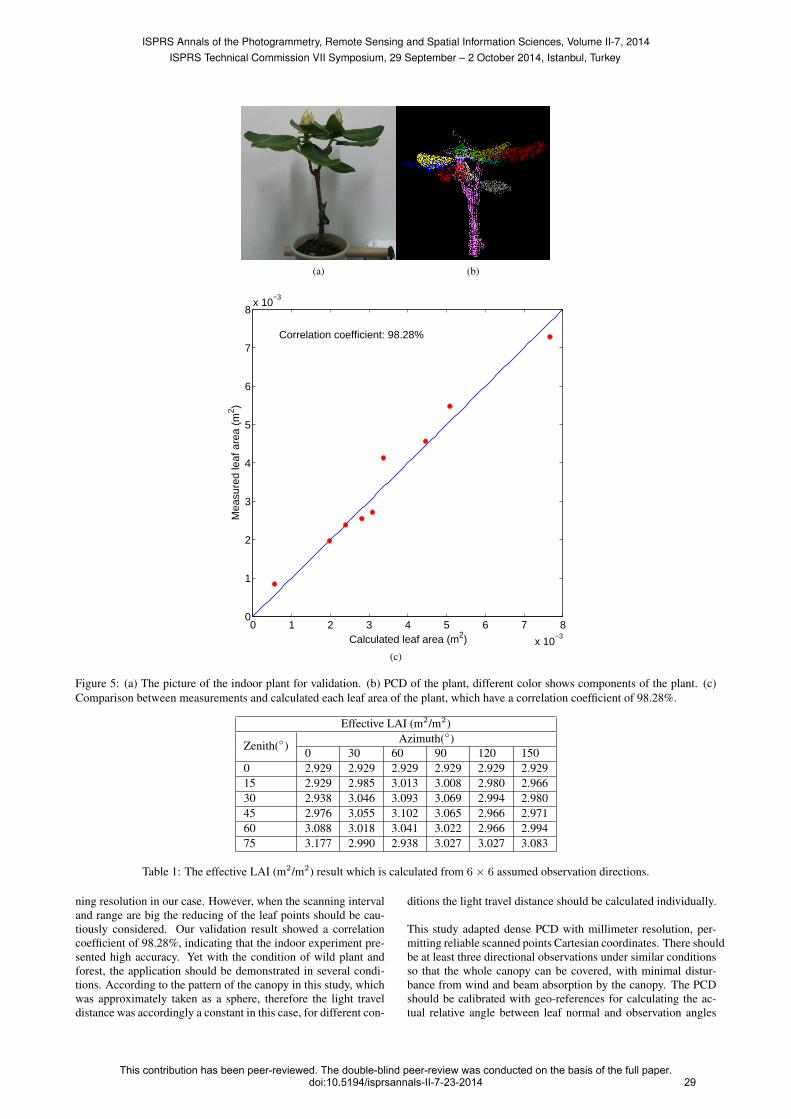
The effective LAI of the tree was calculated from 6×6 assumedobservation directions (Table 1). It was indicated that our calcu-lation can precisely provide effective LAI estimation accordingto the variation of the observation directions. Due to the lack ofthe resource we cannot accurately measure the total leaf area ofthe tree we selected. We assessed the application using an indoorplant (Figure 5a) and marked down nine well-isolated leaves be-fore this plant was scanned (Figure 5b). We manually measured
ISPRS Annals of the Photogrammetry, Remote Sensing and Spatial Information Sciences, Volume II-7, 2014ISPRS Technical Commission VII Symposium, 29 September – 2 October 2014, Istanbul, Turkey
This contribution has been peer-reviewed. The double-blind peer-review was conducted on the basis of the full paper.doi:10.5194/isprsannals-II-7-23-2014 26
(a)
(b)
(c) (d)
Figure 3: (a) The raw point cloud data of the tree with scale bar 1 m. (b) The curvature estimation of the raw data, scale bar showsin 0.9 m, color various according to the curvature, which ranged from 0 to 0.33. (c) The data (D2) contain branches after curvaturefiltering. The scale bar shows in 0.5 m. (d) Leaf data after merging leaf points from D2 and data D1; the scale bar shows in 0.5 m (seesection 2.3).
the area of the leaves to compare with the calculation results. Ahigh correlation coefficient up to 98.28% was achieved (Figure5c).
4. DISCUSSION
Curvature is a common parameter during PCD processing in com-putational geometry. Different from the Gaussian curvature andmean curvature, the simplified curvature we utilized in this study
is the approximation of the change of curvature in a neighbor-hood Pn centered at pq , and it is invariant under rescaling. It canbe computed conveniently as well. Small values indicate that theneighborhood points Pn are on the plane tangent to the surface(Rusu, 2009). This simplified curvature was an effective parame-ter for identifying whether the point was on trunk or leaf by usinga properly defined search radius r. In our study we defined thesearching radius as the average long axis of the leaves. However,we did not discuss how the searching radius affects the curva-ture. Different searching radius settings would definitely changethe point normal result, which was determined by the surface
ISPRS Annals of the Photogrammetry, Remote Sensing and Spatial Information Sciences, Volume II-7, 2014ISPRS Technical Commission VII Symposium, 29 September – 2 October 2014, Istanbul, Turkey
This contribution has been peer-reviewed. The double-blind peer-review was conducted on the basis of the full paper.doi:10.5194/isprsannals-II-7-23-2014 27
5.525.546.52
6.54
−0.78
−0.76
−0.74
x(m)y(m)
z(m
)
(a)
5.525.546.52
6.54
−0.78
−0.76
−0.74
x(m)y(m)
z(m
)
c1c2c3c4
(b)
(c)
5.535.535
5.545.545
6.5
6.52
6.54
−0.78
−0.76
−0.74
x(m)y(m)
z(m
)
(d)
Figure 4: (a) Point data with in a voxel. (b) After mclust clustering, the data were indicated into four subsets (c1, c2, c3, c4) eachsymbol indicates one cluster. (c) One cluster (c3) from (b), red plane is the fitting plane retrieved from PCA algorithm. (d) After CGALconvex hull generation, we obtain the vertices of the volume of the cluster, then project these vertices on PCA fitting plane of thiscluster and remove those points within the closure. Finally the area of this cluster is calculated by accumulating the triangles whichconstruct from each two vertices and the center (red point).
complexity of the object. Smaller searching radius correspondedhigher curvature fluctuation, and bigger searching radius causesthat the distinction of leaf points and non-photosynthetic tissuepoints was not obvious. A future study for investigating the op-timized searching radius setting method should be attempted sothat to develop this application into an unsupervised function.
Our clustering strategy was to first discrete the PCD into voxelmatrices, for reducing the computational complexity of the PCD.The voxel size was set according to the maximum single-leaf size
observed in the canopy. Other applications for determining thevoxel size should be considered in line with different leaf pat-terns. We then clustered the points within each voxel using Gaus-sian mixture model. Estivill-Castro has pointed out that one can-not precisely define clusters, so the clustering results almost cer-tainly contain errors (Estivill-Castro, 2002). They showed weakcorrelations and the amount of these points were not big. There-fore we remove those clusters which held less than thirty points.It caused the loss of leaf area we retrieved from PCD, but thereducing area of thirty points is very small according to the scan-
ISPRS Annals of the Photogrammetry, Remote Sensing and Spatial Information Sciences, Volume II-7, 2014ISPRS Technical Commission VII Symposium, 29 September – 2 October 2014, Istanbul, Turkey
This contribution has been peer-reviewed. The double-blind peer-review was conducted on the basis of the full paper.doi:10.5194/isprsannals-II-7-23-2014 28
(a) (b)
0 1 2 3 4 5 6 7 8
x 10−3
0
1
2
3
4
5
6
7
8x 10
−3
Calculated leaf area (m2)
Mea
sure
d le
af a
rea
(m2 )
Correlation coefficient: 98.28%
(c)
Figure 5: (a) The picture of the indoor plant for validation. (b) PCD of the plant, different color shows components of the plant. (c)Comparison between measurements and calculated each leaf area of the plant, which have a correlation coefficient of 98.28%.
Effective LAI (m2/m2)
Zenith(◦)Azimuth(◦)
0 30 60 90 120 1500 2.929 2.929 2.929 2.929 2.929 2.92915 2.929 2.985 3.013 3.008 2.980 2.96630 2.938 3.046 3.093 3.069 2.994 2.98045 2.976 3.055 3.102 3.065 2.966 2.97160 3.088 3.018 3.041 3.022 2.966 2.99475 3.177 2.990 2.938 3.027 3.027 3.083
Table 1: The effective LAI (m2/m2) result which is calculated from 6× 6 assumed observation directions.
ning resolution in our case. However, when the scanning intervaland range are big the reducing of the leaf points should be cau-tiously considered. Our validation result showed a correlationcoefficient of 98.28%, indicating that the indoor experiment pre-sented high accuracy. Yet with the condition of wild plant andforest, the application should be demonstrated in several condi-tions. According to the pattern of the canopy in this study, whichwas approximately taken as a sphere, therefore the light traveldistance was accordingly a constant in this case, for different con-
ditions the light travel distance should be calculated individually.
This study adapted dense PCD with millimeter resolution, per-mitting reliable scanned points Cartesian coordinates. There shouldbe at least three directional observations under similar conditionsso that the whole canopy can be covered, with minimal distur-bance from wind and beam absorption by the canopy. The PCDshould be calibrated with geo-references for calculating the ac-tual relative angle between leaf normal and observation angles
ISPRS Annals of the Photogrammetry, Remote Sensing and Spatial Information Sciences, Volume II-7, 2014ISPRS Technical Commission VII Symposium, 29 September – 2 October 2014, Istanbul, Turkey
This contribution has been peer-reviewed. The double-blind peer-review was conducted on the basis of the full paper.doi:10.5194/isprsannals-II-7-23-2014 29

for computing the effective leaf area.
5. CONCLUSION
This study retrieved effective LAI, a key canopy structure pa-rameter, using terrestrial scanned PCD. It is an important fac-tor in vegetation structural investigations and canopy radiativetransfer simulations. In contrast to previous studies, we inno-vatively utilized simplified curvature as the threshold for filter-ing the non-photosynthetic components. PCD were clustered bymclust, which is a Gaussian mixture model based package of theR platform. An important aspect of this method was the manipu-lation of computational geometry algorithm for curvature estima-tion and effective leaf area retrieving. Good agreements betweenmeasurement and our calculation were obtained by conductingan indoor experiment of a plant. The correlation coefficient wasin the range of 98.28%. Due to the sufficient accuracy of TLS,the results of this study could be taken as a validation of opticalsensor based LAI estimation. In future research, we will attemptto apply our curvature-cluster application on investigating foresteffective LAI. We believe that laser scanning based phytomet-ric techniques have more advantages than many optical sensorbased applications. With the development of laser scanning tech-niques, the efficiency and accuracy of TLS will be improved; andforest parameterization and investigation techniques will be sub-stantially improved as well.
ACKNOWLEDGEMENTS
The authors express their gratitude to Mr. Masayasu Maki andMr. Amane Kuriki for their advice, to Mr Duminda RanganathWelikanna, Alexandros Kordonis and Chandana Dinesh for theirhelp in proofreading, and to our lab members for supporting thiswork.
REFERENCES
Alliez, P., Pion, S. and Gupta, A., 2014. Principal ComponentAnalysis. In: CGAL User and Reference Manual, 4.4 edn, CGALEditorial Board.
Chen, J. M. and Cihlar, J., 1996. Retrieving Leaf Area Indexof Boreal Conifer Forests Using Landsat TM Images. RemoteSensing of Environment 55(2), pp. 153 – 162.
Colombo, R., Bellingeri, D., Fasolini, D. and Marino, C. M.,2003. Retrieval of Leaf Area Index in Different Vegetation TypesUsing High Resolution Satellite Data. Remote Sensing of Envi-ronment 86(1), pp. 120 – 131.
Estivill-Castro, V., 2002. Why So Many Clustering Algorithms:A Position Paper. ACM SIGKDD Explorations Newsletter 4(1),pp. 65–75.
Fabio, R., 2003. From Point Cloud to Surface: the Modelingand Visualization Problem. International Archives of Photogram-metry, Remote Sensing and Spatial Information Sciences 34(5),pp. W10.
Fraley, C. and Raftery, A. E., 1998. How Many Clusters? WhichClustering Method? Answers via Model-Based Cluster Analysis.The Computer Journal 41(8), pp. 578–588.
Fraley, C. and Raftery, A. E., 2002. Model-based clustering, dis-criminant analysis, and density estimation. Journal of the Amer-ican Statistical Association 97(458), pp. 611–631.
Fraley, C., Raftery, A. E., Murphy, T. B. and Scrucca, L., 2012.MCLUST version 4 for R: Normal Mixture Modeling for Model-Based Clustering, Classification, and Density Estimation. Tech-nical Report 597, Department of Statistics, University of Wash-ington.
Hernndez, C., Nunes, L., Lopes, D. and Graa, M., 2014. DataFusion for High Spatial Resolution LAI Estimation. InformationFusion 16(0), pp. 59 – 67. Special Issue on Information Fusionin Hybrid Intelligent Fusion Systems.
Hert, S. and Schirra, S., 2014. 3D convex hulls. In: CGAL Userand Reference Manual, 4.4 edn, CGAL Editorial Board.
Hosoi, F. and Omasa, K., 2006. Voxel-Based 3-D Modeling ofIndividual Trees for Estimating Leaf Area Density Using High-Resolution Portable Scanning Lidar. IEEE Transactions on Geo-science and Remote Sensing 44(12), pp. 3610–3618.
Jonckheere, I., Fleck, S., Nackaerts, K., Muys, B., Coppin, P.,Weiss, M. and Baret, F., 2004. Methods for Leaf Area Index De-termination. Part I: Theories, Techniques and Instruments. Agri-culture and Forest Meteorology 121, pp. 19–35.
Korhonen, L., Korpela, I., Heiskanen, J. and Maltamo, M., 2011.Airborne Discrete-return LiDAR Data in the Estimation of Verti-cal Canopy Cover, Angular Canopy Closure and Leaf Area Index.Remote Sensing of Environment 115(4), pp. 1065 – 1080.
Lang, A. and Xiang, Y., 1986. Estimation of Leaf Area Indexfrom Transmission of Direct Sunlight in Discontinuous Canopies.Agricultural and Forest Meteorology 37(3), pp. 229 – 243.
Morsdorf, F., Kotz, B., Meier, E., Itten, K. and Allgower, B.,2006. Estimation of LAI and Fractional Cover from Small Foot-print Airborne Laser Scanning Data Based on Gap Fraction. Re-mote Sensing of Environment 104(1), pp. 50–61.
Pearcy, R. W., Ehleringer, J. R., Mooney, H. A., Rundel, P. W.et al., 1989. Plant Physiological Ecology: Field Methods andInstrumentation. Chapman and Hall Ltd.
Reynolds, D., 2009. Gaussian Mixture Models. Encyclopedia ofBiometrics pp. 659–663.
Ross, J., 1981. The Radiation Regime and Architecture of PlantStands. Tasks for vegetation science, Dr W. Junk.
Rusu, R. B., 2009. Semantic 3D Object Maps for Everyday Ma-nipulation in Human Living Environments. PhD thesis, Technis-chen Universitt Mnchen, Faculty of computer science. An op-tional note.
Watson, D. J., 1947. Comparative Physiological Studies on theGrowth of Field Crops: I. Variation in Net Assimilation Rateand Leaf Area between Species and Varieties, and within andbetween Years. Annals of Botany 11(1), pp. 41–76.
Weiss, M., Baret, F., Smith, G., Jonckheere, I. and Coppin, P.,2004. Review of Methods for in situ Leaf Area Index (LAI) De-termination: Part II. Estimation of LAI, Errors and Sampling.Agricultural and Forest Meteorology 121(12), pp. 37 – 53.
Welles, J. M. and Cohen, S., 1996. Canopy Structure Measure-ment by Gap Fraction Analysis Using Commercial Instrumenta-tion. Journal of Experimental Botany 47(9), pp. 1335–1342.
Zheng, G. and Moskal, L. M., 2009. Retrieving Leaf Area Index(LAI) Using Remote Sensing: Theories, Methods and Sensors.Sensors 9(4), pp. 2719–2745.
Zheng, G. and Moskal, L. M., 2012. Computational-Geometry-Based Retrieval of Effective Leaf Area Index Using TerrestrialLaser Scanning. IEEE Transactions on Geoscience and RemoteSensing 50(10), pp. 3958–3969.
Revised July 2014
ISPRS Annals of the Photogrammetry, Remote Sensing and Spatial Information Sciences, Volume II-7, 2014ISPRS Technical Commission VII Symposium, 29 September – 2 October 2014, Istanbul, Turkey
This contribution has been peer-reviewed. The double-blind peer-review was conducted on the basis of the full paper.doi:10.5194/isprsannals-II-7-23-2014 30