Defining comprehension strategies and instructional strategies

The University of Southern MississippiThe Aquila Digital Community
Dissertations
12-2014
Effective Instructional Strategies Utilized inSuccessful and High Performing SecondarySchools in the Southern Region of MississippiJeanifer Lynn PearsonUniversity of Southern Mississippi
Follow this and additional works at: http://aquila.usm.edu/dissertationsPart of the Educational Assessment, Evaluation, and Research Commons, Educational Methods
Commons, and the Elementary and Middle and Secondary Education Administration Commons
This Dissertation is brought to you for free and open access by The Aquila Digital Community. It has been accepted for inclusion in Dissertations by anauthorized administrator of The Aquila Digital Community. For more information, please contact [email protected].
Recommended CitationPearson, Jeanifer Lynn, "Effective Instructional Strategies Utilized in Successful and High Performing Secondary Schools in theSouthern Region of Mississippi" (2014). Dissertations. Paper 1.
The University of Southern Mississippi
EFFECTIVE INSTRUCTIONAL METHODS UTILIZED IN SUCCESSFUL
AND HIGH PERFORMING SECONDARY SCHOOLS IN
THE SOUTHERN REGION OF MISSISSIPPI
by
Jeanifer Lynn Pearson
Abstract of a Dissertation Submitted to the Graduate School
of The University of Southern Mississippiin Partial Fulfillment of the Requirements
for the Degree of Doctor of Philosophy
December 2014

ii
ABSTRACT
EFFECTIVE INSTRUCTIONAL METHODS UTILIZED IN SUCCESSFUL
AND HIGH PERFORMING SECONDARY SCHOOLS IN
THE SOUTHERN REGION OF MISSISSIPPI
by Jeanifer Lynn Pearson
December 2014
The schools in the United States have implemented measures intended to close the
achievement gap for over fifty years (Solomon, 2009). The mandates handed down by
the federal government cannot be altered. Therefore, schools are required to determine
specific measures that increase student academic success. Prior research has
demonstrated that schools can be successful if effective leadership at the district, school,
and classroom level was present (Gregory, 2003; Johnson, Livingston, & Schwartz,
2000). At the classroom level, it was the leadership of the individual teacher to
determine the creation of innovative techniques aimed at academic success of all students
(Farr & Teach for America, 2010).
The purpose of this quantitative study was to determine the effect that specific
researched based instructional methods, assessments, and student learning methods had
on student academic achievement as measured by school accountability rankings. The
study included seven high performing and 15 successful secondary schools in south
Mississippi that were located in districts that had a minimum of 70% of its student body
that received free or reduced lunch. Data was collected using a purposeful, voluntary
survey. Based upon the findings of this study, no significant differences were found in the
instructional practices, assessments, or student learning methods utilized by the teachers
iii
at high poverty successful schools and high poverty, high performing schools. For this
study, findings indicated that the teachers from the identified schools utilized research
based instructional strategies such as practice on a specific skill, vocabulary, and
checking for understanding. In addition, the findings indicated that the teachers used
technology to aid in their instruction. Finally, the teachers noted the positive results in
student achievement that resulted from being under the supervision of a visible effective
principal. As an effective instructional leader, it is the principal who ultimately
determined the culture for the school, and for a school to be successful that culture must
be focused on teaching and learning.

COPYRIGHT BY
JEANIFER LYNN PEARSON
2014
The University of Southern Mississippi
EFFECTIVE INSTRUCTIONAL METHODS UTILIZED IN SUCCESSFUL
AND HIGH PERFORMING SECONDARY SCHOOLS IN
THE SOUTHERN REGION OF MISSISSIPPI
by
Jeanifer Lynn Pearson
A Dissertation Submitted to the Graduate School
of The University of Southern Mississippiin Partial Fulfillment of the Requirements
for the Degree of Doctor of Philosophy
Approved:
Dr. David Lee________________________
Dr. J. T. Johnson______________________
Dr. Leslie Locke_________________
Dr. Chuck Benigno____________________
Dr. Karen Coats______________________Dean of the Graduate School
December 2014

iv
DEDICATION
The completion of this dissertation and doctoral degree has been a long journey.
Many days have passed in which I felt like quitting, but I knew that I would only regret
that decision. I want to thank my Lord and Savior Jesus Christ for the abundance of
blessings in my life. I want to thank my parents for their continued support and guidance.
I have had a lot of cheerleaders and supporters along the way including my Aunt Mary,
Uncle Clyde, Stephanie H., and Daniel W. who helped with Aiden or just offered a push
when needed. Thank you all! I dedicate this dissertation to two of the most influential
people who I have had the honor of calling family. First and foremost, to the man who I
have loved since I was a young girl, Jamie. You were my first love, and the voice inside
my head telling me to persevere when I felt like giving up. You were and always will be
my sweetpea. I would also like to dedicate this dissertation to my Aunt Diane. My Aunt
Diane was the woman I admired and modeled my life after. She instilled in me the
importance of family, education, and independence. I only wish that both of you could be
in the audience the day that I finally walk across that stage to receive my degree. Thank
you both for loving me and accepting me. I love and miss you every second of the day.
Finally, I would like to dedicate this dissertation to my son, Aiden, who has helped me to
realize my purpose. My life is brighter and more fun with your presence, and I thank God
every day that you are my son. I love you to the moon and back.
v
ACKNOWLEDGMENTS
I want to thank my committee members, Dr. David Lee, Dr. Leslie Locke, Dr. J.
T. Johnson, and Dr. Chuck Benigno. I could not have asked for a better support team. I
am extremely grateful and so appreciative of Dr. J. T. Johnson and his remarkable
statistics guidance.

vi
TABLE OF CONTENTS
ABSTRACT …………………………………………………………………………..… ii
DEDICATION ………………………………………………….………………………. iv
ACKNOWLEDGMENTS ……………………………………….………..…………..… v
LIST OF TABLES …………………………………….………….………………..…. viii
LIST OF ABBREVIATIONS ………………………………………………………...… ix
CHAPTER
I. INTRODUCTION.......................................................................................1
Background Statement of the Problem Purpose of the Study Research Questions Definition of Terms Delimitations Assumptions Justification of the Study Summary
II. REVIEW OF RELATED LITERATURE……………………………… 19
Introduction Theoretical FrameworkHistorical PerspectiveElementary and Secondary Education Act and Title IA Nation at RiskThe Education SummitGoals 2000Reauthorization of the Elementary and Secondary Education ActImproving American Schools ActNo Child Left BehindAdequate Yearly Progress Accountability MeasuresPoverty and Student AchievementAchievement GapHigh-Performing, High-Poverty SchoolsEffective Instructional StrategiesSummary

vii
III. METHODOLOGY ..........................................................................……. 59
OverviewResearch DesignParticipantsInstrumentationResearch QuestionsData CollectionData AnalysisSummary
IV. RESULTS …………………………………………………...………..... 69
IntroductionStatistical AnalysisSummary
V. CONCLUSIONS AND RECOMMENDATIONS ……………………. 84
IntroductionDiscussion and ConclusionsLimitationsRecommendations for Policy or PracticeRecommendations for Further Research Summary
APPENDIXES …………………………………………………………………………..95
REFERENCES ……………………………………………………………….………. 116

viii
LIST OF TABLES
Table
1. Mississippi Statewide Accountability System (2009-2012) ……….………….… 6
2. 2009-2012 QDI Range Increase …………………………………………………. 7
3. Identified Schools Accountability Rankings, QDI, and District Poverty Rate.... 61
4. Type of Certification and School Ranking .......................................................... 70
5. Teacher Experience and School Ranking ............................................................ 72
6. Highest Level Degree Earned and School Ranking………………………….…. 73
7. Means and Standard Deviations for Emphasis Placed on Specific Instructional Practices …………………………………………………………. ……………. 75
8. Means and Standard Deviations for Frequency of Use of Specific Instructional Practices …………………………………………………………………..….… 76
9. Means and Standard Deviations for the Extent of Type of Assessments to Determine Progress …………………………………………………………….. 78
10. Means and Standard Deviations for the Frequency of Student Engagement in Selected Activities ……………………………………………………………... 79
ix
LIST OF ABBREVIATIONS
AYP Adequate Yearly Progress
ESEA Elementary and Secondary Education Act
HSCI High School Completion Index
IASA Improving America’s Schools Act
MANOVA Multivariate Analysis of Variance
MCT Mississippi Curriculum Test
MDE Mississippi Department of Education
NAEP National Assessment of Educational Progress
NAR A Nation at Risk
NCLB No Child Left Behind
QDI Quality Distribution Index
SATP Subject Area Testing Program
SEF Southern Education Fund
SES Socioeconomic Status

1
CHAPTER I
INTRODUCTION
The United States Bureau of the Census defined the poverty rate for a family of
four by those who had an annual income of $23,492 or less (National Center for Law and
Economic Justice, 2012). In 2012, 46.5 million people lived in poverty in the United
States and of those individuals, 21.8% were under the age of 18 (National Center for Law
and Economic Justice, 2012). Students of poverty who are not provided an adequate
education to overcome the circumstances of their birth “may become a burden to our
society by draining our social services and our health care system and fill our prisons”
(Tileston & Darling, 2009, p. 17).
Studies that explored the effects of educational achievement and socioeconomic
status found a strong correlation between areas of concentrated poverty and low
achievement (Capraro, Capraro, & Wiggins, 2000; Jacobson, Olsen, King- Rice, &
Sweetland, & Ralph, 2001; Webster, Young, & Fisher, 1999). A study conducted by
Brooks-Gunn, Duncan, and Maritato (1997) reported that poor families were more likely
to live in neighborhoods with other poor families, and Black and Latino children were
more likely to experience living in poverty for longer periods of time than Whites.
Furthermore, schools in poor neighborhoods lacked access to fewer resources and
typically did not staff teachers who were highly qualified and experienced.
The inequalities associated with educational accountability across racial and
ethnic groups are not a new topic in education. The public’s interest in closing the
achievement gap and improving student achievement is at an all-time high. State and
federal policymakers, business leaders, community members, as well as parents place
2
high demands on public schools for high standards and accountability. For example, the
Federal No Child Behind Act of 2001 held schools and districts liable for meeting yearly
growth in the achievement of all students, including students with English as a second
language, disabilities, underprivileged, and those from various racial and ethnic groups
(U. S. Department of Education, 2002).
For Mississippians, improving educational equality and closing the achievement
gap are essential for the growth and financial success of the state. Mississippi schools
must ensure that the students have the education needed to succeed in a world economy
in the 21st century. According to a study conducted by The Southern Education
Foundation (SEF) in 2009, Mississippi had the “highest poverty rate in the nation and
ranks 49th in the nation in per capita income” (p. 9). Mississippians earned $9,570 less
than the average American in 2005. The SEF also reported that 53% of the difference in
income was “due solely to the state’s lower levels of education” (p. 9). Mississippi K-12
public schools and districts enrolled a student body that was 50% Black (SEF, 2009). In
2010, almost two-thirds of the 490,000 students in Mississippi were eligible for free or
reduced meal prices, an indication of poverty (National Center for Education Statistics,
2010).
In the upcoming chapter, various topics related to the achievement gap will be
introduced and discussed. The achievement gap in relation to the effect it has on
educational reform at both state and federal levels, and determining its importance to
bring about change to the educational system will be addressed. Furthermore,
information on the achievement gap in Mississippi will be analyzed and presented as
justification for the study.
3
Background
The expression “achievement gap” invokes different ideas to different people. To
some individuals, it referred to the achievement gap between Black students and White
students at all income levels. To others, the gap refers to the difference in achievement
between male and female students or the gap between students of different cultures,
ethnicities, primary languages, or socio-economic statuses (Achievement Gap, 2013).
However, when educators speak of the achievement gap, they are typically referring to
the idea that as a group, poor traditionally underserved students achieve lower scores on
student achievement (Hess & Petrilli, 2009). In general, the achievement gap is the
difference in academic performance between groups of students (Hess & Petrilli, 2009).
The achievement gap is visible in standardized test scores as well as grades, drop-out
rates, college completion rates, and course selection (Ford, Grantham, & Whiting, 2008;
Hess & Petrilli, 2009).
Developing policies that equalized educational outcomes for traditionally
underserved and economically disadvantaged students has been a central objective of
federal and state governments for over fifty years (U. S. Department of Education, 2013).
The federal government’s involvement has been traced back to the Supreme Court’s 1954
Brown v. Board of Education decision to end racial segregation in schools (U. S. Courts,
2010). Initially, federal policymakers were hesitant to become involved in Brown v.
Board of Education (U. S. Courts, 2010). However, their involvement in ending racial
segregation led to the implementation and expansion of policies such as the Elementary
and Secondary Education Act (ESEA) of 1965 (U. S. Courts, 2010).

4
In the 1960s, the student population in the public schools in the United States
changed. According to Orfield (2001), the number of White students enrolled in public
schools declined by 5.6 million since the 1960s, while the number of Black and Latino
students increased by 5.8 million due to “low birth rates and massive immigration” (p.
18). Based on information obtained in the 2000 census, Latinos were the largest
traditionally underserved group in the United States (Orfield, 2001). The Latino student
population had increased their population from 2 million in 1968 to 6.9 million in 1998,
which resulted in a 245% rise in student enrollment (Orfield, 2001). In addition to the
increase of enrollment, an increase in segregation of Black and Latino students had
occurred. Currently, more than 60% of Black and Latino students attended segregated
high poverty, low-performing schools (Orfield, 2001; Orfield & Lee, 2005).
Observing the gap between poor underrepresented groups and their affluent White
peers, Congress approved the education reform package known as No Child Left Behind
(NCLB) in 2001, which increased accountability under Title I of ESEA (U. S.
Department of Education, 2002). Title I was originally designed to close the
achievement gap between low-income and traditionally underserved students by means of
creating and enforcing clear timelines and reporting provisions that required states to
analyze assessment results by poverty, race or ethnicity, disability, and limited English
proficiency (U. S. Department of Education, 2008). NCLB (2001) law required that
students of various racial, income, and language subgroups make “adequate yearly
progress” (AYP) in relation to state-determined proficiency standards (U. S. Department
of Education, 2002). AYP was the method that individual states used to measure student
progress (U. S. Department of Education, 2008). In general, meeting AYP was

5
considered the minimum level of competency for a school’s achievement (U. S.
Department of Education, 2002). Therefore, the law was chiefly planned to center
attention on students who were traditionally underserved by the education system (U. S.
Department of Education, 2002).
Typically, states utilized annual standardized tests in reading/language arts, math,
to determine AYP (U. S. Department of Education, 2008). State and federal governments
measured school success in the state of Mississippi according to student performance on
the Mississippi Subject Area Test Program (MSATP) (Mississippi Department of
Education, 2010b). This criterion-referenced test is based on the Mississippi Curriculum
standards and measures achievement in Algebra I, Biology I, English II, and U.S. History
(Mississippi Department of Education, 2010b).
The State of Mississippi, as part of the accountability system for public schools,
assigned school and district ratings based on student performance on state mandated tests
and academic growth (Mississippi Department of Education, 2012). Using determined
performance standards, the accountability system in Mississippi was designed to increase
the level of accountability for districts and individual schools and to improve student
achievement (Mississippi Department of Education, 2012). In addition, secondary
schools (9-12) rankings included a component for graduation titled high school
completion index (HSCI) (Mississippi Department of Education, 2012). Districts that
served students in grades 9-12 also received classification based on HSCI (Mississippi
Department of Education, 2012).
Mississippi updated the statewide status labels in 2009 (Mississippi Department
of Education, 2010a). The accountability status of a district and school depended upon

6
achievement (QDI), growth, and high school completion (Mississippi Department of
Education, 2010a). The QDI was calculated by multiplying set points for each student’s
scores on statewide assessments: basic (1 point), proficient (2 points), and advanced (3
points) (Mississippi Department of Education, 2010a). The overall QDI was determined
by adding the total points for the three levels (Mississippi Department of Education,
2010a). Depending upon the total QDI calculated and growth, the schools and district
received rankings (Mississippi Department of Education, 2010a) (Table 1). In addition,
the QDI ranges for the top three rankings increased over a three year period (2009-2012)
(Mississippi Department of Education, 2010a) (Table 2).
Table 1
Mississippi Statewide Accountability System (2009-2012)
QDI Ranges Growth
(2009 Values) Not Met Met
200-300 High Performing Star School/District*/
High Performing
166-199 Successful High Performing*/
Successful
133-165 Academic Watch Successful
100-132 At Risk of Failing Academic Watch
Below 100 Failing Low Performing
* Schools and districts without a graduating class are assigned this level.
Note: The Mississippi Accountability system was updated in 2013, and schools no longer utilized this system. Instead, schools were
assigned letter grades (A-F).

7
Table 2
2009-2012 QDI Range Increase
Top Range 200-300 214-300 227-300 240-300
166-199 176-213 185-225 194-239
133-165 138-175 143-184 147-193
100-132 100-137 100-142 100-146
Bottom Range Below 100 Below 100 Below 100 Below 100
Regardless of a century of slight progress in the equalization of academic
outcomes of all children, gaps still remain. White students scored, on average, 26 points
higher than Black students on all of the 2007 National Assessment of Education Progress
(NAEP) assessments (Vanneman, Hamilton, Baldwin-Anderson, & Rahman, 2009).
When comparing the achievement gap between Blacks and Whites on the NAEP from
1992 to 2007, the achievement gap narrowed in fourth grade mathematics in 15 states,
including Mississippi (Vanneman et al., 2009). In eighth grade mathematics, the scores
increased for both Blacks and Whites, but only four states (Arkansas, Oregon, Oklahoma,
and Texas) were able to narrow the gap (Vanneman et al., 2009). Similarly, in fourth
grade reading, scores increased in 13 states, but only three states (Delaware, Florida, and
New Jersey) were able to narrow the gap. However, in eighth grade reading no
significant changes were found in the achievement gap (Vanneman et al., 2009).

8
The achievement gap has clearly been documented to illustrate the difference
between the academic performances of suburban and urban schools when there was an
unequal number of underrepresented minorities (Darling-Hammond, 1999; Jencks &
Phillips, 1998; Ladson-Billings, 1997). The inequality in education was reported in A
Nation at Risk (National Commission for Excellence in Education, 1983), which
presented urgency for the equity of education for diverse populations. The goal of NCLB
was to equalize educational opportunities for all students with the implementation of
stipulations for highly qualified teachers and high academic standards for all students (U.
S. Department of Education, 2002). However, neither reform has resulted in making
substantial gains in academic achievement.
Statement of the Problem
Creating schools that receive high performing rankings has been a part of the
educational tradition for years (Huberman & Miles, 1998). The 90/90/90 Study by
Reeves (2000, 2003) investigated a large number of high poverty (90% free or reduced
price lunch, 90% minority), high performing (90% meeting standards) schools to
determine the measures these schools utilized that resulted in positive student
achievement. From his research, Reeves (2000, 2003) identified five school wide
characteristics universal to each school: (a) reading, writing, and mathematics were
taught across all curricula; (b) recurrent assessments; (c) concentration on school wide
academic achievement; (d) emphasis on writing at every grade level and subject; and (e)
standardization of grading. Reeves (2003) noted that effective educators of children from
poverty were achieving results using various techniques including building positive

9
student-teacher relationships, effective instructional strategies, and differentiated teaching
techniques.
Research conducted by Marzano (2003) examined a small number of high
performing, high poverty schools. Marzano (2003) identified factors at the student,
teacher, and school level that were present in schools that were successful in closing the
achievement gap. At the school level, the center of the curricula emphasis was placed on
teaching and learning. Teachers provided regular feedback, and all students were held to
high expectations. Marzano (2003) reported that a safe school culture involved parents
and community involvement, and school leaders played an important part in the
development of a professional and collegial environment. In addition, Marzano (2003)
reported that the schools that demonstrated academic achievement were effective due to
the implementation of school wide interventions aimed at overcoming the student’s
background characteristics. Teachers were responsible for the implementation of
interventions and creating a learning environment that fostered a deeper understanding of
concepts; therefore, a teacher’s instructional strategies must be carefully contemplated
and planned (Marzano, 2003).
Jacob and Ludwig (2008) stated that at the core of a successful school in a low
income area was the presence of an effective educator. Students under the instruction of
teachers whose instruction and curriculum design focused on content design instead of
simple coverage, reasoning instead of memorization, and creating relevance instead of
completing tasks, outperformed students in classrooms that did not utilize those strategies
(Newman & Wehlage, 1995). Effective educators of children in poverty employed
holistic instructional strategies meaning they teach beyond the realm of the academic

10
material (Howard, 2001). These educators believed that in addition to academia, moral
and social education such as responsibility and perseverance were instructed (Howard,
2001). Effective educators of children in poverty also used personal connections that
motivated students by showing genuine interests in the student’s life (Ladson-Billings,
1997; Ware, 2006).
Accountability measures apply to all children and educators. Children living in
poverty confront the same world as their peers. Therefore, educators in high poverty
districts must identify and utilize effective instructional strategies aimed at increasing the
academic achievement of their students. The goal of this study was to add to the existing
body of knowledge on effective instructional methods and student academic success in
Mississippi.
Purpose of the Study
NCLB (2001) required students to perform at higher levels of thinking, make
meaningful connections, and to apply new skills to real world settings (Wiggins &
McTighe, 2005). After the implementation of NCLB (2001), researchers analyzed the
factors affecting student learning and the role that teachers played in closing the
achievement gap and in improving of student achievement (Wright, Horn, & Sanders,
1997). According to Wright et al. (1997), effective teachers were “the most important
factor affecting student learning” (p. 63). Successful teachers utilized teaching practices,
which emphasized authentic learning and understanding (Bransford, Brown, Cocking,
Donovan, & Pellegrino, 2000).
The purpose of this study was to identify successful and high performing
Mississippi schools and to determine the effect that specific teaching methodologies,

11
instructional practices, and assessments had on student academic achievement as
measured by school accountability rankings. The schools included in the study were
located in districts that had a minimum of 70% of its student body population that
received free or reduced lunch. In addition, schools received a state ranking of successful
or high performing for the 2010-2011 school year. The participants in this study were
secondary school teachers who provided instruction in a successful or high performing
school in the 2010-2011 school year.
Research Questions
The primary issues investigated in the study were to determine the effect that
specific research based instructional practices, assessments, and student learning methods
had on student academic achievement as measured by school accountability rankings.
This study was designed to answer the following questions:
1. To what degree, and to what extent, do certification level, teaching experience,
and highest degree earned of the subject area teachers serving in the high poverty,
high performing schools and teachers who taught at the high poverty, successful
schools identified by the school accountability model in the southern region of the
state of Mississippi impact school performance?
2. To what degree, and to what extent, do the instructional practices employed by
subject area teachers serving in the high poverty, high performing schools and
teachers who taught at the high poverty, successful schools identified by the
school accountability model in the southern region of the state of Mississippi
impact school performance?
12
3. To what degree, and to what extent, do the assessments of subject area teachers
serving in high poverty, high performing schools and teachers who taught at the
high poverty, successful schools identified by the school accountability model in
the southern region of the state of Mississippi impact school performance?
4. To what degree, and to what extent, does the type of student learning methods
of subject area teachers serving in high poverty, high performing schools and
teachers who taught at the high poverty, successful schools identified by the
school accountability model in the southern region of the state of Mississippi
impact school performance?
Definition of Terms
The following terms where used in this study:
Accountability System: In Mississippi, the accountability system had three
components, which were achievement, growth, and graduation rate in the districts with
secondary schools (Mississippi Department of Education, 2010a).
Achievement Gap: The term utilized to refer to any significant inequality in
educational achievement and achievement among groups of students as determined by
standardized measures (Achievement Gap, 2013).
Achievement Model: The measurement of a district or school’s overall academic
performance using state mandated measures from the previous year based on the
percentage of students scoring basic, proficient, and advanced on state mandated
standardized measures (Mississippi Department of Education, 2010a).
Adequate Yearly Progress (AYP): AYP is the method used to measure a student’s
progress on annual standardized tests. Each state was required to establish AYP

13
measures, and to determine if the students at schools and within districts met the
achievement standard set over a specific period of time as determined by the state. States
may use a two- or three-year averaging formula to determine AYP and the measurement
must be made for each category: major racial and ethnic groups, economically
disadvantaged students, students with disabilities, and students with limited English
proficiency. States had to define their own AYP by determining their own standards,
definition of “proficiency,” theoretically meticulous assessments, and data based on those
assessments (U. S. Department of Education, 2008).
Free and Reduced-Price Lunch: Federally contributed meal program that
provides nutritionally balanced, low-cost, or free lunches to students. It was an indicator
of poverty. If a family had an income below 100% of the poverty line, which was
considered to be officially living in poverty, the children were provided free meals in
schools (U.S. Department of Health and Public Services, 2009).
Growth Model: A measure of a student’s academic gain by determining if
academic growth occurred on state mandated standardized measures by comparing scores
from the previous year to the current year (Mississippi Department of Education, 2010a).
High-Poverty School: A school located within a district that had a minimum of
70% of its student population receiving free or reduced lunch (study specific).
High-Performing School: A school within the southern region of the state of
Mississippi that received the second highest quality distribution index (QDI) ranking by
the state accountability system (Mississippi Department of Education, 2010a).
Quality distribution index (QDI): A measurement of the distribution of student
performance on state assessments around the cut points for Basic, Proficient, and
14
Advanced. The QDI formula was calculated by awarding one point for basic, two points
for proficient, and three points for advance (Mississippi Department of Education,
2010a).
Poverty: The term used by the United States Census Bureau to identify the
economic status of a family whose annual gross income was $23,492 or less (Institute for
Research on Poverty, 2012).
Student Achievement: The measure of performance as determined by scores of
basic, proficient, and advanced on state mandated standardized measures (Study
specific).
Subject Area Testing Program (SATP): In 1999, Mississippi passed the
Mississippi Student Achievement Act, which created a set of norm-referenced tests given
to Mississippi secondary students in the areas of Biology I, Algebra I, English II, and
U.S. History. Each test was designed to meet a minimum of mastery in each subject.
Students were required to pass each test in order to graduate (Mississippi Department of
Education, 2008).
Successful School: A school within the southern region of the state of Mississippi
that received the third highest quality distribution index (QDI) ranking by the state
accountability system (Mississippi Department of Education, 2010a).
Delimitations
The following delimitations were imposed:
1. The study was limited to the teachers, tutors, and administrators who work in
successful or high performing secondary schools in the southern region of Mississippi.
15
2. The study was limited to the analysis of a survey conducted at selected
Mississippi secondary schools.
3. The study was limited to the identified schools that met set student
achievement measures determined by the researcher.
Assumptions
For the purpose of this dissertation, the researcher assumed the following:
1. SATP was a valid measure of student achievement, and scores would not be
manipulated.
2. The responses provided to the researcher on the survey were provided freely
and honestly.
Justification of the Study
According to the 2010-2011 report card for Mississippi, the state had 152 school
districts and 806 schools (Mississippi Department of Education, 2012). The largest
district in Mississippi had an enrollment of 30,197, and the smallest district had only 167
students enrolled. Of the states 806 schools, 65 (8%) schools were Star; 181 (23%) were
high performing; 231 (29%) were successful; 187 (23%) were placed on academic watch;
128 (16%) received ratings of low performing; one school received a rating of at risk of
failing; and 11 (1%) received ratings of failing (Mississippi Department of Education,
2012). In addition, 12% of the schools in Mississippi were on improvement plans in
2010-2011 (Mississippi Department of Education, 2012). Total enrollment for the state
was 490,526 students of which 46% were White, 50% were Black, >1% were Asian, and
2% were Latino (Mississippi Department of Education, 2012). Males outnumbered
females in total enrollment by 3% (Mississippi Department of Education, 2012).

16
Furthermore, 70.7% of the study population were eligible for free or reduced lunch
(Mississippi Department of Education, 2012). Mississippi schools had a graduation rate
of 73.7% (Mississippi Department of Education, 2012). Of the 806 schools in
Mississippi, 720 (80.4%) received Title I funds. The state funded $9,338.84 per student
and spent a total of $4.6 billion total on public education (Mississippi Department of
Education, 2012).
In 2005, Rocha and Sharkey of the Center of American Progress published a
study for the state of Mississippi that reported 11% of low-income fourth graders were
proficient in reading compared to 36% of non-poor students. Rocha and Sharkey (2005)
reported that only 8% of Black fourth graders in Mississippi were proficient in reading
compared to 30% of White students. Furthermore, 87% of fourth grade students were
proficient on the Mississippi state reading tests, but only 18% were proficient on the
National Assessment of Educational Progress (NAEP) reading test (Rocha & Sharkey,
2005). The percentage of students scoring proficient in fourth grade math on the
Mississippi state exam was 74% compared to 17% who scored proficient on the NAEP
math exam. Among the eighth grade students who participated in the Mississippi state
reading tests in 2005, only 57% scored proficient or above while only 21% scored
proficient on the NAEP reading exam (Rocha & Sharkey, 2005). Finally, Rocha and
Sharkey (2005) reported that only 48% of the eighth graders scored proficient or above
on the Mississippi state math exam compared to 12% who scored proficient or above on
the NAEP math test.
Vanneman et al. (2002) reported that between 2002 and 2004 Mississippi schools
narrowed the Black-White achievement gap in fourth-grade reading by five percentage

17
points and by eight percentage points in mathematics. However, the achievement gap
between fourth grade Latinos and Whites in mathematics only lessened by three
percentage points (Vanneman et al., 2002). Furthermore, the achievement gap between
the poor and non-poor children in fourth-grade mathematics closed only by three
percentage points (Vanneman et al., 2002).
In addition, the National Assessment of Educational Progress (NAEP) stated that
Mississippi children were far below most other states in every grade level and subject.
The NAEP reported that in 2005, fourth and eighth grade students scored at least one
grade level behind the average student in the nation in mathematics. According to the
Southern Education Foundation (2009), Mississippi students were behind the national
goal, but they were not in the largest achievement gap by race. Furthermore, the
Southern Education Foundation (2009) stated that the Mississippi gap “is comparatively
smaller than in several other states, but only because both Black and White students in
Mississippi were performing near the bottom in national rankings” (p. viii).
Although the achievement gap may be closing in some areas according to the
NAEP report, less than 52% of the elementary and secondary schools in Mississippi
obtained high performing (23%) or successful (29%) rankings in 2010-2011 (Mississippi
Department of Education, 2012). The research identified 22 secondary schools located in
the southern region of Mississippi that received an accountability ranking of successful or
high performing for the 2010-2011 school year. Of the 22 identified schools, 15 were
ranked as successful, and seven were ranked as high performing in 2010-2011. The
identified schools were also located in a district that had a minimum of 70% of its student
body that received free or reduced lunch.

18
Research on high performing high poverty schools nationwide has reported that
among the reform efforts to improve student achievement, positive school leaders and
school culture was closely linked to school change (Darling-Hammond, 2001). However,
research on specific instructional methodologies and assessments utilized in Mississippi
schools was limited. This study was designed to add to the body of literature addressing
the effective methodologies, instruction, and assessment measures of Mississippi teachers.
Summary
This chapter provided background information pertaining to public schools and
their efforts in meeting national accountability measures. A school’s success is not only
measured by its students’ performance on standardized tests, but they are also measured
on how the various subgroups are performing in comparison to other students. Schools
must meet measures of adequate yearly progress, which indicate how well minorities and
special populations are performing on these tests. Schools must constantly analyze data
from the federal, as well as, the state level to improve test scores.
Academic achievement drives school policy efforts on both state and federal
levels. Over the past 50 years, the federal government’s role in educational reform policy
has increased, and their involvement has placed schools under tremendous amounts of
pressure. The main focus of the federal government’s involvement has been to close the
achievement gap, and progress has been made in this area (Viadero, 2003). Schools in
urban areas are making strides in narrowing the achievement gap through effective
leadership and the creation of a positive school environment. However, schools must
provide effective instructional methods for all students to be successful.
19
CHAPTER II
REVIEW OF RELATED LITERATURE
Introduction
In the past decade, the educational system in the United States has faced many
challenges. Marzano (2003) stated that public education in the United States has been
restructured in efforts to decrease the achievement gap and to identify the most effective
methods that ensured that students were knowledgeable and competent. Various
commission and group study reports including A Nation at Risk (1983), Action for
Excellence (1984), A Nation Prepared: Teachers for the 21st Century (1986), and
Prisoners of Time (1994) all required schools to examine the relationships between their
traditional practices and student achievement (Marzano, 2003). Currently, the most
influential section of federal education legislation applicable in all aspects of the public
education arena is the No Child Left Behind Act of 2001.
With the current focus on accountability, stress is placed on schools to ensure that
all students reach levels of academic proficiency regardless of their circumstances (U. S.
Department of Education, 2002). Nevertheless, it is also acknowledged that no two
schools are the same, and those that served challenging student populations have very
different levels of performance (EdSource, 2006). Data from various available resources
reported the effects of standards-based curriculum, high-stakes testing and accountability,
successful schools, school finance, and effective leadership on student achievement (Ali
& Jerald, 2001; Carter, 2000). Researchers have identified high achieving schools across
the nation and have published a sizeable amount of literature on the reasons associated
with their success (Darling-Hammond, 1999; Harris, 2006; Ragland, Clubine, Constable,
20
& Smith, 2002; Reeves, 2000). The majority of these studies discussed the role of the
leaders of the school in implementing programs that contributed to success. However,
research on the role of the teachers in high performing, high poverty districts has
indicated that the implementation of effective instructional practices produced academic
success as well (Marzano, 2003).
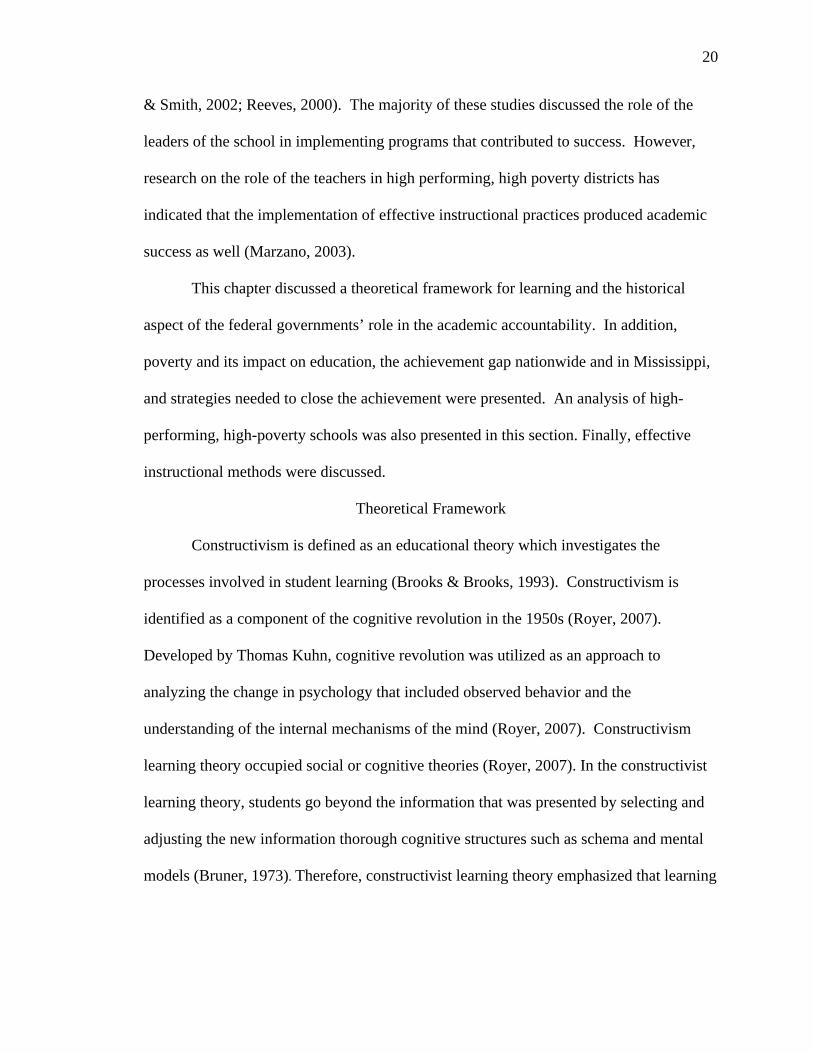
This chapter discussed a theoretical framework for learning and the historical
aspect of the federal governments’ role in the academic accountability. In addition,
poverty and its impact on education, the achievement gap nationwide and in Mississippi,
and strategies needed to close the achievement were presented. An analysis of high-
performing, high-poverty schools was also presented in this section. Finally, effective
instructional methods were discussed.
Theoretical Framework
Constructivism is defined as an educational theory which investigates the
processes involved in student learning (Brooks & Brooks, 1993). Constructivism is
identified as a component of the cognitive revolution in the 1950s (Royer, 2007).
Developed by Thomas Kuhn, cognitive revolution was utilized as an approach to
analyzing the change in psychology that included observed behavior and the
understanding of the internal mechanisms of the mind (Royer, 2007). Constructivism
learning theory occupied social or cognitive theories (Royer, 2007). In the constructivist
learning theory, students go beyond the information that was presented by selecting and
adjusting the new information thorough cognitive structures such as schema and mental
models (Bruner, 1973). Therefore, constructivist learning theory emphasized that learning

21
only occurs when students actively connected to their cognitive structures through schema
building experiences (Fosnot, 1996; Yager & Lutz, 1994).
Social constructivist theory stated that students construct knowledge by being
active participants at the individual and social level (Hein, 1991). According to
Vygotsky (1978), social interactions played a critical role in learning and cognition.
Vygotsky (1978) also stated learning at multiple levels occurred at the individual level
after the development of relationships with others. Furthermore, Dewey (1963) stated
that constructivist learning theory was a social process that centered on the relationship
between a student’s experiences and the environment. Dewey (1963) believed that
teachers should begin a lesson based on a student’s experiences because students created
connections (schema) from their experiences to the world.
Cognitive constructivist learning theory stated that authentic learning occurred
through reflection of personal experiences of new material by connecting it to what was
previously known (Brooks & Brooks, 1993). John Piaget’s cognitive constructivist
learning theory was based on the idea learning occurred by creating mental maps at
different stages, from birth to age 15 (Piaget, 1977). Piaget (1977) believed that as
students were exposed to new ideas and experiences, they connected the experiences to
the mental maps they had previously formed. Ernst von Glaserfield (1995) hypothesized
that a person’s ideas and knowledge resulted from judging, performing, and thinking
through their previous experiences. Bruner, Goodnow, and Austin (1956) reported that
teaching and learning in the classroom occurred through discovery learning through the
development of thinking or inductive reasoning. Bruner et al. (1956) stated that learning
occurred by developing an understanding for subject structure and active learning.
22
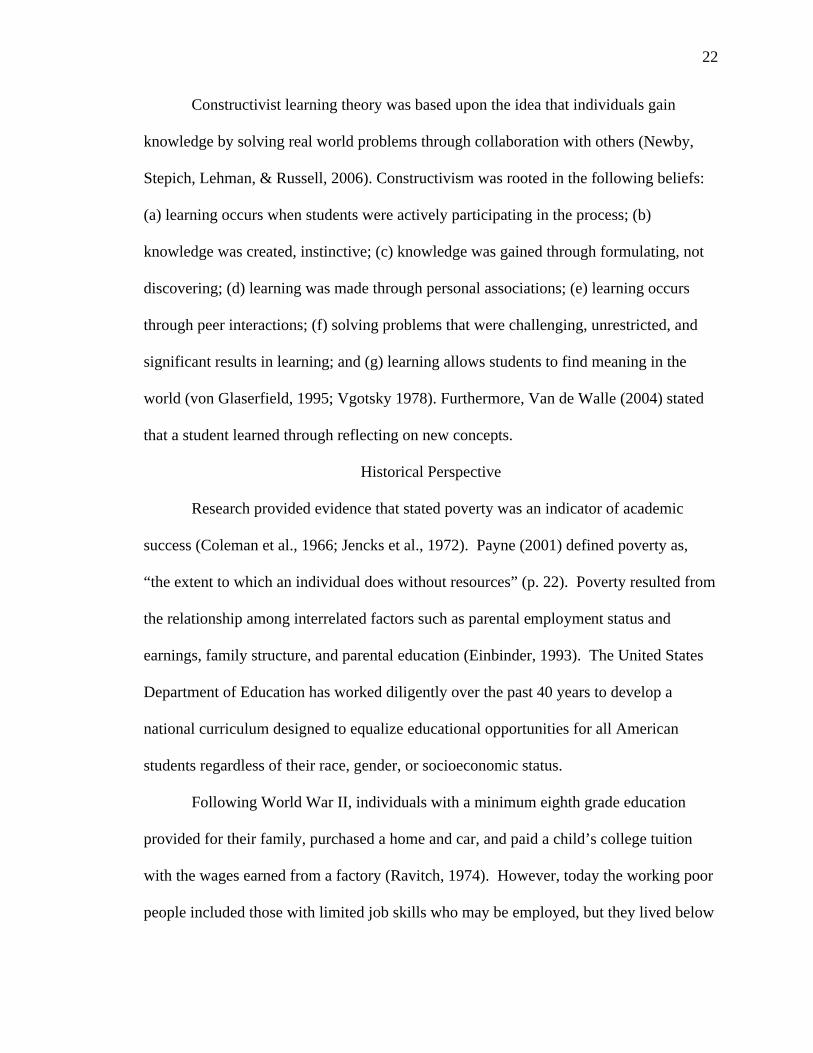
Constructivist learning theory was based upon the idea that individuals gain
knowledge by solving real world problems through collaboration with others (Newby,
Stepich, Lehman, & Russell, 2006). Constructivism was rooted in the following beliefs:
(a) learning occurs when students were actively participating in the process; (b)
knowledge was created, instinctive; (c) knowledge was gained through formulating, not
discovering; (d) learning was made through personal associations; (e) learning occurs
through peer interactions; (f) solving problems that were challenging, unrestricted, and
significant results in learning; and (g) learning allows students to find meaning in the
world (von Glaserfield, 1995; Vgotsky 1978). Furthermore, Van de Walle (2004) stated
that a student learned through reflecting on new concepts.
Historical Perspective
Research provided evidence that stated poverty was an indicator of academic
success (Coleman et al., 1966; Jencks et al., 1972). Payne (2001) defined poverty as,
“the extent to which an individual does without resources” (p. 22). Poverty resulted from
the relationship among interrelated factors such as parental employment status and
earnings, family structure, and parental education (Einbinder, 1993). The United States
Department of Education has worked diligently over the past 40 years to develop a
national curriculum designed to equalize educational opportunities for all American
students regardless of their race, gender, or socioeconomic status.
Following World War II, individuals with a minimum eighth grade education
provided for their family, purchased a home and car, and paid a child’s college tuition
with the wages earned from a factory (Ravitch, 1974). However, today the working poor
people included those with limited job skills who may be employed, but they lived below

23
the poverty level and were barely able to support themselves, let alone a family (U. S.
Census Bureau, 2000). The majority of children from poverty lacked the resources that
allowed them to compete for high-skill, high-wage jobs (Payne, 2001). Unfortunately,
this precedent continued to repeat unless they were fortunate enough to experience good
fortune or had personal resiliency (Tyack, 1974). McLoyd (1998) noted that Black and
Latino children, who were currently living in low income (poverty), were more likely to
“experience persistent poverty and to live in an area of concentrated poverty” (p. 186).
Elementary and Secondary Education Act and Title 1
In 1962, 9.3 million families lived below the poverty level (Cornia, Court, &
World Instituted for Development Economics Research, 2001). In the Economic Report
of the President, President Lyndon B. Johnson presented an “unconditional war” on
poverty (Cornia et al., 2001). Johnson outlined government policies aimed at
diminishing the poverty rate close to zero by 1980 by improving the quality of American
life by the creation of the Economic Opportunity Act (EOA) of 1964 (U. S. Printing
Office, 1965). Johnson authorized over three billion dollars of federal assistance aimed
at education, job training, and community development (U. S. Printing Office, 1965).
To fulfill a requirement of Johnson’s goal, Congress passed the Elementary and
Secondary Education Act (ESEA) in 1965, a bill which was designed “to strengthen and
improve educational quality and educational opportunities in the nation’s elementary and
secondary schools” (U. S. Printing Office, 1965). ESEA (1965) authorized one billion
dollars with the goal of financially supporting the education of the nation’s poorest
children (U. S. Printing Office, 1965). In addition, it was designed to bring groups of
Americans, who historically had been excluded from success, into middle-class society

24
by providing an adequate education, training, and access to job opportunities (U. S.
Council of Economic Advisers, 1965).
ESEA’s (1965) objective was to improve the achievement gap between urban and
rural public school students because it was during this time that researchers documented
the relationship between inadequate school achievement and poverty (Smith, Scoll, &
White-Plisko, 1995). ESEA (1965) provided financial aid to urban schools for the
assistance of meeting national education goals and to advance the nation’s global
competitiveness by improving education (U. S. Printing Office, 1965).
For schools, the most important component of ESEA (1965) was the allocation of
one billion dollars of federal assistance directed to schools with a high percentage of low
income families (Editorial Projects in Education Research Center, 2004). This section of
ESEA (1965) was known as Title I (Editorial Projects in Education Research Center,
2004). Title I was designed to assist in the inequality of educational opportunities among
students in the United States by ensuring that all students would have equal access to a
high quality education (U. S. Department of Education, 2002). The goals of Title I
included providing supplemental services to eligible children, additional funding to
districts and individual schools who serve a large population of students from low income
homes, reducing the achievement gap, and improving academic achievement of all
special need students (Editorial Projects in Education Research Center, 2004; Riddle,
1996).

25
A Nation At Risk
Based on the results of lower SAT scores in the late 1970s and early 1980s,
society blamed the education system for having “lowered academic standards” and felt
that schools had “shifted away from rigorous academic content” (Harris & Herington,
2006, p. 6). Researchers determined that achievement had most likely not declined, but
there was a genuine concern about the direction of the educational system (Carson,
Huelskamp, & Woodall, 1993; Grissmer, Flanagan, Kawata, & Williamson, 2000). In
1983, President Ronald Reagan’s education commission reiterated these concerns in A
Nation at Risk (NAR).
NAR (1983) was not interested in underachieving groups but on the education of
the “average graduate” (National Commission on Excellence in Education, 1983, p. 11).
The committee for A Nation at Risk (1983) was concerned with the fact that foreign
countries were “matching and surpassing our educational obtainments” (p. 1). The NAR
committee concluded that schools were focusing their efforts on rudimentary subjects
such as reading and math and ignoring critical thinking areas (National Commission on
Excellence in Education, 1983). According to NAR (1983), “we have, in effect, been
committing an act of unthinking, unilateral educational disarmament. Our society and its
educational institutions seem to have lost sight of the basis purposes of schooling and of
the high expectations and disciplined efforts needed to obtain them” (National
Commission on Excellence in Education, 1983, p. 1). Therefore, it was the
recommendation by the committee of NAR for schools to focus on teaching and on
academic content (Firestone, Fuhrman, & Kirst, 1990). The committee requested more
rigorous standards and the development of accountability measures that allowed the
26
United States’ educational system to revive itself and allow Americans to compete with
the industrialized world (Amrein & Berliner, 2002).
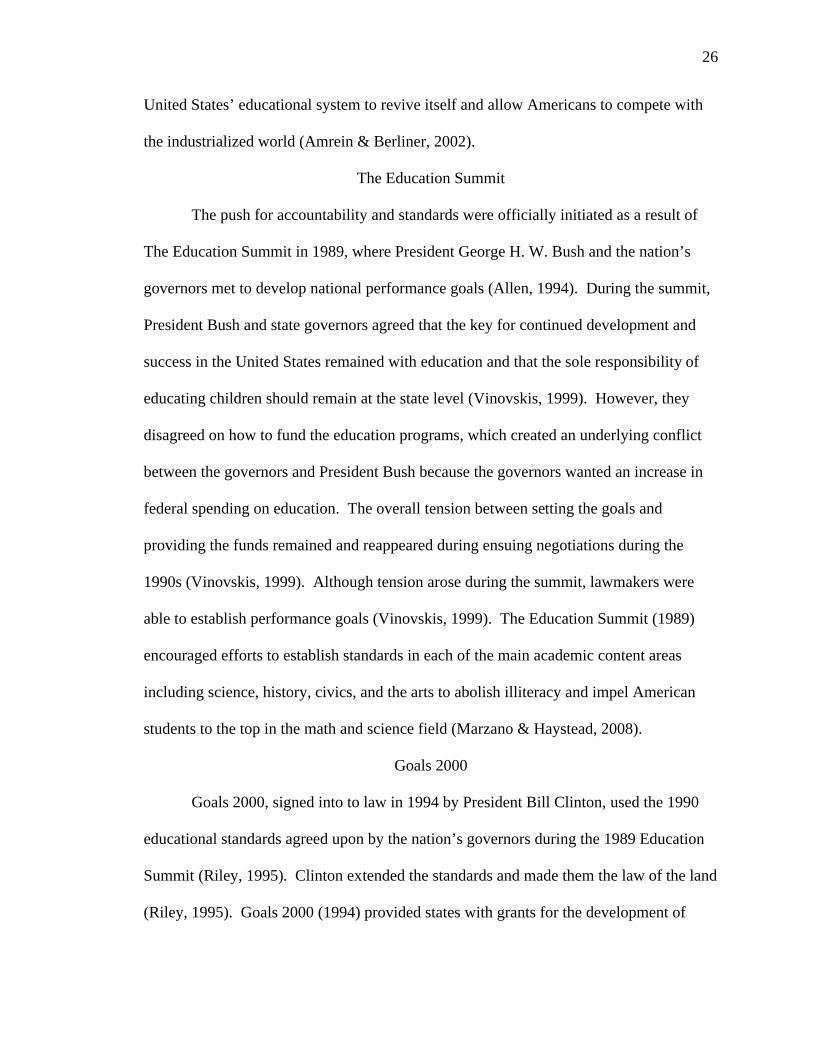
The Education Summit
The push for accountability and standards were officially initiated as a result of
The Education Summit in 1989, where President George H. W. Bush and the nation’s
governors met to develop national performance goals (Allen, 1994). During the summit,
President Bush and state governors agreed that the key for continued development and
success in the United States remained with education and that the sole responsibility of
educating children should remain at the state level (Vinovskis, 1999). However, they
disagreed on how to fund the education programs, which created an underlying conflict
between the governors and President Bush because the governors wanted an increase in
federal spending on education. The overall tension between setting the goals and
providing the funds remained and reappeared during ensuing negotiations during the
1990s (Vinovskis, 1999). Although tension arose during the summit, lawmakers were
able to establish performance goals (Vinovskis, 1999). The Education Summit (1989)
encouraged efforts to establish standards in each of the main academic content areas
including science, history, civics, and the arts to abolish illiteracy and impel American
students to the top in the math and science field (Marzano & Haystead, 2008).
Goals 2000
Goals 2000, signed into to law in 1994 by President Bill Clinton, used the 1990
educational standards agreed upon by the nation’s governors during the 1989 Education
Summit (Riley, 1995). Clinton extended the standards and made them the law of the land
(Riley, 1995). Goals 2000 (1994) provided states with grants for the development of

27
academic goals they were expected to reach by the year 2000, six years after its
implementation. In particular, two of these goals were directly related to student
achievement, where students in the 4th, 8th, and 12th grades would demonstrate
competency in challenging subject matter. Specifically, the students were expected to
perform in the top percentage in mathematics and science achievement (National
Education Goals Panel, 1991). In addition, Goals 2000 (1994) provided additional
monetary backing for states and communities that were trying to improve their schools
and to obtain their own demanding goals and high standards (National Education Goals
Panel, 1991). Unlike other federal programs, new mandates were not imposed under
Goals 2000 (1994), and localities had the bipartisan support throughout both of Clinton’s
presidential terms in office (Riley, 1995). However, Goals 2000 (1994) proposed a new
role for federal education policy and how it affected student learning, particularly for
special needs students who had traditionally been the focus of federal funded program
(National Education Goals Panel, 1995).
Reauthorization of Elementary and Secondary Education Act
In 1994, the revamping of Title I of the ESEA allowed states to receive federal
funds for schools that enroll socioeconomically disadvantaged students (EdSource,
2000). The reauthorization of ESEA triggered the onset of a national commitment to
standards-based reform by requiring states to develop challenging content and
performance standards for public schools, develop high-quality assessments, and identify
low-performing schools (EdSource, 2000). Furthermore, for the first time, it included the
phrase “adequately yearly progress” by including the requirement for schools to analyze
annual student progress (EdSource, 2000). However, a deadline for the states to meet the

28
requirements was not included in the reauthorization (EdSource, 2000). Furthermore, the
reauthorization of ESEA (1994) did not outline any type of consequences for the states
that failed to oblige to the new mandates (EdSource, 2000).
Improving American Schools Act
Following the reauthorization of ESEA, Goals 2000 (1996), was revised and
renamed the Improving America’s Schools Act (IASA) (Kendell & Marzano, 1997).
IASA (1996) intended to “improve student learning through a long-term, broad-based
effort to promote coherent and coordinated improvements in the system of education
throughout the nation at the state and local levels” (Kendell & Marzano, 1997, p. 3).
IASA (1996) outlined the efforts to establish standards, which included academic content
standards, performance standards and proficiency levels (National Center for Research on
Evaluation, Standards, and Student Testing, 1994). By 1999, policymakers and research
analysts concluded that funding should be clearly attached to considerable improvement
in student performance and wanted provisions made to reflect this requirement
(Smallwood & Segota, 2000). However, differences among the members of Congress
prevented the passage of such measures, and for the first time in history, the ESEA was
not reauthorized on time (Smallwood & Segota, 2000).
No Child Left Behind
Since the 1950s, President George W. Bush implemented the most significant
federal regulation in education in 2001 (Hess & Petrilli, 2009). Only a few days after his
inauguration, Bush proposed his plan for the reauthorization of ESEA, which was titled
No Child Left Behind (NCLB) (Hess & Petrilli, 2009). Initially, NCLB (2001) contained
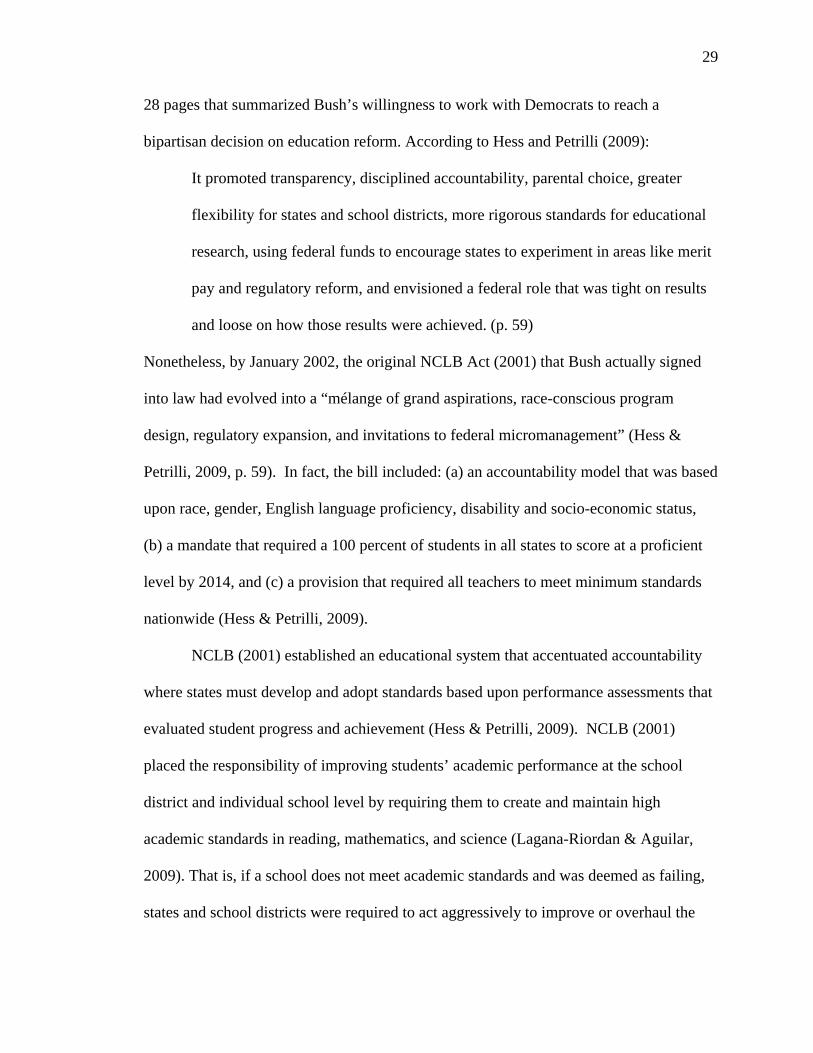
29
28 pages that summarized Bush’s willingness to work with Democrats to reach a
bipartisan decision on education reform. According to Hess and Petrilli (2009):
It promoted transparency, disciplined accountability, parental choice, greater
flexibility for states and school districts, more rigorous standards for educational
research, using federal funds to encourage states to experiment in areas like merit
pay and regulatory reform, and envisioned a federal role that was tight on results
and loose on how those results were achieved. (p. 59)
Nonetheless, by January 2002, the original NCLB Act (2001) that Bush actually signed
into law had evolved into a “mélange of grand aspirations, race-conscious program
design, regulatory expansion, and invitations to federal micromanagement” (Hess &
Petrilli, 2009, p. 59). In fact, the bill included: (a) an accountability model that was based
upon race, gender, English language proficiency, disability and socio-economic status,
(b) a mandate that required a 100 percent of students in all states to score at a proficient
level by 2014, and (c) a provision that required all teachers to meet minimum standards
nationwide (Hess & Petrilli, 2009).
NCLB (2001) established an educational system that accentuated accountability
where states must develop and adopt standards based upon performance assessments that
evaluated student progress and achievement (Hess & Petrilli, 2009). NCLB (2001)
placed the responsibility of improving students’ academic performance at the school
district and individual school level by requiring them to create and maintain high
academic standards in reading, mathematics, and science (Lagana-Riordan & Aguilar,
2009). That is, if a school does not meet academic standards and was deemed as failing,
states and school districts were required to act aggressively to improve or overhaul the
30
school within five years (Lagana-Riordan & Aguilar, 2009). Moreover, states were not
only responsible for ensuring overall student achievement but also the achievement of at-
risk students who were classified into several subgroups including: (a) low income
students, (b) traditionally underserved students, (c) students who speak English as a
second language, and (d) students with disabilities (Lagana-Riordan & Aguilar, 2009).
According to the United States Department of Education, the goal of NCLB
(2001) was to “improve the academic achievement of the disadvantaged” by ensuring
“that all children had a fair, equal, and significant opportunity to obtain a high-quality
education and reach, at minimum, proficiency on challenging state academic achievement
standards and state academic assessments” (U. S. Department of Education, 2012, p. 15).
NCLB (2001) exposed achievement gaps and increased accountability for high-need
students, but it also encouraged states to lower standards and narrow curriculum, focused
on absolute test scores instead of student growth and gains, and created ‘one-size-fits-all’
federal mandates (Harris & Herington, 2006). Yet, some people believed that the
implementation of NCLB resulted from the fear that children in the United States were
not being adequately educated to standards that matched those of foreign countries such
as China and Japan; therefore, the loss of jobs for Americans would negatively impact the
United States’ economy (Shaker & Heliman, 2004).
With the election of President Barack Obama, new changes in NCLB were
proposed. On Saturday, March 13, 2010, the Obama administration requested a broad
overhaul of NCLB, proposing to reshape conflict-ridden provisions that encouraged
instructors to teach to tests, narrowed the curriculum, and labeled one in three schools in
the United States as failing (Dillon, 2010a). The Obama plan was designed to achieve a

31
balance, retaining some key features of the Bush-era law, including its requirement for
annual reading and math tests, while proposing far-reaching changes (Dillon, 2010a). The
Obama administration replaced the law’s pass-fail school grading system with one that
measured individual students’ academic growth and judge schools based not on test
scores alone, but also on indicators like pupil attendance, graduation rates, and learning
climate (Dillon, 2010a). Moreover, while the proposal called for more vigorous
interventions in failing schools, it also rewarded top performers and lessened federal
interference in tens of thousands of reasonably well-run schools at the middle level of
achievement (Dillon, 2010a).
NCLB and Adequate Yearly Progress
As previously stated, Title I originated as a component of ESEA (1965). At its
core, Title I was implemented to address the achievement gap among underserved
populations and those in high performing schools through a greater expenditure of
funding in low achieving districts (Editorial Projects in Education Research Center,
2004). Similar to its function in ESEA (1965), Title I existed as an integral component
in NCLB (2001) because of its funding capacity in districts that served disadvantaged
students, underserved populations, and students who speak English as a second language
(Editorial Projects in Education Research Center, 2004). NCLB (2001) affected schools
with the highest percentage of low income students because these schools received a
greater amount of Title I funds from the federal government (Figlio, 2003). In addition,
schools that served a high percentage of students (minimum of 40% of student body)
from low income homes utilized Title I funds on instructional programs designed to

32
improve academic achievement school wide (Mississippi Department of Education,
2014).
The states that received Title I funds were held to accountability measures
including the establishment of academic standards for students in grades K–12, annual
assessments in English and math for students in third through fifth grade, demonstration
annual yearly progress (AYP), and the requirement that all students reach a proficient
academic level by 2014 (Editorial Projects in Education Research Center, 2004). Title I
relied on a results-based accountability measures that ensured schools were in
compliance of NCLB (2001) by measuring a school’s adequate yearly progress (AYP)
(U. S. Department of Education, 2012). Each state determined what they wanted the
students to learn and what was considered to be proficient. If a school’s student
achievement measured at or above the designated level of proficiency level in a given
year, then the school was designated as meeting Adequate Yearly Progress (AYP). When
first implemented in 2002, NCLB (2001) developed a 12-year plan to measure student
performance that required all students, including subgroups, to meet a state recognized
standard for proficiency on standardized tests in language arts and mathematics (U. S.
Department of Education, 2012). However, President Obama replaced the law’s
requirement that every American child reach proficiency in reading and math with a new
national target: that all students graduated from high school prepared for college and a
career (Dillon, 2010b).
Initially to determine if a school met AYP, the passing rate for the lowest
performing subgroup of students in the state or the proficiency rate of the school at the
20th percentile of overall performance in the state (whichever is higher) was used (U. S.
33
Department of Education, 2012). AYP was not only based upon the achievement of
overall averages but also on the performance of subgroups including: (a) low-income
students, (b) traditionally underserved students, (c) students with limited English
proficiency, (d) and students with disabilities (Offenberg, 2004). If one or more of the
subgroups failed to make AYP in a given year, the school did not make overall AYP for
that year (Offenberg, 2004). If the school failed to meet AYP for two consecutive years,
it was assigned a status of needing improvement (Offenberg, 2004). If a school failed to
meet AYP several years in a row, it was subjected to mandates such as restructuring of
the school and providing parental option to move the student(s) to another school at the
district’s expense (Offenberg, 2004).
During the fall of 2011, President Obama initiated waivers for states that allowed
for them to have flexibility in the academic proficiency requirements of NCLB (2001).
According to the Department of Education, states must still meet the requirements of
NCLB (2001); however, states had flexibility in spending, curriculum, and the mandates
of the 2014 timeline (Dillion, 2011).
Accountability Measures
The accountability mandates of NCLB (2001) required the assessment of both
teachers’ instructional methods and students’ academic achievement. The effects of
NCLB (2001) on student achievement were evident in the changes teachers made to their
classroom practices (Bishop, 1995; Hamilton, 2004). Teachers tended to resist changing
their teaching style, but the usage of high stakes testing affected what was taught and how
it was instructed (Bishop, 1995; Hamilton, 2004).

34
Therefore, in response to the accountability mandates of NCLB (2001) and its
requirements, states implemented various testing programs, in the form of ‘high-stakes
tests’. The implementation of high-stakes tests has established real consequences for
teachers, students, and the individual districts (Braden & Shroeder, 2004). Consequences
that teachers faced after their students did poorly on a state test were the possibility of job
loss or a reduction in pay (Braden & Shroeder, 2004). Students faced consequences such
as failing a grade or not graduating (Braden & Shroeder, 2004). Individual school
districts received reduction in funding for low-test scores, or the personnel was dismissed
and replaced by a governmental agency (Braden & Shroeder, 2004).
Standardized testing required a form of accountability, which resulted from the
objective that all students learn the predetermined body of knowledge to a particular level
of accomplishment (Hess & Brigham, 2000). High-stakes tests were not designed to take
children’s various learning styles into account. High stakes standards were designed at
high levels, and some students do not meet the outlined standards (Hess & Brigham,
2000). The subgroups of the student population that were most likely to have failed the
tests tended to be those from low-income families, Black students, and individuals with
disabilities (Hess & Brigham, 2000). The failure of these students was possibly due to
the fact that some educators did not hold all students to the same high standards (Hess &
Brigham, 2000).
High-stakes test have various negative and positive benefits (Olson, 2002). A
negative of high stakes testing was the idea that teachers tended to change the way they
taught in a manner that was not necessarily beneficial to the students. In response to
changes in their teaching methods, teachers decreased or stopped teaching topics that
35
were not covered by the test (Olson, 2002). Olson (2002) reported that “one fourth of
teachers in states with high-stakes for students and schools reported cutting back on
instruction ‘a great deal’ in untested areas, compared with a nine percent of teachers in
states with moderate or low stakes” (p. 14). Also, teachers in states with high-stakes tests
admitted to teaching more test-taking skills and practicing only with similar problems on
the test instead of instruction that included creative ideas and activities incorporating
divergent thinking (Olson, 2002).
High stakes tests required educators to decide on what knowledge and skills they
felt were important or the areas that held the most value (Hess & Brigham, 2000). The
implementation of high stakes tests changed the content to include only tested subjects
along with an emphasis on teaching only the material covered on the tests (Hess &
Brigham, 2000). Moreover, the practice of teaching to the test defeated the purpose of
the test, which was to record academic achievement (Hess & Brigham, 2000). In
Kaufold (1998), Robert Linn and Norman Gronlund, authors of Measurement and
Assessment in Teaching, reported that teaching to the test may have resulted in an
inflation of test scores, which would have changed the meaning of the results.
Another downfall of high-stakes testing was the fact that the tests cannot account
for the different ways that students think and consequently learn (Olson, 2003). Some
students are talented in writing, reading, or taking tests while others learned through
techniques such as memorizing or working with others during group projects (James,
2002). Some students learned verbally to apply their knowledge, whereas others had the
ability to apply their knowledge to practical problems; but at the same time, they had
little or no concrete understanding of the subject (James, 2002). James (2002) stated

36
“The sad fact is that federally mandated standardized testing of this magnitude will, by
necessity, focus on the lower level of cognitive domain, reward students strong in
linguistic and logical mathematical intelligence, and basically ignore the substantial
problems within schools” (p. 12). The format of the state tests consisted mainly of
multiple-choice questions that did not take into account a child’s reasoning of a problem;
either it was right or it was wrong (James, 2002). The tests did not allow for creativity to
answer the questions.
Finally, there was the issue that some students felt pressured to drop out of school
due to having their future success of graduating dependent entirely on the passing or
failing of high-stakes tests. In turn, the usage of a single test to determine achievement
had the tendency to cause students who were low achievers just to give up entirely
(Dropout rates fueling debate over testing, 2003). As a result, states that had high-stakes
testing reported higher dropout rates, a decline in graduation rates, and an increase in
younger people taking the General Education Development Exams (GEDE) (Viadero,
2003). Haney (2000), a Boston College education professor, conducted a study and
found that, in Texas, schools were encouraging students to take the GED so that the
lower-achieving students’ state test scores did not affect the schools statewide ratings.
On the other hand a benefit of high-stakes testing was that they allow for
accountability. Under the No Child Left Behind Act (2001), each of the states’ high-
stakes tests must correlate with their state frameworks (Hess & Brigham, 2000).
Correlating the framework with the tests increased the possibility of school districts
within a state to teach a similar curriculum (Hess & Brigham, 2000). The tests ensured
that teachers were consistently teaching about the same thing at about the same time and,

37
hopefully, with about the same expectations (Clark & Clark, 2000). If each teacher
utilized the state framework as a guide for instruction, there should be little difference
between individual districts in the types of material taught in the classroom (Olson,
2002). This decreased the possibility of failure once a child left one school district and
attended another one in the same state (Olson, 2002). Using the state frameworks that
guided their instruction, teachers ensured that they did what was expected of them; and,
in turn, the students were adequately prepared for the state tests if those tests matched
their curriculum (Olson, 2002).
Furthermore, high-stakes tests served as a guide for teachers to identify their
strengths and weaknesses along with the students (James, 2002). One way high-stakes
tests helped teachers by allowing them to receive feedback from the tests every year
(James, 2002). After the teachers studied the feedback, they were able to adjust their
instruction to compensate for the weak areas and focus less on the strong areas. James
(2002) believed that teachers must remember that “tests were tools in the teacher’s little
bag” (p. 12). Tests helped teachers to assess how well they were teaching so they could
seek alternative ideas or methods to improve their instruction in their weak areas. To a
greater extent, the tests helped schools and teachers to develop goals for student
performance that coincided with the best teaching methods for instructing and assessing
their students (James, 2002). Moreover, standardized tests were “never intended to be the
one-and-only yardstick to determine learning; it was a grave mistake to think so” (James,
2002, p. 12).

38
Poverty and Student Achievement
Research pertaining to the factors that influenced student achievement has
demonstrated that socioeconomic status was one of the single strongest predictors
(Coleman et al., 1966; Jencks et al., 1972). Regardless of race or ethnicity, poor children
were more likely to suffer developmental delays or brain damage (Miranda, 1991).
Children who lived in persistently poor families tend to score six to nine points lower on
the measurable verbal IQ assessments than children who have never lived in a poor
environment (Smith, Brooks-Gunn, & Klebanov, 1997). Cognitive development was
affected by the duration of time a child spent in poverty and not affected by the child’s
age when they lived in poverty (Pagani, Boulerice, & Tremblay, 1997). However, if a
child lived in poverty during adolescence, there was the likelihood that he/she would not
obtain a high school diploma or experience early career achievements (Pagani et al.,
1997). Teachman, Paasch, Randal, and Carver, (1997) stated:
Children who had spent one to three years of their adolescence in a family below
the poverty line were about 60% less likely to graduate from high school than
children who had never been poor. Children who had spent four years of their
adolescence living in a family below the poverty line was 75% less likely to
graduate from high school ….. On average, children who had spent some or all of
adolescence living in poverty obtained between 1.0 and 1.75 fewer years of
schooling than other children. (p. 388)
Along with the pressures that exist, due to living in an isolate low-income
community, students’ abilities to learn were affected by seeing their family struggle,
health issues, and hunger (EdSource, 2003). The challenges of living in impoverished
39
urban areas caused students to experience hunger, poor housing, lack of medical care, and
inadequate nutrition (Peterson, 2003). Students who lived in poverty displayed
differences in student achievement before they entered school and once they were
enrolled (EdSource, 2003).
When comparing the schools located in low income areas with those located in
higher income levels, there was a drastic difference in the educational opportunities
available for students (Kozol, 1991). Schools in low income areas often had inferior
buildings and materials, higher percentages of inexperienced teachers, higher percentages
of teachers instructing classes outside of their degree, and teachers who were not certified
to teach (Ingersoll, 2001). Furthermore, the main instructional method used by teachers
in low income schools tended to concentrate on rote memorization of basic skills instead
of the application of higher order thinking skills that required more cognitive processes
(Haberman, 1991; Knapp & Woolverton, 2005).
Children residing in more affluent areas had greater access to high quality
educational programs than the students from low income neighborhoods (Atweh,
Bleicher, & Cooper, 1998; Tate, 1997). Students who lived in poverty displayed
differences in student achievement before they enter school and once they were enrolled
(EdSource, 2003). When comparing children from welfare dependent homes and
children from economically advantaged homes, 60% of the children from welfare
dependent homes ranked in the bottom half of their classes (Zill, Moore, Smith, Stief, &
Coiro, 1995). Children who persistently lived under the poverty level tended to score six
to nine points lower on the measurable verbal IQ assessments than children who had
never lived in a poor environment (Smith et al., 1997).

40
Children who resided in poor (urban) areas had the ability to learn, and in fact,
were motivated to do so if educators were able to learn how to take advantage of on the
intrinsic cultural strengths that students brought with them (Woods, 1997). Urban schools
played a vital role in the education of America’s children (Woods, 1997). Urban schools
across the United States struggled to improve student achievement (Wilms, 2003). They
faced unique challenges and internal obstacles ranging from superintendents who had less
than three years of experience and insufficient finances masked by unplanned temporary
solutions (Peterson, 2003; Wilms, 2003). In addition, urban school districts encountered
external barriers that might have included gang activity, access to illegal substances, and
a collapse of the community structure.
According to Kozol (1991), children who attended preschool or one of the
improved elementary schools had the “advantage in achieving entrance to selective high
schools; but an even more important factor seemed to be the social class and educational
level of their parents” (p. 60). Parent initiative was the key factor needed for a child to
attend a selective high school (Kozol, 1991). Since poor parents typically possessed an
inadequate education, they lacked the skills needed to obtain critical information to
acquire the necessary paperwork and direct their children to the better schools. As a
result, “even in poor black neighborhoods, it tended to be children of the less poor and
the better educated who were likely to break through the obstacles and win admission”
(Kozol, 1991, p. 60). Additionally, parents who had characteristics of diligence, skill,
honesty, good health, and reliability improved their child’s life chances, and the children
of these types of parents did well even if their parents had a limited income (Mayer,
1997).

41
Achievement Gap
Standardized testing required a form of accountability, which comes from the
objective that all students learn a predetermined body of knowledge to a particular level
of accomplishment (Hess & Brigham, 2000). The achievement gap was defined as the
difference in academic performance between groups of students (Stone, 1998). Students
from low socioeconomic (SES) backgrounds tended to trail behind their peers from high
socioeconomic (SES) backgrounds with respect to academic achievement (Stone, 1998).
The achievement gap existed between students who live in poverty and their more
wealthy peers, but it also existed between traditionally underserved and non-traditionally
underserved students (Hess & Brigham, 2000).
Traditionally underserved populations have historically scored lower on
standardized testing (Hess & Brigham, 2000). The subgroups of the student population
that were most likely to fail to pass the tests tended to be those from low-income families,
Black students, and individuals with disabilities (Hess & Brigham, 2000). The lowest
performing schools have been those with high percentages of poor and traditionally
underserved students (Kannapel & Clements, 2005). For inner-city schools, this was a
significant problem because many of the students that attended these schools came from
low socioeconomic backgrounds (Stone, 1998). Urban school students scored an average
of 20 percentile points lower in reading in comparison with their suburban counterparts,
and the gap was greater in math and science (Olson & Jerald, 1998). Depending upon the
percentage of traditionally underserved students, high-poverty schools were 22-89 times
less likely than low-poverty schools to be high performing (Harris & Herington, 2006).

42
At the national level, Chall, Jacobs, and Baldwin (1996) examined a blend of
National Assessment of Educational Progress (NAEP) reading results, Scholastic
Aptitude Test scores over time, and a vast array of research on beginning reading from
1910 to 1996. Chall et al. (1996) concluded that there was a significant difference in
achievement among older students from higher SES and those from lower SES. However,
Chall et al. (1996) reported that no significant difference in achievement existed among
younger children in higher SES and lower SES children. On the 2005 National
Assessment of Educational Progress (NAEP) assessment, only 13% of children living in
poverty (low SES) scored proficient in comparison to 40% of children not living in
poverty (Reardon, 2011). Additionally, 49% of children living in poverty scored below
the minimum of basic competency, compared to only 21% of children not living in
poverty (Reardon, 2011).
Lopez (1995) conducted a study of more than 6,000 fourth-grade classrooms in
Texas and concluded that low SES classrooms had significantly lower improvements
Texas’ Norm-referenced Assessment Program than non-low SES classrooms.
Furthermore, Ali and Jerald (2001) reported that an Education Trust study identified only
4,577 schools nationwide that were in the top third of their state in reading or
mathematics and had at least 50% low-income or 50% traditionally underserved students
compared to other schools at the same grade level.
Rothstein (2004) stated that there was a “persistent gap in academic achievement
between Black and White students” (p. 105). Even if traditionally underserved and
White, non-Latino students resided in the same area of poverty, the traditionally
underserved students tended to score lower on academic achievement tests (Rothstein,

43
2004). On average, White children scored at the 50th percentile while their traditionally
underserved peers typically scored at the 23rd percentile, which was approximately one
standard deviation lower (Rothstein, 2004). By the time Black students completed the
eighth-grade, they were at least two grade levels behind White students (Haycock, 2001).
Furthermore, upon completion of high school, Blacks graduated with the equivalency of
the same skills that White students obtained in the eighth-grade (National Center for
Education Statistics, 2010).
In the winter of 2002, the National Assessment of Educational Progress (NAEP)
completed a study on how students in large city schools systems in Atlanta, Chicago,
Houston, Los Angeles, New York City, and Washington, D.C. were performing (as cited
in Manzo, 2003). The study concluded that there was a significant difference between
White students’ achievement and their Black and Latino peers (Manzo, 2003). More than
90% of fourth-grade White students in all six cities scored on the basic level in writing,
while only 71% to 83% of their Black and Latino peers scored at the same level (Manzo,
2003). Furthermore, over one-third of the overall White fourth-grade students (64% in
Washington, D.C. and 70% in Atlanta) scored at the proficient level in writing, but “only
7-21 percent of Black and Latino students met that mark” (Manzo, 2003, para. 2).
In the same study, the achievement gap in the fourth-grade reading was even
wider. Approximately 91% of the White fourth-graders from Washington, D.C. scored at
least at the basic level in reading, while only 28% of Black students and 34% of Latino
students met the same level (Manzo, 2003). However, 67% of fourth-grade Whites in
Atlanta scored at the proficient level on the reading test, whereas only 8% of the Black
students had proficient scores (Manzo, 2003).

44
Achievement Gap in Mississippi
Children of color make up 50% of Mississippi’s K-12 public school students
(Southern Education Foundation, 2009). In 2009, almost two-thirds of the 500,000
students in Mississippi received free or reduced meal prices (Southern Education
Foundation, 2009). Approximately one in eleven K-12 school children attended a private
school in Mississippi, and 87% of those students who were in private schools were White
(Southern Education Foundation, 2009). Mississippi students were behind students in
most other states in every grade and in every subject area on the fourth and eighth grade
national reading and math exam (Southern Education Foundation, 2009). For example,
during 2005, in mathematics fourth and eighth-grade students in Mississippi scored at
least one grade behind the average student in the nation (Southern Education Foundation,
2009). The national test scores by race showed that Mississippi students were not in the
largest achievement gaps by race; however, the White and Blacks students in Mississippi
still performed close to the bottom in national rankings (Southern Education Foundation,
2009).
The Mississippi Department of Education (MDE) reported the findings on the
achievement gap in 2003-2004 by analyzing data collected from the Mississippi
Curriculum Test (MCT) and Subject Area Testing programs (SATP) for three
consecutive years (2001-2002, 2002-2003, and 2003-2004) (Mississippi Department of
Education, 2004). The study examined data from the second through eighth-grade
reading, language, and math MCT, and data from the biology I, algebra I, English II, and
U.S. History SATP (Mississippi Department of Education, 2004). The report presented
the percentage of students who scored proficient or above on the MCT and the overall
45
mean score on the SATP in the following groups: all students, Black students, White
students, and economically disadvantaged students (Mississippi Department of
Education, 2004).
In every grade and subject of the MCT and SATP, a higher percentage of White
scored proficient or advanced than any of the other three groups (Mississippi Department
of Education, 2004). Additionally, the percentage of each group who scored proficient or
above increased or remained unchanged each year at every grade level in each area on the
MCT and SATP with the exception of sixth-grade math and eighth-grade language
(Mississippi Department of Education, 2004). The percentage of economically
disadvantaged students who scored proficient or advanced in sixth-grade math dropped
by 1% in 2002-2003 but increased by 11% in 2003-2004 (Mississippi Department of
Education, 2004). The percentage of White students who scored proficient or advanced
in eighth-grade language dropped 2% from the 2002-2003 and 2003-2004 school terms
resulting in a 2% decrease in the percentage of overall students scoring proficient or
above also (Mississippi Department of Education, 2004). The percentage of
economically disadvantaged students, scoring proficient or above in eighth-grade
language, decreased by 4% in 2003-2004 (Mississippi Department of Education, 2004).
Studies on the Strategies to Close the Achievement Gap
Determining the exact cause of the achievement gap offers theories related to
poverty, high rates of family mobility, peer pressure, low teacher expectations, race, and
parents’ educational levels (National Task Force on Traditionally Underserved High
Achievement, 1999). Although it is difficult to pinpoint the exact reason for the
achievement gap, researchers reported that effective teaching was essential. Haycock

46
(1998) stated that “the difference between a good and a bad teacher can be a full level of
achievement in a single school year” (p. 4). According to Grossen and Carnine (1996),
“if the learning of lower-achieving traditionally underserved children is accelerated,
equity was served” (para. 4).
During a presentation to The Education Trust 2001, Haycock outlined four
elements needed to close the achievement gap. The four elements were: (a) setting clear
and public standards, (b) maintaining a challenging curriculum, (c) allowing students
access to more instructional time and longer time to complete activities, and (d) quality
teachers. The benchmarks outline the knowledge that the students must master for all
stakeholders (teachers, administrators, parents, and students) (Haycock, 2001). A
rigorous curriculum, aligned with specific standards, was needed to make significant
differences in achievement (Haycock, 2001). Research conducted provided evidence to
the fact that all students could learn, but they must be provided with sufficient time and
quality instruction to achieve (Haycock, 2001). Finally, quality teachers were of utmost
importance. Teachers must be knowledgeable in their subject matter and be able to
deliver the material to students in an effective manner for learning to occur (Haycock,
2001).
Marzano, Pickering, and Pollock (2001) conducted research on successful schools
and reported there are five elements present in good and successful schools. Successful
schools had “guaranteed and viable curriculum, challenging goals and effective feedback,
parent and community involvement, safe and orderly environment, and collegiality and
professionalism” (p. 15). In addition, they found that schools that had strong
administrative leadership, high expectations for student achievement, emphasis on basic

47
skills achievement, and regular observation of student progress were also successful
(Marzano et al., 2001). Furthermore, they studied successful classrooms and reported
that “effective teachers appear to be effective with students of all achievement levels”
(Marzano et al., 2001, p. 1). Marzano et al. (2001) stated that the effect that a teacher has
on academic achievement could be found in: (a) utilizing effective classroom
management techniques, (b) making intelligent decisions on the most successful
instructional strategies to employ, and (c) creating a classroom curriculum to assist
student learning.
In fact, Marzano et al. (2001) concluded that the teacher has the greatest impact
on improving academic achievement. Woolridge (2003) reported that students taught by
teachers with master’s degrees, on average, outperform those students instructed by
teachers with a bachelor’s degree. Effective teachers at the secondary level typically
possessed an advanced degree in their subject field (Rosenthal, 2007). Goldhaber and
Brewer (2006) recommended a reason for increased student achievement in particular
content areas was due to “subject-specific training, rather than the teacher ability that
leads to these findings” (p. 15). Futhermore, teachers who possessed a degree in the
subject in addition to their teaching certification had a greater impact on student
achievement (Darling-Hammond, 1999).
In addition to degree type, research on teacher experience has demonstrated a
positive relationship with student achievement. Teachers with five years or more of
classroom experience have a positive effect on student achievement (“Teacher quality
and student achievement research review,” 2005). Gorman (2005) stated that “first-year
teachers have much lower performance on average than other teachers; after that, teacher
48
performance improves markedly, peaking in the teacher’s fourth year” (p. 1). The reason
for the improvement in teacher performance may be attributed to the fact that
experienced teachers served as mentors to first-year teachers (Rosenthal, 2007).
However, the positive effects of teacher experience and student achievement decreased
after a few years in the field (Goldhaber & Brewer, 2006). Factors that affected teacher
effectiveness as years passed has been attributed to tenure, burnout, and the fact that
experienced teachers left the profession or taught higher level courses (Goldhaber &
Anthony, 2004; Gorman, 2005; Teacher Quality, 2005; Walsh, 2001).
High-Performing, High-Poverty Schools
Although it is not easy for a school that served a high percentage of traditionally
underserved students to experience success, it does occur. Taylor, Teddlie, Freeman, and
Pounders (1998) conducted an investigation of four schools with unstable success and a
different make-up of students. The researchers found only one school during the study
that utilized appropriate instructional materials and protected instructional time. In
addition, the one identified successful school also served a large population of students
who lived in poverty (Taylor et al., 1998).
Williams (2003) examined schools in rural America that served a large percentage
of poverty and traditionally underserved students and were successful in closing the
achievement gap. Williams (2003) found that the key factors that contributed to their
success were smaller class sizes, quality teaching, and a “culturally relevant curriculum”
(p. 6). A study by Gregory (2003) identified three schools in the Detroit Public School
System that was successful despite its tremendous amount of students who lived in
poverty and traditionally underserved students. Gregory (2003) stated that the schools

49
were successful because the teachers and principals at each school were committed to the
goal of increasing student achievement. In addition, the school district included all
members of the school community in the decision-making process, and the teachers felt
empowered to perform their jobs at an effective level (Gregory, 2003). Johnson et al.
(2000) also examined research on successful schools and reported that “schools must
have a high expectation for their leaders, teachers, and students . . . showing students and
their parents that we believe all students can learn at a high level” (p. 10).
Ragland et al. (2002) performed a study of five high-performing and high-poverty
schools. Each of the schools studied “embraced the belief that all students can be
academically successful” (p. 1). Accordingly, common factors to the five schools
allowed for their success. The factors included: (a) regular and effective communication
across grade levels, (b) integrating special education into the regular education program,
(c) improving instruction based on test-driven data, (d) building on the strengths and
talents of the teaching staff, and (e) teamwork among colleagues to find solutions for
problems.
Reeves (2003) completed a study of “90/90/90 Schools,” which were schools that
had more than 90% poverty, 90% traditionally underserved students, who achieved at
least 90% or above on tests. The analysis of the data collected resulted in the
identification of five common characteristics of the schools including: (a) concentration
on academic achievement, (b) recurrent assessment, (c) stress placed on writing, (d)
unmistakable curriculum choices, and (e) outside scoring (Reeves, 2003). The schools
employed effective teachers and administrators that were “using strikingly similar
techniques without the assistance of externally imposed methods of instruction” (Reeves,
50
2003, p. 192). In addition, the study found that textbooks were not necessary to achieve
success because the techniques were replicable (Reeves, 2003). The successful schools
also used instruction and assessment in a consistent manner by focusing on the standards
and how they were applied, observed, and measured (Reeves, 2003).
Finally, Carter (2000) reviewed 21 high-performing, high-poverty schools. By
researching successful schools, Carter (2000) found that “the schools profiled hold all
students, of all races and income levels, to high standards and expectations----and then
make sure that all children succeed” (p. 3). Carter (2000) revealed that “parents were
clamoring to send their children to high performing schools” (p. 5). Also, he concluded
that “effective principals want parents who were personally invested in the education of
their children” (Carter, 2000, p. 14).
Carter (2000) also identified the role of the school principal in high performing
schools. The principals in these schools demonstrated characteristics typical of
instructional leaders who controlled staffing and the budget (Carter, 2000). The schools
had clear expectations, and “each student was held accountable for his or her own
success” (Carter, 2000, p. 17). The principals worked diligently to create a safe
environment centered on student learning (Jacobson, Johnson, Ylimaki, & Giles, 2005).
Jacobson et al. (2005) stated that an effective instructional leader was able to improve
school culture by providing the mechanism for the redesign of the organization through
the adjustment of school structures and collaboration. It is the role of an effective school
leader to create an environment centered on goals for the school which was shared among
stakeholders (Newstead, Saxton, & Colby, 2008).
51
Measurements utilized by effective instructional leaders included the development
and implementation of shared goals, a sense of common purpose, and high performance
expectations (Marsh, 2002; Newstead et al., 2008; Petrides & Guiney, 2002). Acting as
the instructional leader of the school, effective leaders find the time required needed to
make improvements to instruction (Newstead et al., 2008). Effective instructional
leaders worked tirelessly to recruit high quality teachers and invested the time required to
adequately train them to be successful (Newstead et al., 2008). Effective leaders
provided the staff intellectual stimulation and individualized support (Leithwood &
Reihl, 2005). While providing necessary support, an effective instructional leader
modeled appropriate behavior which inspired and motivated teachers to achieve and
improve their instruction which increased student achievement (Jacobson et al., 2005).
Effective Instructional Strategies
In a constructivist classroom, learning was student centered, and students learned
through their own experiences (Grennon-Brooks & Brooks, 1993). In a constructivist
classroom, the teacher acted as the driving force that allowed students to develop into
autonomous thinkers (Grennon-Brooks & Brooks, 1993). Constructivist teachers assisted
students to develop a concentrated awareness of concepts (Greenon-Brooks & Brooks,
2007). Students in a constructivist classroom did not repeat information presented in a
textbook or lecture; instead, they formulated their own questions and sought out answers
to those questions (Straits & Wilke, 2007). In addition, constructivist teachers assisted
students in using problem solving skills in order to analyze the new information that was
presented (Straits & Wilke, 2007). Instructional methods utilized in a constructivist

52
classroom included scaffolding, tutoring, cooperative learning, cognitive apprenticeship,
and metacognition (Royer, 2007).
Research conducted by Marzano et al. (2001) identified domains for teacher
improvement that led to student achievement. Based on the work of Marzano et al.
(2001), one of the most critical domains identified that improved student achievement
was effective classroom strategies and behavior used by the teachers (Heitin, 2011).
Marzano et al. (2001) identified nine effective instructional strategies that teachers used
in the classroom. The nine strategies included:
identifying similarities and differences,
summarizing and note taking,
homework and practice,
nonlinguistic representations,
cooperative learning,
setting objectives and providing feedback,
reinforcing effort and providing recognition,
generating and testing hypotheses, and
cues, questions, and advance organizers (p. 6-7).
The first strategy identified by Marzano et al. (2001) was the identification of
similarities and differences with the use of graphic organizers such as Venn diagrams or a
comparison matrix. Cognitively, the brain worked by building connections and making
associations (Marzano et al., 2001; Caine & Caine, 1991). Students developed schema
from old and new knowledge, which led to a deeper understanding of the content
(Haystead & Marzano, 2009). Through the use of analogies and metaphors, students
53
classified items based upon similarities and differences, which allowed for the students to
develop higher order thinking skills (BouJaoude & Tamin, 1998; Chen, 1999; Haystead
& Marzano, 2009). Students developed a greater comprehension using summarizing and
note taking, which was the second strategy identified by Marzano et al. (2001).
Summarizing allowed students to sift through an abundance of information and identify
what was important to them, and, in turn, students restated the information (Boch &
Piolat, 2005; Haystead & Marzano, 2009).
The third strategy identified was independent practice, usually assigned as
homework. Homework allowed students the opportunity to internalize new ideas or
processes and to practice activities that encompassed new matter and skills (Gagne, 1974;
Hunter, 1984). The positive effects of homework was greatly increased when
assignments were given on a regular basis, targeted recent instruction, elicited teacher
feedback, and did not require a significant amount of time (Marzano, 2004; Walberg,
Paschal, & Weinstein, 1985). Furthermore, any assignment, designed to be completed
independently, has been shown to impact student achievement by 28% (Marzano &
Pickering, 2007).
The fourth strategy of effective instruction was to represent knowledge in a
nonlinguistic manner (Marzano et al., 2001). A nonlinguistic strategy allowed students to
generate knowledge using measures that did not rely on language (Marzano et al., 2001).
On average, student achievement increased by 17 percentile points when teachers used
nonlinguistic strategies such as graphic organizers, drawings, and pictographs (Marzano
& Haystead, 2009). The fifth strategy outlined by Marzano et al. (2001) was cooperative
learning. Marzano (2003) and Wenglinsky (2002) found cooperative learning to be an
54
effective instructional practice. As a form of collaboration, cooperation was “working
together to accomplish shared goals” (Johnson & Johnson, 1989, p. 2).
Teachers who used cooperative groups divided students into heterogeneous
groups that allowed for maximum learning (Vaughn, 2002). The students cooperatively
worked toward specific objectives, tasks, and activities in the classroom (Johnson &
Johnson, 1989). Cooperative groups promoted academic accountability for the students
on the individual level and as a member of a group (Johnson & Johnson, 1989).
Furthermore, collaborative groups promoted the use of effective social skills among
group members (Johnson & Johnson, 1989).
The sixth strategy was setting goals and providing feedback. Marzano et al.
(2001) defined goal setting as “establishing a direction for learning” (p. 94). By setting
goals that included specific objectives, teachers supplied students with a clear path of
something to work toward (Woolfolk, 2001). The objects identified should include
specific details and performance criteria (Mager, 1975). When utilizing this strategy,
teachers provided timely feedback that was criterion specific (Marzano et al., 2001). In
a classroom setting, KWL charts and the use of contract learning goals were two
methods used to implement this strategy (Marzano et al., 2001).
The seventh strategy identified by Marzano et al. (2001) was recognizing effort
and providing recognition. Through the implementation of this strategy, students
believed that they could be successful by receiving positive feedback for their efforts
(Marzano et al., 2001). Students observed the relationship between effort and
achievement by demonstrating that the effort that was put forth in the completion of a
task had a direct effect on the achievement received (Harrop & Williams, 1992).
55
Teachers used verbal praise or concrete symbols such as stickers or awards that
provided recognition for achievement (Deci, Koestner, & Ryan, 2001).
The eighth strategy was generating and testing hypotheses. By generating and
testing a hypothesis, students applied a theoretical understanding of what was being
instructed (Kumar, 1991; Marzano et al., 2001). Students applied knowledge when
generating a hypothesis, which enhanced learning (Kumar, 1991). Teachers utilizing
this strategy incorporated inventions, decision making, problem solving, historical
studies, and experimental inquiry in their classrooms (Marzano et al., 2001). The final
strategy identified by Marzano et al. (2001) was cues, questioning, and advanced
organizers. Cues provided explicit reminders of the task that had to be completed
(Lobitz, 1974). High level questioning allowed students to analyze what they already
knew and apply it to the new idea that was presented (Lott, 1983). Advanced organizers
permitted students to focus on essential information and prepared them for the task at
hand (Luiten, Ames, & Ackerson, 1980).
Other effective instructional methods included vocabulary instruction,
scaffolding, and peer tutoring. Vocabulary provided essential background knowledge
and was linked to academic achievement (Chall, 1987; Marzano, 2004; Stahl, 1999).
Background knowledge was more important in the understanding of the reading process
than IQ (Marzano, 2004). Research has shown that students who were instructed
content specific vocabulary obtained 23 percentile points in comprehension ability
(Marzano et al., 2001). Using research-based practices, effective teachers identified
terms for direct instruction and evaluated and tracked students’ progress with new terms
(Marzano et al., 2001).

56
Based on the work of Vygotsky, scaffolding provided a mechanism for students to
complete tasks that initially they would not be able to accomplish without the support of
an adult (Bruner, 1975). As reported by Dickson, Chard, and Simmons (1993),
scaffolding is “the systematic sequencing of prompted content, materials, tasks, and
teacher and peer support to optimize learning” (p. 12). In a classroom setting, students
were provided with additional support when new ideas and topics were introduced, but
teachers removed guidance as the students began to demonstrate mastery allowing for
students to accept the responsibility of learning (Rosenshine & Meister, 1992). In the
educational setting, scaffolds included activities such as direct instruction, examples,
cues, prompts, clues, limited solutions, and think-aloud modeling (Hartman, 2002). The
scaffolds helped students to develop schema by building on prior knowledge and
internalizing new ideas (Olson & Platt, 2000).
Peer tutoring was an effective instructional strategy that allowed students to be
taught by their peers of the same age or grade or by students of a different age (Scruggs,
Mastropieri, & Berkeley, 2010, 2012; Topping, 2001). Peer tutoring required students to
work in pairs with another student of the same age or grade (Scruggs et al., 2010, 2012).
Students who participated in peer tutoring were trained and supervised by the classroom
teacher (Scruggs et al., 2010, 2012). For peer tutoring to be effective, the following
criteria was met: (a) teachers instructed students on how to be a tutoring expert; (b)
students were given a purposeful partner assignment; (c) teachers provided adequate
materials required for the assignments that will be used during peer tutoring; (d) tutors
were provided with structured tutoring procedures that include specific feedback that they

57
will provide to tutees; (e) the participants participated in role reversal; and (f) teachers
actively monitored the process (Scruggs et al., 2010, 2012).
Learning that involved actively engaging students has also shown to be an
effective instructional strategy in improving the achievement level of low performing
students (Johnson, Johnson, & Holubec, 1992; Kagan, 1994; Slavin, 1990). Marzano
(2003) stated that knowledge was constructed when students interacted with the physical
world. Using hands-on lessons, students used higher order thinking skills and various
learning strategies to create meaning and knowledge (Resnick, 1987). Grant (1985)
reported using a kinesthetic approach to teaching helped students to learn new concepts
through active, physical movement. Movement in the classroom has revealed to be a
measure that improved the attitude and motivation of students (Pirie, 1995; Strean, 2011;
Zimmerman, 2002). Teachers utilized various items such as rubber bands, computers,
modeling clay, puzzles, drawing materials, games, experiments, and field trips as
kinesthetic instructional methods (Hutton, 2013).
Summary
The task of closing the achievement gap and the elimination of the educational
discrepancies has been on the front-line of educational issues at the state and federal
levels for more than 50 years. Research pertaining to effective measures utilized to
reduce the achievement gap that existed among different populations of students has been
a vital component of education. The purpose of this study was to determine the effect
that specific instructional practices, assessments, and student learning methods had on
student academic achievement as measured by school accountability rankings. Schools
in high poverty areas can overcome being low performing with the implementation of
58
effective practices including constructivism, scaffolding, peer tutoring, and vocabulary
development (Bruner, 1975; Marzano, 2004; Resnick, 1987). Effective instructional
practices provided in a classroom had a direct relationship to the student success on
formative and standardized assessments regardless of socioeconomic status (Marzano et
al., 2001).
59
CHAPTER III
METHODOLOGY
Overview
Research pertaining to the factors that influenced educational change and its
impact on improving student achievement in high poverty schools is well documented
(Carter, 2000; Gregory 2003, Reeves, 2000; Taylor et al., 1998, Williams, 2003). In the
2010-2011 academic school year, the state of Mississippi had 152 school districts, of
which, only 78 were classified as successful or high performing (Mississippi Department
of Education, 2010b). In addition, more than half of the school districts failed to meet the
AYP requirements as outlined by NCLB (2001) (Mississippi Department of Education,
2010b). The purpose of this study was to examine the effect that specific instructional
practices, assessments, and student learning methods had on student achievement as
measured by the accountability system. The schools included in this study were located
in a district that had a minimum of 70% of its student body receive free or reduced lunch,
and each school was ranked as successful or high performing according to the results on
state mandated exams for the 2010-2011 school year. To identify these components,
subject area teachers from each of the identified school were surveyed. This chapter
contained a review of the methodology associated with the study and included the
following: (a) research design, (b) participants, (c) instrumentation, (d) procedures for
data collection, and (e) analysis.
Research Design
This research study was quantitative in its approach through the use of survey
methodology. Quantitative data was “based on testing a theory composed of variables,

60
measured with numbers, and analyzed with statistical procedures, in order to determine
whether the predictive generalizations of the theory hold true” (Creswell, 1994, p. 2).
Quantitative research was descriptive, objective, and attempted to study behavior under
controlled conditions. During quantitative research protocol, one collects data based on
precise measurements using structured and validated collection instruments (e.g., closed-
ended items, rating scales, behavioral responses) (Teddlie & Tashakkori, 2003).
This study was inferential by design and focused on the effect of research based
instructional methods including Marzano’s (2001) nine instructional methods by the
faculty at each of the identified schools. The study incorporated a voluntary, purposeful
sample. The survey research consisted of the direct mailing of the survey to faculty at the
identified schools. Analysis of data was conducted using Chi-Square and Multivariate
Analysis of Variance (MANOVA).
Participants
The schools included in this study met the following criteria: 1) Seventy percent
or more of the district’s student body received free or reduced lunch; 2) The school was
located to south of the state’s capital; and 3) The school received an accountability rating
of successful or high performing for the 2010-2011 school year. The data pertaining to
the mentioned criteria was acquired, compiled, and analyzed using the 2010-2011
Children’s First Report, which is located on the MDE Public Report webpage
(Mississippi Department of Education, 2010c). Twenty two schools in sixteen school
districts were identified as meeting the above criteria. Of the 22 identified schools, seven
received high performing rankings, and 15 received successful ratings (Table 3). The
participants for the study included secondary subject area teachers from each of the
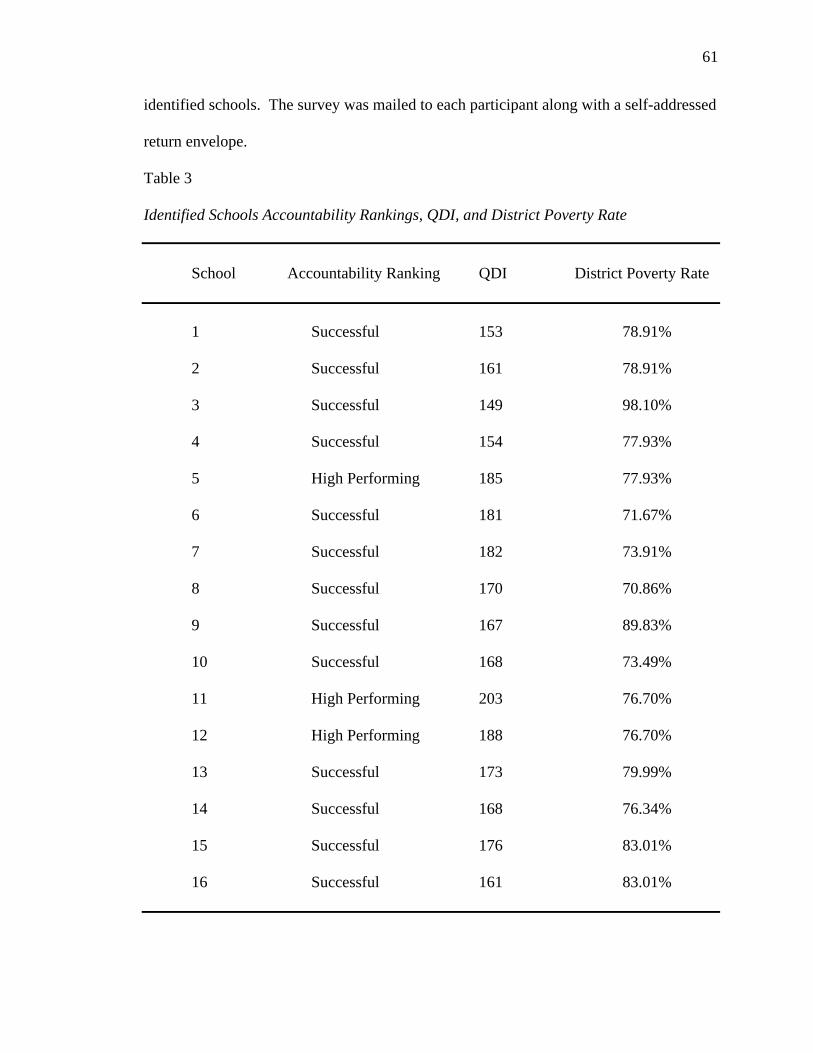
61
identified schools. The survey was mailed to each participant along with a self-addressed
return envelope.
Table 3
Identified Schools Accountability Rankings, QDI, and District Poverty Rate
School Accountability Ranking QDI District Poverty Rate
1 Successful 153 78.91%
2 Successful 161 78.91%
3 Successful 149 98.10%
4 Successful 154 77.93%
5 High Performing 185 77.93%
6 Successful 181 71.67%
7 Successful 182 73.91%
8 Successful 170 70.86%
9 Successful 167 89.83%
10 Successful 168 73.49%
11 High Performing 203 76.70%
12 High Performing 188 76.70%
13 Successful 173 79.99%
14 Successful 168 76.34%
15 Successful 176 83.01%
16 Successful 161 83.01%

62
Table 3 (continued).
School Accountability Ranking QDI District Poverty Rate
17 Successful 193 81.25%
18 High Performing 203 74.45%
19 High Performing 195 74.45%
20 High Performing 195 74.45%
21 Successful 144 89.00%
22 High Performing 191 71.30%
Note: The mean QDI for the successful schools was 167, and the mean QDI for the high performing schools was 194.
Instrumentation
This study utilized an established survey that was created by Columbia University
with the aid of a grant (Award # 9812142) from the National Science Foundation.
SWEPT (Scientific Work Experience Programs for Teachers) (SWEPTs) (Appendix A).
SWEPTs was a four-year multi-site student impact study designed to improve the field of
science by providing participating teachers with hands-on training to increase their
expertise in the field. The survey was tested for content validity through a “rigorous
review process with participating SWEPT Program Managers and members of the
study’s advisor board” (SWEPT Multi-site Student Outcome Instruments, 2001, para. 1).
In addition, eight teachers participated in a pre-test of the SWEPT survey (SWEPT Multi-
site Student Outcome Instruments, 2001). The researcher obtained permission to use the
instrument from Dubner, who was the SWEPT Project Coordinator at Columbia
University (Appendix B). According to the Jay Dubner the purpose of the pre-program

63
survey was to collect data in regards to the participating teacher’s educational
background, professional experiences, and instructional practices. Slight modifications
were made on the SWEPT survey including the title prior to distribution to the identified
schools (Appendix C).
The modified survey was piloted for reliability. The piloted study was distributed
to instructors who were employed in a secondary school with a similar student body
population as the schools included in this study. Internal reliability was established by
calculating Cronbach alphas for survey questions three and four. The Cronbach alpha for
question three was .72 and .82 for question four.
The survey consisted of four statements that outlined instructional practices,
learning methods, and assessments. Each statement for the instructional practices,
learning methods, and assessments had various statements listed below that included a
four-point or five-point Likert-type scale that was used by the respondents to rate how
often they utilized each instructional practice, method, or assessment in their classroom.
In survey question two, respondents were asked to rate the emphasis they placed on goals
and objects (instructional practices) (where 1 = none, 2 = minor, 3 = moderate, and 4 =
major). In survey question three, respondents were asked to rate the frequency at which
they implored specified teaching methods (instructional practices) (where 1 = never, 2 =
1 to 2 times per month, 3 = 1 to 2 times per week, 4 = almost every class, and 5 = every
class). In survey question four, respondents were asked to rate the frequency of the
utilization of specified student learning methods (where 1 = never, 2 = 1 to 2 times per
month, 3 = 1 to 2 times per week, 4 = almost every class, and 5 = every class). In survey
question five, the respondents were asked to rate the extent of utilization of specified

64
assessments (where 1 = not at all, 2 = slight extent, 3 = moderate extent, and 4 = great
extent).
In addition, questions pertaining to teacher certification level, years of experience,
and highest degree earned were asked. Respondents were asked to indicate their teaching
certification level (where 1 = regular, 2 = provisional, and 3 = emergency). The
respondents were asked to indicate their total years of experience in survey question six
(where 1 = 0 to 5, 2 = 6 to 10, 3 = 11 to 15, 4 = 16 to 20, 5 = 21 to 25, and 6 = 25 or
more). The respondents were asked to indicate their highest degree earned in survey
question seven (where 1 = B.S., 2 = M.Ed., 3 = Ed.S, 4 = Ph.D, and 5 = other). The
respondents were asked to indicate their type of certification in survey question eight
(where 1 = regular certification, 2 = provisional certification, and 3 = emergency
certification). Survey question ten implored an open ended statement where the
respondents could provide their professional opinion in regard to the reasons for their
school’s success. The responses were reviewed for consistent responses and discussed in
Chapter IV.
Research Questions
The following proposed questions were the focus of this study:
1. To what degree, and to what extent, do certification level, teaching experience,
and highest degree earned of the subject area teachers serving in the high poverty,
high performing schools and teachers who taught at the high poverty, successful
schools identified by the school accountability model in the southern region of the
state of Mississippi impact school performance?

65
2. To what degree, and to what extent, do the instructional practices employed by
subject area teachers serving in the high poverty, high performing schools and
teachers who taught at the high poverty, successful schools identified by the
school accountability model in the southern region of the state of Mississippi
impact school performance?
3. To what degree, and to what extent, do the assessments of subject area teachers
serving in high poverty, high performing schools and teachers who taught at the
high poverty, successful schools identified by the school accountability model in
the southern region of the state of Mississippi impact school performance?
4. To what degree, and to what extent, do the type of student learning methods of
subject area teachers serving in high poverty, high performing schools and
teachers who taught at the high poverty, successful schools identified by the
school accountability model in the southern region of the state of Mississippi
impact school performance?
Data Collection
All procedural guidelines of the University Institutional Review Board (IRB)
were followed to ensure anonymity of the subjects and participation protection. Final
IRB approval was obtained for this research (See Appendix D). Permission from each of
the identified district’s superintendents was obtained via telephone conversations. Each
of the district superintendents emailed a letter granting consent for the study to be
conducted at the school (Appendix E). If required by the superintendent, verbal
permission via telephone conversations was obtained from the school principal for the
distribution of the survey to the subject area teachers. In addition, the researcher obtained

66
the total number for teachers for each subject area via telephone conversation with the
secretary or principal. An envelope addressed as “algebra I teacher,” “biology I teacher,”
“English II teacher,” and “U. S. History” teacher was mailed to each school address. In
each envelope, a cover letter from the researcher explaining the purpose of the study and
need for the survey was included (Appendix F). Directions for completing the study and
confidentiality measures were provided on the cover letter. In addition to the cover letter,
all participants were mailed the survey and self-addressed return envelope. The self-
addressed return envelope was included to encourage a greater rate of participation.
Participation for the study was voluntary. At the end of the data collection, 78 of the 283
mailed surveys were returned. Of the 78 surveys returned, 45 were from teachers at the
successful schools, and 33 were from the high performing schools. All 22 identified
schools were represented by the returned surveys.
Data Analysis
This research consisted of five research questions. To ensure confidentiality of
the survey results, each identified school was assigned a specific number prior to the
receipt of the survey. Data obtained from the returned surveys was coded and entered
into a statistical analysis software program. Analysis of the data began by coding each
self-addressed envelope and survey. Analysis of the research questions was completed
using either chi-square or MANOVA, and the alpha for statistical analysis was set at
0.01. Three separate chi-squares were used to address each variable outlined in research
question one, and MANOVA was used to address questions two through four.
67
Research Question 1
A separate chi-square analysis was used for each dependent variable to determine
if a significant difference existed in the type of teaching certification, years of experience
and highest degree level for the faculty at the successful or high performing schools. This
question was addressed on survey question six (experience), question seven (degree
level), and question eight (teaching certification). For this question, the independent
variable included school ranking (successful or high performing), and the dependent
variables were experience, degree level, and teaching certification.
Research Question 2
For this question, a MANOVA was used to determine if significant difference(s)
existed in the instructional practices utilized by faculty members at the successful schools
and faculty members at the high performing schools. This question was addressed on
survey questions two and three. The instructional practices analyzed by the survey
questions served as the dependent variables. The independent variable was school
ranking.
Research Question 3
For this question, a MANOVA was used to determine if significant difference(s)
existed in the assessments utilized by faculty members at the successful schools and
faculty members at the high performing schools. This question was addressed on survey
question five. The assessments analyzed by survey question served as the dependent
variables. The independent variable was school ranking.
68
Research Question 4
For this question, a MANOVA was used to determine if significant difference(s)
existed in the student learning activities utilized by faculty members at the successful
schools and for faculty members at the high performing schools. This question was
addressed on survey question four. The student learning activities analyzed by survey
question four served as the dependent variables. The independent variable was school
ranking.
Summary
Chapter III provided information detailing the methodology used in this study.
The information that addressed the research questions was obtained using surveys, and
the data was analyzed using chi-square and MANOVA. The data obtained was used to
analyze the effect that specific instructional practices, assessments, and student learning
strategies had on student achievement as measured by school accountability ranking. In
the upcoming chapter, findings from the study are presented.

69
CHAPTER IV
RESULTS
Introduction
The constraints passed by NCLB have placed a tremendous amount of pressure on
schools leaders at the district, school, and classroom level. Schools are held
accountability for student achievement as measured by scores obtained on standardized
measures in the form of high stakes tests. At the classroom level, teachers are held
accountable for the achievement of all students and are required to provide instruction
that will ensure student success. This quantitative study examined the effect that specific
instructional practices, assessments, and student learning methods had on student
achievement as measured by school accountability rankings. An analysis of the data is
presented in this chapter. A total of 78 surveys were received from the 283 distributed
surveys, which constituted a 26.6% response rate for the survey. The responses gathered
from the survey have been analyzed using SPSS software. This chapter focused on a
presentation of the collected data that will assist the discussion, which will be presented
in Chapter V.
Statistical Analysis
Statistical analysis was completed on each of the four research questions. Each
research question is presented with a review of all statistical analysis procedures that
were completed.
Test of Research Questions
Research Question 1
1. To what degree, and to what extent, do certification level, teaching experience,
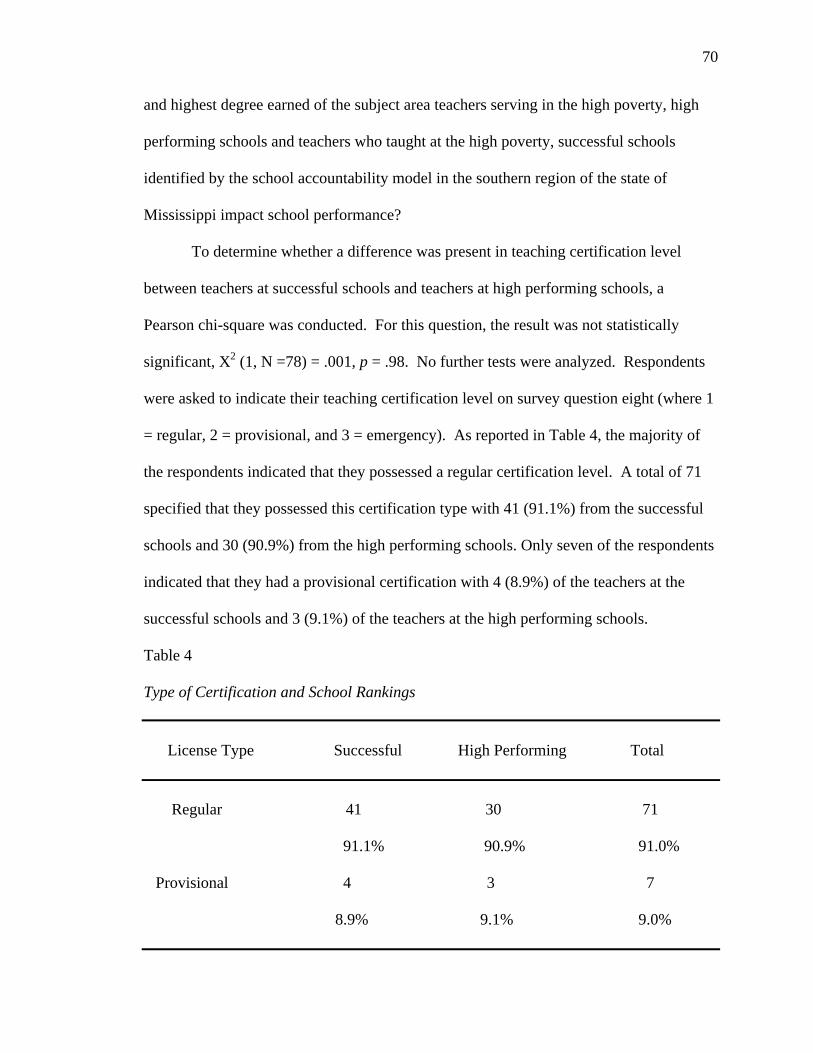
70
and highest degree earned of the subject area teachers serving in the high poverty, high
performing schools and teachers who taught at the high poverty, successful schools
identified by the school accountability model in the southern region of the state of
Mississippi impact school performance?
To determine whether a difference was present in teaching certification level
between teachers at successful schools and teachers at high performing schools, a
Pearson chi-square was conducted. For this question, the result was not statistically
significant, X2 (1, N =78) = .001, p = .98. No further tests were analyzed. Respondents
were asked to indicate their teaching certification level on survey question eight (where 1
= regular, 2 = provisional, and 3 = emergency). As reported in Table 4, the majority of
the respondents indicated that they possessed a regular certification level. A total of 71
specified that they possessed this certification type with 41 (91.1%) from the successful
schools and 30 (90.9%) from the high performing schools. Only seven of the respondents
indicated that they had a provisional certification with 4 (8.9%) of the teachers at the
successful schools and 3 (9.1%) of the teachers at the high performing schools.
Table 4
Type of Certification and School Rankings
License Type Successful High Performing Total
Regular 41 30 71
91.1% 90.9% 91.0%
Provisional 4 3 7
8.9% 9.1% 9.0%

71
Table 4 (continued).
License Type Successful High Performing Total
8.9% 9.1% 9.0%
Total 45 33 78%
100% 100% 100%
To determine whether a difference was present in total years of experience
between teachers at successful schools and teachers at high performing schools, a
Pearson chi-square was conducted. For this question, the result was not statistically
significant, X2 (5, N =78) = 3.96, p = .56. No further tests were analyzed. Respondents
were asked to indicate their years of experience on survey question 6 (where 1 = 0 to 5, 2
= 6 to 10, 3 = 11 to 15, 4 = 16 to 20, 5 = 21 to 25, and 6 = 25 or more). As reported in
Table 5, a relative equal percentage of respondents from the successful schools indicated
0-5 years of experience (20%), 6-10 years of experience (22%), and 11-15 (22%) years of
experience. Of the 33 respondents from the high performing schools, only two (6%)
indicated that they had less than five years of experience. In addition, of the 33
respondents from the high performing schools, almost half (15) had instructed more than
six years but less than 15 years. Twenty three percent (9) of the teachers from high
performing schools had 6-10 years of experience, and six (18.2%) had 11-15 years of
experience. For the fourth group (16-20 years), seven (15.6%) teachers from the
successful schools and eight (24.2%) from the high performing dictated this response.
The fifth group (21-25 years) had a total of seven teachers that indicated this response of
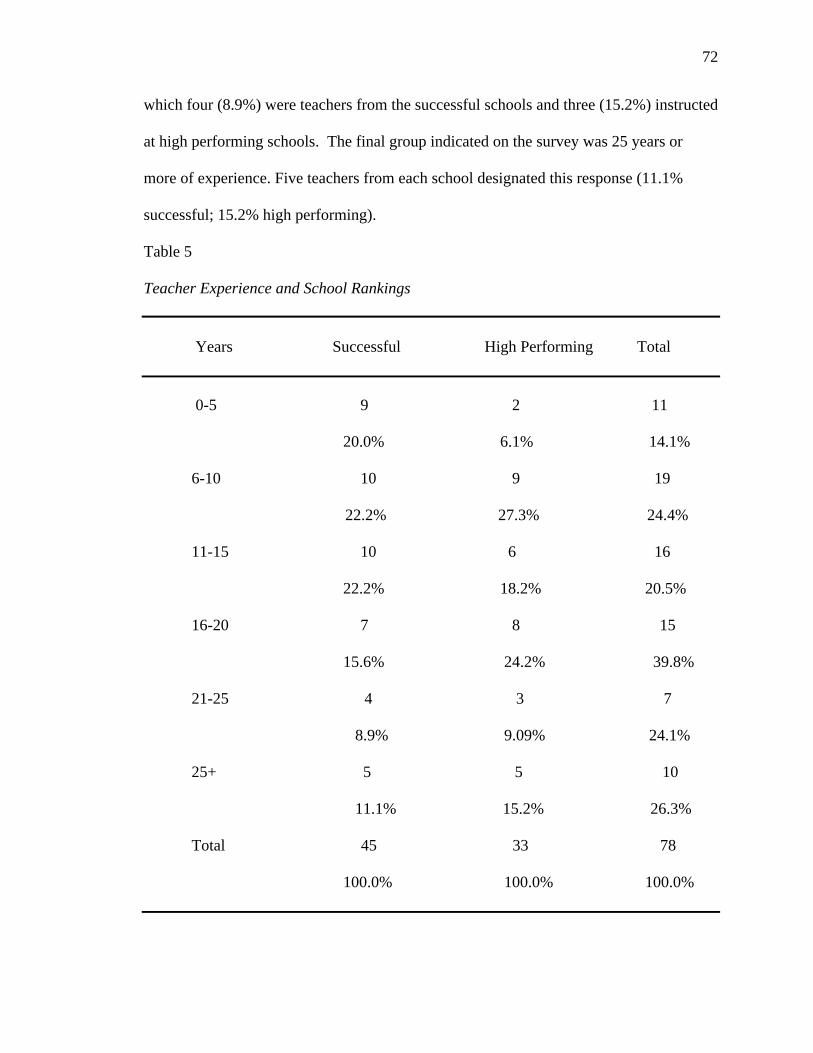
72
which four (8.9%) were teachers from the successful schools and three (15.2%) instructed
at high performing schools. The final group indicated on the survey was 25 years or
more of experience. Five teachers from each school designated this response (11.1%
successful; 15.2% high performing).
Table 5
Teacher Experience and School Rankings
Years Successful High Performing Total
0-5 9 2 11
20.0% 6.1% 14.1%
6-10 10 9 19
22.2% 27.3% 24.4%
11-15 10 6 16
22.2% 18.2% 20.5%
16-20 7 8 15
15.6% 24.2% 39.8%
21-25 4 3 7
8.9% 9.09% 24.1%
25+ 5 5 10
11.1% 15.2% 26.3%
Total 45 33 78
100.0% 100.0% 100.0%

73
The final variable included in research question one was highest degree earned.
To determine whether a difference was present in type of degree earned between teachers
at successful schools and teachers at high performing schools, a Pearson chi-square was
conducted. For this question, the result was not statistically significant, X2 (2, N =78) =
2.18, p = .34. No further tests were analyzed. Respondents were asked to indicate their
highest degree on survey question seven (where 1 = B.S., 2 = M.Ed., 3 = Ed.S, 4 = Ph.D.,
and 5 = other). As reported in Table 6, the majority (53.8%) of the 78 respondents
possessed a degree certification at the Master’s level. At the Bachelor level, 21 (46.7%)
of the 45 teachers at the successful school had a Bachelor of Science (B.S.) or Bachelor
of Arts (B.A.) degree whereas 13 (39.4%) of the teachers at the high performing teachers
had the same level of education. Of the 45 teachers from successful school that
responded, only 22 (48.9%) indicated that they had a Master of Science (M.S.) or Master
of Education (M.Ed.) degree. Based on the same degree level, 22 (60.6%) of the 33
respondents from the high performing school indicated the same level. The highest
degree indicated by the respondents was a Specialist in Education (Ed.S.). Only two (2.6
%) of the total respondents reported that they possessed an Ed.S.
Table 6
Highest Level Degree Earned and School Rankings
Degree Successful High Performing Total
Bachelor of Science (BS)/ 21 13 34Bachelor of Arts (BA) 46.7% 39.4% 43.6%

74
Table 6 (continued).
Degree Successful High Performing Total
Master’s in Science (MS)/ 22 20 42Master’s in Education (MEd)
48.9% 60.6% 53.8%
Specialist’s in Education (EdS) 2 0 2 4.4% 0.0% 2.6
Total 45 33 78
100.0% 100.0% 100.0%
Research Question 2
2. To what degree, and to what extent, do the instructional practices employed by
subject area teachers serving in the high poverty, high performing schools and teachers
who taught at the high poverty, successful schools identified by the school accountability
model in the southern region of the state of Mississippi impact school performance?
A Multivariate Analysis of Variance (MANOVA) was conducted to determine if
a significant difference existed in the instructional practices of teachers at the successful
schools and teachers from the high performing schools. The statistical tests were
evaluated at the significance of .05. There was no statistically significant relationship
with a F(12, 65) = 1.35, p =.211 indicating no difference in the emphasis of selected
instructional practices or the frequency of use in selected instructional practices of
teachers at successful school and teachers at the high performing schools. No further tests
were necessary. The means and standard deviations for the emphasis and use of
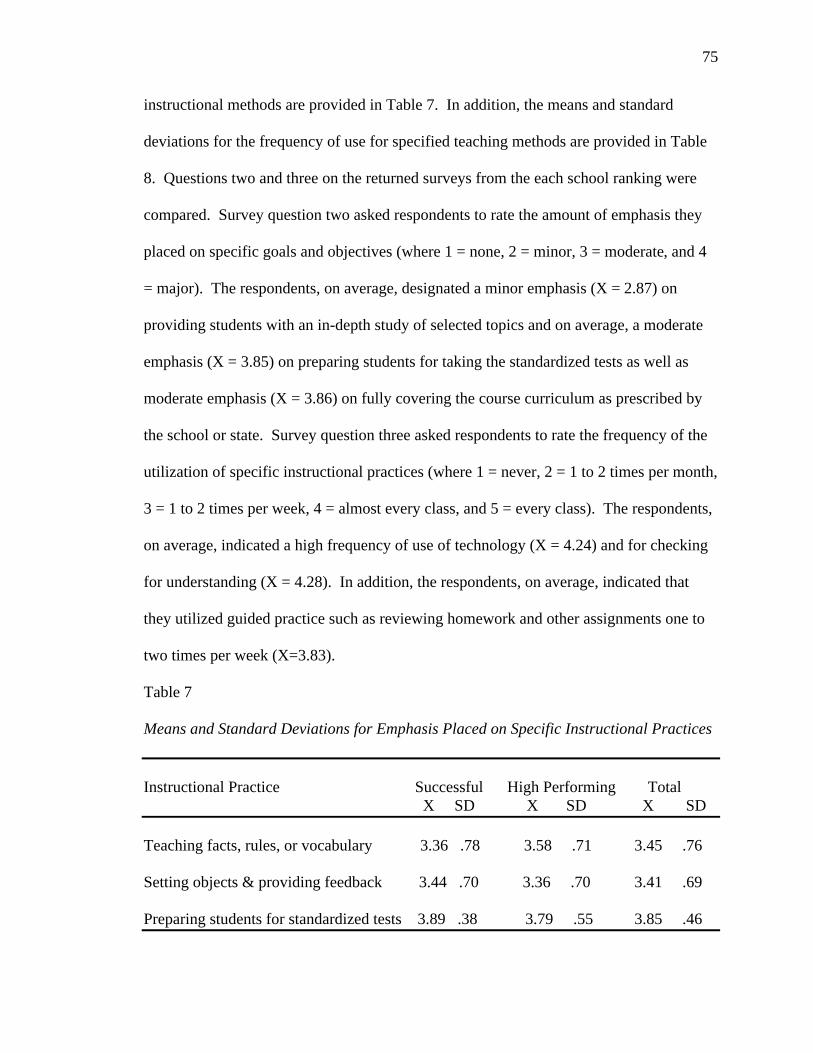
75
instructional methods are provided in Table 7. In addition, the means and standard
deviations for the frequency of use for specified teaching methods are provided in Table
8. Questions two and three on the returned surveys from the each school ranking were
compared. Survey question two asked respondents to rate the amount of emphasis they
placed on specific goals and objectives (where 1 = none, 2 = minor, 3 = moderate, and 4
= major). The respondents, on average, designated a minor emphasis (X = 2.87) on
providing students with an in-depth study of selected topics and on average, a moderate
emphasis (X = 3.85) on preparing students for taking the standardized tests as well as
moderate emphasis (X = 3.86) on fully covering the course curriculum as prescribed by
the school or state. Survey question three asked respondents to rate the frequency of the
utilization of specific instructional practices (where 1 = never, 2 = 1 to 2 times per month,
3 = 1 to 2 times per week, 4 = almost every class, and 5 = every class). The respondents,
on average, indicated a high frequency of use of technology (X = 4.24) and for checking
for understanding (X = 4.28). In addition, the respondents, on average, indicated that
they utilized guided practice such as reviewing homework and other assignments one to
two times per week (X=3.83).
Table 7
Means and Standard Deviations for Emphasis Placed on Specific Instructional Practices
Instructional Practice Successful High Performing Total X SD X SD X SD
Teaching facts, rules, or vocabulary 3.36 .78 3.58 .71 3.45 .76
Setting objects & providing feedback 3.44 .70 3.36 .70 3.41 .69
Preparing students for standardized tests 3.89 .38 3.79 .55 3.85 .46
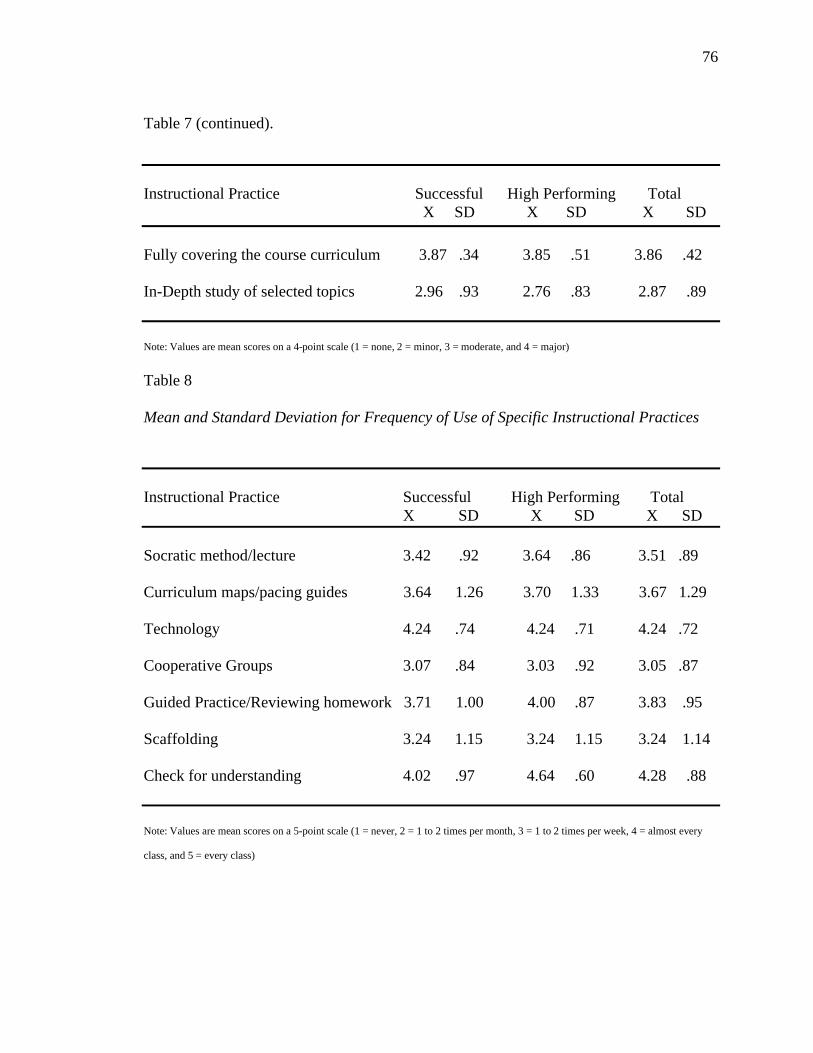
76
Table 7 (continued).
Instructional Practice Successful High Performing Total X SD X SD X SD
Fully covering the course curriculum 3.87 .34 3.85 .51 3.86 .42
In-Depth study of selected topics 2.96 .93 2.76 .83 2.87 .89
Note: Values are mean scores on a 4-point scale (1 = none, 2 = minor, 3 = moderate, and 4 = major)
Table 8
Mean and Standard Deviation for Frequency of Use of Specific Instructional Practices
Instructional Practice Successful High Performing Total X SD X SD X SD
Socratic method/lecture 3.42 .92 3.64 .86 3.51 .89
Curriculum maps/pacing guides 3.64 1.26 3.70 1.33 3.67 1.29
Technology 4.24 .74 4.24 .71 4.24 .72
Cooperative Groups 3.07 .84 3.03 .92 3.05 .87
Guided Practice/Reviewing homework 3.71 1.00 4.00 .87 3.83 .95
Scaffolding 3.24 1.15 3.24 1.15 3.24 1.14
Check for understanding 4.02 .97 4.64 .60 4.28 .88
Note: Values are mean scores on a 5-point scale (1 = never, 2 = 1 to 2 times per month, 3 = 1 to 2 times per week, 4 = almost every
class, and 5 = every class)

77
Research Question 3
3. To what degree, and to what extent, do the assessments of subject area teachers
serving in high poverty, high performing schools and teachers who taught at the high
poverty, successful schools identified by the school accountability model in the southern
region of the state of Mississippi impact school performance?
A Multivariate Analysis of Variance (MANOVA) was conducted to determine if
a significant difference existed in the assessments used by teachers at the successful
schools and teachers from the high performing schools. The statistical tests were
evaluated at the significance of .05. There was no statistically significant relationship
with a F(5, 72) = 1.28, p =.282 indicating no difference in the extent of certain
assessments utilized in the successful schools or high performing schools. No further
tests were analyzed. The means and standard deviations for each assessment for the
successful schools and high performing schools are provided in Table 9. The respondents
were asked to rate the extent of utilization of specified assessments (where 1 = not at all,
2 = slight extent, 3 = moderate extent, and 4 = great extent). The respondents, on
average, specified districts assessments (X = 3.71) and tests with short answers (i.e.,
multiple choice and true/false) (X = 3.15) as moderate extent. Furthermore, the
respondents, on average, indicated student portfolios (X = 2.14) and pre-tests (X = 2.21)
as slight extent.

78
Table 9
Means and Standard Deviations for the Extent of Type of Assessments to Determine Progress
Assessment Successful High Performing Total X SD X SD X SD
Pre-tests 2.27 .96 2.12 1.02 2.21 .99
Short-answer tests 3.27 .99 3.00 .97 3.15 .98
Open-ended response tests 2.24 .88 2.61 1.03 2.40 .96
Student products 2.24 .96 2.00 .97 2.14 .96
District Assessments 3.73 .62 3.67 .65 3.71 .63
Note: Values are mean scores on a 4-point scale (1= not at all, 2 = slight extent, 3 = moderate extent, and 4 = great extent)
Research Question 4
4. To what degree, and to what extent, does the type of student learning methods of
subject area teachers serving in high poverty, high performing schools and teachers who
taught at the high poverty, successful schools identified by the school accountability
model in the southern region of the state of Mississippi impact school performance?
A Multivariate Analysis of Variance (MANOVA) was conducted to determine if
a significant difference existed in the student learning methods utilized by the teachers at
the successful schools and teachers from the high performing schools. The statistical
tests were evaluated at the significance of .05. There was no statistically significant
relationship with a F(6, 71) = .870, p =.521 indicating no difference in the use of student
learning methods utilized in the successful schools or high performing schools. No
further tests were analyzed. The means and standard deviations for each learning method
for the successful schools and high performing schools are provided in Table 10. The
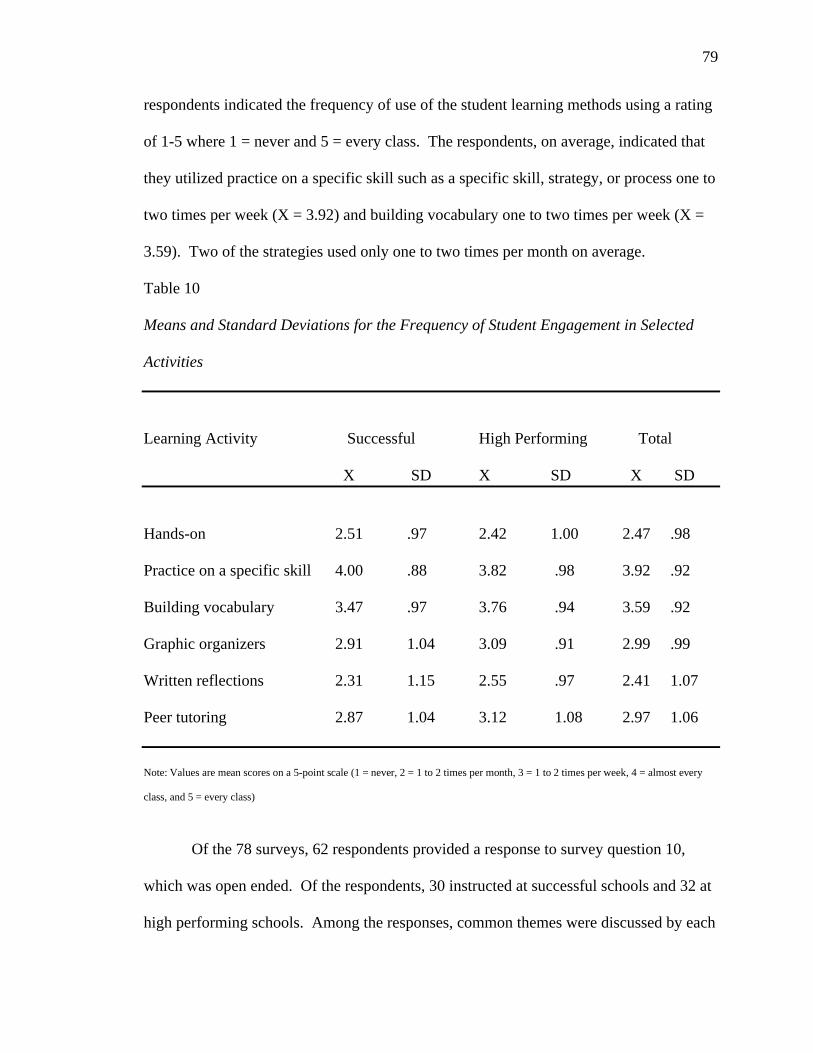
79
respondents indicated the frequency of use of the student learning methods using a rating
of 1-5 where 1 = never and 5 = every class. The respondents, on average, indicated that
they utilized practice on a specific skill such as a specific skill, strategy, or process one to
two times per week (X = 3.92) and building vocabulary one to two times per week (X =
3.59). Two of the strategies used only one to two times per month on average.
Table 10
Means and Standard Deviations for the Frequency of Student Engagement in Selected
Activities
Learning Activity Successful High Performing Total
X SD X SD X SD
Hands-on 2.51 .97 2.42 1.00 2.47 .98
Practice on a specific skill 4.00 .88 3.82 .98 3.92 .92
Building vocabulary 3.47 .97 3.76 .94 3.59 .92
Graphic organizers 2.91 1.04 3.09 .91 2.99 .99
Written reflections 2.31 1.15 2.55 .97 2.41 1.07
Peer tutoring 2.87 1.04 3.12 1.08 2.97 1.06
Note: Values are mean scores on a 5-point scale (1 = never, 2 = 1 to 2 times per month, 3 = 1 to 2 times per week, 4 = almost every
class, and 5 = every class)
Of the 78 surveys, 62 respondents provided a response to survey question 10,
which was open ended. Of the respondents, 30 instructed at successful schools and 32 at
high performing schools. Among the responses, common themes were discussed by each
80
group of teachers and included remediation/tutoring, dedicated/caring teacher/high
expectations, supportive and visible administration, creative scheduling, praise/rewards,
and parent and community involvement. One respondent from a successful school noted:
We prepare students for the SATP by using many different strategies including
giving state test practice problems throughout the class, practice tests designed
very similar to the “real thing,” covering the material in several different ways,
and the involvement of the students in the tutoring program offered by the
district.
Another teacher from a successful school also reported the positive effects of
tutoring which was offered by the district “all year long, after school, and on Saturdays.”
The same teacher explained that the district provided transportation for students who
attended tutoring. Tutoring was also discussed by the respondents from the high
performing schools. One respondent from the high performing school stated that the
school participated in “pull-out tutoring and Saturday workshops.” A teacher from the
same high performing school stated, “Our teaching staff targets low students by tutoring
them in all departments regardless of certification level.” In addition, another teacher
from a high performing school stated that the school offered “extensive tutoring and
review classes for those who fail or those who need an extra boost.”
Knowledgeable and caring teachers were listed as factors for success in both
settings. One respondent from a high performing school wrote, “Teachers have
compassion for students and provide motivation for their success, and teachers are
certified in subject areas and many with multiple certifications.” Another respondent
from a high performing school stated, “We have dedicated teachers who give it all and
81
are well knowledgeable and experts in their area or on what they teach.” One respondent
from a successful school stated, “Teachers constantly motivated students throughout the
year.” In addition, a respondent from the same successful school indicated, “We have
some of the highest quality teachers I have ever met. Many of our teachers have
advanced degrees and spend countless hours and dollars of their own to make our school
great.” Two respondents from the same successful school reported the positive effects of
teachers stated that they have “hard-working, highly qualified teachers that have high
expectations of our students” and “quality, hard-working teachers who possess in-depth
subject area knowledge and who teach structured classes with emphasis on state test
content.” Finally, respondents stated that they worked with caring personnel. One
respondent from a successful school indicated, “We are not above driving students to
schools or going to homes and picking them up.” A respondent from a high performing
school stated that their school employed “caring teachers who work hard to teach the
whole student.”
The respondents from each school setting placed a great emphasis on visible and
supportive administration. The respondents discussed the fact that they were provided
with materials, professional development, and support by the administration. Several
provided explanations in regard to the role of the administrator in setting the tone and
environment for all to succeed. One participant from a successful school stated that the
administration conducted “daily walk-through” to observe bell-to-bell teaching and to
help “manage student behavior in class and create a safe climate.” Another teacher from
a successful school stated that they had “adequate access to technology” provided for
teachers and students by the administration. One respondent from a high performing

82
school stated that the administration was “highly visible in the discipline process and
incredible involved with the students and their family.” Finally, another respondent from
a high performing school stated that the districts make sure that “funds are available to
further our children’s education including technology and all the supplies that we need to
be productive.”
Scheduling was indicated by both populations as a method utilized by their
respective schools to ensure student success. Some examples included pre-requisites for
each subject area, block scheduling prior to testing, intensive test preparation a month
before the test dates, and requiring struggling students to enroll in two periods of the
same class. A respondent from a successful school indicated that the pacing guide that
was established by the district allotted enough time to finish the curriculum early, which
allowed them “four weeks before the state test to review materials and teach test taking
strategies.” The respondent also stated the school “blocks the core classes, meaning that
students are in two periods of the same subject in a day instead of one.” A respondent
from a different successful school stated they used “block scheduling leading up to the
test.”
The final two themes provided by the open ended question on the survey was
praise/rewards and parental/community involvement. The respondents from the
successful schools provided examples for rewards including passes to all athletic events,
verbal praise, and allowing students the choice for specific teachers for the upcoming
school year. One respondent from a successful school listed rewards for both teachers
and students, but did not provide a specific example of either. Respondents from both
settings listed parental community support, but no specific examples from the successful

83
school were documented. One respondent from the high performing school stated that the
“parents are involved in various committees” and that the parents are “involved in all
decisions that affect the student body as a whole.”
Summary
This chapter contained an overview of the examination and evaluation of the
quantitative data analysis. The results of chi-square showed no significant difference in
the certification level, years of experience, or highest level of degree for the teachers at
successful schools and high poverty schools. The results of the MANOVA showed no
significant difference in the utilization of specified instructional methods, assessments, or
student learning methods by the teachers at successful schools or high performing
schools. Certain themes emerged from the results of the quantitative data and the open
ended survey questions and will be discussed in Chapter V.

84
CHAPTER V
CONCLUSIONS AND RECOMMENDATIONS
Introduction
The purpose of this quantitative study was to determine the effect that specific
researched based instructional methods, assessments, and student learning methods had
on student academic achievement as measured by school accountability rankings. This
study was conducted at 22 secondary schools in Mississippi that were located in a district
with a minimum of its student body receiving free or reduced lunch for 2010-2011. The
survey, “Effective Instructional Methods Utilized in Successful and High Performing
Secondary Schools in the Southern Region of Mississippi,” was administered and a total
of 78 faculty members from successful and high performing secondary schools
completed the survey.
Discussion and Conclusions
The analyses of the data were presented in Chapter IV. A discussion of the results
is offered here.
Research Question 1
Research question one focused on three demographic variables including
certification level, years of experience, and highest level degree earned and the effect that
these variables had on student academic achievement as measured by school
accountability ratings. The variables were tested for significance using three separate
chi-square statistical analyses. This study included 78 teachers of whom 45 instructed at
successful schools and 33 instructed at high performing schools. There was no
significant difference between the certification level, years of experience, or degree level

85
and student achievement as measured by school accountability rankings. The type of
degree held by the respondents was not significantly different for successful and high
performing schools. The data indicated that the majority of the teachers at the high
performing schools, on average, had more than five years of experience, but the
difference was not significant enough to say that a teacher’s years of experience has a
direct correlation to student success. According to Marzano (2003), a teacher’s
performance may improve as time elapses. As a teacher gains experience, he or she are
provided with opportunities to learn from their mistakes and obtain guidance from their
more experienced colleagues (Rosenthal, 2007). In addition, although type of degree
held by the respondents was not significantly different for successful and high performing
schools, the majority of the respondents from the high performing schools had an
advanced degree. Prior research on effective teachers and student achievement revealed
that teachers that possessed content specific advanced degrees had a more positive effect
than those with a generalized advanced degree (Rice, 2003).
Research Question 2
Research question two investigated the relationship between specific instructional
methods and student achievement as measured by school accountability rankings.
Research based instructional methods including scaffolding, peer tutoring and Marzano’s
(2001) nine effective instructional methods were analyzed (Dickson et al., 1993;
Hartman, 2002; Marzano, 2001; Olson & Pratt, 2000; Scruggs et al., 2010, 2012,
Topping, 2001). When tested with a Multivariate Analysis of Variance (MANOVA), no
statistically significant relationship was found in the means between the instructional
methods utilized by the respondents from the successful schools and those from high
86
performing schools. The instructional method least used by both populations was an in-
depth study of selected topics. This finding was anticipated due to the accountability
mandates of NCLB (2001) that required annual standardized testing and for states to
design frameworks that were aligned with the tests; however, these frameworks were not
intended for a comprehensive study of topics (Clark & Clark, 2000; Hess & Brigham,
2000; Olson, 2002). Respondents from both successful and high performing schools
indicated a frequent use of technology in their classrooms and of measures to check for
understanding.
Strategies for checking for understanding that were included on the survey were
peer tutoring, cooperative groups, and scaffolding. The respondents from the high
performing schools indicated that they incorporated peer tutoring, on average, one to two
times per week, and respondents from the successful schools only used this strategy, on
average, one to two times per month. According to Frey and Fisher (2007), summative
and formative measures can be used to check for understanding. In addition, checking
for understanding via questioning techniques such as think-pair-share may aid in the
processes involved for students to develop higher order thinking skills (Dillon, 1988).
Furthermore, cooperative groups and scaffolding was utilized, on average, one to two
times per week by the respondents from populations. Scaffolding and cooperative groups
both increased student achievement by allowing students to develop into independent
learners (Bruner, 1975; Johnson, Johnson, & Holubec, 1992; Kagan, 1994; Rosenshine &
Meister, 1992; Slavin, 1990).

87
Research Question 3
Research question three investigated the relationship between the utilization of
various assessments and student achievement as measured by school accountability
rankings. Pre-tests, short-answer tests, student portfolios, open-ended tests, and district
assessments were analyzed to determine if a significantly difference existed in the usage
of these assessments between successful and high performing schools. When tested with
a Multivariate Analysis of Variance (MANOVA), no statistically significant relationship
was found in the means between the assessments utilized by the respondents from the
successful schools and those from high performing schools. The respondents indicated
that the assessment they placed the most emphasis was districts assessments. This finding
was anticipated due to accountability mandates (Hess & Petrilli, 2009; Lagana-Riordan &
Aguilar, 2009). Respondents also indicated that they also placed moderate emphasis on
short-answer tests that included multiple-choice, true/false, and fill-in-the-blank. This
finding was anticipated because of the emphasis on standardized tests that are similar in
format (James, 2002). The assessments with the lowest rankings were pre-tests, open-
ended tests, and student portfolios. Again this finding was anticipated due to the time
constraints placed on teachers to cover all of the material that was tested by state
mandated measures (Hess & Brigham, 2000; Olson, 2002).
Research Question 4
Research question four examined the relationship between student learning
methods and student achievement as measured by school accountability rankings. The
student learning methods that were analyzed included hands-on activities, practice,
building vocabulary, graphic organizers, written reflections, and peer tutoring. When

88
tested with a Multivariate Analysis of Variance (MANOVA), no statistically significant
relationship was found in the means between the student learning methods utilized by the
respondents from the successful schools and those from high performing schools. The
least used learning methods indicated by the respondents were hands-on activities,
graphic organizers, and peer tutoring. Each method, on average, was utilized only one to
two times per month. The learning methods the respondents indicated that they used the
most often (one to two times per week), were practice on a specific skill, strategy, or
process and building vocabulary. Both of these methods were identified as an effective
strategy by Marzano et al. (2001). When assigned on a regular basis and accompanied by
teacher feedback, homework could improve achievement by 28% (Marzano, 1998;
Walberg, Paschal, & Weinstein, 1985). In addition, vocabulary provided background
knowledge and increased student achievement by 23 percentile points (Chall, 1987;
Marzano, 2004; Stahl, 1999).
Themes identified in the open-ended question on the survey that were identified in
the literature review included supportive and visible administration, curriculum/schedule,
praise/rewards, and high expectations. Research pertaining to high performing high
poverty schools revealed a strong correlation between high expectations, leadership, and
student achievement (Carter, 2000; Gregory, 2003; Johnson et al., 2000; Ragland et al.,
2002). Respondents from both school settings indicated that students were allowed
opportunities to succeed through creative scheduling, tutoring, and curriculum design.
Haycock (2001) indicated the importance of each of these factors on student
achievement. Respondents stated that students were required to enroll in pre-requisites
prior to being allowed to enroll in the subject area classes. In addition, respondents stated

89
effective scheduling measurements that allotted for two periods for certain tested subjects
were utilized. Respondents also indicated that the schedule was modified weeks prior to
testing to allow for review and remediation. Students were also provided with
tutoring/remediation after school and on Saturdays.
One prevalent theme indicated by the teachers for the successful schools and not
by the teachers from the high performing schools was praise/rewards. Teachers indicated
examples of rewards that were utilized for students including homework passes, tickets to
athletic events, and field trips. Prior research was consistent with the positive effects of
rewards and its relationship on student behavior (Deci et al., 2001; Harrop & Williams,
1992; Marzano et al., 2001). One theme identified consistently by the teachers at the
high performing schools was parent and community involvement. The teachers from the
high performing school stated that parents and community members were actively
involved in decision making at their schools. The respondents stated that the parents and
community members worked with them to create a positive culture where all students felt
empowered. The statements provided by the respondents on parental involvement were
consistent with prior research (Carter, 2000; Haycock, 2001; Marzano et. al., 2001).
Limitations
This study was limited to faculty members at 15 successful and seven high
performing secondary schools in the southern region of Mississippi. The findings may
not be applicable to faculty members at other secondary schools in another region of the
state or other secondary schools with the same accountability ratings. The methodology
utilized in this study may also have provided limits including the number of participants
responding to the survey, and the issue that the survey was a self- reporting instrument.

90
In addition, it was assumed that participates answered honestly to all survey questions;
however, they may have provided answers that would demonstrate their schools in the
best light.
Recommendations for Policy or Practice
The following recommendations have been developed as a result of this study:
1. For this study, findings indicated that the teachers at successful and high
performing schools utilize technology to aid in their instruction. Principals and
school districts should train teachers how to utilize technology and incorporate it
into their lessons. Teachers should have adequate access to various technology
including computers, Promethean boards, and LCD projectors. If needed,
principals should seek outside funding measures such as grants that can be used to
purchase products. Furthermore, teachers should be trained on how to use
Microsoft Office programs, Google, and other computer-based programs that will
aid their instruction. This training can be provided by mentor teachers, principals,
or district staff.
2. For this study, respondents indicated that they often utilized specific research
based instructional methods including practice on a specific skill, vocabulary, and
checking for understanding; therefore, low performing districts should incorporate
similar measures into their classrooms. Teachers should be provided with proper
training by universities or mentoring programs, so that they can incorporate the
measures into their teaching practice.
3. For this study, the respondents indicated a frequent use of district assessments.
Teachers should be provided with training on how to interpret the data resulting
91
from these assessments, so they may identify areas of strengths and weaknesses.
Principals and districts can provide opportunities for the teachers to meet at the
school and district level to discuss the results of the assessments.
Recommendations for Further Research
The following recommendations have been developed as a result of this study:
1. The research from this study pertained only to successful and high performing
secondary schools in south Mississippi. It is recommended for future researchers
to explore instructional methods and assessments in low performing school
districts in Mississippi. This research could explore instructional methods that
may or may not be being used in the low performing district.
2. Study findings identified a strong involvement of parents and community in the
high performing schools. It is recommended for future researchers to explore the
strategies that these schools utilized to encourage parental and community
support.
3. Study findings identified the implementation of tutoring and remediation at both
the successful and high performing schools. It is recommended for future
research to explore the criteria these schools used to identify students that
participated in the tutoring and remediation program and conduct a longitudinal
study to determine if those students achieved higher results than those that were
not provided tutoring and remediation.
4. Study findings identified that the successful schools utilized praise and rewards to
motivate students. It is recommended for future research to investigate the system
that the schools utilize to implement a reward system and to conduct a
92
longitudinal study to determine if the implementation of the system positively
resulted in student achievement.
5. Study findings indicated that the successful schools and high performing schools
included in this study utilized scheduling as a means of ensuring student academic
success. It is recommended for future research to investigate the effect that
scheduling has on student achievement in high poverty areas as well as low
poverty areas of Mississippi.
Summary
Mississippi schools have made progress in the educational system with the design
of an accountability system that implemented criteria for student achievement and
academic growth. This study was designed to determine the effect that specific
researched based instructional methods, assessments, and student learning methods had
on student academic achievement as measured by school accountability rankings of
successful and high performing in Mississippi. Although no statistically significant
relationship was identified in any of the variables at the successful and high performing
schools, this particular study reinforced that specific instructional strategies, including the
use of technology, practice on a specific skill such as homework, and vocabulary were
being utilized in successful and high performing schools in Mississippi as methods of
ensuring student success. Themes from the responses provided by the teachers from
successful and high performing schools revealed that these particular schools were
implementing programs such as tutoring, creative scheduling, parental involvement, and
rewards to ensure student success at their respective schools.

93
The teachers in both settings indicated that they utilized similar research based
instructional methods including homework, technology, and vocabulary. However, there
was no significant difference in the usage of those methods by the teachers in each
setting. In 2010-2011, Mississippi schools received accountability rankings based on the
number of students which scored at each level of basic, proficient, and advanced. The
more students who scored at the advanced level resulted in schools receiving higher QDI
rankings. If the instructional methods utilized in each setting did not result in the
difference in student achievement at successful and high performing schools, then a
reason for the difference in achievement rankings may be attributed to the fact that the
high performing schools may have had a larger percentage of its students scoring at the
advanced level on the specific subject area tests which was evident in the higher QDI for
the high performing school setting.
The study also revealed that the teachers in high poverty, high performing and
high poverty, successful schools in south Mississippi believed that the presence of visible
and supportive administrator was essential to their achievement. The main role of a
school leader included the creation of a school culture or environment focused on
teaching and student learning. In the role of an instructional leader, the principal has the
ability to transform the entire culture of a school by being a role model that motivated
teachers to analyze their teaching methodology and to improve their instruction
(Jacobson et al., 2005). Ultimately, the task of identifying specific measurements that
will ensure student success of a particular student body is left to the administrator. An
effective administrator should be visible in the classroom where instruction and learning
occurs. Therefore, it is imperative for an administrator to be actively involved in all

94
aspects of the instructional process which included aiding teachers with lesson design,
delivery, or data driven assessments. With the support of a helpful administrator,
teachers could provide effective measurements that ensured success for all students.
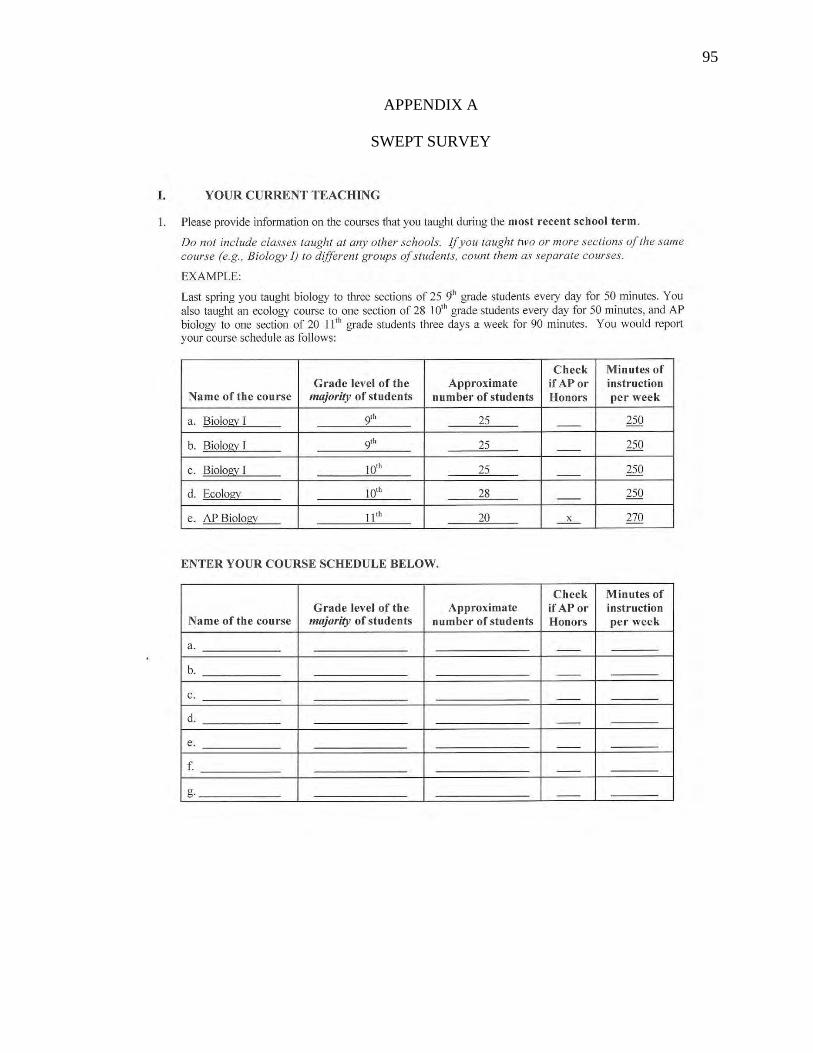
95
APPENDIX A
SWEPT SURVEY

96
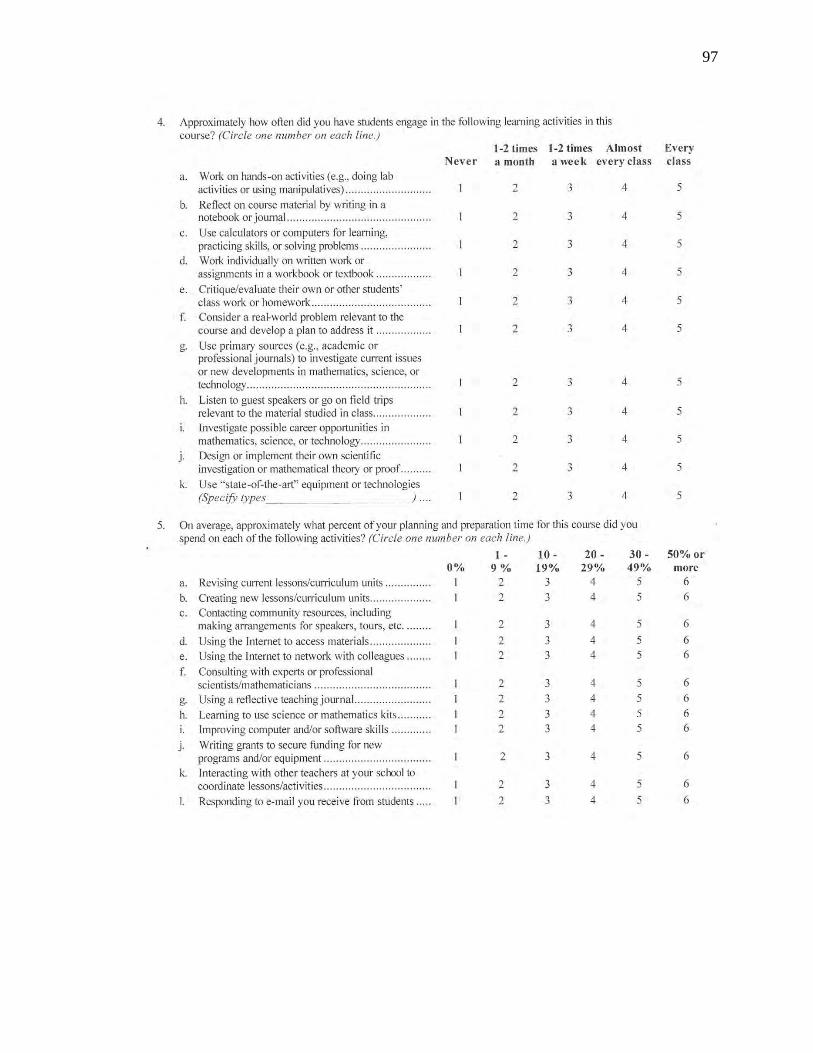
97

98

99

100
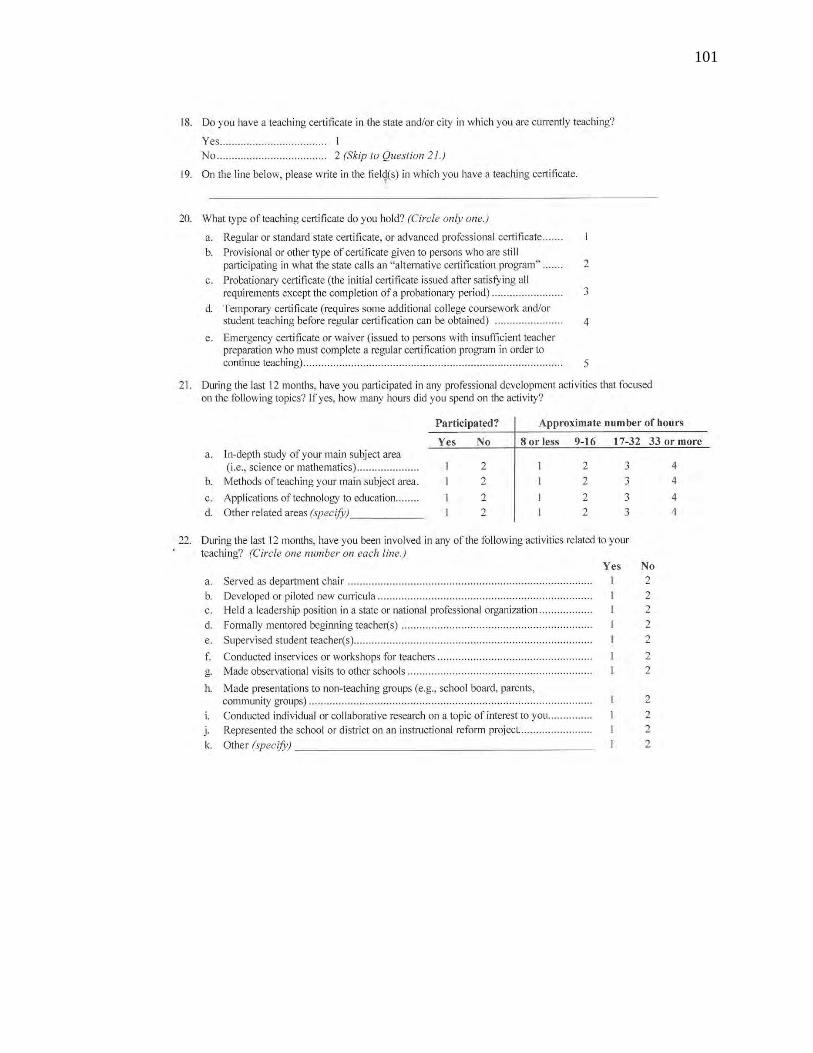
101

102
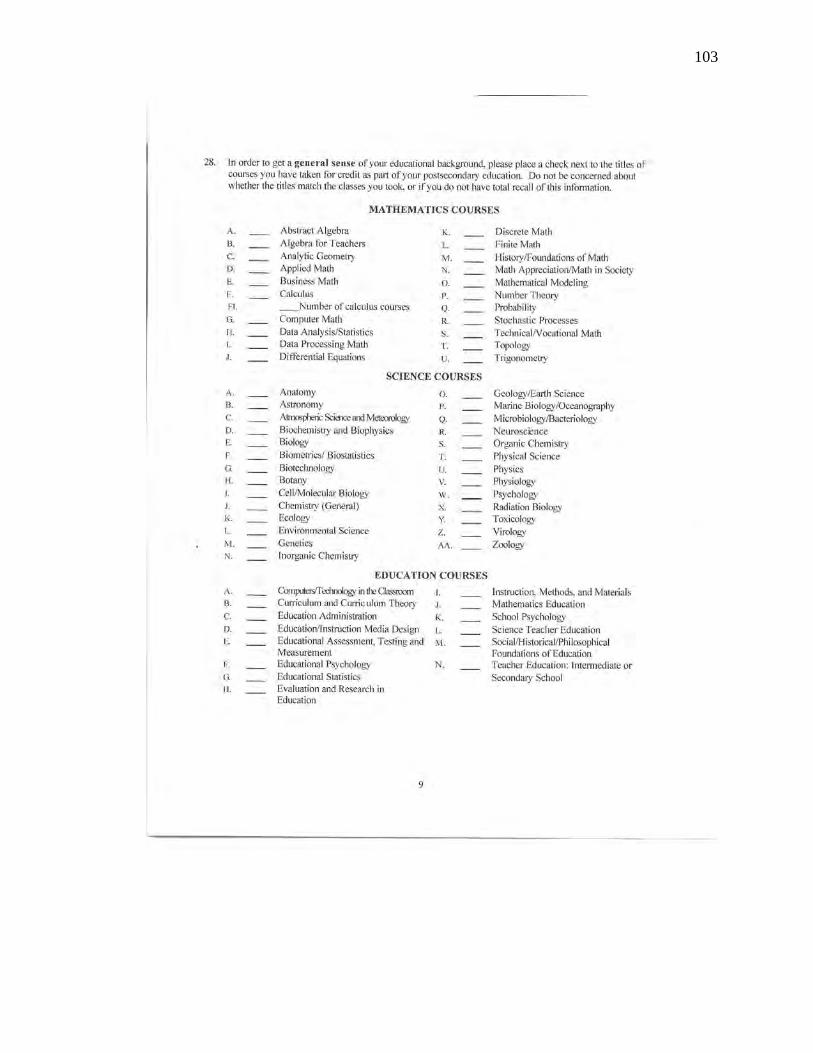
103
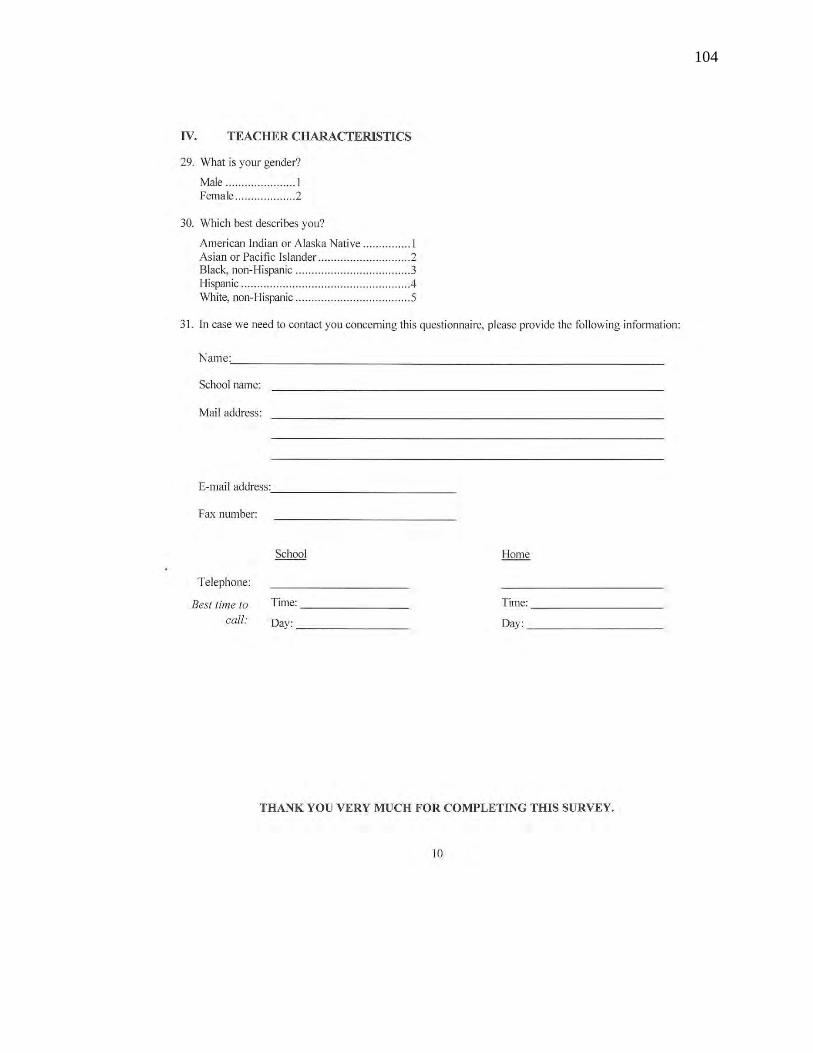
104

105
APPENDIX B
PERMISSION TO USE SWEPT SURVEY
Hi Jeanifer,
This is to confirm that you are authorized to use any of the surveys posted on the SWEPTStudy.org website. The surveys are public domain. The only request we have is that, when citing the surveys, acknowledge that the surveys were developed with National Science Foundation funds award # 9812142.
I wish you the best of luck with the completion of your doctoral degree.
Jay Dubner
Columbia University
SWEPT Study Project Coordinator

106
APPENDIX C
EFFECTIVE INSTRUCTIONAL METHODS UTILIZED IN SUCCESSFUL AND HIGH PERFORMING SECONDARY SCHOOLS IN THE SOUTHERN REGION OF
MISSISSIPPI SURVEY
Directions: This survey is designed to help gain a better understanding of the instructional techniques employed by teachers at successful high schools which are located in districts that receive Title I funds in the southern region of Mississippi. Please indicate your opinion about each of the statements below. The information you provide and your responses are strictly confidential. Please circle or write in the best response for each of the following statements. Thank you for your help in collecting this information.
1. In which of the following Mississippi Subject Areas did you teach during the 2010-2011 school year?Algebra I 1Biology I 2English II 3U.S. History 4Not Applicable 5
2. In this target course, how much emphasis did you give each of the following instructional goals or objects? (Circle only one number on each line.)
None Minor Moderate Major
a. Teaching facts, rules, or vocabulary1 2 3 4
b. Setting objectives and providing feedback 1 2 3 4
c. Preparing students for taking standardized tests 1 2 3 4
d. Fully covering the course curriculum as prescribed by the school/district/state
1 2 3 4
e. In-depth study of selected topics or issues, as opposed to exposure to a broad range of topics
1 2 3 4

107
3. Approximately how often did you use each of the following teaching methods in this course? (Circle only one number on each line.)
Never 1-2 times per month
1-2 times per week
Almost every class
Every class
a. Socratic Method/Lecture 1 2 3 4 5
b. Curriculum maps/pacing guides
1 2 3 4 5
c. Technology (PowerPoint, Promethean, etc)
1 2 3 4 5
d. Cooperative Groups 1 2 3 4 5
e. Guided Practice/Reviewing homework or other assignments
1 2 3 4 5
f. Scaffolding 1 2 3 4 5
g. Check for understanding 1 2 3 4 5
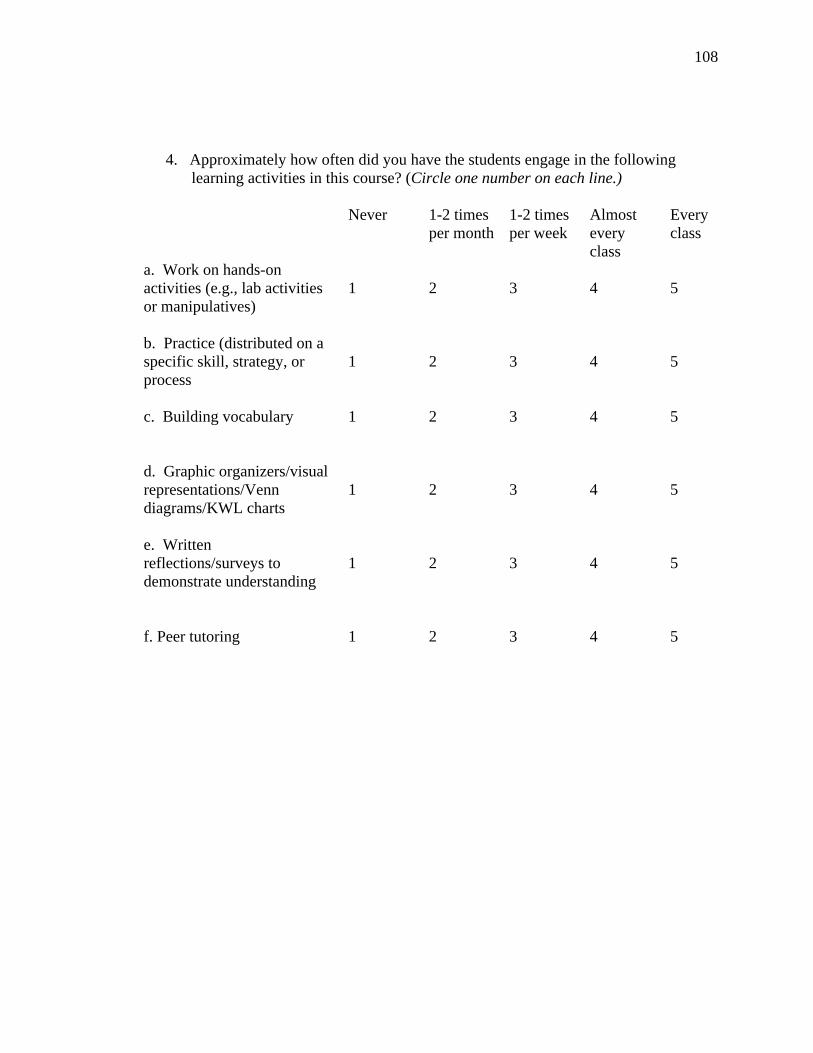
108
4. Approximately how often did you have the students engage in the following learning activities in this course? (Circle one number on each line.)
Never 1-2 times per month
1-2 times per week
Almost every class
Every class
a. Work on hands-on activities (e.g., lab activities or manipulatives)
1 2 3 4 5
b. Practice (distributed on a specific skill, strategy, or process
1 2 3 4 5
c. Building vocabulary 1 2 3 4 5
d. Graphic organizers/visual representations/Venn diagrams/KWL charts
1 2 3 4 5
e. Written reflections/surveys to demonstrate understanding
1 2 3 4 5
f. Peer tutoring
1 2 3 4 5
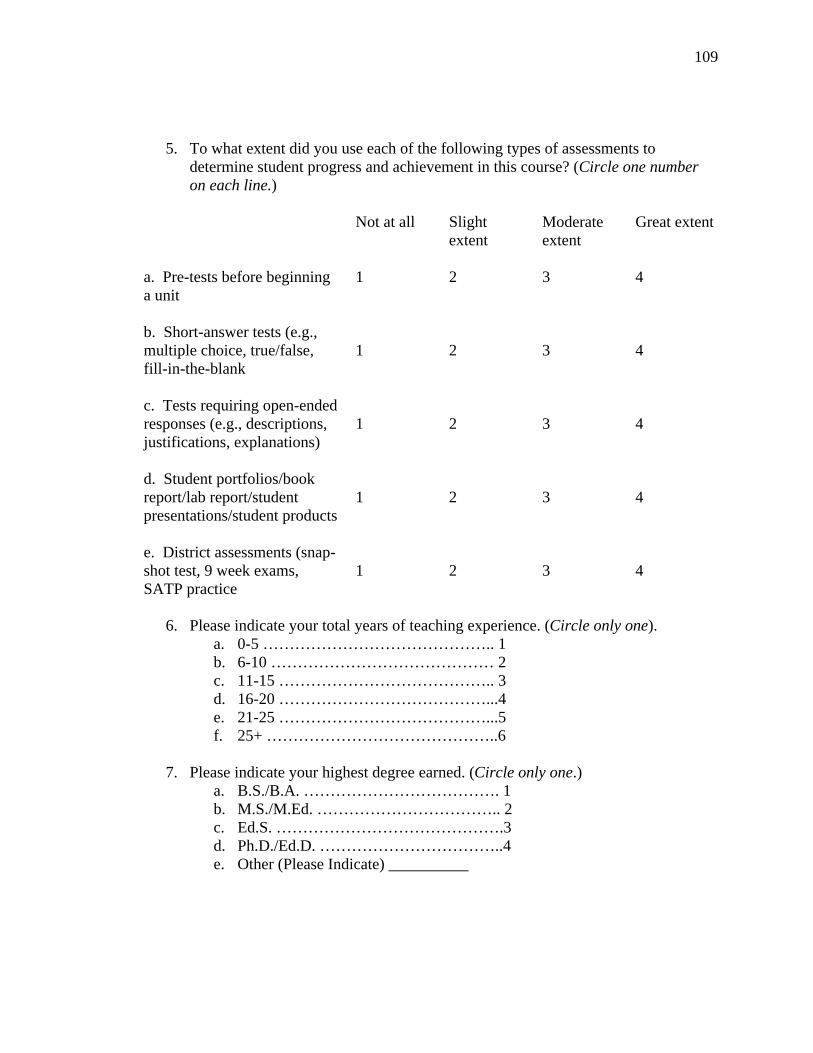
109
5. To what extent did you use each of the following types of assessments to determine student progress and achievement in this course? (Circle one number on each line.)
Not at all Slight extent
Moderate extent
Great extent
a. Pre-tests before beginning a unit
1 2 3 4
b. Short-answer tests (e.g., multiple choice, true/false, fill-in-the-blank
1 2 3 4
c. Tests requiring open-ended responses (e.g., descriptions, justifications, explanations)
1 2 3 4
d. Student portfolios/book report/lab report/student presentations/student products
1 2 3 4
e. District assessments (snap-shot test, 9 week exams, SATP practice
1 2 3 4
6. Please indicate your total years of teaching experience. (Circle only one).a. 0-5 …………………………………….. 1b. 6-10 …………………………………… 2c. 11-15 ………………………………….. 3d. 16-20 …………………………………...4e. 21-25 …………………………………...5f. 25+ ……………………………………..6
7. Please indicate your highest degree earned. (Circle only one.)a. B.S./B.A. ………………………………. 1b. M.S./M.Ed. …………………………….. 2c. Ed.S. …………………………………….3d. Ph.D./Ed.D. ……………………………..4e. Other (Please Indicate) __________

110
8. What type of teaching certification do you hold? (Circle only one.)a. Regular or standard state certificate or advanced professional certificate...1b. Provisional or other type of certificate given to persons who are still
Participating in what the state calls an “alternate certification program. ... 2c. Emergency certificate or waiver (issued to persons with insufficient
teacher preparation who must complete a regular certification program in order to continue teaching. ……………………………………………….3
9. On average, what percent of your students receive free or reduced lunch? (Circle only one answer.)
a. 0-25% ……………………………………. 1b. 26-50% ……………………………………2c. 51-75% ……………………………………3d. 76-100% …………………………………..4
10. As you are aware, you have been asked to participate in this survey because the school you currently teach at has met certain criteria and deemed as being one of the successful or high performing high schools in the southern region of Mississippi. In your professional opinion, what do you believe are the reasons that your school has been able to accomplish this goal while other schools and districts in the state, which have similar student demographics, do not achieve success? Please be as specific as possible and provide examples. (You may use the back of the paper if more space is needed.)
Thank you for completing this survey.
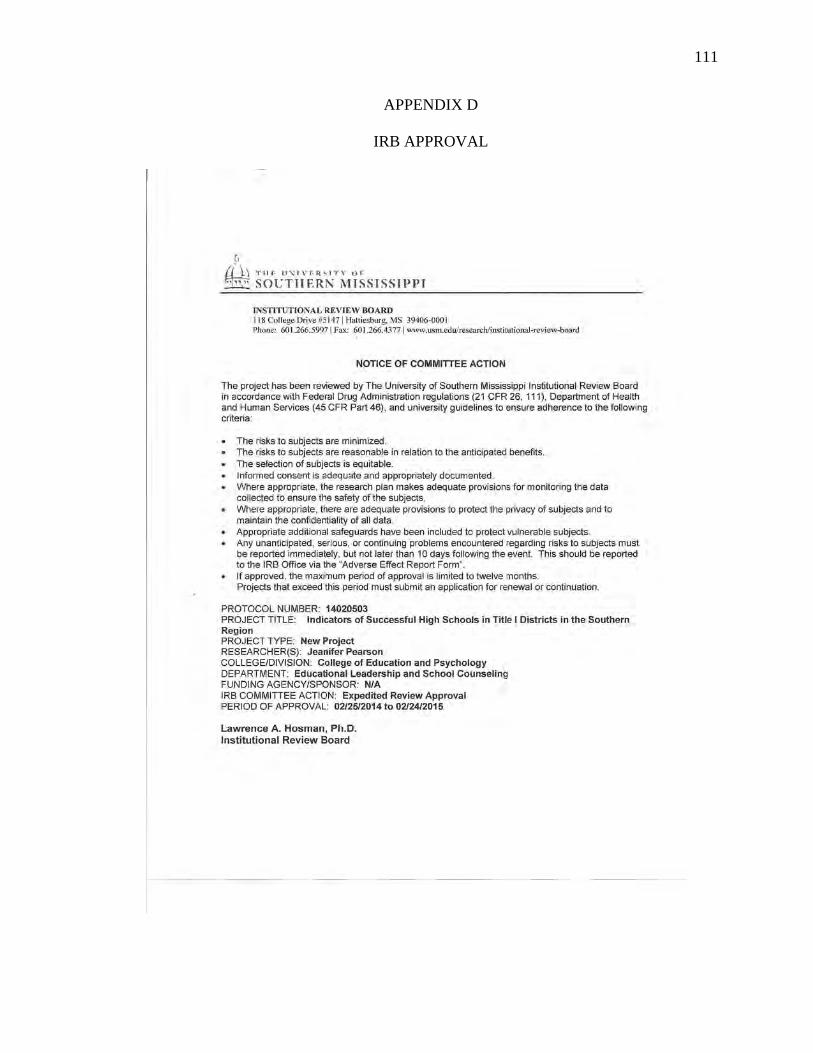
111
APPENDIX D
IRB APPROVAL

112

113
APPENDIX E
DISTRICT APPROVAL FOR STUDY (EXAMPLE)
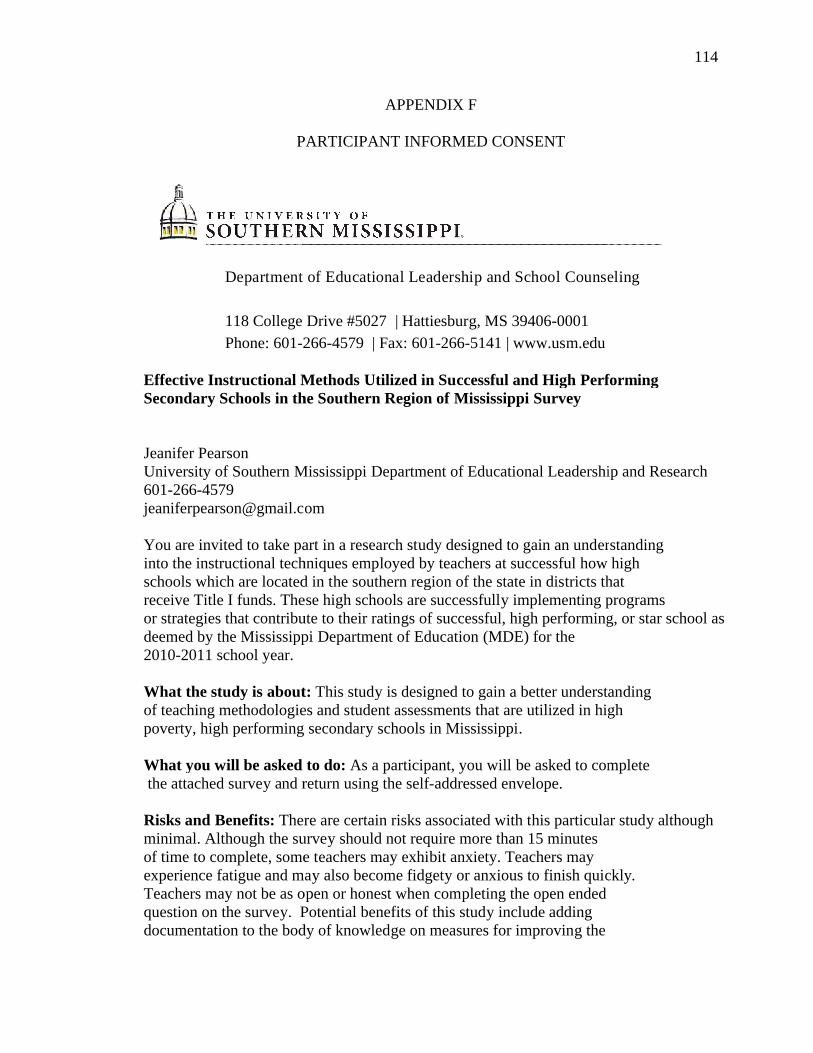
PARTICIPANT INFORMED CONSENT
Department of Educational Leadership and School Counseling
118 College Drive #5027Phone: 601-266
Effective Instructional Methods Utilized in Successful and High Performing Secondary Schools in the Southern Region of Mississippi
Jeanifer PearsonUniversity of Southern Mississippi Department of Educational Leadership and Research 601-266-4579 [email protected]
You are invited to take part in a research study designed to gain an underinto the instructional techniques employed by teachers at successful schools which are located in the southern region of the state in districts that receive Title I funds. These high schools are successfully implementing programs or strategies that contribute to their ratings of successful, high performing, or star school as deemed by the Mississippi Department of Education (MDE) for the 2010-2011 school year.
What the study is about:of teaching methodologies and student assessments that are utilized in high poverty, high performing secondary schools in Mississippi.
What you will be asked to do:the attached survey and return using the self
Risks and Benefits: There are certain risks associated with this particular study although minimal. Although the survey should not require more than 15 minutesof time to complete, some texperience fatigue and may also become fidgety or anxious to finish quickly. Teachers may not be as open or honest when completing the open ended question on the survey. Potential benefits of this study includedocumentation to the body of knowledge on measures for improving the
APPENDIX F
PARTICIPANT INFORMED CONSENT
Department of Educational Leadership and School Counseling
118 College Drive #5027 | Hattiesburg, MS 39406-0001 266-4579 | Fax: 601-266-5141 | www.usm.edu
Effective Instructional Methods Utilized in Successful and High Performing Secondary Schools in the Southern Region of Mississippi Survey
University of Southern Mississippi Department of Educational Leadership and Research
You are invited to take part in a research study designed to gain an underinto the instructional techniques employed by teachers at successful how high schools which are located in the southern region of the state in districts that receive Title I funds. These high schools are successfully implementing programs
rategies that contribute to their ratings of successful, high performing, or star school as deemed by the Mississippi Department of Education (MDE) for the
What the study is about: This study is designed to gain a better understanof teaching methodologies and student assessments that are utilized in high poverty, high performing secondary schools in Mississippi.
What you will be asked to do: As a participant, you will be asked to completethe attached survey and return using the self-addressed envelope.
There are certain risks associated with this particular study although minimal. Although the survey should not require more than 15 minutesof time to complete, some teachers may exhibit anxiety. Teachers may experience fatigue and may also become fidgety or anxious to finish quickly. Teachers may not be as open or honest when completing the open ended question on the survey. Potential benefits of this study include adding documentation to the body of knowledge on measures for improving the
114
Department of Educational Leadership and School Counseling
Effective Instructional Methods Utilized in Successful and High Performing
University of Southern Mississippi Department of Educational Leadership and Research
You are invited to take part in a research study designed to gain an understandinghow high
schools which are located in the southern region of the state in districts that receive Title I funds. These high schools are successfully implementing programs
rategies that contribute to their ratings of successful, high performing, or star school as
This study is designed to gain a better understanding of teaching methodologies and student assessments that are utilized in high
As a participant, you will be asked to complete
There are certain risks associated with this particular study although
experience fatigue and may also become fidgety or anxious to finish quickly. Teachers may not be as open or honest when completing the open ended

115
achievement gap. Results from this research may be used to demonstratehow educators in Mississippi are overcoming the odds and not allowing thestigma of being low income to inhibit learning
Taking part is voluntary: Taking part in this study is completely voluntaryand will not affect your job status. If you choose to be in the study you canwithdraw at any time without consequences of any kind. Participation in theproject is completely voluntary, and participants may withdraw at any timewithout penalty, prejudice, or loss of benefits. All personal information is strictlyconfidential, and no names will be disclosed. Any new information that developsduring the project will be provided if that information may affect the willingnessto continue participation in the project.
Your answers will be confidential: The records of this study will be kept private. The data will be stored in digital form on a USB memory key, which will be kept in a secure location at all times. All returned surveys will be stored in a locked file cabinet at the researcher’s home until time of disposition. Upon the completion of study, all documents, test data, files will be shredded. Any report of this research that is made available to the public will not include your name or any other individual information by which you could be identified.
If you have questions or want a copy or summary of the study results: Questionsconcerning the research, at any time during or after the project, should be directed toresearcher(s) name(s) at telephone number(s). This project and this consent form havebeen reviewed by the Institutional Review Board, which ensures that research projectsinvolving human subjects follow federal regulations. Any questions or concerns aboutrights as a research participant should be directed to the Chair of the Institutional ReviewBoard, The University of Southern Mississippi, 118 College Drive #5147, Hattiesburg,MS 39406-0001, (601) 266-5997.
Statement of Consent: I have read and understand the information above. Byreturning the survey to the researcher, I am consenting that my answers within the survey be utilized for the research aforementioned.
116
REFERENCES
Achievement Gap. (2013, December 19). In S. Abbott (Ed.), The glossary of education
Reform. Retrieved from http://edglossary.org/achievement/achievement-gap.
Allen, J. (1994). A primer on school accountability. Washington, DC: Center for
Educational Reform. Retrieved from http://edreform.com/pubs/account1.html.
Ali, R., & Jerald, C. (2001). Dispelling the myth in California: Preliminary findings
from a state and nationwide analysis of "high-flying" schools. Oakland, CA:
The Education Trust -West.
Amrein, A., & Berliner, D. (2002). High-stakes testing, uncertainty, and student
learning. Education Policy Analysis Archives, 10(8). Retrieved from
http://epaa.asu.edu/epaa/v10n18/.
Atweh, B., Bleicher, R., & Cooper, T. (1998). The construction of the social context of
mathematics classrooms: A sociolinguistic analysis. Journal for Research in
Mathematics Education, 29(1), 63-82.
Bishop, J. (1995). The impact of curriculum-based external examinations on
school priorities and student learning. International Journal of Educational
Research, 23(8), 653-752.
Blaikie, N. (2003). Analyzing quantitative data. London: Sage Publications.
Boch, F., & Piolat, A. (2005). Note taking and learning: A summary of research. The
WAC Journal, 16, 101-113.
BouJaoude, S., & Tamin, R. (1998). Analogies, summaries, and question answering in
middle school life science: Effect on achievement and perceptions of instructional
value. Paper presented at the annual meeting of the National Association
117
for Research in Science Teaching, April 19-22, San Diego, CA.
Braden, J., & Schroeder, J. (2004). High-stakes testing and No Child Left Behind:
Information and strategies for educators. Helping children at home and school II:
Handouts for families and educators. Retrieved from
www.nasponline.org/communications/spawareness/highstakes.pdf.
Bransford, J., Brown, A., Cocking, R., Donovan, M., & Pellegrino, J. (2000). How
people learn: Brain, mind, experience, and school. Washington, DC: National
Academy Press.
Brooks-Gunn, J., Duncan, G., & Maritato, N. (1997). Poor families, poor outcomes: The
well-being of children and youth. In G. J. Duncan & J. Brooks-Gunn
(Eds.), Consequences of Growing Up Poor (pp. 1-13). New York: Russell
Sage Foundation.
Brooks, J., & Brooks, M. (1993). In search of understanding: The case for constructivist
classroom. Alexandria, VA: Association for Supervision and Curriculum
Development.
Bruner, J. (1973). Going Beyond the Information Given. New York: Norton.
Bruner, J. (1975). From communication to language: A psychological perspective.
Cognition, 3, 255-287.
Bruner, J., Goodnow, J., & Austin, A. (1956). A Study of Thinking. New York: Wiley.
Cain, R., & Caine, G. (1991). Making connections: Teaching and the human brain.
Alexandria, VA: Association for Supervision and Curriculum Development.
Capraro, M., Capraro, R., & Wiggins, B. (2000). An investigation of the
effects of gender, socioeconomic status, race, and grades, on standardized test

118
scores. Paper presented at the annual meeting of the Southwest Educational
Research Association. Dallas, TX. (ERIC Document Reproduction Service No.
ED444867).
Carson, C., Huelskamp, R., & Woodall, T. (1993). Perspectives on education in
America. The Journal of Educational Research, 86, 259-310.
Carter, S. (2000). No excuses: Lessons from 21 high-performing, high-poverty schools.
Washington, DC: Heritage Foundation.
Chall, J. (1987). Two vocabularies for reading: Recognition and meaning. In M. G.
McKeown & M. E. Curtis (Eds), The nature of vocabulary requisition. (pp. 7-17).
Hillsdale, NJ: Erlbaum.
Chall, J., Jacobs, V., & Baldwin, L. (1990). The reading crisis. Cambridge, MA:
Harvard University Press.
Chen, Z. (1999). Schema induction in children’s analogical problem solving. Journal of
Educational Psychology, 91(4), 703-715.
Clark, D., & Clark, S. (2000). Appropriate assessment strategies for young adolescents
in an era of standards-based reform. The Clearing House, 73(4), 201-204.
Coleman, J., Campbell, E., Hobson, C., McPartland, J., Mood, A., Weinfeld, F., & York,
R. (1966). Equality of educational opportunity. Washington, DC: U. S.
Government Printing Office.
Cornia, G., Court, J., & World Institute for Development Economics Research. (2001).
Inequality, growth and poverty in the era of liberalization and globalization.
Helsinki: United Nations University, World Institute for Development Economics
Research.

119
Creswell, J. (1994). Research design: Qualitative and quantitative approaches.
Thousand Oaks, CA: SAGE Publications.
Darling-Hammond, L. (1999). Teacher quality and student achievement: A review of
state policy evidence. Seattle: Center for the Study of Teaching and Policy.
Deci, E., Koestner, R., & Ryan, R. (2001). Extrinsic rewards and intrinsic motivation in
Education: Reconsidered once again. Review of Educational Research, 71, 1-27.
Dewey, J. (1963). Experience and education. New York: Collier-Macmillan
Dickson, S., Chard, D., & Simmons, D. (1993). An integrated reading/writing
curriculum: A focus on scaffolding. LD Forum, 18(4), 12-16.
Dillon, J. (1988). Questioning and teaching: A manual of practice. New York:
Teachers College Press.
Dillion, S. (2010a, March 13). Obama calls for major change in education law. The
New York Times. Retrieved from http://www.nytimes.com.
Dillion, S. (2010b, December 10). What works in the classroom? Ask the students. The
New York Times. Retrieved from http://www.nytimes.com.
Dillion, S. (2011, September 23). Obama turns some powers of education back to states.
The New York Times. Retrieved from http://www.nytimes.com.
Dropout rates fueling debate over testing. (2003). Board & Administrator;
for Superintendents Only, 16(9), 9.
Editorial Projects in Education Research Center. (2004). Issues A-Z: Title I.
Education Week. Retrieved from http://www.edweek.org/ew/issues/title-.
EdSource. (2000). National accountability movement offers lessons for California. Palo
Alto, CA: Author.

120
EdSource. (2003). Executive summary: Narrowing the achievement gap. Palo Alto, CA:
Author. Retrieved from http://www.edsource.org/pdf/EdFact_Final.pdf.
EdSource. (2006). Similar students, different results. Superintendent’s interviews. Palo
Alto, CA: Author. Retrieved from
http://www.edsource.org/assets/files/SimStu05.pdf.
Einbinder, S. (1993). Five million children. New York: National.
Farr, S., & Teach for America. (2010). Teaching as leadership: The highly effective
teacher’s guide to closing the achievement gap. San Francisco, CA: Josey-Bass.
Figlio, D. (2003). Fiscal Implications of school accountability initiatives. In Tax Policy
and the Economy, Volume 17, 1-36. National Bureau of Economic Research, Inc.
Firestone, W. Fuhrman, S. & Kirst, M. (1990). Implementation, effects of state education
reform in the ‘80s. National Association of Secondary School Principals, 75-84.
Fisher, D., & Frey, N. (2007). Checking for Understanding: Formative Assessment
Techniques for Your Classroom. Alexandria, VA: Association for Supervision
and Curriculum Development.
Ford, D., Grantham, T., & Whiting, G. (2008). Another look at the achievement gap:
Learning from the experiences of gifted black students. Retrieved from
http://www.sagepub.com/cac6study/articles/Ford.pdf.
Fosnot, C. (1996). Constructivism: A psychological theory of learning. In C. T. Fosnot
(Ed.), Constructivism: Theory, perspectives, and practice (pp. 8-33). New York:
Teachers College Press.
Gagne, R. (1974). Essentials of learning instruction (2nd Edition). Hinsdale, IL: The
Dryden Press.
121
Goldhaber, D., & Anthony, E. (2004). Indicators of teacher quality. ERIC Clearinghouse
on Urban Education. Retrieved from www.ericdigests.org/2004-1/quality.htm.
Goldhaber, D., & Brewer, D. (2006). Does teacher certification matter? High
school teacher certification status and student achievement. Educational
Evaluation and Policy Analysis, (22), 129-145. Retrieved from
epa.sagepub.com/cgi/reprint/22/2/129?ijkey=nw6OUpX7WoqdI&keytype=ref&
siteid=spepa.
Gorman, L. (2005). Good teachers raise student achievement. National Bureau of
Economic Research Digest Online. Retrieved from
http://www.nber.org/digest/aug05/w11154.html.
Grant, M. (1985). A kinesthetic approach to teaching: Building a foundation for learning.
Journal of Learning Disabilities, 18(8), 455-462.
Gregory, S. (2003). Leadership styles and characteristics of effective principals in high
poverty public schools. Chicago, IL: American Educational Research
Association. ERIC Document Reproduction Service No. ED478741).
Grennon-Brooks, J., & Brooks, M. (1993). In search of understanding: The case for
constructivist classrooms. Alexandria, VA: Association for Supervision and
Curriculum Development.
Grissmer, D., Flanagan, A., Kawata, J., & Williamson, S. (2000). Improving student
achievement: What state NAEP scores tell us. MR-924-EDU, RAND.
Grossen, B., & Carnine, D. (1996). Considerate instruction helps students with
disabilities achieve world class standards. Teaching Exceptional Children, 28(4),
77-81.
122
Haberman, M. (1991). The pedagogy of poverty versus good teaching. Phi Delta
Kappan, 290-294.
Hamilton, L. (2004). Assessment as a policy tool. Santa Monica, CA: RAND
Corporation.
Haney, W. (2000). The myth of the Texas miracle in education. Education Policy
Analysis Archives, 8(41). Retrieved from http://epaa.asu.edu/epaa/v8n41.
Harris, D. (2006). Lost learning, forgotten promises. A national analysis of school
racial segregation, student achievement, and “controlled choice” plans. Retrieved
from http://www.americanprogress.org/issues/2006/11/pdf/lostlearning.pdf.
Harris, D., & Herington, C. (2006). Accountability, standards, and the growing
achievement gap: Lessons from the past half-century. American Journal of
Education, 112(2), 209-238.
Harrop, A., & Williams, T. (1992). Rewards and punishments in the primary school.
Pupils’ perceptions and teachers’ usage. Educational Psychology in Practice, 7,
211-215.
Hartman, H. (2002). Scaffolding and cooperative learning. Human Learning and
Instruction (pp. 23-69). New York: City College of City University of New York.
Haycock, K. (1998). Good teaching matters: How well qualified teachers can close
the gap. Washington, DC: Education Trust. Retrieved from
http://www.edtrust.org.
Haycock, K. (2001). Closing the achievement gap. Educational Leadership, 58(6), 6-11.
Haystead, M., & Marzano, R. (2009). Meta-analytic synthesis of studies conducted at
Marzano Research Laboratory on instructional strategies. Englewood, CO:

123
Marzano Research Laboratory.
Hein, G. (1991). Constructivist learning theory. Retrieved from
http://www.exploratorium.edu/ifi/resources/constructivistlearning.html.
Heitin, L. (2011). NEA stakes a claim in teacher effectiveness debate. Education Week
Online. Retrieved from http://blogs.edweek.org/teachers/teaching_now
/2011/12/nea_stakes_a_ claim _in_teacher_effectiveness_debate.html.
Hess, F., & Brigham, F. (2000). How kids pay for high-stakes testing. The Education
Digest, 66(3), 11-17.
Hess, F., & Petrilli, M. (2009). Wrong turn on school reform. Policy Review, 153,
55-68.
Howard, T. (2001). Powerful pedagogy for African American students: Concepts of
culturally relevant pedagogy. Journal of Urban Education, 36(2), 179-202.
Huberman, A., & Miles, M. (1998). ‘Data management and analysis methods’, in
N.K. Denzin and Y.S. Lincoln (Eds.), Collecting and interpreting qualitative
Materials. Thousand Oaks, CA: Sage, 179–210.
Hunter, M. (1984). Mastery Teaching. El Segundo, CA: TIP Publications.
Hutton, S. (2013). Helping kinesthetic learners succeed. Retrieved from
http://www.education.com/magazine/article/kinesthetic_learner/.
Ingersoll, R. (2001). Teacher turnover and teacher shortages: An organizational analysis.
American Educational Research Journal, 38(3), 499–534.
Institute for Research on Poverty. (2012). Who is poor? Retrieved from
http//www.irp.wisc.edu/faqs/faq3.
Jacob, B., & Ludwig, J. (2008). Improving educational outcomes for poor children, in M.

124
Cancian and S. Danziger (Eds.), Changing Poverty, Changing Rules. New York:
Russell Sage Foundation Press, 266-300.
Jacobson, J., Johnson, L., Ylimaki, R., & Giles, C. (2005). Successful leadership in U. S.
schools: Enabling principals, enabling schools. Journal of Educational
Administration, 43(6), 607-618.
Jacobson, J., Olsen, C., King-Rice, J., Sweetland, S., & Ralph, J. (2001). Educational
achievement and Black-White inequity. Statistical analysis report. Retrieved
from http://www.nces.ed.gov/pubs2001/2001061.pdf.
James, D. (2002). Will testing solve our schools’ problems? Journal of College
Admission, 176, 12.
Jencks, C., & Phillips, M. (1998). The black-white test score gap. Washington, D. C.:
The Brookings Institution.
Jencks, C., Smith, M., Acland, H., Bane, M., Cohen, D., Gintis, H., Heyns, B., &
Michelson, S. (1972). Inequality. New York: Basic Books.
Johnson, D., & Johnson, R. (1989). Cooperation and competition. Theory and research.
Edina, MN: Interaction Book Company.
Johnson, D,. Johnson, R., & Holubec, E. (1992). Advanced Cooperative Learning.
Edina, MN: Interaction Book Company.
Johnson, J., Livingston, M., & Schwartz, R. (2000). What makes a good elementary
school? A critical examination. Journal of Educational Research, 93, 339-348.
Kagen, S. (1994). Cooperative learning. San Juan Capistrano, CA: Kagan Cooperative
Learning.
Kannapel, P., & Clements, S. (2005). Inside the black box of high-performing

125
High poverty schools. Lexington, KY: Pilchard Committee for Academic
Excellence.
Kaufhold, J. (1998). What’s wrong with teaching for the test? School Administrator, 55
(11), 14.
Kendall, J., & Marzano, R. (1997). The rise and fall of standards-based education.
Aurora, CO: Mid-Continent Regional Education Laboratory. Retrieved from
http://www.mcrel.org/products/standards/fallrise.asp.
Knapp, M., & Wolverton, S. (2005). Social class and schooling. In J.A. Banks & C.A.M.
Banks (Eds.), Handbook of research on multicultural education (pp. 656-681).
San Francisco: Jossey Bass.
Kothari, C. (2004). Research methodology: Methods and Techniques (2nd edition).
Daryaganj, New Delhi: New Age Publishers.
Kozol, J. (1991). Savage inequalities. New York: Harper Perennial.
Kumar, D. (1991). A meta-analysis of the relationship between science instruction and
student engagement. Education Review, 43(1), 49-66.
Ladson-Billings, G. (1997). It just doesn’t add up: African American students’
mathematics achievement. Journal for Research in Mathematics Education,
28(6), 34-50.
Lagana-Riordan, C., & Aguilar, J. (2009). What’s missing from no child left behind? A
policy analysis from a social work perspective. Children & Schools, 31(3), 135-
144.
Leithwood, K., & Riehl, C. (2005). What we know about successful schools leadership.
In W. Firestone and Reihl, C. (Eds.), A new agenda: Directions for research on
126
educational leadership. (pp. 22-47). New York: Teachers College Press.
Lobitz, W. (1974). A simple stimulus cue for controlling disruptive classroom behavior.
Journal of Abnormal Child Psychology, 2, 143-152.
Lopez, O. (1995). The effect of the relationship between classroom student diversity
and teacher capacity on student performance: Conclusions and recommendations
for educational policy and practice. Austin, TX: The Strategic Management of
the Classroom Learning Enterprise Research Series.
Lott, G. (1983). The effect of inquiring teaching and advanced organizers upon student
outcomes in science education. Journal of Research in Science Teaching, 20(5),
437-451.
Luiten, J., Ames, W., & Ackerson, G. (1980). A meta-analysis of the effects of advance
organizers on learning and retention. American Educational Research Journal,
17(2), 211-218.
Mager, R. (1975). Preparing Instructional Objectives: Second Edition. Belmont, CA:
Fearon-Pitman Publishers, Inc.
Manzo, K. (2003). Urban students lag in reading and writing. NAEP scores show.
Education Week, 14(112). Retrieved from http://www.edweek.com.
Marsh, J. (2002). How districts relate to states, schools, and communities: A review of
emerging literature. In A. Hightower, M. S. Knapp, J. Marsh, & M .McLaughlin
(Eds.), School districts and instructional renewal (pp. 25-40). New York:
Teachers College Press.
Marzano, R. (2003). What works in schools: Translating research into action.
Alexandria, VA: Association for Supervision and Curriculum Development.
127
Marzano, R. (2004). Building background knowledge for academic achievement:
Research on what works in schools. Alexandria, VA: Association for Supervision
and Curriculum Development.
Marzano, R., & Haystead, M. (2008). Making standards useful in the classroom.
Alexandria, VA: Association for Supervision and Curriculum Development.
Marzano, R., Pickering, D., & Pollock, J. (2001). Classroom instruction that
works: Research-based strategies for increasing student achievement. Alexandria,
VA: Association for Supervision and Curriculum Development.
Marzano, R., & Pickering, D. (2007). The case for and against homework. Responding to
Changing Demographics, 64(6), 74-79.
Mayer, S. E. (1997). What money can’t buy. Cambridge, MA: Harvard University
Press.
McLoyd, V. (1998). Socioeconomic disadvantage and child development. American
Psychologist, 53, 185-204.
Miranda, L. (1991). Latino child poverty in the United States. Washington, DC:
Children’s Defense Fund.
Mississippi Department of Education. (2004). School improvement and closing the
achievement gap report. Retrieved from
http://www.mde.k12.ms.us/ACAD/sag/school_improvement%20report.doc.
Mississippi Department of Education. (2008). Mississippi Subject Area Testing Program,
2nd Edition. Technical Manual. Retrieved from www.mde.k12.ms.us.
Mississippi Department of Education. (2010a). Office of Research and Statistics.
Understanding the Mississippi Statewide Accountability System. Retrieved from
128
http://orshome.mde.12.ms.us/ors/accountability/2009/MSAS-U.pdf.
Mississippi Department of Education. (2010b). Office of Student Assessment. Retrieved
from http://www.mde.k12.ms.us/ACAD/osa/index.html.
Mississippi Department of Education. (2010c). Public Reports. Children’s First Report.
Retrieved from http://reports.mde.k12.ms.us/data/.
Mississippi Department of Education. (2012). Office of Research and Statistics.
Retrieved from http://orshome.mde.k12.ms.us/ors/accountability/index.html.
Mississippi Department of Education. (2014). Office of Federal Programs. Retrieved
from http://www.mde.k12.ms.us/federal-programs/federal-programs---title-i-
basic.
National Assessment of Educational Progress. (2005). Nation’s report card.
Washington, DC: National Center for Education Statistics. Retrieved from
http://nces.ed.gov/nationsreportcard/nrc/reading_math_2005/30002.asp.
National Center for Education Statistics. (2010). Mississippi fact sheet. Retrieved from
http://rel-se.fcrr.org/_/documents/Mississippi_fact_sheet_07031.pdf.
National Center for Law and Economic Justice. (2012). Poverty in the United States: A
snapshot. Retrieved from http://www.nclej.org/poverty-in-the-us.php.
National Center for Research on Evaluation, Standards, and Student Testing. (1994).
Evaluation Comment. Retrieved from
www2.ed.gov/pubs/IASA/newsletters/assess/pt1.html.
National Commission on Excellence in Education. (1983). A nation at Risk: The
imperative for educational reform. Washington, DC: U.S. Government
Printing Office.

129
National Education Goals Panel. (1991). The national education goals panel: Building
a nation of learners. Washington, DC: Author.
National Education Goals Panel. (1995). The national education goals panel: Executive
report. Washington, DC: Author.
National Task Force on Traditionally Underserved High Achievement. (1999). Reaching
the top. The College Board. Retrieved from
professionals.collegeboard.com/profdownload/.../reachingthe_3952.
Newby, T., Stepich, D., Lehman, J., & Russell. J. (2006). Instructional technology for
teaching and learning: Designing instruction, integrating computers, and using
media (third edition). Englewood Cliffs, NJ: Prentice-Hall.
Newman, F., & Wehlage, G. (1995). Successful school restructuring. University of
Wisconsin-Madison: Center on Organization and Restructuring Schools.
Newstead, B., Saxton, A., & Colby, S. (2008). Going for the gold: Secrets of successful
schools. Education Next. Retrieved from www.educationnext.org.
Offenberg, R. (2004). Inferring adequate yearly progress of schools from student
achievement in highly mobile communities. Journal of Education for Students
Placed at Risk, 9(4), 337-355.
Olson, L. (2002). Survey shows state testing alters instructional practices. Education
Week, 2(32), 14-15.
Olson, L. (2003). Chicago panel to devise curriculum-based tests to guide teaching.
Education Week, 22(16), 7.
Olson, L., & Jerald, C. (1998). Concentrated poverty. Education Week, 17(17), 14-16.
Olson, J., & Platt, J. (2000). The instructional cycle. Teaching Children and Adolescents

130
with Special Needs (pp. 170-197). Upper Saddle River, NJ: Prentice-Hall, Inc.
Orfield, G. (2001). Schools more separate: Consequences of a decade of resegregation.
Cambridge, MA: The Harvard Civil Rights Project.
Orfield, G., & Lee, C. (2005). Why segregation matters: Poverty and educational
inequality. Cambridge, MA: The Harvard Civil Rights Project.
Pagani, L. Boulerice, B., & Tremblay, R. E. (1997). The influence of poverty on
children’s classroom placement and behavior problems. In G. J. Duncan & J.
Brooks-Gunn (Eds.), Consequences of growing up poor (pp. 334- 337). New
York: Russell Sage Foundation.
Payne, R. (2001). A framework for understanding poverty. Highlands, TX: Aha!
Process.
Peterson, K. (2003). Building collaborative cultures: Seeking ways to reshape urban
schools. Oak Brook, IL: North Central Regional Educational Laboratory.
Retrieved from
http://www.ncrel.org/sdrs/areas/issues/educators/leadership/pet.htm.
Petrides, L. & Guiney, S. (2002). Knowledge management for school leaders: An
ecological framework for thinking schools. Teachers College Record, 104(8),
1702-1717.
Piaget, J. (1977). The equilibration of cognitive structures. Chicago: University of
Chicago Press.
Pirie, B. (1995). Meaning through motion: Kinesthetic English. English Journal, 84(8),
46-51.
Ragland, M., Clubine, B., Constable, D., & Smith, P. (2002). Expecting success: A study

131
of five high performing, high poverty schools. Washington, DC.: Council of
Chief State School Officers.
Ravitch, D. (1974). The great school wars --- New York City, 1805-1973: A history of
the public schools as a battlefield of social change. New York: Basic Books.
Reardon, S. (2011). The widening achievement gap between the rich and the poor: New
evidence and possible explanations. In G. J. Duncan and R.J. Murnane (Eds.),
Whither Opportunity?: Rising Inequality, Schools and Children’s Life Chances.”
91-116. New York: Russell Sage.
Reeves, D. (2000). Holistic accountability: Serving students, schools, and community.
Thousand Oaks, CA: Corwin Press.
Reeves, D. (2003). High performance in high poverty schools: 90/90/90 and beyond.
Denver, CO: Center for Performance Assessment.
Resnick, L. (1987). Education and learning to think. Washington, DC: National
Academy Press.
Rice, J. (2003). Teacher quality: Understanding the effectiveness of teacher
attributes. Economic Policy Institute. Retrieved from
http://www.epinet.org/content.cfm?id=1500.
Riddle, W. (1996). Title I, education for the disadvantaged: Perspectives on studies of its
achievement effects. Washington, DC: Congressional Research Service.
Riley, R. (1995). Reflections on Goals 2000. Teachers College Record. 96(3), 380-388.
Retrieved from ERIC database. (ID Number: 36).
Rocha, E., & Sharkey, A. (2005). Education: The state we’re in. An education report
card for the state of Mississippi. A national task force on public education.
132
Retrieved from www.americanprogress.org/kf/mississippi- final.pdf.
Rosenthal, L. (2007). Teacher experience and credentials: Issues to consider. Great
schools. Retrieved from
http://www.greatschools.net/cgibin/showarticle/Ca/952/improve/print.
Rosenshein, B., & Meister, C. (1992). The use of scaffold for teaching high cognitive
strategies. Educational Leadership, 49(7), 26-33.
Rothstein, R. (2004). A wider lens on the Black-White achievement gap. Phi Delta
Kappan, 86, 105-110.
Royer, J. (2007). The cognitive revolution in educational psychology. Greenwich, CT:
Information Age Publishing.
Scruggs, T., Mastropieri, M., & Berkeley, S. (2010). Peer tutoring strategies. Retrieved
from http://www.education.com/reference/article/peer-tutoring/.
Scruggs, T., Mastropieri, M., & Berkeley, S. (2012). Peer-mediated instruction in
inclusive secondary social studies learning: Direct and indirect learning effects.
Learning Disabilities Research and Practice, 27, p. 12-20.
Shaker, P., & Heilman, E. E. (2004). The new common sense of education: Advocacy
research versus academic authority. Teachers College Record, 106, 1444-1470.
Slavin, R. (1990). Cooperative learning: Theory, research, and practice. Englewood
Cliffs, NJ: Prentice Hall.
Smallwood, B., & Segota, J. (2000). Board endorses position papers for ESEA
reauthorization effort. TESOL Matters, 11(1). Retrieved from
www.tesol.org/s_tesol/sec_document.asp?CID=195&DID=869.
Smith, J., Brooks-Gunn, J., & Klebanov, P. (1997). Consequences of living in poverty
133
for Young children’s cognitive and verbal ability and early school achievement.
In G. J. Duncan & J. Brooks-Gunn (Eds.), Consequences of growing up poor (pp.
164-167). New York: Russell Sage Foundation.
Smith, M. Scoll, B., & White-Plisko, V. (1995). The improving America’s schools
act: A new partnership. In J. F. Jennings (Ed.), National issues in education:
elementary and secondary education act (pp. 3-17). Bloomington, IN: Phi Delta
Kappa International.
Solomon, N. (2009). Racial achievement gap still plagues schools. Retrieved from
http://www.npr.org/templates/story/story.php?storyID=114298676.
Southern Education Foundation. (2009). Update: Miles to go: Mississippi. Improving the
Education and the economy from the start. Southern Education Foundation.
Atlanta, GA.
Stahl, S. (1999). Vocabulary development. Cambridge, MA: Brookline.
Stone, C. (1998). Introduction: Urban education in political context. In C. Stone (Ed.),
Changing urban education (pp. 1-20). Lawrence, KS: University Press of
Kansas.
Straits, W., & Wilke, R. 2007. How constructivist are we? Representations of
transmission and participatory models of instruction. Journal of College Science
Teaching, 36(7): 58-61.
Strean, W. (2011). Creating student engagement? HMM: Teaching and learning with
humor, music, and movement. Creative Education, 2(3), 189-192.
SWEPT Multi-site Student Outcome Instruments. (2001). National Science Foundation
(Award # 9812142). Retrieved from

134
http://www.scienceteacherprogram.org/SWEPTStudy/instruments.html.
Tate, W. (1997). Race-ethnicity, ses, gender, and language proficiency trends in
mathematics achievement: An update. Journal for Research in Mathematics
Education, 28(6), 652-679.
Taylor, D., Teddlie, C., Freeman, J., & Pounders, M. (1998). A child’s day at school:
Variations in more and less effective schools in low and middle socioeconomic
status contexts. Journal of education for students placed at risk, 3(2), 115-132.
Teacher quality and student achievement research review. (2005). Center for Public
Education. Retrieved from
http://www.centerforpubliceducation.org/site/c.kjJXJ5MPIwE/b.1510983/k.2A6.
A/Teacher_quality_and_student_achievement_research_review.htm.
Teachman, J., Paasch, K., Randal, D., & Carver, K. (1997). Poverty during
adolescence and subsequent educational attainment. In G. J. Duncan & J. Brooks-
Gunn (Eds.), Consequences of growing up poor (383-413). New York:
Russell Sage Foundation.
Teddlie, C., & Tashakkori, A. (2003). Major issues and controversies in the use of mixed
methods in the social and behavioral sciences. In A. Tashakkori & C. Teddlie
(Eds.), Handbook of mixed methods in social & behavioral research, (3-50).
Thousand Oaks, CA: Sage. Tileston, D., & Darling, S. (2009). Closing the poverty and culture gap: Strategies
to reach every student. Thousand Oaks, CA: Corwin Press.
Topping, K. (2001). Peer assisted learning. Cambridge, MA: Brookline Books.
Tyack, D. (1974). The one best system: A history of urban education. Cambridge, MA:
135
Harvard University Press.
U. S. Census Bureau. (2000). Demographic trends. Washington, DC: Author.
Retrieved June 23, 2010, from
http://www.census.gov/hhes/www/demographics.html.
U. S. Council of Economic Advisers. (1965). Economic Report of the President.
Washington, DC: U.S. Government Printing Office.
U.S. Courts. (2010). History of Brown v Board of Education. Retrieved from
www.uscourts.gov.
U. S. Department of Education. (2002). Public law print of PL 107-110, the No
Child Left Behind Act of 2001. Retrieved from
http://www.ed.gov/policy/elsec/leg/esea02/107-110.pdf.
U. S. Department of Education. (2008). No child left behind: Summary of final Title I
regulations, Washington, DC: Retrieved from
http://www2.ed.gov/policy/elsec/reg/title1/summary.pdf.
U. S. Department of Education. (2012). ESEA flexibility, Washington, DC:
Retrieved from http://www.ed.gov/esea/flexibility.
U. S. Department of Education. (2013). For each and every child: A Strategy
for Education Equity and Excellence, Washington, DC: Retrieved from
http://www2.ed.gov/about/bdscomm/list/eec/equity-excellence-commission-
report.pdf.
U. S. Department of Health and Public Services. (2009). Food code,
Washington, DC: Retrieved from
http://www.fda.gov/downloads/Food/GuidanceRegulation/UCM189448.pdf.
136
U. S. Printing. (1965). Annual Message to the Congress on the State of the
Union, Public papers of the presidents of the United States, Lyndon B. Johnson,
1965, Book 1 (Washington: U.S. Government Printing Office, 1966), 5-7.
Vaughn, W. (2002). Effects of cooperative learning on achievement and attitude
among students of color. The Journal of Educational Research. 95(6). Retrieved
from
http://scholar.google.com/scholar_url?hl=en&q=http://www.hci.sg/admin/uwa/M
Ed8_8631/Readings/Topics%252045.%2520Quantitative%2520Research%2520
Design,%2520Data%2520Collection,%2520and%2520Data%2520Analysis/Addit
ional%2520Resources/Example%2520Articles/Pseudoexperimental2.pdf&sa=X&
scisig=AAGBfm3BNzQxsHDjQgPwSYcHxhjI8fp1NA&oi=scholar.
Van de Walle, J. (2004). Elementary and middle school mathematics: Teaching
developmentally. New York: Pearson Education, Inc.
Vanneman, A., Hamilton, L., Baldwin-Anderson, J., and Rahman, T. (2009).
Achievement gaps: How Black and White students in public school perform in
mathematics and reading in the National Assessment of Educational Progress.
Stastical Analysis. Retrieved from
www.nces.ed.gov/nationsreportcard/pdf/studies/2009455.pdf.
Viadero, D. (2003). Reports with high-stakes testing. Education Week, 22(16), 5.
Vinovskis, M. (1999). History and educational policymaking. New Haven, CT: Yale
University Press.
von Glaserfield, E, (1995). A constructivist approach to teaching. In L. Steffe & J. Gale
(Eds.), Constructivism in education (pp. 3-15). Hillsdale, NJ: Lawrence Erlbaum

137
Associates.
Vygotsky, L. (1978). Mind in society: The development of higher psychology process.
Cambridge, MA: Harvard University Press. (Original published in 1930).
Walberg, H. Paschal, R., & Weinstein, T. (1985). Homework’s powerful effects on
learning. Educational Leadership, 42(7), 76-79.
Walsh, K. (2001). Teacher certification reconsidered: Stumbling for quality. The
Abell Foundation. Baltimore: The Abell Foundation. Retrieved from
www.abell.org/pubsitems/ed_cert_rejoinder_1101.pdf.
Ware, F. (2006). Warm demander pedagogy: Culturally responsive teaching that
supports a culture of achievement for African American students. Urban
Education, 41(4), 427-456.
Webster, B., Young, D., & Fisher, D. (1999). Gender and socioeconomic
equity in mathematics and science education: A comparative study. Paper
presented at the meeting of the American Association of Educational Research,
Montreal, Canada.
Wenglinsky, H. (2002). How schools matter: The link between teacher classroom
practices and student academic performance. Education Policy Analysis Archives,
10(12). Retrieved from http://epaa.asu.edu/epaa/v10n12/.
Wiggins, G., & McTighe, J. (2005). Understanding by design. Alexandria, VA:
Associaton for Supervision and Curriculum Development.
Williams, D. (2003). Closing the achievement gap: Rural schools. Washington, DC:
National Clearinghouse for Comprehensive School Reform. Retrieved from ERIC
Database. (ID No. ED478574).
138
Wilms, W. (2003). Altering the structure and culture of American public schools. Phi
Delta Kappan, 84, 600-615.
Woolridge, M. (2003). Teacher degree levels: The impact on student achievement in
mathematics on high-stakes tests. (Doctoral Dissertation). Retrieved from
http://search.proquest.com.lynx.lib.usm.edu/pqdtft/docview/305247784/fulltextP
DF/4A183245A6ED4578PQ/1?accountid=13946. (3110073).
Woods, M. (1997). Heeding unique needs of urban schools essential to closing
achievement gap. Journal of Staff Development, 18(1). Retrieved June 16, 2010,
from http://www.nsdc.org/library/jsd/woods181.htm.
Woolfolk, A. (2001). Educational Psychology (8th Edition). Needham Heights, MA:
Allyn Bacon.
Wright, S., Horn, S., & Sanders, W. (1997). Teacher and classroom context effects on
student achievement: Implications for teacher evaluation. Journal of Personnel
Evaluation in Education, 1(1), 57-67.
Yager, R. & Lutz, M. (1994). Integrated science: The importance of “how” versus
“why.” School Science and Mathematics, 94(7), 338-346.
Zill, N., Moore, K., Smith, E., Stief, T., & Coiro, M. (1995). The life circumstances and
development of children in welfare families: A profile based on national survey
data. In P.L. Chase-Lansdale and J. Brooks-Gunn (Eds.), Escape from poverty:
What makes a difference for poor children? New York: Cambridge University
Press.
Zimmerman, V. (2002). Moving poems: Kinesthetic learning in the literature classroom.
Pedagogy, 2(3), 409-412.