Effect of Time Delay Between Etching and Adhesive Bonding ...
35
Effect of Time Delay Between Etching and Adhesive Bonding (“Outlife” Time) on Lap-Shear Strength of Aluminum Alloys Using Environmentally-Friendly P2 Etch Josh Barkhimer, Matthew Erich, and Gokul Nair California Polytechnic State University San Luis Obispo Advised by Prof. Katherine C. Chen In Collaboration with Steven A. Tunick
Transcript of Effect of Time Delay Between Etching and Adhesive Bonding ...

Effect of Time Delay Between Etching and Adhesive Bonding
(“Outlife” Time) on Lap-Shear Strength of Aluminum Alloys Using
Environmentally-Friendly P2 Etch
Josh Barkhimer, Matthew Erich, and Gokul Nair
California Polytechnic State University San Luis Obispo
Advised by Prof. Katherine C. Chen
In Collaboration with Steven A. Tunick

1
Approval Page
Project Title: Effect of Time Delay Between Etching and Adhesive Bonding (“Outlife”
Time) on Lap-Shear Strength of Aluminum Alloys Using Environmentally-Friendly P2 Etch
Authors: Matthew Erich | Gokul Nair | Josh Barkhimer
Date Submitted: June 6, 2015
CAL POLY STATE UNIVERSITY
Materials Engineering Department
Since this project is a result of a class assignment, it has been graded and accepted as
fulfillment of the course requirements. Acceptance does not imply technical accuracy or
reliability. Any use of information in this report is done at the risk of the user. These risks
may include catastrophic failure of the device or infringement of patent or copyright laws.
The students and staff of Cal Poly State University, San Luis Obispo cannot be held liable
for any misuse of the project.
Katherine C. Chen ____________________________
Project Advisor Signature
Katherine C. Chen ____________________________
Department Chair Signature

2
Table of Contents
Abstract
1. Introduction
2. Literature Review
2.1 Aluminum Alloys Used
2.2 Overview of Pre-bonding Surface Preparation of Aluminum
2.3 Optimized FPL Etch Process
2.4 P2 Etch Process
2.5 Comparison of Effects of Optimized FPL and P2 Etches
2.6 Adhesive Used
3. Experimental Procedure
3.1 Materials and Equipment
3.2 Aluminum Coupon Preparation
3.3 Surface Preparation and Pre-Treatment
3.4 Adhesive Preparation
3.5 Lap-Shear Sample Assembly
3.6 Lap Shear Testing
3.7 Statistical Methods
4. Results
4.1 Specimen Failure Modes
4.2 Effect of Etchants on Bond Strength
4.3 Effect of Outlife on Bond Strengths
4.3.1 Outlife Effect on 2024 Etched with FPL
4.3.2 Outlife Effect on 2024 Etched with P2
4.3.3 Outlife Effect on 6061 Etched with P2
4.3.4 Outlife Effect on 7075 Etched with P2
4.3.5 Three Alloy Comparison of Bond Strength with Outlife Time
5. Discussion
5.1 Purpose of Pretreatment
5.2 Explanation of Outlife
5.3 Clarification of Statistical Analysis
6. Conclusion
7. Acknowledgments
8. References
Appendix A: Glossary of Terms
Appendix B: Detailed Sample Preparation Procedure
Appendix C: Compilation of Test Sample Data (Shear Stress at Break, Maximum Load, and
Bond Area)

3
List of Tables
Table I. Comparison of Lap Shear Strengths of Aluminum Alloy Adhesive Bonds
Table II. Example output from Bluehill software showing 4 hour outlife specimens
Table III. Bond Strengths and Outlife Times for P2-etched Al 2024
Table IV. Bond Strengths and Outlife Times for P2-etched Al 6061
Table V. Bond Strengths and Outlife Times for P2-etched Al 7075
Table VI. Groupings Based on Tukey’s Pairwise Comparisons
List of Figures
Figure 1. A) Stereo STEM micrograph of oxide morphology of FPL treated 2024 aluminum surface. B) Isometric
drawing of proposed oxide structure [2]
Figure 2. SEM micrographs of Al 2024 treated with FPL (top row) & P2 (bottom row). SE images show topography
& BSE images show composition (x1000) (A) SE image of alloy after FPL etch (B) BSE image of alloy after FPL
etch (C) SE image of alloy after P2 etch (D) BSE image of alloy after P2 etch [3]
Figure 3. Example specifications for following ASTM D1002 for creating lap-shear coupons
Figure 4. Finished lap-shear joint sample after being correctly joined
Figure 5. Graph produced by Bluehill software presenting the load vs. tensile extension of adhesively bonded 2024
aluminum alloys.
Figure 6. Representation of de-bonding
Figure 7. Representation of peeling
Figure 8. Bond strength nearly doubles when using either P2 or FPL etchant compared to using no etchant
Figure 9. 2024 samples etched with FPL tested similar similar shear strengths to 2024 etched with P2
Figure 10. 2024 P2 testing showed scatter due to increasing proficiency in preparation of lap-shear joints
Figure 11. 6061 P2 samples best represented the trend of decreasing bond strength with increasing outlife time
Figure 12. 7075 P2 tested with highest initial bond strength of 3.8ksi in comparison to 2024 P2 that tested at 2.8ksi
Figure 13. Initial bond strength ranges from 2.8ksi to 3.8ksi and shows a range in decrease from 15% to 21% with
2024 to 7075, respectively

4
Abstract
Raytheon Company currently uses a Forest Products Laboratory (FPL) paste etchant for
preparing aluminum surfaces for adhesive bonding, and FPL is a source of hazardous hexavalent
chromium. The goal of this study was to evaluate a less-toxic P2 paste etchant as a possible
replacement. Coupons of 2024-T3, 6061-T6, and 7075-T6 grades of aluminum alloy were
solvent-degreased, abrasively cleaned, and etched at room temperature using P2 paste following
a strict protocol adopted from Raytheon. Coupons were then left exposed to air for assigned time
intervals (or “outlife” times) of 0, 1, 4, 8, 16, and 63 or 72 hours. The aluminum alloy coupons
were then adhesively bonded together using Loctite EA9394 adhesive with an approximate
bonding area of 0.5” by 1.0” and 0.010-inch thickness into single-lap joints for testing as per
ASTM D1002. Samples were placed in a tensile-test fixture on an Instron with a pull rate of .05
in/min to measure bond shear strength. Decrease in shear strength was plotted as a function of
outlife for each alloy, and statistical analysis was carried out to identify outlife times for each
part which bond strength decreased significantly. The information obtained will further the
development of future P2 etch processes, providing maximum allowable outlife times prior to
commencing structural adhesive bonding operations.
Keywords: etchant, aluminum, adhesive, lap-shear, shear strength, outlife, FPL, P2
1. Introduction
Aluminum alloys are amongst the most popular engineering alloys used worldwide in the
aerospace industry (as well as countless other industries). They possess superb mechanical
properties while also being relatively cheap. In structural applications, these alloys have been
joined by riveting or welding, but adhesive bonding has seen increasing use in primary structural
bonding of aircraft components for over 50 years and has been a direct competitor to riveting,
though not as prevalent, and more recently in the automotive industry. Adhesively bonding
aluminum alloys is efficient and low-cost, and confers significant weight savings in the final
product. Using adhesives also has the benefit of eliminating stress concentrations and subsequent
distortion of the alloy that can occur during riveting or welding operations [1]. It is also an

5
efficient way of eliminating manufacturing tolerance stack up, reducing the need for highly
precise machining tolerances.
The goal of structural adhesive bonding is to produce a completed part that is seamless in terms
of its mechanical properties. That is, the bond needs to be strong enough such that the metal
itself yields before the bond does, allowing the part to be regarded as a single, continuous piece.
However, the tendency of aluminum to rapidly form an oxide layer in the presence of air renders
it chemically incompatible with the adhesive and will result in poor bond strength. This
necessitates a process to optimize the oxide’s morphology and chemically activate the surface in
order to maximize bond strength [2, 3]. This can be accomplished either by etching the alloy or
applying a specialized process before an adhesive is applied. It is recommended that bonding be
conducted as soon after etching as possible, since the etchant produces a chemically-active
surface that will quickly bind dust or impurities from the surrounding environment, all of which
degrade adhesive bond strength [4]. For the remainder of this paper, the time interval during
which samples are left out between etching and bonding will be referred to as "outlife".
The two most widely-used etchants in the aerospace industry are the optimized Forest Products
Laboratory (FPL) and P2 etchants, the latter of which will be the focus of this investigation. The
FPL etchant, developed in 1950 and refined (hence the term “optimized”) in 1975, saw a great
deal of use in the aerospace industry for a number of years. However, the use of toxic and
potentially-carcinogenic hexavalent chromium compounds in the FPL etch process led to many
countries no longer allowing its use. In the U.S. most communities impose extremely strict limits
on effluent emissions in the parts per billion range. The P2 etchant was developed as a less toxic
alternative, and was able to achieve similar or superior bond strengths compared to its
predecessor [2].
In production, etching is generally accomplished by immersion of a pre-treated aluminum part in
a tank of hot etchant solution. However, the etchants are sometimes mixed with fumed silica to
form a paste etchant that is used at room temperature for preparing oversized parts or for
repairing in-service adhesive joints. While the paste etch variant of the P2 etch may result in
somewhat lower bond strength, Raytheon Company uses paste etchants in production, hence the
6
focus of this study is on paste etchants. Unfortunately, there is a lack of published literature
directly comparing paste and tank etchants, and it is not precisely known how the etching
mechanisms differ. Raytheon has achieved sufficient production bond strengths for its
applications using an FPL paste, but lacks information on the performance of a P2 paste. This
study is intended to assess this performance in order to inform the development of an alternative
process to the FPL paste. Specifically, the goal of this study is to determine the effect of outlife
after P2 paste etching on single-lap shear strengths of adhesively-bonded specimens of Al 2024,
6061, and 7075 alloys.
2. Literature Review
This section will provide an overview of the alloys and adhesives to be used in the study,
common steps for preparing aluminum alloys for bonding, and the comparative effects of the
optimized FPL and P2 etch processes on the alloys.
2.1 Aluminum Alloys Used
Aluminum alloys are commonly used in aerospace, automotive, marine, and building
applications because of their high strength-to-weight ratio with a low average density of
approximately 2.7g/cm3. Specific properties can be obtained by changing their alloy
compositions and temper conditions. Al 2024-T3, 6061-T6, and 7075-T6 are the alloys and
tempers used in this study. Al 2024 is an Al-Mg-Cu alloy, while Al 6061 is an Al-Mg-Si alloy
and Al 7075 is an Al-Mg-Zn-Cu alloy [5, 6]. The listed alloys have shear strengths of 40 ksi, 41
ksi, and 48 ksi, respectively [7].
The action of an etchant on a specific aluminum alloy depends on the pitting corrosion behavior
of that alloy, since the main purpose of the etching procedure is to generate a porous surface
oxide [3]. This behavior depends on the alloy composition, since pits are thought to be initiated
at some heterogeneity on the surface, such as constituent particles of the alloying elements in the
case of the alloys used in this study. The presence of the alloying elements is thought to cause a
large difference in electrode potential with regard to the alloy matrix, which may be either anodic
or cathodic depending on the specific composition in question. Cathodic particles would tend to

7
have a greater effect as pit initiators due to the rapid dissolution experienced by anodic particles.
This dissolution, coupled with continuous galvanic action, means that cathodic particles also
have a realm of influence extending to many times the size of the particle itself, creating larger
pits [3, 8]. A difference in pitting behavior due to the presence of alloying elements is
corroborated in the literature, as Al 2024 etched by both FPL and P2 showed a much greater
degree of pitting compared to Al 1050, which has an alloy composition closely approaching that
of pure aluminum [3]. Generally, the 6xxx-series alloys are considered to have better resistance
to corrosion compared to the Cu and Zn-containing 2xxx and 7xxx-series alloys, and this could
play a role in differences in the effects of the P2 paste etch treatment on the different alloys used
in the present study [5]. Additionally, the T6 temper condition is considered to be more prone to
intergranular corrosion due to short inter-particle distances that allow the advance of corrosion
past the surface. Since pitting corrosion advances by way of localized sub-surface attack of the
metal, the temper condition would be expected to affect the action of the etchant [6].
2.2 Overview of Pre-bonding Surface Preparation of Aluminum
Aluminum rapidly oxidizes when exposed to air, forming a thin (~10 nm) layer of aluminum
oxide and/or hydroxide. This natural oxide layer is unstable and leads to adhesive bond strengths
that are generally regarded as poor. This necessitates the application of a chemical or
electrochemical treatment to build an oxide layer more suitable for bonding [3]. Generally
speaking, these treatments improve adhesion by modifying the surface chemistry and generating
a strongly adhered porous oxide layer that provides a greater degree of mechanical "keying" with
the applied adhesive [10]. For several years after its development in the 1950s, use of the
chromic-acid based FPL etch process and its variants was industrial practice, but a variety of
replacements have since been developed as a number of countries started to phase out treatments
containing chromates over toxicity concerns. When electrochemical immersion processes cannot
be used, the most promising among these replacements is the sulfuric acid-based P2 etch [2].
The common steps for many surface preparation processes for adhesively bonding aluminum
alloys are listed in ASTM D2651. The first step is to degrease the metal to be bonded. Vapor
degreasing is recommended by using isopropanol, but this may also be combined or substituted

8
with an alkaline degreasing solution. It is also noted that the removal of grease may be
accomplished with a large variety of common solvents. Following degreasing, oxidized surfaces
should be scrubbed with a non-metallic abrasive such as aluminum oxide-impregnated nylon
Scotchbrite 7449 matting as an initial deoxidizing step. The aluminum is then rinsed of abrasive
and debris and subjected to a water-break test. According to ASTM D2651, successful cleaning
will result in water forming a continuous sheet of water on the surface during a 30 second
drainage period as opposed to individual droplets of water (water break-free condition). Parts in
this condition then continue on to further process steps, where the aluminum can be treated either
by immersion in an etchant solution - usually FPL or P2 - or phosphoric acid anodization [4].
Commercially, a bulk pretreatment apparatus consists of a series of tanks containing the needed
solutions arranged with overhead cranes to move parts through the processing steps. These tanks
may be fitted with circulation and/or temperature control mechanisms depending on specific
processing needs. ASTM D2651 also lists the conditions under which surface preparation
processes must be done, listing specific cleanliness standards for rinse and solution water, as well
as general temperature, humidity, and cleanliness standards for room conditions. It is
recommended that water for preparing solutions be treated to reach a condition of not more than
50 ppm of solids with a pH between 5.5 and 10. Conditions in the processing environment
should be controlled to a temperature between 18 and 24 °C, with a relative humidity of between
40 and 65 percent, and with air pressurized to slightly above ambient condition and filtered to
remove dust particles. [4].
2.3 Optimized FPL Etch Process
In its original formulation, the FPL etchant consists of 30 parts H2O, 10 parts H2SO4, and 2 parts
Na2Cr2O7. The so-called “optimization” involves the addition of copper (Cu), either in the form
of copper sulfate or by dissolving an amount of Al 2024 in the etchant solution. The addition of
copper appears to assist in the formation of small, deep pores that enhance bonding ability [2].

9
Much of the existing knowledge about the FPL etchant and its function was generated by
investigators at Martin Marietta Labs, who proposed that the following two reactions occur
during the etch process:
2Al + H2SO4 + Na2Cr2O7 → Al2O3 + Na2SO4 + Cr2SO4 + 4H2O (Eq. 1)
Al2O3 + 3H2SO4→Al2(SO4)3 + 3H2O (Eq. 2)
Equation 1 shows the reaction of the etchant with the aluminum alloy, leading to the formation
of an alumina (Al2O3) surface layer, and Equation 2 represents the dissolution of the alumina by
sulfuric acid present in solution. It was found that the aluminum oxide-producing reaction
proceeded at a faster rate than the reaction of the oxide with sulfuric acid, leaving a controlled
amount of alumina on the alloy surface. Figure 1 shows a micrograph and isometric drawing of
the surface oxide structure after FPL etching and subsequent rinsing [2].
Figure 1. Stereo STEM micrograph of oxide morphology of FPL treated 2024 aluminum surface. B) Isometric
drawing of proposed oxide structure [2]
10
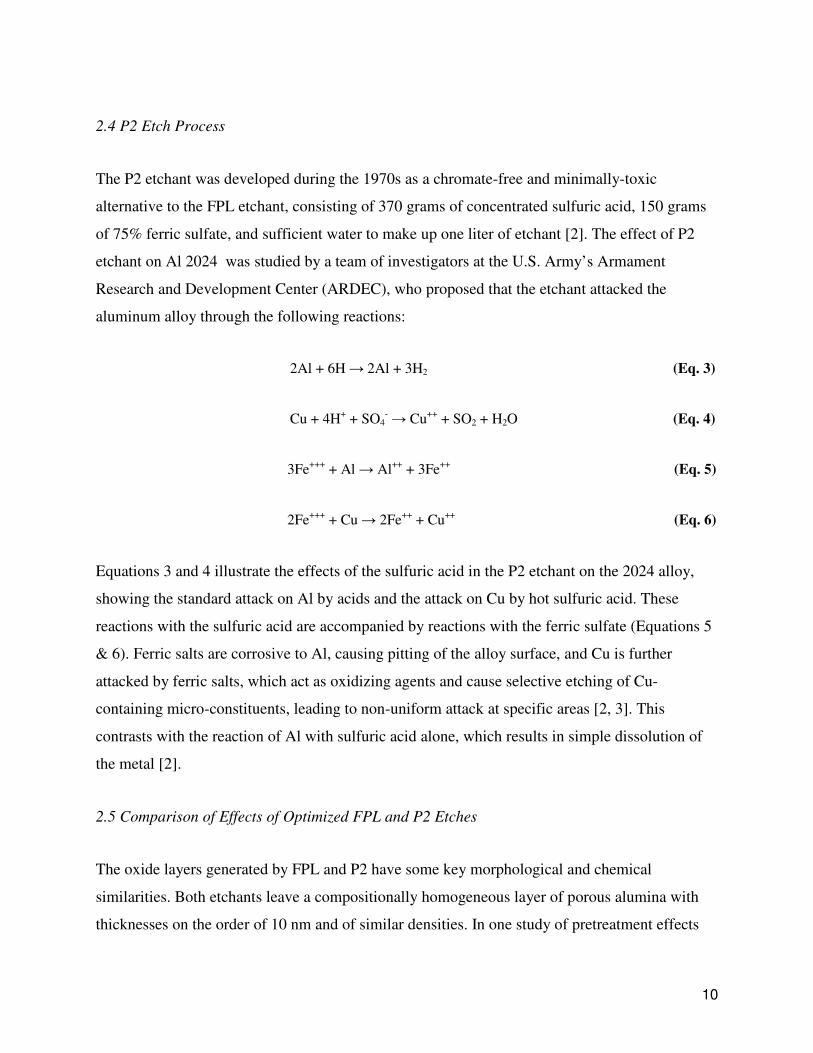
2.4 P2 Etch Process
The P2 etchant was developed during the 1970s as a chromate-free and minimally-toxic
alternative to the FPL etchant, consisting of 370 grams of concentrated sulfuric acid, 150 grams
of 75% ferric sulfate, and sufficient water to make up one liter of etchant [2]. The effect of P2
etchant on Al 2024 was studied by a team of investigators at the U.S. Army’s Armament
Research and Development Center (ARDEC), who proposed that the etchant attacked the
aluminum alloy through the following reactions:
2Al + 6H → 2Al + 3H2 (Eq. 3)
Cu + 4H+ + SO4
- → Cu
++ + SO2 + H2O (Eq. 4)
3Fe+++
+ Al → Al++
+ 3Fe++
(Eq. 5)
2Fe+++
+ Cu → 2Fe++
+ Cu++
(Eq. 6)
Equations 3 and 4 illustrate the effects of the sulfuric acid in the P2 etchant on the 2024 alloy,
showing the standard attack on Al by acids and the attack on Cu by hot sulfuric acid. These
reactions with the sulfuric acid are accompanied by reactions with the ferric sulfate (Equations 5
& 6). Ferric salts are corrosive to Al, causing pitting of the alloy surface, and Cu is further
attacked by ferric salts, which act as oxidizing agents and cause selective etching of Cu-
containing micro-constituents, leading to non-uniform attack at specific areas [2, 3]. This
contrasts with the reaction of Al with sulfuric acid alone, which results in simple dissolution of
the metal [2].
2.5 Comparison of Effects of Optimized FPL and P2 Etches
The oxide layers generated by FPL and P2 have some key morphological and chemical
similarities. Both etchants leave a compositionally homogeneous layer of porous alumina with
thicknesses on the order of 10 nm and of similar densities. In one study of pretreatment effects

11
on aluminum, Energy Dispersive Spectroscopy-Scanning Electron Microscopy (EDS-SEM)
analysis revealed that both etchants react with and completely eliminate traces of Fe from the
alloy's surface, and reduce the concentration of Cu on Al 2024 surfaces by 50% [3]. X-ray
Photoelectron Spectroscopy (XPS) analysis of etched Al 5005 from another study revealed that
both etchants caused changes in the ratios of oxygen-containing species, specifically Al-O, Al-
OH, and Al-OH2 at the surface. These changes were accompanied by large variances in oxide
thickness, and it was proposed that this is a result of the highly active etched surfaces reacting
with atmospheric moisture. This suggests that the precise surface chemistry of the etched
surfaces depends on the post-treatment environment [10].
Compared with FPL-etched aluminum alloys, P2 forms an oxide layer with enhanced porosity
and roughness due to the formation of larger and more numerous pits in the alloy surface. Figure
2 shows SEM micrographs of FPL and P2-etched Al 2024 for comparison. The secondary
electron (SE) micrographs (Figs. 2a & 2c) show the topography of the etched surfaces while the
backscattered electron (BSE) micrographs (Figs. 2b & 2d) show differences in chemical
composition. The greater roughness of the P2-etched surface contributes to the type of
mechanical keying that, in principle, should lead to higher lap shear strengths. In terms of surface
chemistry, the main difference between FPL and P2-etched alloys is the removal of Si by P2
when etching Al 6xxx alloys. FPL, on the other hand, minimally affects the surface
concentration of Si [3].

12
Figure 2. SEM micrographs of Al 2024 treated with FPL (top row) & P2 (bottom row). SE images show topography
& BSE images show composition (x1000) (A) SE image of alloy after FPL etch (B) BSE image of alloy after FPL
etch (C) SE image of alloy after P2 etch (D) BSE image of alloy after P2 etch [3].
Adhesive bonds prepared using the P2 etch have lap shear strengths similar or superior to those
treated with FPL, and remain comparable even after exposure to various service conditions. This
indicates that the P2 etch could potentially be used to replace FPL. After FPL etches Al 2024
and Al 7075 alloys, it produces lap shear strengths of 2.8 ksi and 3.8 ksi, respectively. After P2
etches the alloys, it produces equal or greater lap shear strength than FPL [11, 2].
2.6 Adhesive Used
For this project, the adhesive used to join the aluminum alloys together is Loctite EA9394, a
two-part structural adhesive made by Henkel Aerospace for metal-to-metal bonding. Parts A and
B consist of epoxy resins and amines, respectively, and are mixed in a 100:17 ratio. The adhesive
cures at room temperature and possesses excellent strength to 177 °C and higher [9].
13
3. Experimental Procedure
3.1 Materials and Equipment
Sheets of Al 2024 T3, 6061 T6, and 7075 T6 were supplied by Raytheon and Mcmaster Carr
company for aluminum coupon preparation. P2 etch paste (15% by weight FeSO4, 37% H2SO4,
and 48% H2O, and 5% Cab-O-Sil) was supplied by Raytheon. EA9394 Adhesive (Loctite) for
bonding of coupons was provided by Raytheon. 120-grit sandpaper, Ajax powder soap, and
isopropanol were all purchased through external vendors by Cal Poly San Luis Obispo Materials
Engineering Department.
Aluminum coupons were cut from sheet stock using a PEXTO 12-U-4-F Squaring Shear and
machined on a Bridgeport Vertical Knee Mill. A ½-inch diameter, dual-flute high-speed steel
end mill was used for metal at a speed of 1115 revolutions per minute.
Lap-shear testing was conducted on an Instron 3369P6252 with a 50 kN (11,250 lb) load cell in
accordance with recommendations in ASTM D1002. Bluehill software was configured
specifically for lap-shear testing and was used to produce line graphs showing load (lb) against
tensile extension (in). Using the load at break and the area input, the Bluehill software calculated
the approximate tensile stress at break (psi).
3.2 Aluminum Coupon Preparation
The aluminum sheets were sheared into approximately 1-inch wide strips and each strip was
subsequently sheared into rectangular coupons measuring approximately 5 inches long. The
coupons were then placed on a mill in batches of 5 coupons atop dual ⅛-inch parallel bars so any
bevels from shearing could be machined off. Two cuts were made on the coupons’ lengthwise
edges - the first was done to a depth of approximately .020 inches to approach sample
dimensions specified in ASTM D1002, and the second was a finishing cut at a depth of
approximately .005 inches. Dimensions following shearing were variable, and depths of cut were

14
varied as needed. Machined coupons were then deburred using a manual file and placed on a flat
table to be evaluated for deformation. Coupons that did not lie flat due to being deformed were
rejected and not used in preparing lap-shear specimens.
3.3 Surface Preparation and Pre-Treatment
The 1 x 5-inch aluminum coupons were degreased using Kimwipes wetted with either
isopropanol or acetone. The samples were then dusted with Ajax oxygen bleach cleanser and
rinsed with tap water. Samples were then placed on a smooth flat surface to be scrubbed width-
wise with 120-grit abrasive paper at the top 1-inch of each sample (area to be bonded) until a
water break-free surface was achieved. Water break-free condition was verified by rinsing the
scrubbed area with distilled water and observing sheeting as opposed to the droplet formation.
Once this condition was achieved, wet samples were placed flat on paper towels with the
scrubbed area facing up for etchant application.
With the water break-free surface facing upwards, the P2 etch paste was applied using a standard
¼-inch acid brush. Etchant was applied to the top 1-inch of the scrubbed surface in sufficient
quantity to completely cover the surface. Coupons were then left at ambient room temperature
for 25 minutes to allow the etchant to chemically activate the surface to be bonded. After etching
was complete, the etchant was rinsed from the coupons over an acid waste container using tap
water in a laboratory wash bottle. To comply with Environmental Health and Safety standards,
standard operating procedure forms were completed and monitored in order to document our
procedure and maintain safety. The volatile etchants and liquids were rinsed in a designated
container by EHS and the physical tools were disposed in a secondary solid waste container
provided by EHS. Etched coupons were completely rinsed and dried in a low-temperature air-
circulating oven at 160°F for 20 minutes. Following drying, the outlife test parameter was
introduced by leaving the pre-treated coupons exposed to the ambient pre-treatment environment
(lab room 205) for a pre-determined time interval of 0, 1, 4, 8, or 16 hours. A more detailed
treatment procedure may be found in Appendix B. All aluminum alloys experienced a long
exposure outlife time which ranged anywhere from 64 to 73 hours. This was done to complete
the outlife data sets. Note that exposure of the bonding surfaces to an uncontrolled outside

15
environment was minimized by transporting samples to and from the drying oven in a closed
plastic box.
3.4 Adhesive Preparation
EA9394 adhesive was prepared during the drying cycle of the no-outlife coupons or 20 minutes
prior to bonding for coupons with outlife. The EA9394 adhesive used in this procedure is a two-
part adhesive with a bonding agent and a curing agent mixed with a 100:17 ratio. 50 g of
bonding agent was weighed into a plastic laboratory beaker using two laboratory spatulas.
Spatulas were then completely cleaned using isopropanol and chemical wipes and used to add
8.5 g of curing agent to the bonding agent. Note: Any amount of adhesive could be made as long
as the 100:17 ratio is maintained. A small scoop of .010-in diameter silica beads was added to
the adhesive mixture to ensure uniform bondline thicknesses in completed lap-shear specimens.
All components were then thoroughly mixed for roughly 10 minutes in the original beaker using
a spatula to achieve a uniform mixture. Appendix B may be referenced for further detail
regarding adhesive preparation. Over the duration of this project, 126 total lap-shear coupons
were made.
3.5 Lap-Shear Sample Assembly
After the alloys were finished drying (designated outlife time) and adhesive was prepared, the
coupons were ready to be assembled. Each coupon received an application of adhesive to the
etched section of the alloys samples. Adhesive was applied using a clean lab spatula adequately
covering the top ½-inch of each sample. It was important to ensure that there were no exposed
spaces, voids, or sections of the applied surface (Fig. 3). Once applied with adhesive, the sample
coupons were placed together forming a bonded interface between the surfaces of two bonded
samples (Fig. 4). Ensuring a ½-inch overlap between samples, 6 lb. pinch clamps were applied at
the bond interface (two per test coupon). Samples were checked to be completely straight and
left out for 24 hours to allow adhesive to set. After the 24 hour cycle, the pinch clamps were
removed and the samples were placed in a dry-air circulating oven for 2 hours at 200°F. The

16
samples were removed and taken to an Instron tensile test machine for lap shear pulling (ASTM
D1002).
Figure 3. Example specifications for following ASTM D1002 for creating lap-shear coupons
Figure 4. Finished lap-shear joint sample after being correctly joined
1.0”
7.5”
0.5”

17
3.6 Lap Shear Testing
Prior to testing, each specimen was labeled by alloy type, outlife time, and trial number (i.e.
sample 2/1/4 was Al 2024 with a 1 hour outlife and used in the fourth trial for that category).
Once all samples were labeled, the bond widths and overlap-lengths were measured and input to
the Bluehill software program. Separate files were made for each alloy and outlife. The samples
were then placed 1 inch into the Instron grips on both sides for symmetrical experimentation.
While samples were being pulled by the Instron machine, the Bluehill software produced a graph
that showed the relation between tensile extension (in) and force exerted (lb) (Fig. 5). Bluhill
also generated a table presenting the specimen label, maximum load (lbf), load at break (lbf), and
tensile stress at break (ksi) along with the mean and standard variation of each value (Table II).
During lap-shear testing the samples began to yield around 2.4 ksi due to the maximum shear
stress of aluminum alloys. Each test lasted an average of about 40 seconds. The samples were
removed from the Instron grips and measured immediately to determine bond-line thickness . At
this point the two coupons were completely separated from each other and the dried adhesive
was exposed. Silica beads used in the adhesive helped provide an average bond-line thickness of
.010 in. Once all samples were tested and measured, coupons were taped together with their
counterparts. A container with six compartments was used to organize the alloys with different
outlife times.
Figure 5. Graph produced by Bluehill software presenting the load vs. tensile extension of adhesively bonded 2024
aluminum alloys.
Table II. Example output from Bluehill software showing 4 hour outlife specimens

18
3.7 Statistical Methods
Statistical analysis of the test results via one-way analysis of variance (ANOVA) was performed
using the general linear model command in MINITAB, followed by Tukey’s pairwise
comparisons. Analysis was done separately for each alloy based on the shear strength and outlife
data for all non-rejected samples (Appendix C). Shear strength was used as the “Responses”
variable while outlife was used as the “Model”. In addition, deleted t-residuals were stored and
plotted in order to detect the presence of unequal variances. Pairwise comparisons were made
with Outlife set as the “Terms” variable with a 95% confidence level.
4. Results
4.1 Specimen Failure Modes
During testing of the lap-shear specimens, two main failure modes were observed: de-bonding
and peeling. De-bonding (Fig. 6) presented with an uneven distribution of adhesive where all or
most of the adhesive was left on one of the coupons. This was due to preparation error as much
mastery is required to get a desirable bond. Peel occurred due to yielding of the alloy, and
showed curved failure surfaces and a more even distribution of the adhesive between the two
coupons. The undesirable failure mode that occurred during testing was a de-bond that occurred
between the adhesive and the aluminum alloy interface. Debonding is where there is a clear
uneven distribution of adhesive bond on the alloy surface. This occurred due to possible errors in
sample preparation, environmental contaminants, and uneven bonding of the two coupons.
These samples resulted in relatively low bond strength values and did not contribute to the final

19
data shown in the shear strength vs. outlife data. This was indicative of poor preparation and thus
not the true strength of the adhesive bond.
The desirable failure mode experienced by lap-shear samples during testing was failure by
peeling, in which the alloy yielded before bond failure and peeled back the adhesive. This was
indicated by a visually identifiable curvature of the aluminum coupons after testing on the
Instron. The yielding behavior means that the bond failure was initiated by yielding of the metal
and not by failure of the adhesive itself. Evidence for this failure mode involves the two yielded
aluminum coupons with an even distribution of cured adhesive between the two coupons (Fig.
7). This indicates that failure may be attributed to the aluminum and not the adhesive bond and
furthermore indicating the adhesive bond was successful in infiltrating the porous aluminum
surface resulting in full bond strength.
Figure 6. Representation of de-bonding Figure 7. Representation of peeling
4.2 Effect of Etchants on Bond Strength
Average lap-shear strengths for 0-outlife Al 2024 etched with FPL and P2 pastes were obtained
in order to compare the effects of the original procedure to the proposed replacement. Both
etchants showed similar effects on this alloy, resulting in an increase in shear strength from 1.47
ksi to 2.77 ksi and 2.78 ksi for FPL and P2, respectively. These increases represent an
approximate 92% increase in shear strength from using either treatment compared to non-etched
specimens (Fig. 8).

20
Figure 8. Bond strength nearly doubles when using either P2 or FPL etchant compared to using no etchant

21
4.3 Effect of Outlife on Bond Strengths
4.3.1 Outlife Effect on 2024 Etched with FPL
Data from the FPL-etched 2024 specimens was plotted in order to obtain a baseline for
comparisons to be made between the outlife behavior of alloys treated with either etchant (Fig.
9). An average 15.3% decrease in bond strength was observed after the first hour of outlife time.
The curve shown was hand-drawn to show the expected trend in spite of the anomalous 0-hour
and 1-hour outlife averages. Due to EHS safety protocols, the FPL etched samples were prepared
at Raytheon in El Segundo, CA. They were shipped to Cal Poly San Luis Obispo for testing.
Figure 9. 2024 samples etched with FPL tested similar similar shear strengths to 2024 etched with P2
4.3.2 Outlife Effect on 2024 Etched with P2
Similar behavior was observed for the P2-etched Al 2024 samples, which displayed a 14.9%
decrease in strength from 2.75 to 2.43 ksi after the first hour of outlife, with an apparent
asymptote at about 2.2 ksi (Fig. 10). These alloys showed a significant amount of scatter due to
improvements in the researchers’ coupon assembly technique during the period of time that said
samples were being tested. As the experiment progressed and more accurate samples were made,
the data was more consistent with a decreasing trend. Improved sample accuracy, however, also
22
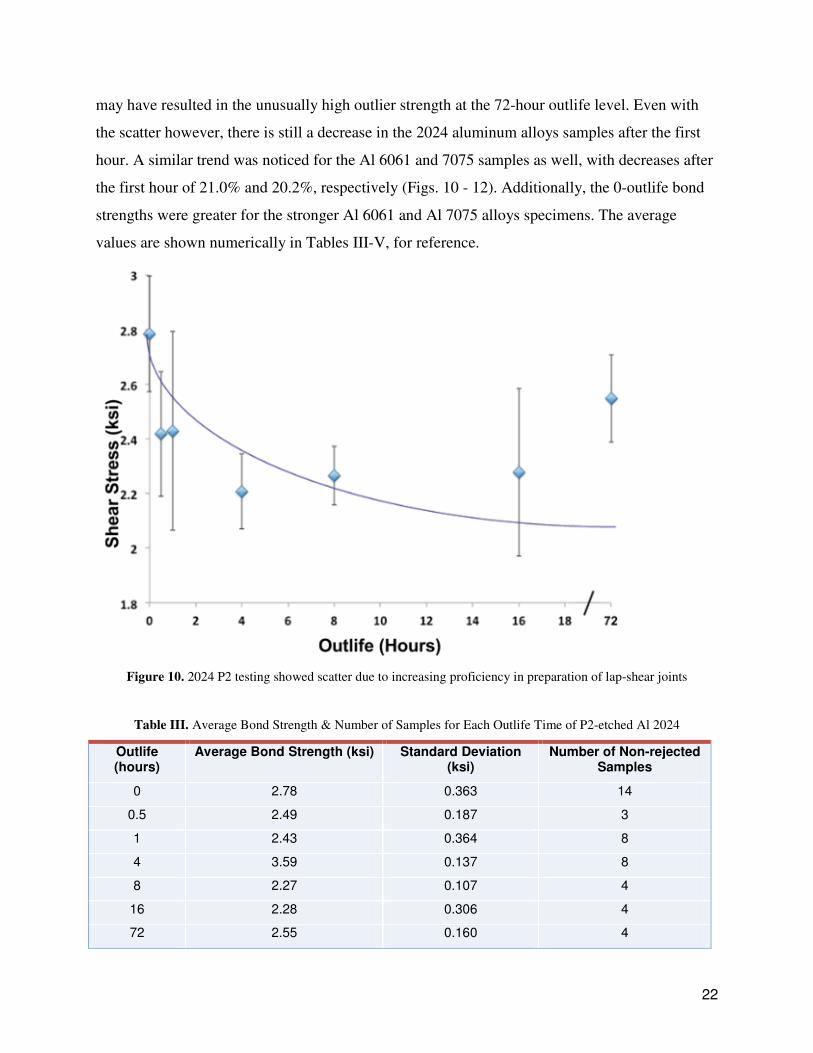
may have resulted in the unusually high outlier strength at the 72-hour outlife level. Even with
the scatter however, there is still a decrease in the 2024 aluminum alloys samples after the first
hour. A similar trend was noticed for the Al 6061 and 7075 samples as well, with decreases after
the first hour of 21.0% and 20.2%, respectively (Figs. 10 - 12). Additionally, the 0-outlife bond
strengths were greater for the stronger Al 6061 and Al 7075 alloys specimens. The average
values are shown numerically in Tables III-V, for reference.
Figure 10. 2024 P2 testing showed scatter due to increasing proficiency in preparation of lap-shear joints
Table III. Average Bond Strength & Number of Samples for Each Outlife Time of P2-etched Al 2024
Outlife (hours)
Average Bond Strength (ksi) Standard Deviation (ksi)
Number of Non-rejected Samples
0 2.78 0.363 14
0.5 2.49 0.187 3
1 2.43 0.364 8
4 3.59 0.137 8
8 2.27 0.107 4
16 2.28 0.306 4
72 2.55 0.160 4

23
4.3.3 Outlife Effect on 6061 Etched with P2
The 6061 aluminum alloy followed our hypothesis. The initial 0 hour outlife shear stress were
the strongest test specimens for this alloy, at an average shear strength of 3.10 ksi. Following
these 0 outlife specimens, there was a significant decrease in shear stress (bond strength) at a
drop of 21% after the first hour of outlife and a plateau of about 2 ksi thereafter (Fig. 11).
Statistical analysis using the Tukey method showed that the bond strengths observed after one
hour of outlife were significantly different from those with no outlife.
Figure 11. 6061 P2 samples best represented the trend of decreasing bond strength with increasing outlife time
Table IV. Average Bond Strength & Number of Samples for Each Outlife Time of P2-etched Al 6061
Outlife (hours)
Average Bond Strength (ksi) Standard Deviation (ksi)
Number of Non-rejected Samples
0 3.10 0.465 7
1 2.93 0.057 2
4 2.34 0.194 4
63 2.09 0.212 4

24
4.3.4 Outlife Effect on 7075 Etched with P2
The 7075 aluminum alloys also accurately demonstrated that with increasing outlife time comes
decreasing bond strength. The initial bond strength at 0 hour outlife was significantly stronger at
3.74 ksi. This is due to the shear strength of the alloy as it is higher than that of 6061 and 2024.
Again, after the first 0 outlife test, there was a bond strength drop of 20.2% (Fig. 12). The Tukey
comparison test supported this statement showing that the values were statistically different from
each other.
Figure 12. 7075 P2 tested with highest initial bond strength of 3.8ksi in comparison to 2024 P2 that tested at 2.8ksi

25
Table V. Average Bond Strength & Number of Samples for Each Outlife Time of P2-etched Al 7075
Outlife (hours)
Average Bond Strength (ksi) Standard Deviation (ksi)
Number of Non-rejected Samples
0 3.74 0.327 6
1 2.84 0.221 3
4 2.99 0.441 3
63 3.12 0.131 3
4.3.5 Three Alloy Comparison of Bond Strength with Outlife Time
Each alloy experienced a significant bond strength drop as outlife time increased. 2024 dropped
by roughly 14.9% strength drop, 6061 a 21% drop, and 7075 a 20.2% drop. The drop in strength
with outlife can be seen in for each alloy in Figure 13.
Figure 13. Initial bond strength ranges from 2.8ksi to 3.8ksi and shows a range in decrease from 15% to 21% with
2024 to 7075, respectively
4.4 Results of Statistical Analysis
One-way ANOVA with Tukey’s pairwise comparisons was performed on the lap-shear test
averages using MINITAB in order to determine the outlife times at which adhesive bonds for all
three alloys experienced a significant decrease in shear strength. Groupings based on the Tukey
analysis were generated by MINITAB and are shown in Table 5. The letters are used to indicate
groupings within which the test averages were similar or significantly different. Within each
alloy, outlife times that do not share a letter are significantly different, and times that share a
26
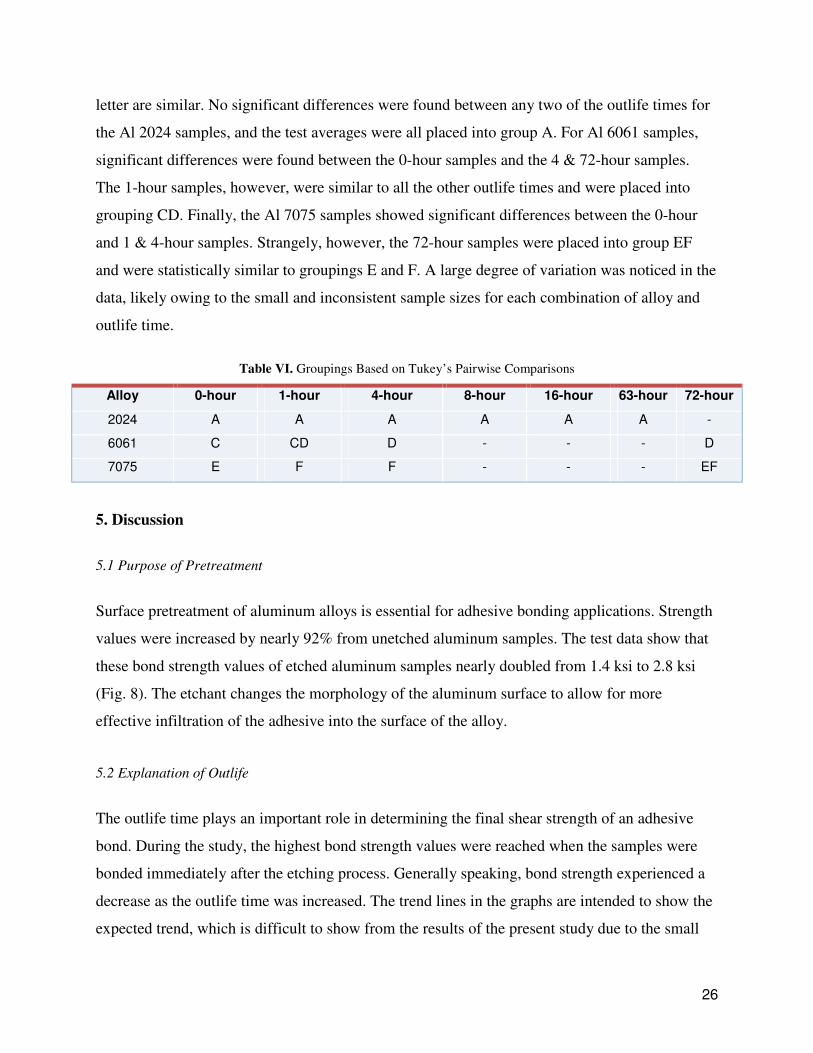
letter are similar. No significant differences were found between any two of the outlife times for
the Al 2024 samples, and the test averages were all placed into group A. For Al 6061 samples,
significant differences were found between the 0-hour samples and the 4 & 72-hour samples.
The 1-hour samples, however, were similar to all the other outlife times and were placed into
grouping CD. Finally, the Al 7075 samples showed significant differences between the 0-hour
and 1 & 4-hour samples. Strangely, however, the 72-hour samples were placed into group EF
and were statistically similar to groupings E and F. A large degree of variation was noticed in the
data, likely owing to the small and inconsistent sample sizes for each combination of alloy and
outlife time.
Table VI. Groupings Based on Tukey’s Pairwise Comparisons
Alloy 0-hour 1-hour 4-hour 8-hour 16-hour 63-hour 72-hour
2024 A A A A A A -
6061 C CD D - - - D
7075 E F F - - - EF
5. Discussion
5.1 Purpose of Pretreatment
Surface pretreatment of aluminum alloys is essential for adhesive bonding applications. Strength
values were increased by nearly 92% from unetched aluminum samples. The test data show that
these bond strength values of etched aluminum samples nearly doubled from 1.4 ksi to 2.8 ksi
(Fig. 8). The etchant changes the morphology of the aluminum surface to allow for more
effective infiltration of the adhesive into the surface of the alloy.
5.2 Explanation of Outlife
The outlife time plays an important role in determining the final shear strength of an adhesive
bond. During the study, the highest bond strength values were reached when the samples were
bonded immediately after the etching process. Generally speaking, bond strength experienced a
decrease as the outlife time was increased. The trend lines in the graphs are intended to show the
expected trend, which is difficult to show from the results of the present study due to the small
27
number of data points. After the first hour of outlife, strength values saw a steady decreasing
trend resulting in a plateau of strengths that ranged 15%-21% lower than that of the initial bond
strength. The plateau effect could be due to the concentration of contaminants that interfere with
adhesive infiltration and adhesion to the bonding surface reaching a point of equilibrium within
or after the first hour of outlife. This would lead to a relatively constant bond strength once
equilibrium is reached. Further studies using SEM-EDS and/or atomic force microscopy (AFM)
would need to be conducted in order to characterize changes in the etched surfaces’ morphology
with increased outlife time and better explain this phenomenon.
It should be noted, however, that the values obtained from the present study are much lower than
those reported in the literature. This is likely due to the lack of temperature and humidity
controls in the sample preparation environment, which may have affected the rate at which
moisture from the air adsorbed to the activated aluminum surface. Since this study did not
include any method of monitoring the particulate and moisture content of the air in the
preparation environment, it is difficult to draw any specific conclusions that may explain the
observed behavior. On the other hand, however, strict monitoring of the preparation environment
may prove impractical in an industrial setting and so it is possible that the results may be
generally applicable or at least informative for large-scale adhesive bonding operations. It should
be emphasized here that the highest bond strength was gained from bonding the treated alloy
with little to no outlife, and that the outlife case should ideally be avoided altogether in practice.
5.3 Clarification of Statistical Analysis
The results of the statistical analysis indicate that there was a large degree of variability in the
obtained experimental data, making it difficult to draw well-evidenced conclusions regarding the
effect of outlife on bond strength. However, the analysis was inconclusive only for the Al 2024
samples. This may be explained by the fact that these were the first samples that were prepared
during the study, and that large improvements in preparation technique may have occurred.
Considering the relatively small sample sizes for this study and lack of randomization, this could
easily have introduced the large degree of variation that was observed. Despite this, the test
averages for the remaining two alloys seem to indicate that approximately the first hour of outlife
time can have a significant effect upon the final shear strength of the adhesive bond.
28
6. Conclusion
Three aluminum alloys were tested ( 2024, 6061, and 7075) using two different etchants, FPL
and P2, to determine the effect of outlife on bond strength. Over 200 coupons and 100 samples
were prepared and tested for the investigation. FPL had an average initial bond strength of 2.72
ksi and P2 had an average initial bond strength of 2.77 ksi. Both paste etching processes led to
large increases in bond strength of approximately 92% from the non-etched sample with bond
strength of 1.4 ksi, demonstrating that the P2 etchant tested in this study is comparable in effect
to the currently-used FPL paste. When etched with P2, 2024 had an initial bond strength of 2.8
ksi and plateaued at 2.3 ksi, 6061 had an initial bond strength of 3.1ksi and plateaued at 2.2 ksi,
and 7075 had an initial bond strength of 3.8 ksi and plateaued at 2.8 ksi. These results showed
that bond strength generally decreased with increasing outlife time across all tested alloys. It is
recommended that the P2 paste be used with minimal outlife time to achieve the highest possible
bond strengths.
7. Acknowledgments
The authors would like to thank the individuals who made this project possible. Many thanks to
Professor Katherine C. Chen for advice regarding Materials Engineering department resources,
and for assistance in reviewing test data, SOPs and project documents. Special thanks go to
Steven A. Tunick for extensive assistance in defining project goals, developing experimental
procedures & SOPs, supplying etchants and equipment, and for in-person assistance with
troubleshooting preparation procedures and analyzing data. Additional thanks to Professor John
Walker for assistance with using MINITAB to determine statistical significance, Ladd Cain for
advice regarding coupon preparation; and Thomas Featherstone for assistance in preparing SOPs
and for providing waste containers required for safe lab work.
8. References
1. Higgins, A. "Adhesive Bonding of Aircraft Structures." International Journal of Adhesion and
Adhesives 20 (2000): 367-76. Science Direct. Web. 25 Mar. 2015.
29
2. "Surface Preparation Techniques for Adhesive Bonding", Second Edition, Wegman and Van
Twisk, 2013 Chapter 2
3. Prolongo, S.G., and A. Ureña. "Effect of Surface Pre-treatment on the Adhesive Strength of
Epoxy-aluminum Joints." International Journal of Adhesion and Adhesives 29 (2008): 23-31.
Science Direct. Web. 20 Mar. 2015.
4. ASTM D2651-01(2008), Standard Guide for Preparation of Metal Surfaces for Adhesive
Bonding, ASTM International, West Conshohocken, PA, 2008, www.astm.org
5. Liang, W.J., P.A. Rometsch, L.F. Cao, and N. Birbilis. "General Aspects Related to the
Corrosion of 6xxx Series Aluminium Alloys: Exploring the Influence of Mg/Si Ratio and Cu."
Corrosion Science 76 (2013): 119-28. Science Direct. Web. 27 Mar. 20.15
6. Abreu, C.M., M.J. Cristóbal, R. Figueroa, and G. Pena. "Wear and Corrosion Performance of
Two Different Tempers (T6 and T73) of AA7075 Aluminium Alloy after Nitrogen
Implantation." Applied Surface Science 327 (2014): 51-61. Science Direct. Web. 26 Mar. 2015.
7. "Properties of Wrought Aluminum Alloys." ASM Desk Editions: Metals Handbook, (1998):.
8. Dey, Swapna, Manoj K. Gunjan, and Indranil Chattoraj. "Effect of Temper on the Distribution
of Pits in AA7075 Alloys." Corrosion Science 50 (2008): 2895-901. Science Direct. Web. 27
Mar. 2015.
9. Henkel Loctite Hysol EA 9394 AERO Epoxy Adhesive Gray 50 mL Sempak - See more at:
https://www.ellsworth.com/products/adhesives/epoxy/henkel-loctite-hysol-ea-9394-epoxy-
adhesive-gray-50-ml-sempak/#sthash.J9evYNZl.dpuf
10. Withy, B, M Hyland, and B James. "Pretreatment Effects on the Surface Chemistry and
Morphology of Aluminium." International Journal of Modern Physics B, 20.25n27 (2006): 3611-
3616.
11. Lunder, O, B Olsen, and K Nisancioglu. "Pre-treatment of AA6060 Aluminum Alloy for
Adhesive Bonding." International Journal of Adhesion and Adhesives, 22.2 (2002): 143-150
12.ASTM D1002, 2010. “Standard Test Method for Apparent Shear Strength of Single-Lap-Joint
Adhesively Bonded Metal Specimens by Tensile Loading”, ASTM International, West
Conshohocken,PA, 2010.

30
Appendix A: Glossary of Terms
Adhesive - Glue-like material used to bond the samples together. EA 9394 two-part adhesive by
Loctite was used for this experiment.
Bond Strength - Term used to describe the shear strength value of the adhesive bond holding the
two aluminum coupons together.
Coupon - Term used to describe one aluminum sample cut into a 1” by 5” rectangular shape to
comply with ASTM D1002 standards.
De-bonding - The failure mechanism of lap shear where the adhesive did not completely
infiltrate the samples surface, resulting in an uneven distribution of adhesive bond on the
samples. This ultimately contributes to low bond strengths.
Etchant - Paste formula used to change the morphology of the aluminum surface for increased
bond strength.
Lap-Shear Sample - Term used to describe two coupons adhesively bonded together for lap-
shear testing.
Lap-Shear - Determines the shear strength for an adhesive when bonding two materials together.
Outlife - The amount of time delay that occurs after etching the aluminum coupons, but before
bonding the two coupons together.
Overlap - Term used to describe the length of the bonded aluminum coupons that formed one lap
shear sample
Peeling - The failure mechanism where the adhesive does completely infiltrate the surface and
the adhesive behaves at its intended maximum strength. This results in the yielding of the
aluminum alloy and failure occurs by peeling of the two samples.
Water-break free - Term used to describe the surface behavior that must be exhibited by the
aluminum in order to facilitate etching. The surface is free of water beading upon the surface.
31
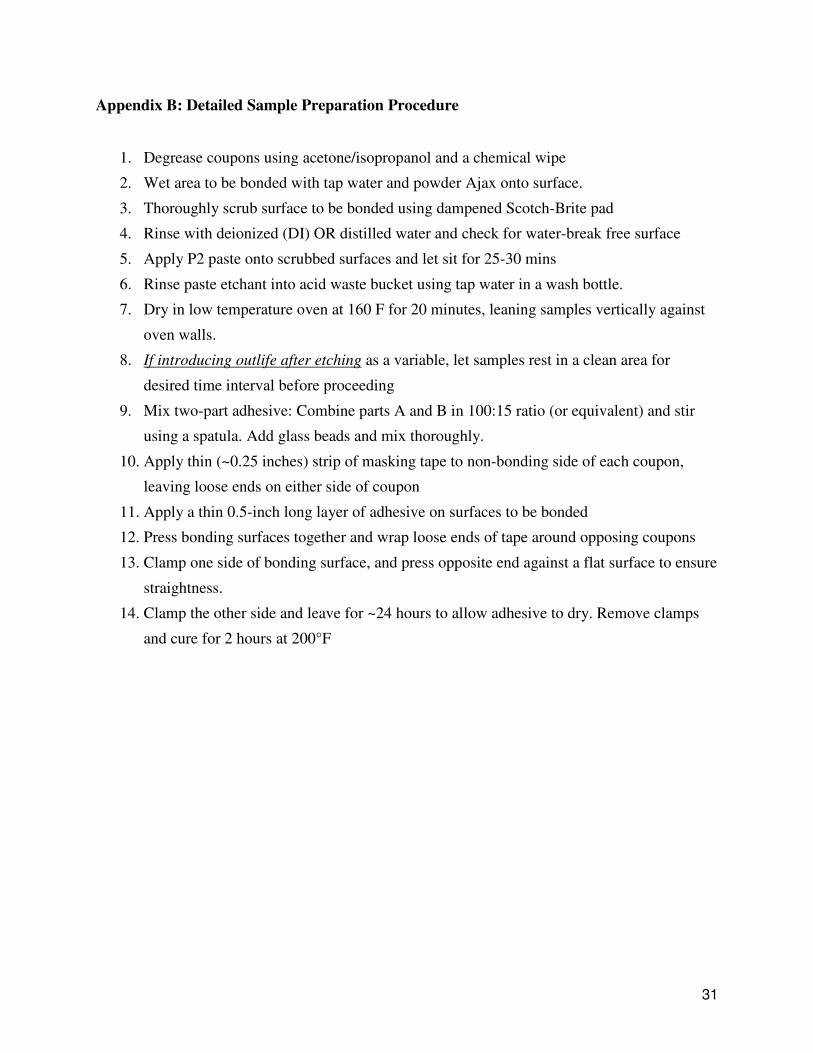
Appendix B: Detailed Sample Preparation Procedure
1. Degrease coupons using acetone/isopropanol and a chemical wipe
2. Wet area to be bonded with tap water and powder Ajax onto surface.
3. Thoroughly scrub surface to be bonded using dampened Scotch-Brite pad
4. Rinse with deionized (DI) OR distilled water and check for water-break free surface
5. Apply P2 paste onto scrubbed surfaces and let sit for 25-30 mins
6. Rinse paste etchant into acid waste bucket using tap water in a wash bottle.
7. Dry in low temperature oven at 160 F for 20 minutes, leaning samples vertically against
oven walls.
8. If introducing outlife after etching as a variable, let samples rest in a clean area for
desired time interval before proceeding
9. Mix two-part adhesive: Combine parts A and B in 100:15 ratio (or equivalent) and stir
using a spatula. Add glass beads and mix thoroughly.
10. Apply thin (~0.25 inches) strip of masking tape to non-bonding side of each coupon,
leaving loose ends on either side of coupon
11. Apply a thin 0.5-inch long layer of adhesive on surfaces to be bonded
12. Press bonding surfaces together and wrap loose ends of tape around opposing coupons
13. Clamp one side of bonding surface, and press opposite end against a flat surface to ensure
straightness.
14. Clamp the other side and leave for ~24 hours to allow adhesive to dry. Remove clamps
and cure for 2 hours at 200°F
32
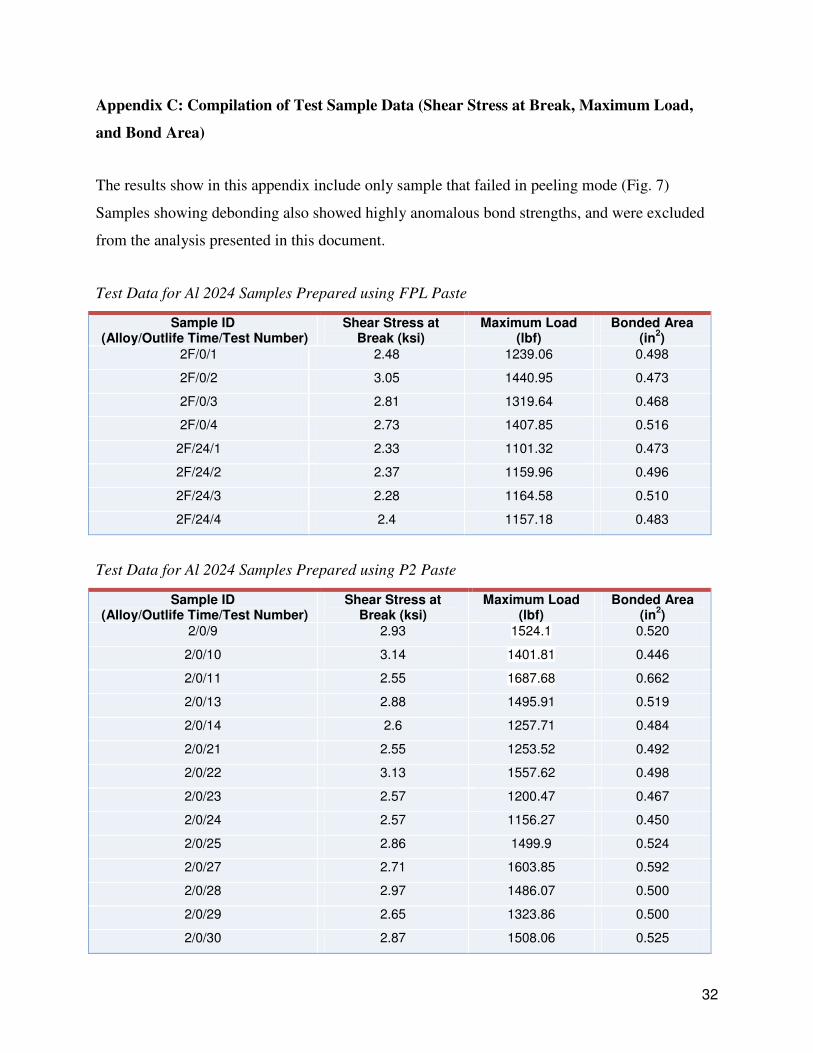
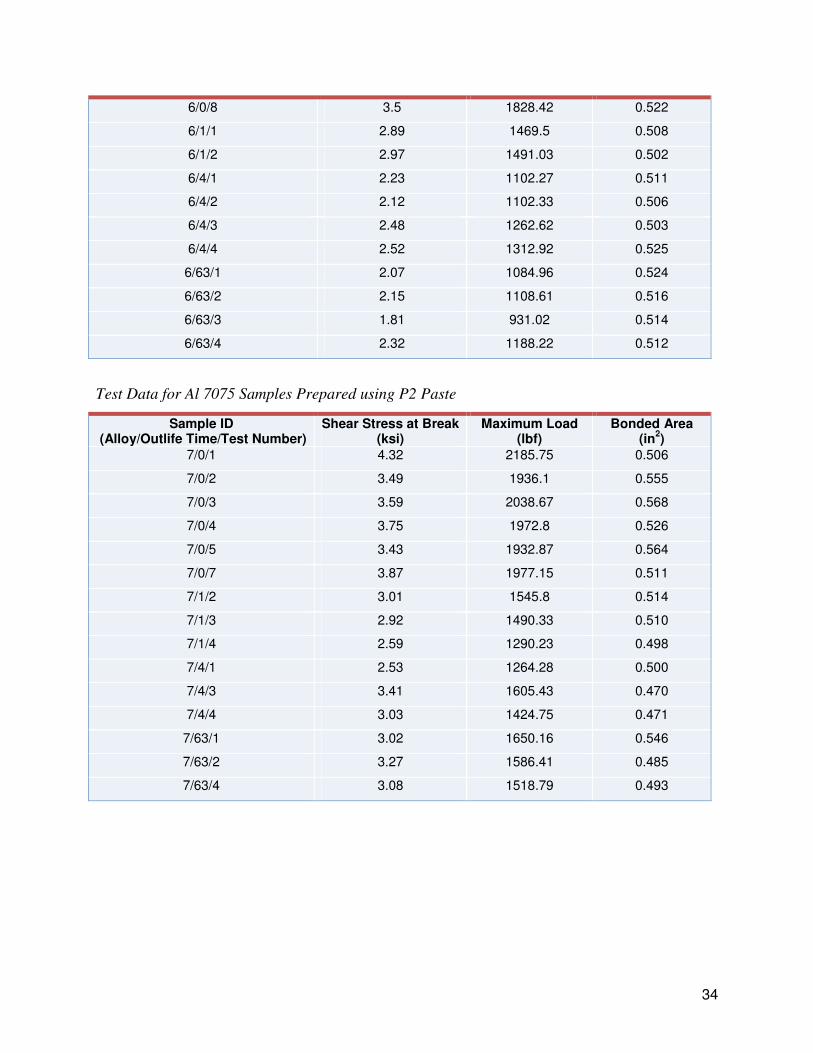
Appendix C: Compilation of Test Sample Data (Shear Stress at Break, Maximum Load,
and Bond Area)
The results show in this appendix include only sample that failed in peeling mode (Fig. 7)
Samples showing debonding also showed highly anomalous bond strengths, and were excluded
from the analysis presented in this document.
Test Data for Al 2024 Samples Prepared using FPL Paste
Sample ID
(Alloy/Outlife Time/Test Number) Shear Stress at
Break (ksi) Maximum Load
(lbf) Bonded Area
(in2)
2F/0/1 2.48 1239.06 0.498
2F/0/2 3.05 1440.95 0.473
2F/0/3 2.81 1319.64 0.468
2F/0/4 2.73 1407.85 0.516
2F/24/1 2.33 1101.32 0.473
2F/24/2 2.37 1159.96 0.496
2F/24/3 2.28 1164.58 0.510
2F/24/4 2.4 1157.18 0.483
Test Data for Al 2024 Samples Prepared using P2 Paste
Sample ID
(Alloy/Outlife Time/Test Number) Shear Stress at
Break (ksi) Maximum Load
(lbf) Bonded Area
(in2)
2/0/9 2.93 1524.1 0.520
2/0/10 3.14 1401.81 0.446
2/0/11 2.55 1687.68 0.662
2/0/13 2.88 1495.91 0.519
2/0/14 2.6 1257.71 0.484
2/0/21 2.55 1253.52 0.492
2/0/22 3.13 1557.62 0.498
2/0/23 2.57 1200.47 0.467
2/0/24 2.57 1156.27 0.450
2/0/25 2.86 1499.9 0.524
2/0/27 2.71 1603.85 0.592
2/0/28 2.97 1486.07 0.500
2/0/29 2.65 1323.86 0.500
2/0/30 2.87 1508.06 0.525
33
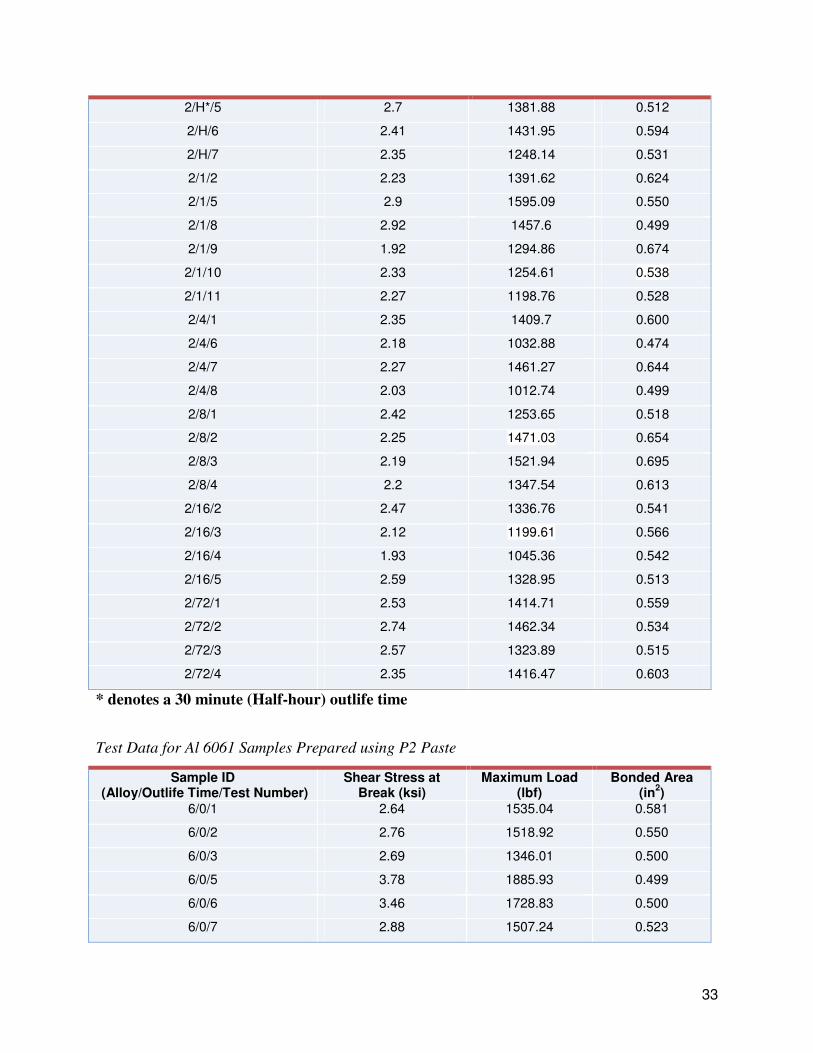
2/H*/5 2.7 1381.88 0.512
2/H/6 2.41 1431.95 0.594
2/H/7 2.35 1248.14 0.531
2/1/2 2.23 1391.62 0.624
2/1/5 2.9 1595.09 0.550
2/1/8 2.92 1457.6 0.499
2/1/9 1.92 1294.86 0.674
2/1/10 2.33 1254.61 0.538
2/1/11 2.27 1198.76 0.528
2/4/1 2.35 1409.7 0.600
2/4/6 2.18 1032.88 0.474
2/4/7 2.27 1461.27 0.644
2/4/8 2.03 1012.74 0.499
2/8/1 2.42 1253.65 0.518
2/8/2 2.25 1471.03 0.654
2/8/3 2.19 1521.94 0.695
2/8/4 2.2 1347.54 0.613
2/16/2 2.47 1336.76 0.541
2/16/3 2.12 1199.61 0.566
2/16/4 1.93 1045.36 0.542
2/16/5 2.59 1328.95 0.513
2/72/1 2.53 1414.71 0.559
2/72/2 2.74 1462.34 0.534
2/72/3 2.57 1323.89 0.515
2/72/4 2.35 1416.47 0.603
* denotes a 30 minute (Half-hour) outlife time
Test Data for Al 6061 Samples Prepared using P2 Paste
Sample ID
(Alloy/Outlife Time/Test Number) Shear Stress at
Break (ksi) Maximum Load
(lbf) Bonded Area
(in2)
6/0/1 2.64 1535.04 0.581
6/0/2 2.76 1518.92 0.550
6/0/3 2.69 1346.01 0.500
6/0/5 3.78 1885.93 0.499
6/0/6 3.46 1728.83 0.500
6/0/7 2.88 1507.24 0.523
34
6/0/8 3.5 1828.42 0.522
6/1/1 2.89 1469.5 0.508
6/1/2 2.97 1491.03 0.502
6/4/1 2.23 1102.27 0.511
6/4/2 2.12 1102.33 0.506
6/4/3 2.48 1262.62 0.503
6/4/4 2.52 1312.92 0.525
6/63/1 2.07 1084.96 0.524
6/63/2 2.15 1108.61 0.516
6/63/3 1.81 931.02 0.514
6/63/4 2.32 1188.22 0.512
Test Data for Al 7075 Samples Prepared using P2 Paste
Sample ID
(Alloy/Outlife Time/Test Number) Shear Stress at Break
(ksi) Maximum Load
(lbf) Bonded Area
(in2)
7/0/1 4.32 2185.75 0.506
7/0/2 3.49 1936.1 0.555
7/0/3 3.59 2038.67 0.568
7/0/4 3.75 1972.8 0.526
7/0/5 3.43 1932.87 0.564
7/0/7 3.87 1977.15 0.511
7/1/2 3.01 1545.8 0.514
7/1/3 2.92 1490.33 0.510
7/1/4 2.59 1290.23 0.498
7/4/1 2.53 1264.28 0.500
7/4/3 3.41 1605.43 0.470
7/4/4 3.03 1424.75 0.471
7/63/1 3.02 1650.16 0.546
7/63/2 3.27 1586.41 0.485
7/63/4 3.08 1518.79 0.493