Effect of thermal disorder on high figure of merit in PbTekaviany/researchtopics/Hych… · ·...
10
PHYSICAL REVIEW B 86, 045213 (2012) Effect of thermal disorder on high figure of merit in PbTe Hyoungchul Kim and Massoud Kaviany * Department of Mechanical Engineering, University of Michigan, Ann Arbor, Michigan 48109, USA (Received 20 November 2011; revised manuscript received 25 May 2012; published 23 July 2012) With ab initio molecular dynamics we observe thermal disorder and find band convergence with increased temperature and close relation between thermal disorder and thermoelectric (TE) properties of p-doped PbTe. Lack of short-range order causes local overlap of valence orbitals and increase in density-of-states near the Fermi level. Effective mass becomes temperature-dependent peaking in the converged-band regime. With classical molecular dynamics (MD) and the Green-Kubo autocorrelation decay we find reduction in lattice thermal conductivity (suppression of short- and long-range acoustic phonon transports). The described thermal-disorder roles lead to high TE figure-of-merit (ZT ), and good agreement with the experimental results. DOI: 10.1103/PhysRevB.86.045213 PACS number(s): 72.20.Pa, 63.20.Ry, 71.20.Nr I. INTRODUCTION Thermoelectricity allows for direct conversion of heat into electrical power with significant potential for power generation. The conversion efficiency is related to TE figure- of-merit, ZT = S 2 σ e T κ e + κ L , (1) where T , S , σ e , κ e , and κ L are temperature, the Seebeck coefficient, electrical conductivity, and electronic and lattice thermal conductivities. Lead telluride (PbTe), a chalcogenide with simple rocksalt structure (space group Fm ¯ 3m, see Fig. 1), is a well-known mid-temperature TE material for power generation. 1–3 Its recent studies as a high-ZT material has shown (i) resonant-state enhancement of the Seebeck effect, 4,5 (ii) reduced thermal conductivity using embedded nanostructures, 6–8 and (iii) band convergence by dopant tuning. 3,9 In addition, there have been experimental and theo- retical studies of its anharmonic lattice dynamics (ferroelectric instability), 10–12 however, this has not been related to its electronic band convergence and TE properties. In this paper we examine the thermal-disorder-caused PbTe electronic band convergence using first-principles calculations [including ab initio molecular dynamics (AIMD)] and investigate the roles of disorder and convergence in the charge- and phonon-related TE properties. PbTe has octahedral coordination (rocksalt structure, see Fig. 1) and its lattice dynamics manifests a high de- gree of anharmonicity. 1,10,12,13 This reduces the phonon conductivity. 11,13 In the thermal-disordered structure of Pb compounds, the Pb atoms are moved further off-centered compared to the chalcogen atoms, with the following trend among dislocation of compounds: PbS < PbSe < PbTe. Based on these, the origin of low-thermal conductivity of PbTe has been explained. 11–13 The abnormal temperature-dependent band gap energy (i.e., increase with increase in temperature) has also been explained by lattice dynamics using the Debye- Waller factor calculations (larger Pb displacements compared to Te). 14 In comparison, studies of band convergence in PbTe are very limited. Although the existence of a second valence band edge was first proposed by Allgaier 15 based on the temperature dependence of the Hall effect, no exact physical explanation or direct evidence of the band convergence of PbTe has yet been reported. 16 However, recent studies of band convergence and its analytic model have pointed to improved TE properties in PbTe. 6,9 A three-band model accounts for the nonparabolicity and anisotropy of the conduction band and the valence band at L 111 points using the Kane model, while using the parabolic and isotropic behavior for the secondary valence band along the 110 direction. 9,17–20 II. CALCULATIONS OF TE TRANSPORT PROPERTIES A. Thermal-disordered structures from AIMD We investigate the high-temperature behavior of PbTe structure by obtaining the thermal-disordered structure of PbTe using AIMD with the Vienna ab initio simulation package, 21 that is, we find with increase in temperature anharmonic lattice vibration distort crystal symmetry and in turn the electrons respond to the displaced ionic positions. Using the Born-Oppenheimer approximation, the atomic positions and velocities are updated with the Verlet algorithm. The forces on ions at each configuration are used to update the ionic positions at an elapsed time step and we iterate to calculate the trajectory of the system. The AIMD simulations are performed on supercells consisting of 54 atoms (3 × 3 × 3 primitive cells) and 64 atoms (2 × 2 × 2 conventional cells) along with the projector augmented wave-based density functional theory (DFT) (also used for the static calculations). 22 Con- sidering thermal expansion with temperature changes, we prepare the PbTe supercells with experimental results for ther- mally expanded lattice parameter a(T ) = 6.422 + (0.9546 × 10 −4 )T + (2.615 × 10 −8 )T 2 for 293 to 973 K. 23 The proper cell volume at each temperature is locked during AIMD calculations. The Brillouin zone (BZ) is sampled at only the point. We carry out constant-temperature simulations using a Nos´ e thermostat for 6 ps (0.2 fs time steps). After reaching equilibrium using a NVT ensemble, another calculation is performed for 11 ps (1 fs time steps), and we find good energy convergence and temperature stability. During AIMD calculations, the Fermi-Dirac smearing factor (k B T , where k B is the Boltzmann constant) for each temperature was also applied to ensure reliable thermal-disordered atomic coordi- nates. Finally, all temperature-dependent atomic coordinates are obtained from AIMD snapshots at each temperature. 045213-1 1098-0121/2012/86(4)/045213(10) ©2012 American Physical Society
Transcript of Effect of thermal disorder on high figure of merit in PbTekaviany/researchtopics/Hych… · ·...
PHYSICAL REVIEW B 86, 045213 (2012)
Effect of thermal disorder on high figure of merit in PbTe
Hyoungchul Kim and Massoud Kaviany*
Department of Mechanical Engineering, University of Michigan, Ann Arbor, Michigan 48109, USA(Received 20 November 2011; revised manuscript received 25 May 2012; published 23 July 2012)
With ab initio molecular dynamics we observe thermal disorder and find band convergence with increasedtemperature and close relation between thermal disorder and thermoelectric (TE) properties of p-doped PbTe.Lack of short-range order causes local overlap of valence orbitals and increase in density-of-states near the Fermilevel. Effective mass becomes temperature-dependent peaking in the converged-band regime. With classicalmolecular dynamics (MD) and the Green-Kubo autocorrelation decay we find reduction in lattice thermalconductivity (suppression of short- and long-range acoustic phonon transports). The described thermal-disorderroles lead to high TE figure-of-merit (ZT ), and good agreement with the experimental results.
DOI: 10.1103/PhysRevB.86.045213 PACS number(s): 72.20.Pa, 63.20.Ry, 71.20.Nr
I. INTRODUCTION
Thermoelectricity allows for direct conversion of heatinto electrical power with significant potential for powergeneration. The conversion efficiency is related to TE figure-of-merit,
ZT = S2σeT
κe + κL
, (1)
where T , S, σe, κe, and κL are temperature, the Seebeckcoefficient, electrical conductivity, and electronic and latticethermal conductivities. Lead telluride (PbTe), a chalcogenidewith simple rocksalt structure (space group Fm3m, seeFig. 1), is a well-known mid-temperature TE material forpower generation.1–3 Its recent studies as a high-ZT materialhas shown (i) resonant-state enhancement of the Seebeckeffect,4,5 (ii) reduced thermal conductivity using embeddednanostructures,6–8 and (iii) band convergence by dopanttuning.3,9 In addition, there have been experimental and theo-retical studies of its anharmonic lattice dynamics (ferroelectricinstability),10–12 however, this has not been related to itselectronic band convergence and TE properties. In this paperwe examine the thermal-disorder-caused PbTe electronic bandconvergence using first-principles calculations [including abinitio molecular dynamics (AIMD)] and investigate the rolesof disorder and convergence in the charge- and phonon-relatedTE properties.
PbTe has octahedral coordination (rocksalt structure, seeFig. 1) and its lattice dynamics manifests a high de-gree of anharmonicity.1,10,12,13 This reduces the phononconductivity.11,13 In the thermal-disordered structure of Pbcompounds, the Pb atoms are moved further off-centeredcompared to the chalcogen atoms, with the following trendamong dislocation of compounds: PbS < PbSe < PbTe. Basedon these, the origin of low-thermal conductivity of PbTehas been explained.11–13 The abnormal temperature-dependentband gap energy (i.e., increase with increase in temperature)has also been explained by lattice dynamics using the Debye-Waller factor calculations (larger Pb displacements comparedto Te).14 In comparison, studies of band convergence in PbTeare very limited. Although the existence of a second valenceband edge was first proposed by Allgaier15 based on thetemperature dependence of the Hall effect, no exact physicalexplanation or direct evidence of the band convergence of
PbTe has yet been reported.16 However, recent studies of bandconvergence and its analytic model have pointed to improvedTE properties in PbTe.6,9 A three-band model accounts for thenonparabolicity and anisotropy of the conduction band and thevalence band at L 〈111〉 points using the Kane model, whileusing the parabolic and isotropic behavior for the secondaryvalence band along the � 〈110〉 direction.9,17–20
II. CALCULATIONS OF TE TRANSPORT PROPERTIES
A. Thermal-disordered structures from AIMD
We investigate the high-temperature behavior of PbTestructure by obtaining the thermal-disordered structure of PbTeusing AIMD with the Vienna ab initio simulation package,21
that is, we find with increase in temperature anharmoniclattice vibration distort crystal symmetry and in turn theelectrons respond to the displaced ionic positions. Using theBorn-Oppenheimer approximation, the atomic positions andvelocities are updated with the Verlet algorithm. The forceson ions at each configuration are used to update the ionicpositions at an elapsed time step and we iterate to calculate thetrajectory of the system. The AIMD simulations are performedon supercells consisting of 54 atoms (3 × 3 × 3 primitivecells) and 64 atoms (2 × 2 × 2 conventional cells) alongwith the projector augmented wave-based density functionaltheory (DFT) (also used for the static calculations).22 Con-sidering thermal expansion with temperature changes, weprepare the PbTe supercells with experimental results for ther-mally expanded lattice parameter a(T ) = 6.422 + (0.9546 ×10⁻⁴)T + (2.615 × 10⁻⁸)T 2 for 293 to 973 K.23 The propercell volume at each temperature is locked during AIMDcalculations. The Brillouin zone (BZ) is sampled at only the� point. We carry out constant-temperature simulations usinga Nose thermostat for 6 ps (0.2 fs time steps). After reachingequilibrium using a NV T ensemble, another calculation isperformed for 11 ps (1 fs time steps), and we find goodenergy convergence and temperature stability. During AIMDcalculations, the Fermi-Dirac smearing factor (kBT , wherekB is the Boltzmann constant) for each temperature was alsoapplied to ensure reliable thermal-disordered atomic coordi-nates. Finally, all temperature-dependent atomic coordinatesare obtained from AIMD snapshots at each temperature.
045213-11098-0121/2012/86(4)/045213(10) ©2012 American Physical Society

HYOUNGCHUL KIM AND MASSOUD KAVIANY PHYSICAL REVIEW B 86, 045213 (2012)
PbTe
(a) (b)
L
XWK
∑Γ
FIG. 1. (Color online) (a) Conventional cell of PbTe showingsimple cubic structure. (b) The first Brillouin zone for the primitivecell of PbTe and its high-symmetry k points.
To verify that the snapshots represent stable structures andmotion, we addressed the statistical uncertainty. As notedabove, the two step approach is used to find a stable snapshot.As shown in Fig. 2 we find our second-step simulationsare fully relaxed and it provides energy-converged structureswith low-statistical uncertainty. Every snapshot is an averageof 64 displaced coordinates of PbTe and is used in thecalculations of the transport properties. (The error bars of theatomic displacement of each atom will be shown in Fig. 4,which indicate the statistical uncertainty.) These verificationprocesses are used to ensure shots are indeed representative.
B. Electronic structures and transport properties
Our electronic calculations employ the full-potential lin-earized augmented plane-wave method24 as implemented inthe WIEN2k code.25 We calculate all TE transport prop-erties of thermal-disordered p-type PbTe using WIEN2kand BoltzTraP26 codes, and a MD code written for thisproblem. All PbTe transport properties are calculated fromthe common DFT band energies (0 K). However, those DFTband energies obtained from thermally disordered structure(AIMD snapshots at each temperature) and the Fermi-Diracsmearing factors were also used in the transport-propertycalculations. We expect/show these two temperature effects
0
2
4
6
2 3 4 5 6 7 80.0
1.0
2.0
3.0
g(r)
r (Å)
0.05 0.06 0.07
0.08 0.09 0.10
0 to 11(2nd step)
1st Step
2nd Step
g(r )
(a)
(b)
t (ps) t (ps)
10.00 10.01 10.02
10.03 10.04 10.05
0 to 11(2nd step)
t (ps) t (ps)
FIG. 2. (Color online) Time-dependent evolution of radial distri-bution functions g(r) of PbTe supercell at T = 700 K. Each snapshotis an average of 64 displaced coordinates obtained from (a) initialand (b) a well-converged AIMD step. Average g(r) of all snapshots(second step, 0 to 11 ps) are also shown.
(atomic configurations and smearing) are sufficient to illustratethe abnormal changes of PbTe properties with temperature.The muffin-tin radii are chosen to be 2.5 a.u. for all atoms. Theplane-wave cutoff Rkmax = 7.0 suffices for good convergence.Due to the large atomic masses (Pb and Te), spin-orbitinteraction is included for the relativistic effects. Convergenceof the self-consistent calculation cycle is performed using 2769(for frozen structure) and 36 (for high-temperature structure) k
points inside the reduced BZ to within 0.0001 Ry with a cutoffof −6.0 Ry between the valence and the core states. Since TEtransport properties are sensitive to band structures near theFermi surface, we use the Engel-Vosko generalized gradientapproximation to avoid the underestimation of band gapenergy (a well-known problem with DFT calculations).27 Thespin-orbit interaction is also included for the relativistic effects.In the transport calculations the original k mesh is interpolatedonto a mesh five times as dense and the eigenenergies are foundwith BoltzTraP code. Within the Boltzmann transport theorythe temperature- and doping-level-dependent conductivityσe(T ,μe) and the Seebeck coefficient S(T ,μe) are given by
σe,αβ (T ,μe) = 1
V
∫σe,αβ (Ee)
[− ∂f ◦
e (T ,Ee)
∂Ee
]dEe, (2)
Sαβ =∑
γ
(σ−1
e
)αγ
νe,βγ , (3)
with
νe,αβ (T ,μe) = 1
eT V
∫σe,αβ (Ee)(Ee − μe)
×[
− ∂f ◦e (T ,Ee)
∂Ee
]dEe, (4)
where Ee is band energy, f ◦e is the Fermi-Dirac equilibrium
distribution, μe is the chemical potential, and V is the volume.The energy projected conductivity tensor is
σe,αβ (Ee) = 1
N
∑i,k
e2τe,i,kve,α(i,k)ve,β(i,k)δ(Ee − Ee,i,k)
dEe
,
(5)
where i is the band index, k is the wave vector, N is anormalization depending on the number of k points sampled inthe BZ, τi,k is a relaxation time, and ve,α(i,k) is the i componentof band velocity ∇kEe(k).
C. Classical MD and lattice conductivity calculations
Previous lattice thermal conductivity results of PbTe usingclassical MD28,29 are limited and require special attention dueto the strong anharmonic coupling effects.11 Using atomicsubstitutions28 and various vacancy configurations,29 reducedlattice thermal conductivity of PbTe has been predicted usingclassical MD. In order to consider the anharmonic behaviors ofPbTe structures, we use the thermal-disordered configurations(from AIMD) and the potential models appropriate for thecovalent and rigid-ionic bonds. For these bonds we usethe Morse and the three-cosine interatomic potentials witheffective ionic charges,12 parametrized for two-body (Pb-Te
045213-2

EFFECT OF THERMAL DISORDER ON HIGH FIGURE OF . . . PHYSICAL REVIEW B 86, 045213 (2012)
TABLE I. The Morse and the three cosine interatomic potentialparameters for PbTe. The effective atomic charges of Pb and Te are0.72 and −0.72,12 respectively.
Two body ϕ◦ (eV) a (1/A) r◦ (A) Three body ϕθ (eV) θ◦ (deg)
Pb-Te 0.465 0.863 3.68 Te-Pb-Te 0.680 90.0Te-Te 0.394 1.51 4.22
and Te-Te) and three-body (Te-Pb-Te) interactions, that is,
ϕ(rij ) = ϕ◦({1 − exp[−a(rij − r◦)]}2 − 1), (6)
ϕ(θijk) = (1/2)ϕθ (cos θijk − cos θ◦)2, (7)
where ϕ◦, rij , and θ are the dissociation energy, interatomicseparation distance, and bond angle. The parameters ϕ◦,rij , and θ are determined by fitting to both the ab initiocalculated total energy and the experimental elastic constants.Utilizing a multivariable fitting procedure in GULP (generalutility lattice program),30 we obtain the parameters listed inTable I. The fitted pair potential undergo GULP optimizationof the crystal structure under constant pressure. All relatedthermomechanical properties (e.g., elastic constants, bulkmodulus, shear modulus, the Gruneisen parameter, and thermalexpansion coefficient) are listed in Table II and compared withthe reported experiments with good agreements.
The lattice thermal conductivity tensor κL is determinedusing the equilibrium MD results and the Green-Kubo heatcurrent autocorrelation function (HCACF) decay,36–38 that is,
κL = 1
kBT 2V
∫ ∞
0〈q(t)q(0)〉dt, (8)
where t is time and 〈q(t)q(0)〉 is the HCACF tensor. q is
q = d
dt
∑i
Ei r i =∑
i
Eiui + 1
2
∑i,j
(Fij · ui)r ij , (9)
where Ei , r i , and ui are the energy, position, and velocityvectors of particle i, and r ij and Fij are the interparticleseparation and force vectors between particle i and j . Afterchecking the size effect of MD, average are found over all threedirections for a system consisting of 8 × 8 × 8 conventionalunit cells (4096 atoms). The Verlet leapfrog algorithm with theNose-Hoover thermostat and the Berendsen barostat are usedin NpT ensemble for 200 ps and then in NV E for 100 ps toreach the equilibrium. Then 3000 ps raw data are obtained forthe calculation of q. The resultant HCACFs were then directly
0
2
4
6
8
0
2
4
6
8
g(r)
T (K) T (K) 300 400 500
600 700 800
g (r )
r (Å)
(a)
(b)
2 3 4 5 6 7 8 9
FIG. 3. (Color online) Calculated radial distribution functions ofPbTe supercell obtained from (a) AIMD and (b) classical MD.
integrated and the κL was set as the average value in the stableregime of the integral.
D. Analytic models for TE properties
The TE properties are obtained using the Onsager TEcoupling and the Boltzmann transport equation with energy-dependent relaxation time τe(Ee).3,7,17,20,39–41 The differentialelectrical conductivity σd,e,α(Ee) is42,43
σd,e,α(Ee) = e2τe(Ee)v2e,α(Ee)De,α(Ee)
(− ∂f ◦
e
∂Ee
), (10)
where τe is the relaxation time, ve,α is the group velocity, andDe,α is the electronic density-of-states. Here ve,α is given by
ve,α ={
2
mi,e,α
γα(Ee)
[dγα(Ee)
dEe
]−2}1/2
(11)
and De,α(Ee) is given by
De,α(Ee) = 21/2m3/2i,e,α
π2h3 γα(Ee)1/2
[dγα(Ee)
dEe
], (12)
where h is the reduced Planck constant, mi,e,α(T ) is thetemperature-dependent density-of-states effective mass at α
point, γL(Ee) = Ee(1 + Ee/�Ee,g,L) for the nonparabolicbands (i.e., conduction and L-point light-hole valence), whileγ�(Ee) = Ee for the parabolic �-point heavy-hole valenceband.19,20,39–41 Here �Ee,g,α is the band gap energy at α point.The carrier mobility depends on τe(Ee) and effective mass
TABLE II. Comparison of bulk mechanical properties found from the interatomic potentials with those from experiments. Cij , B, G, γG,and α are elastic constants, bulk modulus, shear modulus, Gruneisen parameter, and thermal expansion coefficient.
C11 (GPa) C12 (GPa) C44 (GPa) B (GPa) G (GPa) γG α (10−5/K)
Reference 31 128.1 4.4 15.1 – – – –Reference 32 105.3 7.0 13.2 39.8 21.4 – –Reference 33 108.0 7.7 13.4 41.1 – – –Reference 34 – – – – – 1.45 –Reference 35 – – – – – – 1.8This work 108.0 7.5 15.1 41.0 21.0 1.66 1.78
045213-3
HYOUNGCHUL KIM AND MASSOUD KAVIANY PHYSICAL REVIEW B 86, 045213 (2012)
300 400 500 600 700 8000.1
0.2
0.3
0.4
0.5
0.6PbTeTotal
Debye model, PbDebye model, TeReference [10]
T (K)
∆
Δ (Å
)
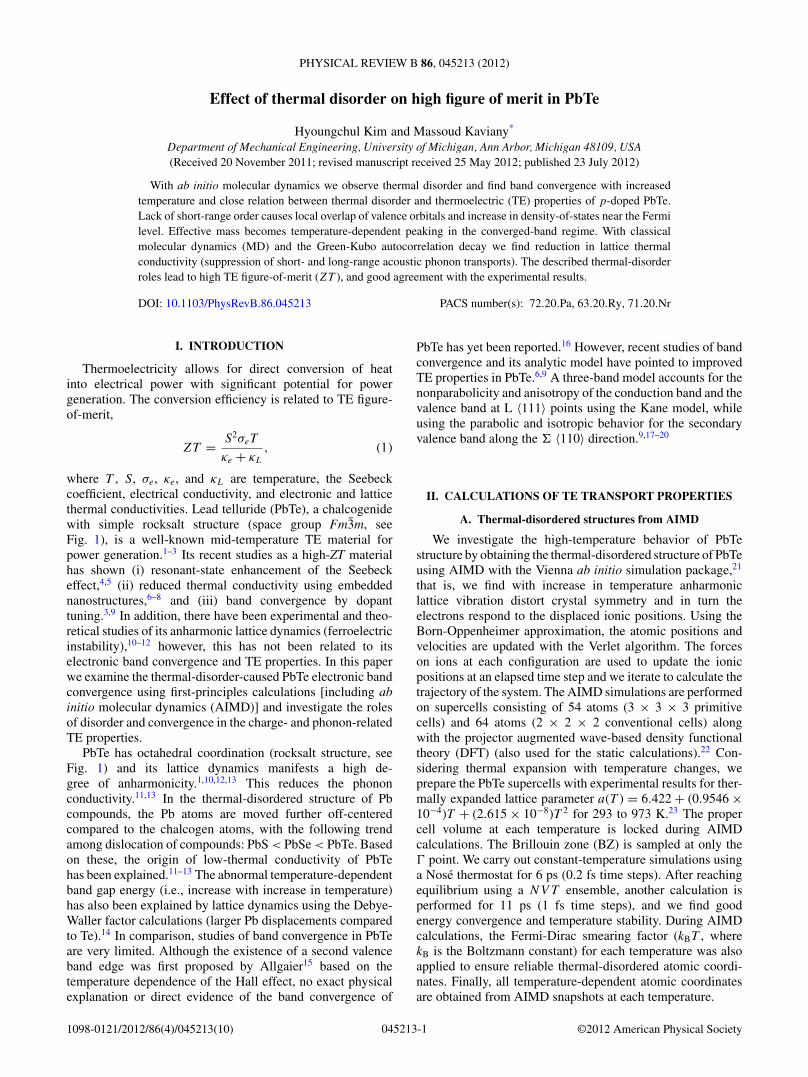
FIG. 4. (Color online) Variation of the rms atomic local off-centering in PbTe as a function of temperature. The Debye harmonicmodel prediction is also shown, with markers for differences withAIMD results. The inset image marks this rms displacement.
mi,e,α which are also temperature dependent. The τe(Ee) isphonon dominated (three mechanisms). The AIMD calculatedmi,e,α(T ) for all bands are used in Eqs. (11) and (12). Thecarrier concentration ni is
ni =∫ ∞
ECBM
De,C(Ee)f ◦e (Ee)dEe
−{ ∫ EVBM,L
−∞De,L(Ee)[1 − f ◦
e (Ee)]dEe
+∫ EVBM,�
−∞De,�(Ee)[1 − f ◦
e (Ee)]dEe
}. (13)
The electrical conductivity σe is
σe,α =∫ ∞
0σd,e,α(Ee)dEe and σe =
∑α
σe,α. (14)
The Seebeck coefficient S is
Sα = 1
eT
[∫ ∞0 σd,e,α(Ee)(Ee − EF)dEe∫ ∞
0 σd,e,α(Ee)dEe
]and
S =∑
α Sασα∑α σα
. (15)
The electronic thermal conductivity κe is
κe,α = 1
e2T
{ ∫ ∞
0σd,e,α(Ee)(Ee − EF)2dEe
−[ ∫ ∞
0 σd,e,α(Ee)(Ee − EF)dEe
]2∫ ∞0 σd,e,α(Ee)dEe
}and
κe =∑
α
κe,α. (16)
Including the lattice thermal conductivity from MD, then ZT
is obtained from Eq. (1).
III. RESULTS AND DISCUSSION
A. Lattice dynamics of thermal-disordered structures
Using AIMD and classical MD calculations, we verifiedthe abnormal anharmonic lattice dynamics of PbTe over thetemperature range. The lattice coordinates of each atom foreach time step is collected, and the results are averaged toobtain overall radial distribution function g(r), as shown inFig. 3. Our simulations successfully reproduce all relatedlattice dynamics results,10,12 peak broadening with risingtemperature and non-Gaussian asymmetry.
Figure 4 shows the rms atomic off-centering (comparedto 0 K) of the ions as a function of temperature. Under theDebye harmonic approximation for isotropic lattice, the rmsdisplacement � is36
� ≡ 〈[(dj − d◦) · sj ]2〉1/2
={
3h
mωD
[1
4+
(T
TD
)2 ∫ TD/T
0
xdx
ex − 1
]}1/2
, (17)
where dj and d◦ are the displacement vectors of the atom j
and the central atom, sj is the equilibrium position unit vectorof the atom j , TD is the Debye temperature, and ωD is theDebye frequency (=kBTD/h). The Debye model is a morerealistic model than the Einstein model, all atoms vibrate as aharmonic oscillator with one frequency (ω). The Debye modelalso assumes the atoms vibrate as harmonic oscillators, butnow with a distribution of frequencies which is proportionalto ω2 and extends to the Debye frequency ωD. So we cancompare the difference between the Debye model and ourAIMD predictions in terms of the anharmonicity. The resultsfor this relation are also shown in Fig. 4 and the contrast(shown with vertical arrows) demonstrates the anharmonic
(a) (b) (c)
x
yz
FIG. 5. (Color online) The charge densities and atomic positions of PbTe for (a) T = 0 K, (b) 300 K, and (c) 700 K. A slice (101) illustratesthe electron-density distribution (a distance from origin of 16.8 A). The charge density contours are for 0 (blue) to 0.289 (red) eA−3.
045213-4

EFFECT OF THERMAL DISORDER ON HIGH FIGURE OF . . . PHYSICAL REVIEW B 86, 045213 (2012)
0.01.02.03.0
0.01.02.0
-2.0 -1.5 -1.0 -0.5 0.0 0.5 1.0 1.5 2.00.01.02.0
De (
1/eV
-u.c
)
Ee - EF (eV)
0.00.30.60.91.2
0.00.30.60.9
-2.0 -1.5 -1.0 -0.5 0.0 0.5 1.0 1.5 2.00.00.30.60.9
T = 0 K
T = 300 K
T = 700 K
s p dPbTe
T = 0 K
T = 300 K
T = 700 K
Ee - EF (eV)
De
(1/e
V-u
.c)
(a) (b)
FIG. 6. (Color online) (a) Electronic density-of-states for PbTe using static DFT (0 K) and AIMD calculations (300 and 700 K). (b) Projectedelectronic density-of-states for PbTe, showing the s, p, and d orbital contributions. Frozen (T = 0 K) and thermal-disordered structure at 300and 700 K are shown.
effect predicted by AIMD. Among the symmetry-equivalentdisplaced sites, the amplitude of the Pb displacement is largerthan that of Te atoms. This result is highly consistent withthe Debye-Waller factor calculation,14 that is, abnormal bandgap energy increase with temperature. In addition to that, twowell-known physical properties related to solid anharmonicity,the Gruneisen parameter and thermal expansion coefficient,are also listed in Table II. The calculated results are ingood agreement with the reported values in the literature34,35
and show the extent of anharmonicity. The vibration-modefrequencies of Pb and Te are noticeably different, that is,the Te ions constitute the optical frequency peak (f◦,Te ∼2.3 THz), while the Pb ions dominate in the acoustic regime(f◦,Pb ∼ 1.5 THz). These features cannot be explained with theharmonic or quasiharmonic models for the lattice dynamics.
B. Temperature-dependent electronic structures
From the orbital model perspective, the thermal disordercauses local orbital overlapping. Figures 5(a) to 5(c) showthe equilibrium atomic positions at 0, 300, and 700 K along
with their charge density distribution. In the presence ofthermal disorder, the orbital overlaps increase significantlywith temperature. At high temperature, local charge densitiesare distorted and the valence band distributions are altered.Also, the distorted De (total and partial) plots are shown inFig. 6. At high temperatures the vibration amplitudes aresubstantial and modify the screening properties of the electrondensity.44 The De for the structures at 300 and 700 K arecompared with the frozen structure in Fig. 6(a). The staticDe(T = 0 K) is not populated at the top of the valence bands,indicating the light hole at L point, a nonparabolic Kanedistribution at the valence edge. The onset of appearance of amuch larger hole effective mass starting at ∼−0.2 eV below theedge is manifestation of a resonance near −0.25 eV. It resultsfrom the heavy hole in the � direction.16 At 0 K this stronglyincreases De(T ) below −0.2 eV and is the reason for theunusual doping and temperature dependence of the TE powerfactor.16 Compared to De(T = 0 K), the thermal disorder of thePbTe structure makes for unique modifications in the De(T ), asshown in Fig. 6(a). The AIMD results for De(T ) show the bandconvergence of the heavy and light holes at high temperatures.
(a) (b) (c)
∑ ∑∑
E e -
E F (e
V)
EF EF EF
4
3
2
1
0
-1
-2
-3
-4
-5
-6
-7 Г Σ K W X Г L W Г Σ K W X Г L W W L Г X W K Σ Г
FIG. 7. (Color online) Calculated band structures of PbTe supercell (3 × 3 × 3 primitive cell) at (a) T = 0 K, (b) 300 K, and 700 K.
045213-5

HYOUNGCHUL KIM AND MASSOUD KAVIANY PHYSICAL REVIEW B 86, 045213 (2012)
First, there is a transition from the nonparabolic (low T ) toparabolic (high T ) De(T ) in a principal valence band. Second,comparing 0 and 700 K, the sharp De(T ) peak (near −0.2 eV,0 K) splits into two peaks (near −0.12 and −0.4 eV, 700 K).These are highly related with the band convergence at hightemperatures. The projected De plots [Fig. 6(b)] for T = 0,300, and 700 K indicate the orbital contributions to valenceband change with temperature. Also they demonstrate that thelocal orbital overlaps and the valence band distortion becomesignificant with increased temperature. For T = 0 K, the Te 5p
orbital dominate contribution to the first and second valenceband of PbTe. Contributions from Pb (6p and 5d) and Te (4d
and 5p) to the formation of valence band are found at highertemperatures, while contribution from Te 5p slightly dimin-ishes. As a result, the thermal disorder and the correspondingincrease in the local orbital overlaps (i.e., contributions fromPb 5d, Pb 6p, and Te 4d orbitals at 700 K) alter the distributionof the valence bands of PbTe at high temperatures.
Thermal-disorder bond anharmonicity leads to the phonon-phonon Umklapp and normal scatterings and reduction ofphonon conductivity at high temperatures.11,13,44 In suchrocksalt group IV–VI semiconductors, the outer s electronsand part of the p electrons are nonbonding and are expected toform a shell of relatively large radius.13 This is the well-knownreason for the high anharmonicity of the bonds in thesematerials and the ultimate cause of their low lattice thermalconductivity.11,13,44 Further results on thermal-disorder latticethermal conductivity (using classical MD) will be given in laterparagraphs. The calculation of the band structures (Fig. 7) andband gap energies (Fig. 8) as a function of temperature areimportant in explaining the band convergence. The calculatedband structures of PbTe supercell provide clear evidence forband convergence at high temperature (above 450 K), thesecondary valence band in the � direction is overcome bythe first valence band of L point and PbTe becomes an indirectband gap. From the band structures and the electronic density-of-states we have also verified the band gap energy changeswith temperature (Fig. 8). The temperature dependence of theband gap energy �Ee,g for PbTe is modeled41 as �Ee,g =0.19 + (0.42 × 10⁻³)T for T � 400 K and �Ee,g = 0.358 eVfor T > 400 K, in good agreement with experimental results.45
Noting the general underestimation of the band gap energy inDFT calculation, the calculated results have a similar behavioras the experiment.
Such thermal disorder electronic band alterations arequantified by temperature-dependent mi,e,α(T ). Some previous
ΔEe,g
0 100 300 400 500 600 700 8000.00
0.05
0.10
0.15
0.20
0.25
0.30
0.35
0.40
This work Experiment [45] Empirical model [41]
(eV
)
T (K)
FIG. 8. (Color online) Variations of PbTe band gap energy as afunction of temperature. The experimental results and the proposedempirical model results are also shown.
analyses treated this as constant value m◦i,e,α , or semitem-
perature dependent mi,e,α(T ) = mi,e,α(0)[�Ee,g,α(T )/�Ee,g,α(0)].1,5,7,9,19,20 Using the DFT band structure of thethermal-disordered PbTe, we calculate the effective massesfor each band at BZ points and direction (fitted to parabolicmodel) as a function of temperature. The band effective mass(mi,e,α)b is 1/(mi,e,α)b = (1/h2)[∂2Ee(k)/∂k2]α (i = h or e
and α is location in BZ).9,36 This can be written in the tensorform as
M−1ij = 1
h2
∂2Ee(k)
∂ki∂kj
and me,e = [det|Mij |]1/3. (18)
With the assumed parabolic Ee-k relationship at band extrema,the parabolic Ee can be generalized to
Ee = Ee,◦ + Ax(kx − k◦,x)2 + Ay(ky − k◦,y)2
+Az(kz − k◦,z)2, (19)
where coefficient Ai is constant and (k◦,x , k◦,y , k◦,z) isthe coordinate of band minima/maxima. Assuming isotropicdispersion at specific point, the effective mass tensor hasequal diagonal tensor elements me,e,xx = me,e,yy = me,e,zz
(off-diagonal elements are zero m−1e,e,ij = 2Aiδij ) and all Ai
are equal. Thus the effective mass tensor reduces to me,e =1/2Ai . In order to maintain such scalar calculation, eachcomponents, longitudinal and transverse, of effective mass iscalculated independently. The electron/hole pockets of PbTecan be characterized by a longitudinal mass (mi,e,l) along the
TABLE III. The calculated longitudinal and transverse components of the effective electron (or hole) masses at the L and � points, as afunction of temperature.
Longitudinal Transverse
T (K) |me,e,L,l/me| |mh,e,L,l/me| |mh,e,�,l/me| |me,e,L,t /me| |mh,e,L,t /me| |mh,e,�,t /me|300 0.141 0.167 1.66 0.0438 0.0563 0.243400 0.102 0.161 1.75 0.0459 0.0704 0.168500 0.208 0.134 2.50 0.0420 0.0592 0.198600 0.204 0.186 2.12 0.0521 0.0876 0.162700 0.196 0.231 1.25 0.0495 0.113 0.198800 0.185 0.441 0.96 0.0651 0.122 0.219
045213-6

EFFECT OF THERMAL DISORDER ON HIGH FIGURE OF . . . PHYSICAL REVIEW B 86, 045213 (2012)
T (K)
m i,e,
α(T)
/me
L Σ L Σ
Converged-BandRegime
Single-BandRegime
0 300 400 500 600 700 8000.0
0.5
1.0
1.5
2.0
2.5
3.0
me,e,L mh,e,L mh,e,∑
L ΣL Σ me,e,L [17,18]
mh,e,L [17,18] mh,e,∑ [17,18]
FIG. 9. (Color online) Temperature dependent, thedensity-of-states effective masses mi,e,α(T ) obtained fromDFT-AIMD. Two regimes, single and converged band, are alsodefined. The band-alignment evolution with temperature is alsoillustrated. me is electron mass.
corresponding direction and two transverse masses (mi,e,t ) inthe plane perpendicular to the longitudinal direction (withabove parabolic-isotropic assumption). The value for eachdirection is quite different (i.e., longitudinal components arealways larger than transverse) and this holds for the temper-ature range. This is in good agreement with a well-knownfeature of PbTe. The calculated effective mass componentsare shown in Table III. The density-of-states effective massmi,e,α = N
2/3i,α (mi,e,α)b = N
2/3i,α (mi,e,α,lm
2i,e,α,t )
1/3b , where Ni,α
is orbital degeneracy of each valley (Ne,L = Nh,L = 4 andNh,� = 121,9,19). The results for the electron and hole mi,e,α ,as a function of temperature are shown in Fig. 9. Note that theelectron/hole effective mass at T = 0 K and band locationsL and � points are me,e,L = 0.130me, mh,e,L = 0.225me, andmh,e,� = 1.51me. These are very close to those reported inRef. 18. Below 450 K, labeled as the “single-band regime,”
the L point dominates and it is a light hole band. For450 < T < 800 K, labeled as the “converged-band regime,”the heavy hole of the � point band becomes curved (is lighter)and matches with the light hole L point band. Simultaneously,the promotion of the holes from the light to heavy valencebands increases mh,e,� in the converged regime. Thus the twobands converge and play a central role as the combined firstvalence band (light and heavy hole). So the resultant effectivemass increases and peaks around 500 K. These clearly showthe band convergence effect in 450 < T < 800 K.
C. TE transport properties with thermal-disordered structures
As described in the Method section, the transport calcula-tions are done using the Boltzmann transport equations withenergy-dependent relaxation time τe(Ee). Although τe(Ee) canbe determined from the wave function and the perturbationpotential obtained from the first-principle calculations, thisis very challenging. Here instead we use the relaxationtime models7,13,20,39,40,46 with three dominant electron scat-tering mechanisms,40,46 namely, (i) acoustic (A), (ii) opticalwith deformation potential couplings (DO), and (iii) opticalphonons with polar coupling (OP). The total τe(Ee), using theMatthiessen rule, is
1
τe(Ee)=
∑i=1−3
1
τe−p,i(Ee),i = A,OD,or OP. (20)
The models and their parameters are given in Refs. 7, 13,20, 39, 40, and 46. Figure 10 shows the calculated energy-dependent relaxation times as a function of electron energy forT = 300 and 700 K. At low Ee (practical doping), the electron-optical phonons scattering with polar coupling is dominant.
The calculated transport properties are illustrated inFigs. 11(a) to 11(c), namely S, σe, and κ = κe + κL (κe iscalculated with BoltzTraP), as a function of temperature forthree different hole concentrations np (the Fermi energy). Theavailable experimental results3 are also shown. The Hall factorrH and the Hall coefficient RH, np = rH/eRH, are used in thecalculations of np,9,19,20 that is,
rH,α =∫ ∞
0
( − ∂f ◦e
∂Ee
)γα(Ee)3/2dEe
∫ ∞0
( − ∂f ◦e
∂Ee
)τe(Ee)2γα(Ee)3/2
[dγα (Ee)
dEe
]−2dEe{ ∫ ∞
0
( − ∂f ◦e
∂Ee
)τe(Ee)γα(Ee)3/2
[dγα (Ee)
dEe
]−1dEe
}2 . (21)
The trends in the temperature dependence of the TE propertiesare highly correlated with the thermal-disorder behavior ofPbTe. The Seebeck coefficient reaches a plateau after 500 K be-cause the parabolic � band is dominant above this temperature.For more complete calculation, the Seebeck coefficient can beexpressed as the sum of Spresence and Stransport.47 Here Spresence
is the sum of contributions to the carrier-induced entropychange, that is, Spresence = Smix + Sspin + Svibration, where theright hand side terms are change of the entropy-of-mixing,spin entropy, and vibrational entropy upon adding a chargecarrier, respectively. The other contribution Stransport is equal to
the net energy transferred in moving a carrier divided by qT ,where q is the carrier charge. In this study, we approximatethat Smix is the dominant and the only contribution, sinceSspin, Svibration, and Stransport are estimated to be negligible.These are justified due to (i) not including the magneticproperties, (ii) negligible vibrational contribution, and (iii)no significant change in the mechanism of charge transportover entire temperature range (300 to 800 K). The reductionin the electrical conductivity and the decrease in the totalthermal conductivity also result from the thermal disorder andthe effective mass changes. The heavy- and light-hole band
045213-7

HYOUNGCHUL KIM AND MASSOUD KAVIANY PHYSICAL REVIEW B 86, 045213 (2012)
τe-p,Aτe-p,ODτe-p,OPτe
300 K 700 K
0.01
0.1
1
10τ i
(ps)
0.0 0.4 0.8 1.2 1.6 2.0Ee (eV)
FIG. 10. (Color online) Calculated energy-dependent electron-phonon relaxation times for 300 and 700 K. The subscripts A, OD,and OP refer to acoustic, optical with deformation potential couplings,and optical with polar coupling.
convergence has a dominant role in the charge transport. Asthe band effective mass increases, the electronic contributionto the thermal conductivity is reduced.48 The De slope and itspeaks near the band edge often dictate the overall performance,and semiconductors with heavy electron masses and multiplevalleys have high ZT potential. For all predicted propertiesthere are good agreement with experiments.3
The lattice thermal conductivity tensor κL is determinedusing the equilibrium MD results and the Green-KuboHCACF decay.36–38 Figure 11(d) shows the predicted κL asa function of temperature, and demonstrates the suppressionof the lattice thermal conductivity in the thermal-disorderedstructures (>500 K). The MD results are κL(300 K) = 3.1 andκL(700 K) = 0.9 W/m K. The results show that κL decreasesnoticeably with increased temperature. The minimum conduc-tivity κmin
49,50 for the amorphous phase is also shown, and givesκmin ≈ 0.32 W/m K (for T > 2TD, where TD,PbTe = 130 K3,13)using the PbTe properties.34 Figure 11(d) includes the resultsreported in Ref. 3 using the total thermal conductivity and theWiedemann-Franz law. The results of the Slack relation36,37 forthe lattice thermal conductivity of crystal at high temperatures(T > 0.1TD) are also shown in Fig. 11(d), using the propertieslisted in Table III. Prior to the onset of significant thermaldisorder (T < 500 K), the MD results are in good agreementwith the Slack relation (1/T dependence). For T > 500 K,the thermal-disorder scattering becomes significant and thelattice thermal conductivity becomes independent of temper-ature. This shows that the κL in thermal-disordered PbTestructure has two phonon transport regimes, pseudosymmetry(single band) and pseudoamorphous (converged band). Thethermal-disordered structures represent a pseudoamorphousphase which has high temperature anharmonic vibrations.In Fig. 11(d) we also decompose κL(T ) of PbTe into threecomponents, namely, the acoustic short range, acoustic long
0
50
100
150
200
250
300
0.0
0.5
1.0
1.5
2.0
2.5
3.0
3.5
300 400 500 600 700 8000
1
2
3
4
5
300 400 500 600 700 800
0.1
1
κL κL,A,sh κL,A,lg κL,O
Reference [3]Slack relation
T (K) T (K)
κ
)K-m/
W( S
(μV
/K)
κL (W/m
-K)
(a)
)d()c(
σe (×10 3, S/cm)
(b)
DFT-AIMD Experiment [3]
np (×1019, cm-3)3.6 9.0 14
κmin
FIG. 11. (Color online) Predicted TE properties of PbTe and comparison with experiments.3 (a) Temperature dependence of the Seebeckcoefficient, (b) electrical conductivity, and (c) total thermal conductivity for three different carrier concentrations np . (d) Temperature variationsof lattice thermal conductivity and its short- and long-range acoustic and optical components. Cutoff frequency of 1.5 THz is used.36–38 Theamorphous-phase minimum lattice conductivity is also shown.
045213-8

EFFECT OF THERMAL DISORDER ON HIGH FIGURE OF . . . PHYSICAL REVIEW B 86, 045213 (2012)
0.0
0.2
0.4
0.6
0.8
1.0
1.2
1.4
1.6
300 400 500 600 700 8000.0
0.2
0.4
0.6
0.8
1.0
1.2
1.4
ZT
ZT
T (K)
(a)
(b)
DFT-AIMD Experiment [3]
np (×1019, cm-3)3.6 9.0 14
Analytic, mi,e,αAnalytic, mi,e,α(T)DFT-AIMDExperiment [3]
np = 9.0×1019 cm-3
◦
FIG. 12. (Color online) (a) Variations of the DFT-AIMD pre-dicted ZT as a function of temperature for the p-type PbTe, at threedifferent carrier concentrations np . The corresponding experimentalresults3 are also shown. (b) Variation of ZT (T ) obtained fromthe analytic model using constant m◦
i,e and temperature-dependentmi,e(T ) for the 9.0 × 1019 cm−3.
range, and optical,36–38 that is,
κL = 1
kBV T 2
(Ash,Aτsh,A + Alg,A +
∑i
Bi,Oτi,O
1 + τ 2i,O
)
= κL,sh,A + κL,lg,A + κL,O, (22)
where the τi is time constant, Ai and Bi are constants, andthe subscripts sh, lg, A, and O refer to short range, long range,acoustic, and optical. From Fig. 11(d) the short- and long-rangeacoustic phonon contributions are dominant and most affectedby the thermal disorder. The long-range acoustic contributionis almost saturated to the amorphous κL limit, but short rangeis still changing up to 800 K. Note that κL decreases mostnoticeably in the converged-band regime.
Combining all four TE properties from DFT andMD/Green-Kubo calculations, the predicted ZT of p-dopedPbTe as a function of temperature, is shown in Fig. 12(a), alongwith the experimental results.3 The results are for three dif-ferent carrier concentrations np, including peak performance
at np = 9.0 × 1019 cm−3. The results for thermal-disorderedstructures are in good agreement with the experiments.3
In order to confirm the thermal-disorder effective masscalculations, the results of two analytical models [constantm◦
i,e,α and temperature-dependent mi,e,α(T )] are shown inFig. 12(b). With the temperature-dependent effective mass(Fig. 9), the analytical model prediction matches the DFTand the experimental results. In contrast, the constant effectivemass [m◦
e,e,L = m◦h,e,L = 0.13, m◦
h,e,� = 1.3] results,18 that is,neglecting the band convergence (450 < T < 800 K) anddivergence (T < 450 K and T > 800 K), underestimate ZT
over the entire temperature range. The thermal-disorder modeland its effective mass of the altered band structures reveal thehigh-ZT PbTe behavior.
Due to the computation resource and time limitations, thetime and length domains of AIMD simulations are limited.So we have used the number of atoms in the periodic cellto simulate the extended system effects. In order to reliablypredict the thermal-disordered structure and its electronicstructures, by minimizing the statistical uncertainties, weuse (i) long enough simulation time to find well-convergedstructures, and (ii) a large number of atoms in a simulation cellto minimize the drawbacks of the periodic boundary condition.These highly correlate with transport properties such as thephonon/electron lifetime and mean-free path. Because of theselimitations on the AIMD simulations, we pursued quantitativeverifications such as the ones on the selection of representativesnapshots, before entering the transport property calculations.
IV. CONCLUSION
In summary, we investigate the abnormal band convergenceand TE properties of PbTe using ab initio thermal-disorderedstructures, that is, at high temperatures the atoms do not occupythe ideal lattice positions, thus affecting the charge and phonontransports. Thermal disorder modifies the charge effectivemass and suppresses the phonon short- and long-range acousticcontributions, resulting in high ZT for the converged-band,pseudoamorphous structure (acoustic phonon suppression).Understanding of the thermal disorder provides an insight intodesign of improved TE chalcogenides.
ACKNOWLEDGMENTS
This work is supported by the Center for Solar and ThermalEnergy Conversion at University of Michigan, an EnergyFrontier Research Center funded by the US Department ofEnergy, Office of Science, Office of Basic Energy Sciencesunder Award Number DE-SC0000957. Fruitful discussionswith Ctirad Uher are greatly appreciated.
*[email protected]. Noda, Acta Crystallogr. Sect. B 39, 312 (1983).2G. A. Slack, in CRC Handbook of Thermoelectrics, edited by D. M.Rowe (CRC, Boca Raton, FL, 1995).
3Y. Pei, A. LaLonde, S. Iwanaga, and G. J. Snyder, Energy Environ.Sci. 4, 2085 (2011).
4S. Ahmad, K. Hoang, and S. D. Mahanti, Phys. Rev. Lett. 96,056403 (2006).
5J. P. Heremans, V. Jovovic, E. S. Toberer, A. Saramat, K. Kurosaki,A. Charoenphakdee, S. Yamanaka, and G. J. Snyder, Science 321,554 (2008).
6K. Biswas, J. He, Q. Zhang, G. Wang, C. Uher, V. P. Dravid, andM. G. Kanatzidis, Nat. Chem. 3, 160 (2011).
7J. Q. He, J. R. Sootsman, L. Q. Xu, S. N. Girard, J. C. Zheng,M. G. Kanatzidis, and V. P. Dravid, J. Am. Chem. Soc. 133, 8786(2011).
045213-9

HYOUNGCHUL KIM AND MASSOUD KAVIANY PHYSICAL REVIEW B 86, 045213 (2012)
8S. N. Girard, J. He, X. Zhou, D. Shoemaker, C. M. Jaworski, C.Uher, V. P. Dravid, J. P. Heremans, and M. G. Kanatzidis, J. Am.Chem. Soc. 133, 16588 (2011).
9Y. Pei, X. Shi, A. LaLonde, H. Wang, L. Chen, and G. J. Snyder,Nature (London) 473, 66 (2011).
10E. S. Bozin, C. D. Malliakas, P. Souvatzis, T. Proffen, N. A. Spaldin,M. G. Kanatzidis, and S. J. L. Billinge, Science 330, 1660 (2010).
11O. Delaire, J. Ma, K. Marty, A. F. May, M. A. McGuire, M.-H. Du,D. J. Singh, A. Podlesnyak, G. Ehlers, M. D. Lumsden, and B. C.Sales, Nat. Mater. 10, 614 (2011).
12Y. Zhang, X. Ke, P. R. C. Kent, J. Yang, and C. Chen, Phys. Rev.Lett. 107, 175503 (2011).
13D. T. Morelli, V. Jovovic, and J. P. Heremans, Phys. Rev. Lett. 101,035901 (2008).
14C. Keffer, T. M. Hayes, and A. Bienenstock, Phys. Rev. B 2, 1966(1970).
15R. S. Alligaier, J. Appl. Phys. 32, 2185 (1961).16D. J. Singh, Phys. Rev. B 81, 195217 (2010).17L. M. Rogers, Brit. J. Appl. Phys. 18, 1227 (1967).18A. A. Andreev, J. Phys. Colloque 29, C50 (1968).19J. J. Harris and B. K. Ridley, J. Phys. Chem. Solids 33, 1455 (1972).20C. J. Vineis, T. C. Harman, S. D. Calawa, M. P. Walsh, R. E. Reeder,
R. Singh, and A. Shakouri, Phys. Rev. B 77, 235202 (2008).21G. Kresse and J. Furthmuller, Phys. Rev. B 54, 11169 (1996).22P. E. Blochl, Phys. Rev. B 50, 17953 (1994).23Yu. I. Vesnin and Yu. V. Shubin, Mater. Res. Bull. 19, 1355 (1984).24D. J. Singh and L. Nordstrom, Planewaves, Pseudopotentials and
the LAPW Method, 2nd ed. (Springer, Berlin, 2006).25P. Blaha, K. Schwarz, G. Madsen, D. Kvasnicka, and J. Luitz,
WIEN2k, An Augmented Plane Wave + Local Orbitals Program forCalculating Crystal Properties (K. Schwarz, Technical University,Wien, Austria, 2001).
26G. K. H. Madsen and D. J. Singh, Comput. Phys. Commun. 175,67 (2006).
27E. Engel and S. H. Vosko, Phys. Rev. B 47, 13164 (1993).28T. Chonan and S. Katayama, J. Phys. Soc. Jpn. 75, 064601 (2006).29B. Qiu, H. Bao, G. Zhang, Y. Wu, and X. Ruan, Comput. Mater.
Sci. 53, 278 (2012).
30J. Gale and A. Rohl, Mol. Simul. 29, 291 (2003).31B. Houston, R. E. Strakna, and H. S. Belson, J. Appl. Phys. 39,
3913 (1968).32R. Dornhaus, G. Nimtz, and B. Schlicht, Narrow Gap Semiconduc-
tors (Springer, Berlin, 1985).33E. A. Albanesi, C. M. I. Okoye, C. O. Rodriguez, E. L. Peltzer y
Blanca, and A. G. Petukhov, Phys. Rev. B 61, 16589 (2000).34H. Wang, Y. Pei, A. D. LaLonde, and G. J. Snyder, Adv. Mater. 23,
1366 (2011).35Z. H. Dughaish, Physica B 322, 205 (2002).36M. Kaviany, Heat Transfer Physics (Cambridge University Press,
New York, 2008).37B. L. Huang and M. Kaviany, Phys. Rev. B 77, 125209 (2008).38H. Kim, M. Kaviany, J. C. Thomas, A. Van der Ven, C. Uher, and
B. Huang, Phys. Rev. Lett. 105, 265901 (2010).39D. I. Bilc, S. D. Mahanti, and M. G. Kanatzidis, Phys. Rev. B 74,
125202 (2006).40A. Popescu, L. M. Woods, J. Martin, and G. S. Nolas, Phys. Rev. B
79, 205302 (2009).41S. Ahmad and S. D. Mahanti, Phys. Rev. B 81, 165203 (2010).42A. Shakouri, E. Y. Lee, D. L. Smith, V. Narayanamurti, and J. E.
Bowers, Microscale Thermophys. Eng. 2, 37 (1998).43G. S. Nolas, J. Sharp, and H. J. Goldsmid, Thermoelectrics: Basic
Principles and New Materials Developments (Springer, Berlin,2001).
44O. Delaire, K. Marty, M. B. Stone, P. R. C. Kent, M. S. Lucas,D. L. Abernathy, D. Mandrus, and B. C. Sales, Proc. Nat. Acad.Sci. 108, 4725 (2011).
45R. N. Tauber, A. A. Machonis, and I. B. Cadoff, J. Appl. Phys. 37,4855 (1966).
46L. Xu, Y. Zheng, and J. C. Zheng, Phys. Rev. B 82, 195102 (2010).47D. Emin, Phys. Rev. B 59, 6205 (1999).48J. J. Pulikkotil, H. N. Alshareef, and U. Schwingenschlogl, Chem.
Phys. Lett. 514, 54 (2011).49D. G. Cahill, S. K. Watson, and R. O. Pohl, Phys. Rev. B 46, 6131
(1992).50D. G. Cahill, A. Melville, D. G. Schlom, and M. A. Zurbuchen,
Appl. Phys. Lett. 96, 121903 (2010).
045213-10


![First principles study of heavily doped full Heusler Fe2YZ ... · PDF fileI Thermoelectric properties computed with BoltzTraP [4] ... CRYSTAL14 User’s Manual. 2014. [4]G. K. Madsen](https://static.fdocuments.us/doc/165x107/5aa3abd87f8b9ab4208e8ff0/first-principles-study-of-heavily-doped-full-heusler-fe2yz-thermoelectric-properties.jpg)

![El caso del Colectivo 82. Una historia entre la memoria y el ......María * anu. ri o. c, lmu. - bde. chch* dsst hych-críg dfñpvsn - ccíg-ígri vt uwtvÚ) [87] Ma ríVi cta oiatrUbei](https://static.fdocuments.us/doc/165x107/60d599c7f98de12b423e0aa3/el-caso-del-colectivo-82-una-historia-entre-la-memoria-y-el-mara-anu.jpg)