
Effect of the downturn - National Centre for Vocational ...
50
Effect of the downturn on apprentices and trainees Tom Karmel Damian Oliver NATIONAL CENTRE FOR VOCATIONAL EDUCATION RESEARCH NATIONAL CENTRE FOR VOCATIONAL EDUCATION RESEARCH OCCASIONAL PAPER
Transcript of Effect of the downturn - National Centre for Vocational ...

Effect of the downturn on apprentices and
trainees
Tom KarmelDamian Oliver
NATIONAL CENTRE FOR VOCATIONAL EDUCATION RESEARCH
NATIONAL CENTRE FOR VOCATIONAL EDUCATION RESEARCH OCCASIONAL PAPER


Effect of the downturn on apprentices and trainees
Tom Karmel Damian Oliver NCVER
The views and opinions expressed in this document are those of the author/project
team and do not necessarily reflect the views of the Australian Government or
state and territory governments.
NATIONAL CENTRE FOR VOCATIONAL EDUCATION RESEARCH OCCASIONAL PAPER

© National Centre for Vocational Education Research 2011
With the exception of cover design, artwork, photographs, all logos, and any other material where
copyright is owned by a third party, all material presented in this document is provided under a
Creative Commons Attribution 3.0 Australia <http://creativecommons.org/licenses/by/3.0/au>.
This document should be attributed as Karmel, T & Oliver, D 2011, Effect of the downturn on
apprentices and trainees, NCVER.
NCVER is an independent body responsible for collecting, managing and analysing, evaluating and
communicating research and statistics about vocational education and training (VET).
NCVER's inhouse research and evaluation program undertakes projects which are strategic to the
VET sector. These projects are developed and conducted by NCVER's research staff and are funded
by NCVER. This research aims to improve policy and practice in the VET sector.
ISBN 978 1 921955 41 9 web edition
978 1 921955 42 6 print edition
TD/TNC 104.27
Published by NCVER, ABN 87 007 967 311
Level 11, 33 King William Street, Adelaide SA 5000
PO Box 8288 Station Arcade, Adelaide SA 5000, Australia
P +61 8 8230 8400 F +61 8 8212 3436 E [email protected] W http://www.ncver.edu.au

About the research Effect of the downturn on apprentices and trainees
Tom Karmel and Damian Oliver, NCVER
At the onset of the Global Financial Crisis (GFC) in 2008—09, the Australian training system
experienced a sharp decline in the number of apprentice commencements. Ultimately, the impact of
the economic downturn on employment levels in Australia was much more muted and both
employment and apprentice and trainee numbers have returned to the pre-downturn level. This
report examines the effect of the downturn on apprentices and trainees as well as investigating the
relationship between apprentice and trainee numbers and the level of employment.
Key messages At the broad level, apprentice and trainee commencements are sensitive to changes in total
employment.
Changes to apprentice and trainee commencements precede changes in total trades employment
by four quarters. Changes to trainee commencements appear to lag behind changes in employment
in non-trade occupations but the relationship is not nearly as strong as for the trade occupations.
When examined at the two-digit occupational level, the relationship between apprentice and
trainee commencements and occupational employment is strong in trade occupations but not
apparent in non-trade occupations.
During the downturn, cross-sectional completion rates increased and cancellations and
withdrawals from apprenticeships and traineeships decreased, although the size of the decrease
was larger in the non-trade occupations.
Of those apprentices and trainees who do not complete, a much higher proportion has
discontinued their training because they lost their job or were made redundant. This was
especially so in the trades occupations. Even so, the impact of the increase in redundancies is
offset by a decline in apprentices and trainees leaving their job.
Consequently, the short-lived downturn had only a very small impact on the supply of
tradespeople.
Tom Karmel
Managing Director, NCVER


NCVER 5
Contents Tables and figures 6
Introduction 8
The 2008 downturn 10
Impact of the labour market on commencements 14
Impact on completion 32
Impact on cancellations and withdrawals 36
Final comments 43
References 44
Appendices
A 45
B 47

6 Effect of the downturn on apprentices and trainees
Tables and figures Tables 1 Seasonally adjusted apprentice and trainee commencements and
percentage change on previous quarter, trade and non-trade,
2007—10 (’000s) 11
2 Impact of downturn on apprentice commencements 12
3 Impact of downturn on trainee commencements 12
4 Regression of apprenticeship commencements on trade employment 16
5 Regression of apprenticeship commencements against employment
and change in employment terms 17
6 Regression of traineeship commencements on trade employment 21
7 Regression of traineeship commencements on lagged commencement,
employment in non-trade occupations and change in non-trade
employment at the state and territory level, 2005—10 22
8 Expected and actual numbers of apprentices in training for selected
trade occupations, 2009 30
9 Number of apprentice and trainee completions 32
10 Cross-sectional completion rates for apprentices and trainees,
cohorts commencing quarter 1, 2007 and quarter 1, 2009 33
11 Change in apprentice cancellations and withdrawals by occupation 36
12 Cross-sectional attrition rates for apprentices and trainees, cohorts
commencing quarter 1, 2007 and quarter 1, 2009 37
13 Main reason for not completing an apprenticeship or traineeship by
occupation, 2008 and 2010 (%) 40
14 Number of apprentice and trainee cancellations because of
redundancy and other reasons, 2007 and 2009 40
15 Employment and further study outcomes for out of trade apprentices
and trainees in trade occupations, (%) 41
16 Proportion of non-completing apprentices who commence another
apprenticeship or traineeship, by reason for non-completion, 2008
and 2010 (%) 42
17 Number of out-of-trade apprentices who return to training, 2008
and 2010 42
A1 Comparison of regression models testing apprentice commencements
against lagged commencements, trade employment and change in
trade employment 45
A2 Comparison of regression models testing trainee commencements
against lagged commencements, trade employment and change in
non-trade employment 46

NCVER 7
B1 Regression results for change in apprentice and trainee
commencements by occupation 47
B2 Model summary for regression of change in apprentice and trainee
commencements by occupation 47
B3 F-test results for change in apprentice and trainee commencements
by occupation 47
Figures 1 Percentage change in per capita GDP 10
2 Seasonally adjusted commencements, trade and non-trade 11
3 Indexed change in employment in trade and non-trade occupations,
1996—2010 13
4 Apprenticeship commencements and total employment in trade
occupations (seasonally adjusted), June 1995 — June 2010 14
5 Traineeship commencements and total employment in non-trade
occupations (seasonally adjusted), June 1995 — June 2010 15
6 Actual vs predicted commencements in apprenticeships, 1995—2010 18
7 Actual and predicted commencements in traineeships, 2004—2010 23
8 Change in apprenticeship commencements by change in employment,
trade occupations 27
9 Change in traineeship commencements by change in employment,
non-trade occupations 28
10 Percentage of commencements who are existing workers, downturn
vs comparison period 29
11 Actual and predicted apprentices in training by trade occupation,
1967—2009 30
12 Change in cross-sectional completion rates (March quarter 2007—09)
by change in employment (March 2008 — November 2009) 34
13 Cumulative completion rates for apprentices and trainees in trade
occupations commencing March Quarter 2007 and March quarter 2009 35
14 Cumulative completion rates for apprentices and trainees in non-trade
occupations commencing March Quarter 2007 and March quarter 2009 35
15 Change in cancellations and withdrawals by change in employment,
2008—09 38
16 Cumulative attrition rates for apprentices and trainees in trade
occupations commencing March quarter 2007 and March quarter 2009 38
17 Cumulative attrition rates for apprentices and trainees in non-trade
occupations commencing March Quarter 2007 and March quarter 2009 39
18 Long-term impact of the decline in commencements, all trades 43

8 Effect of the downturn on apprentices and trainees
Introduction The economic downturn of 2008 had an immediate and dramatic effect on the number of apprentice
and trainee commencements in Australia, even though the country technically avoided recession and
the impact on employment was not as severe as had been anticipated. Previous experience has shown
that trade apprentices are closely linked to the economic cycle (Kapuscinski 2001), although the
patterns have differed by trade (Karmel & Mlotkowski 2008). However, we have virtually no
experience with regard to the economic cycle and traineeships, for the simple reason that
traineeships were numerically small until the middle 1990s. Karmel and Misko (2009) argued that the
relationship would be different by comparison with trade apprentices, but their paper was written
prior to the availability of relevant data.
In this paper, we examine the impact of the 2008—09 economic downturn on apprentices and
trainees. We combine data from the National Apprentice and Trainee Collection with the 2008 and
2010 Apprentice and Trainee Destinations Surveys. The 2008 survey sampled apprentices and trainees
who exited their training in the December 2007 quarter, and interviewed them approximately nine
months after they had left their training, between September and November 2008. The 2010 survey
sampled apprentices and trainees who exited their training in the June quarter 2009, and interviewed
them approximately nine months after they had left their training, between March and May 2010.
The timing of the two surveys provides an excellent opportunity to analyse behaviours and outcomes
for apprentices and trainees at contrasting points of the economic cycle.
To investigate the impact of the economic climate on apprentices and trainees we address the
following:
the impact on commencements, in terms of both the numbers and characteristics of those
entering the system
the impact on the rate of completion and the duration of training
the impact on non-completion, particularly reasons for leaving
outcomes for out-of-trade apprentices during the downturn.
To put the recent downturn in context, we examine the relationship between commencements and
change in employment since 1995 for the trades and since 2004 for the non-trades. We find that the
number of apprentice commencements is associated with the level of trades employment four
quarters later; that is, apprentice commencements led changes in trades employment by four
quarters. For the non-trades we find that trainee commencements reflect changes in non-trades
employment over the preceding five quarters.
We hypothesise that, when examined at the detailed occupational level, changes in apprentice and
trainee commencements will be linked to changes in employment over the corresponding lead or lag
period and to the profile of apprentices and trainees in each occupation, such as average duration of
the apprenticeship or traineeship and the proportion of apprentices or trainees who are existing
workers. However, we are unable to identify a convincing model to account for the dramatic change
in apprentice and trainee commencements on the basis of changes to employment and the differing
characteristics of apprenticeships and traineeships by occupation. Ultimately, employers anticipated

NCVER 9
a more severe downturn than actually occurred. It would seem that ‘animal spirits’ play a large role
in employers’ hiring behaviour.
We find that the downturn was associated with an across-the-board increase in completion rates and
a decrease in attrition rates. This effect was stronger for the non-trade occupations than for the
trade occupations.
Not surprisingly, there was a sharp increase in the number of out-of-trade apprentices during the
downturn. We focus on the outcomes for out-of-trade apprentices in trade occupations, since the
longer duration of traditional apprenticeships represents a greater loss on investment. Out-of-trade
apprentices are less likely to be employed than apprentices who did not complete their training for
other reasons. We also find that most out-of-trade apprentices have not resumed another
apprenticeship within nine months of their being made redundant. Comparison with outcomes for
apprentices made redundant in 2008 shows that jurisdictions struggled to increase the proportion of
out-of-trade apprentices who were able to resume their apprenticeship. Thus the apprentices made
redundant represent a real loss to the supply of qualified trade workers. However, overall completion
rates did not fall during the downturn and the loss to the system from out-of-trade apprentices is not
as great as the decline in apprentice commencements.
In just six quarters, apprentice commencements had returned to their pre-downturn level. The
comparatively mild downturn did not damage the training system’s capacity and the decline in
commencements will have only a minor flow-on effect to the supply of skilled trade workers.
We begin the paper with a brief discussion of the 2008 downturn. This is followed by a discussion, in
turn, of commencements, completions and cancellations and withdrawals. The paper ends with some
final comments.

10 Effect of the downturn on apprentices and trainees
The 2008 downturn In 2008, the Global Financial Crisis (GFC) resulted in an economic downturn in Australia. Technically,
the nation avoided recession as there were not two successive quarters of negative economic growth
but the downturn nonetheless represented the most severe interruption to economic activity for
nearly 15 years. Figure 1 shows the percentage change in per capita quarterly gross domestic product
(GDP). Using per capita figures adjusts for the strong population growth the country has experienced
recently relative to earlier periods. From figure 1, it can be seen that the economic downturn
comprised three quarters of negative GDP per capita growth, beginning in September 2008. In
magnitude and duration, the 2008 downturn exceeded the 2000 downturn but was not as severe as
the 1990 recession.
Figure 1 Percentage change in per capita GDP
Source: ABS (2010a, table 1).
The decline in per capita GDP coincided with a decline in apprentice and trainee commencements. In
the third quarter of 2008, total commencements declined by 2.3% on a seasonally adjusted basis. As
shown in figure 2 and table 1, the decline in commencements among trade occupations (-6.1%) was
much larger than among non-trade occupations (-0.6%). Apprentice and trainee commencements, like
per capita GDP, declined for three quarters. It would be six quarters (in March quarter 2010) before
the number of commencements returned to their pre-downturn level.
-1.0%
-0.5%
0.0%
0.5%
1.0%
1.5%
1990
1991
1992
1993
1994
1995
1996
1997
1998
1999
2000
2001
2002
2003
2004
2005
2006
2007
2008
2009
2010

NCVER 11
Figure 2 Seasonally adjusted commencements, trade and non-trade
Table 1 Seasonally adjusted apprentice and trainee commencements and percentage change on previous quarter, trade and non-trade, 2007—10 (’000s)
Quarter Commencements (’000s) % change in commencements on previous quarter
Trade Non-trade Total Trade Non-trade Total March 2007 20.6 48.3 68.9 3.3 1.7 2.2 June 2007 21.0 48.1 69.1 2.1 -0.5 0.3 September 2007
21.3 47.6 68.9 1.5 -1.0 -0.3
December 2007
22.1 48.3 70.4 3.6 1.6 2.3
March 2008 22.8 50.1 72.8 2.9 3.6 3.4 June 2008 22.5 51.3 73.8 -1.2 2.4 1.3 September 2008
21.1 51.0 72.1 -6.1 -0.6 -2.3
December 2008
19.3 48.9 68.3 -8.5 -4.0 -5.3
March 2009 18.4 47.3 65.7 -4.8 -3.4 -3.8 June 2009 18.9 47.4 66.3 2.6 0.2 0.9 September 2009
20.1 48.8 68.8 6.2 2.9 3.9
December 2009
21.7 50.7 72.4 8.0 4.0 5.2
March 2010 23.0 52.0 74.9 6.0 2.4 3.5 June 2010 23.5 52.2 75.7 2.2 0.4 1.0
Source: NCVER Apprentice and Trainee Collection, June 2010.
For the purposes of this report, we have adopted the convention that the downturn covers the period
in which commencements declined and finishes when they had returned to historical levels (that is,
2008, quarter 3 through to 2009, quarter 4). Our comparison is the period immediately before the
downturn. To preserve seasonality, the comparison period is 2007, quarter 3 through to 2008, quarter
2, with the first two quarters counted twice to preserve seasonal balance. Tables 2 and 3 show the
impact of the downturn on commencements in trade and non-trade occupations respectively. The
0.0
10.0
20.0
30.0
40.0
50.0
60.0N
o of
com
men
cem
ents
('0
00s)
Year
Trade
Non-trade

12 Effect of the downturn on apprentices and trainees
largest declines were in the trade occupations, particularly automotive and engineering trades
workers, construction trades workers, and electrotechnology and telecommunications trades workers.
Table 2 Impact of downturn on apprentice commencements
Comparison period
Downturn period
Change
’000 ’000 % 31 Engineering, ICT and science technicians 4.8 5.2 7.8 32 Automotive and engineering 31.5 24.1 -23.5 33 Construction trades workers 33.9 25.1 -25.9 34 Electrotechnology and telecommunications trades workers 16.9 13.5 -20.5 35 Food trades workers 14.8 14.1 -4.5 36 Skilled animal and horticultural workers 5.9 6.0 1.6 39 Other technicians and trades workers 17.0 21.7 27.4 391 Hairdressers 8.9 8.0 -9.7 392 Printing trades workers 0.9 0.9 5.7 393 Textile, clothing and footwear trades workers 0.3 0.2 -32.8 394 Wood trades workers 3.2 2.2 -30.8 399 Miscellaneous 3.8 10.4 172.0 3 Technicians and trades workers 124.8 109.6 -12.2
Source: NCVER Apprentice and Trainee Collection, June 2010.
Table 3 Impact of downturn on trainee commencements
Comparison period
Downturn period
Change (%)
Managers and professionals 16.0 12.6 -21.7 Community and personal service workers 61.5 62.9 2.2 Clerical and administrative workers 76.1 79.4 4.4 Sales workers 60.5 60.6 0.2 Machinery operators and drivers 39.2 35.6 -9.2 Labourers 35.7 35.2 -1.4 Total (non-trades) 289.0 286.2 -1.0
Source: NCVER Apprentice and Trainee Collection, June 2010.
In contrast to the dramatic impact of the downturn on apprenticeship commencements, the effect
on employment was much more muted than anticipated. Treasury (2009) had predicted that the
unemployment rate would peak at 8.5%, even taking into account the effect of the government’s
stimulus measures. In the end, however, the unemployment rate reached only 5.8% in June—
August 2009.
In figure 3, we show the quarter-on-quarter percentage change in seasonally adjusted employment for
trade and non-trade occupations between 1996 and 2010 as an index, with August 1996 as the base.1
1 We use August 1996 as the base because this is the beginning of the current ANZSCO (Australian and New Zealand
Standard Classification of Occupations) series.
Employment in trade occupations decreased by 3.6% in the second quarter of 2009 and by a further
5.5% in the following quarter. Traineeships provide training for a variety of non-trade occupations but
are predominantly for occupations in the clerical, sales, and personal and community services major
categories, followed by machinery operators and drivers and labourers. Few traineeships provide
training for managerial occupations and there are even fewer for professional occupations, yet these

NCVER 13
are the non-trade occupational categories which have experienced the strongest employment growth
over the last 15 years. We have therefore constructed a trainee-weighted non-trade employment
figure by adjusting each major category to reflect its proportion of the overall number of traineeships
and then summing the categories.2
Figure 3 Indexed change in employment in trade and non-trade occupations, 1996—2010
In the 2008—09 downturn, weighted employment in non-trade
occupations decreased in the last three quarters of 2009 by 0.1% — a much milder impact than
experienced by trade employment but more severe than the unadjusted non-trade employment. In
the next section, we consider the extent to which the decline in apprentice and trainee
commencements can be explained by economic factors, in particular, employment.
Source: ABS (2003, 2010b); NCVER Apprentice and Trainee Collection, June 2010.
2 The weight is calculated using the average proportion of trainee commencements for each non-trade occupational
category over the period Q42003—Q32010 (i.e. quarter 4, 2003 to quarter 3, 2010). Non-trade commencements stabilised from 2004 onward (see figure 5) and Q42003 was included to maintain seasonality.
0.8
0.85
0.9
0.95
1
1.05
1.1
1.15
1.2
1.25
1.3
1.35
1.4
Aug 96 Aug 98 Aug 00 Aug 02 Aug 04 Aug 06 Aug 08
Empl
oym
ent i
ndex
Quarter
Trades Index (Aug 1996=1)
Non-trades Index (Aug 1996=1)
Non-trades index (weighted) (August 1996=1)
14 Effect of the downturn on apprentices and trainees
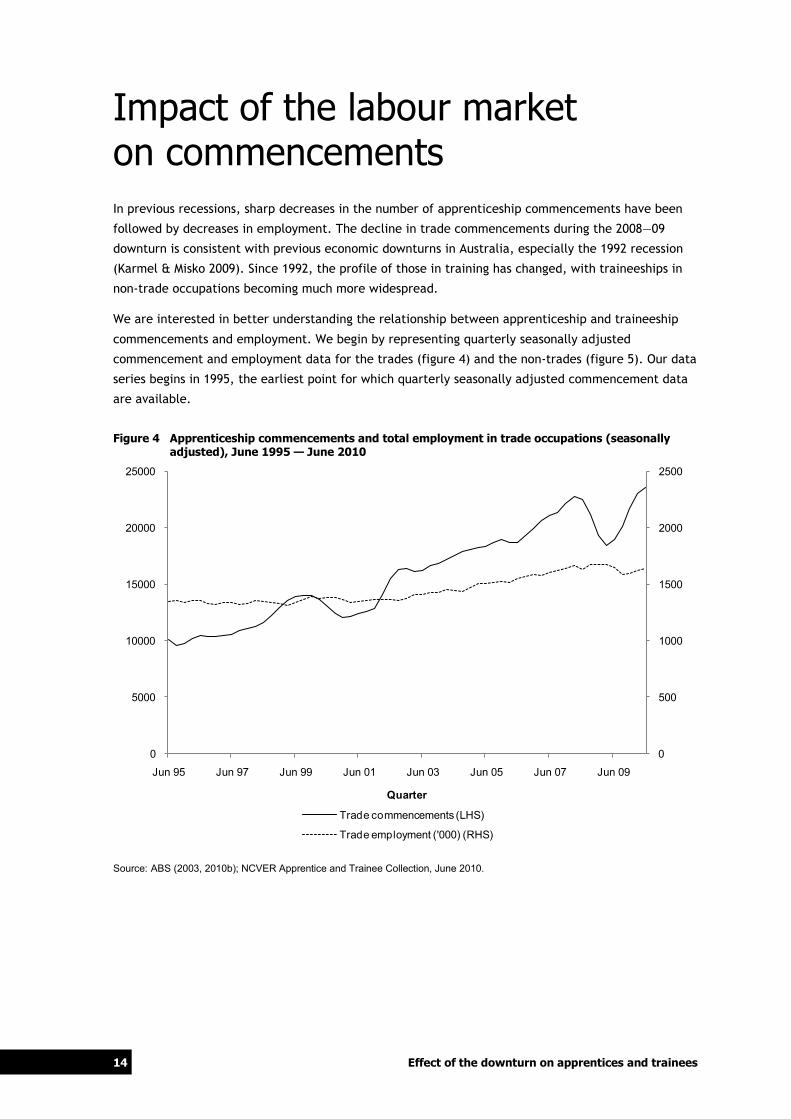
Impact of the labour market on commencements In previous recessions, sharp decreases in the number of apprenticeship commencements have been
followed by decreases in employment. The decline in trade commencements during the 2008—09
downturn is consistent with previous economic downturns in Australia, especially the 1992 recession
(Karmel & Misko 2009). Since 1992, the profile of those in training has changed, with traineeships in
non-trade occupations becoming much more widespread.
We are interested in better understanding the relationship between apprenticeship and traineeship
commencements and employment. We begin by representing quarterly seasonally adjusted
commencement and employment data for the trades (figure 4) and the non-trades (figure 5). Our data
series begins in 1995, the earliest point for which quarterly seasonally adjusted commencement data
are available.
Figure 4 Apprenticeship commencements and total employment in trade occupations (seasonally adjusted), June 1995 — June 2010
Source: ABS (2003, 2010b); NCVER Apprentice and Trainee Collection, June 2010.
0
500
1000
1500
2000
2500
0
5000
10000
15000
20000
25000
Jun 95 Jun 97 Jun 99 Jun 01 Jun 03 Jun 05 Jun 07 Jun 09
Quarter
Trade commencements (LHS)
Trade employment ('000) (RHS)

NCVER 15
Figure 5 Traineeship commencements and total employment in non-trade occupations (seasonally adjusted), June 1995 – June 2010
Source: ABS (2003, 2010b); NCVER Apprentice and Trainee Collection, June 2010.
Looking at the graphs (figures 4 and 5), it appears that changes in apprenticeship commencements
generally precede changes in trades employment by between two and five quarters, whereas changes
in traineeship commencements and non-trades employment occur more or less simultaneously. The
relationship for the non-trades is also affected by the very strong growth in the number of traineeship
commencements between 1998 and 2004, which clearly outstripped growth in non-trades
employment. In figure 4, it is clear that during the most recent downturn apprenticeship
commencements were at their lowest in the first quarter of 2009, whereas trades employment
reached its lowest point in the third quarter of 2009. In another example, at the beginning of the
series, apprenticeship commencements troughed in the third quarter of 1995, but trades employment
bottomed in the second quarter of 1996. After the 2001 slowdown, trades commencements peaked in
the fourth quarter of 2002 before declining for another two quarters. Trades employment would not
reach its corresponding peak until the first quarter of 2004. The impact of the 2008 downturn on
traineeships is harder to discern, because in the quarterly series non-trades employment did not
decline. However, in earlier cycles the employment and commencement trends appear to move more
closely together. For example, the peak in traineeship commencements in the first quarter of 2003
coincided with a peak in non-trades employment.
Logically this makes some sense. Apprenticeships in trade occupations are typically of three or four
years duration. Employers making a decision about whether to employ an apprentice are likely to take
into account the economic conditions over the following years. Traineeships are shorter, usually lasting
less than two years. In addition, legislation in some states gives employers more latitude to terminate
a trainee than an apprentice. Employers of trainees therefore do not need to be so concerned about
the long-range economic conditions, since they are only committing to a contract of one or two years
duration, which in any case they may be able to terminate with deteriorating conditions.
6000
7000
8000
9000
10000
11000
12000
0
10000
20000
30000
40000
50000
60000
Jun 95 Jun 97 Jun 99 Jun 01 Jun 03 Jun 05 Jun 07 Jun 09
Quarter
Non-trade commencements (LHS)
Non-trade employment ('000) (RHS)
Non-trade employment (weighted) ('000) (RHS)

16 Effect of the downturn on apprentices and trainees
However, we need a more rigorous method of identifying the lead or lag effect between
apprenticeship and traineeship commencements and employment. We explain our approach by
starting first with a straightforward model assuming that the number of commencements at time t is a
function of commencements in the previous quarter (t-1) and total employment in trades occupations
at time t.
This gives an equation of the form:
Ct = ρCt-1 + βEt + e
If we assume a steady state of employment, we can rearrange the equation
+ e
and derive the training commencement rate . We perform an ordinary least squares regression,
using quarterly seasonally adjusted data from the third quarter of 1995 to the second quarter of 2010.
To maximise the number of observations available, we use state-level data. Table 4 shows the results
for this model. The model suggests a training commencement rate of 15.3 apprentice
commencements per 1000 employees per quarter.
Table 4 Regression of apprenticeship commencements on trade employment
Model variable Parameter estimate
Standard error
t value
A. Commencements trade (t-1) 0.981 0.010 100.01
Employment trade (t) (‘000s) 0.284 0.107 2.64
R-Square 0.9980 No of observations 440
Source: NCVER Apprentice and Trainee Collection, June 2010; ABS (2003, 2010b).
To explore the impact of a previous or future change in employment, we introduce into the model a
difference term. The difference term for the lag periods is conceptually straightforward and is simply
Et - Et-i. Our initial analysis suggested that there may be an asymmetric relationship between
employment and commencements; namely, that the number of commencements responds more
strongly to a decrease in employment than a similarly sized increase in employment. We therefore
created two difference terms, one where the change in employment was positive and one where the
change in employment was negative.
This gives us the model:
Ct = ρCt-1 + β1Et +β2|Et-Et-i|+ + β3|Et-Et-i|
- + e
Where |Et-Ei|+ is a positive change in employment between period i and period t and |Et-Ei| is a
negative change in employment between period i and period t. We test up to eight quarters before t.
Whereas a lag effect suggests that prospective employers and employees are responding to a known
change in employment, at any given point of time prospective employers and prospective apprentices
do not know what the future employment level will be. They only have expectations of how the
employment level will change into the future. Because we have no data on expectations, we have
little choice but to assume that they are rational and that, on average, people’s expectations about
the future level of employment are correct.

NCVER 17
The lead terms are therefore calculated as Et+i – E:
Ct = ρCt-1 + β1Et +β2|Et+i-Et|+ + β3|Et+i-Et|
- + e
Finally, because it seems that apprenticeship and traineeship commencements are much more sensitive
to changes in economic conditions than employment (at least in the period under examination), we also
include a quadratic term for both positive and negative changes in employment, so that a small change
in employment might lead to a small change in commencements, but a large change in employment
leads to a very large change in commencements. Thus, we arrive at a model:
Ct = ρCt-1 + β1Et +β2|Et±i-Et|+ + β3|Et±i-Et|
- +β4(|Et±i-Et|+)2 + β3(|Et±i-Et|
-)2 + e
We test the effect of a future change in employment up to eight quarters after t. Using this
straightforward approach, we can find the lag that provides the best for the data, with the lowest
residual sum of squares. The inclusion of the quadratic terms is tested using a partial F-test.
All the lag models to t-8 and the lead models to t+8 are presented in appendix A. Since the models
have the same number of parameters and we have ensured that all models use the same number of
observations, we can directly compare their performance using the R2 coefficient. All the lag and lead
models offer a very slight improvement over the original model. The model with the greatest
improvement is the one using employment at time t+4. This conforms to our initial conjecture when
examining figure 4. It suggests that apprentice commencements at any given time take into account
expectations of the demand for trades employment in 12 months time, with an expected decline in
trades employment having a larger effect than an expected increase in trades employment of the
same magnitude. An F-test confirms that the quadratic terms are significant. The coefficients for this
model are shown in table 5. As a verification of the model, we run the analysis again, using Australia-
wide data (data not shown) rather than state-level quarterly data. Using this approach, Ct = ρCt-1 + β1Et +β2|Et+i-Et|
+ + β3|Et+i-Et|- + e is again the model that explains the most variance.
If we assume a steady state of employment,3
Table 5 Regression of apprenticeship commencements against employment and change in employment terms
this produces a commencement rate of 13.0 apprentices
per 1000 trade employees per quarter.
Variable Parameter estimate
Standard error
T Value
Commencements trade (t-1) 0.968 0.009 103.63 Employment trade Et (000s) 0.417 0.101 4.12 Positive change in trade employment Et+4 -E t (000s) 3.243 1.707 1.90 Negative change in trade employment Et+4 -E t (000s) -0.924 2.37 -0.39 Square of positive change in trade employment Et+4 -Et (000s) -0.008 0.044 -0.18 Square of negative change in trade employment Et+4 -Et (000s) -0.189 0.077 -2.45 R Square 0.9983
No of observations 440 Source: NCVER Apprentice and Trainee Collection, June 2010; ABS (2003, 2010b).
3 i.e., Et+ - Et = 0
18 Effect of the downturn on apprentices and trainees
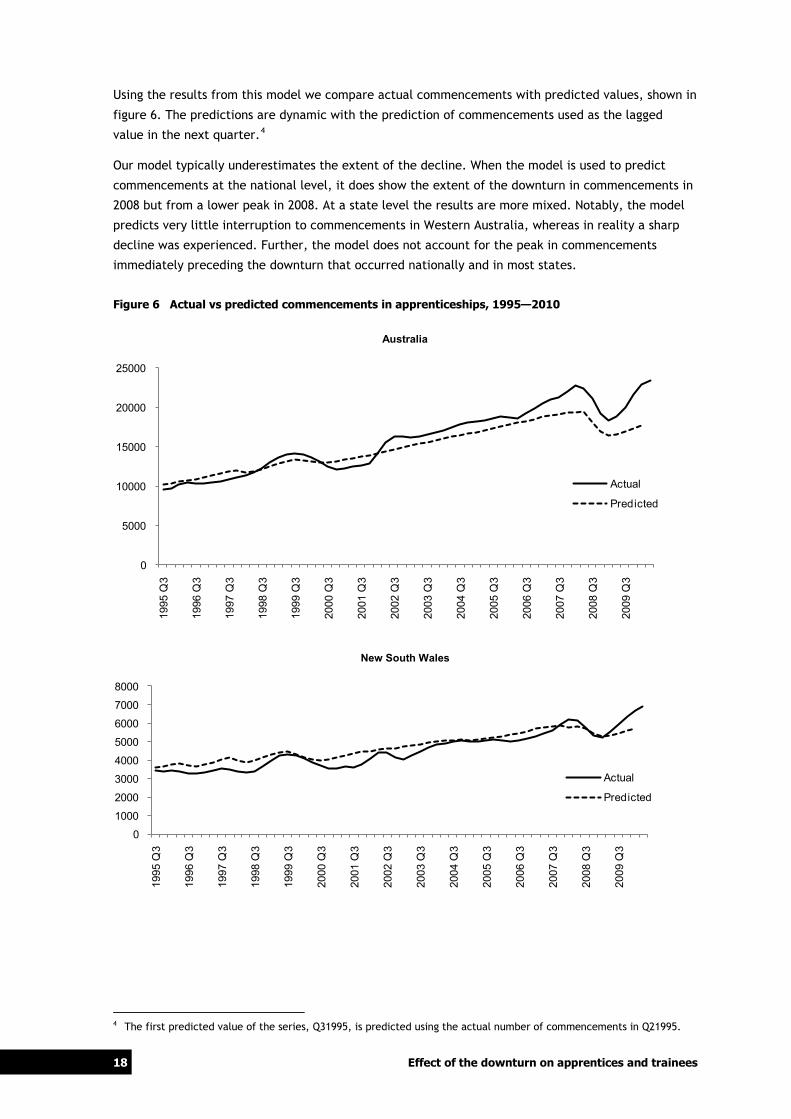
Using the results from this model we compare actual commencements with predicted values, shown in
figure 6. The predictions are dynamic with the prediction of commencements used as the lagged
value in the next quarter.4
Our model typically underestimates the extent of the decline. When the model is used to predict
commencements at the national level, it does show the extent of the downturn in commencements in
2008 but from a lower peak in 2008. At a state level the results are more mixed. Notably, the model
predicts very little interruption to commencements in Western Australia, whereas in reality a sharp
decline was experienced. Further, the model does not account for the peak in commencements
immediately preceding the downturn that occurred nationally and in most states.
Figure 6 Actual vs predicted commencements in apprenticeships, 1995—2010
Australia
New South Wales
4 The first predicted value of the series, Q31995, is predicted using the actual number of commencements in Q21995.
0
5000
10000
15000
20000
25000
1995
Q3
1996
Q3
1997
Q3
1998
Q3
1999
Q3
2000
Q3
2001
Q3
2002
Q3
2003
Q3
2004
Q3
2005
Q3
2006
Q3
2007
Q3
2008
Q3
2009
Q3
Actual
Predicted
0
1000
2000
3000
4000
5000
6000
7000
8000
1995
Q3
1996
Q3
1997
Q3
1998
Q3
1999
Q3
2000
Q3
2001
Q3
2002
Q3
2003
Q3
2004
Q3
2005
Q3
2006
Q3
2007
Q3
2008
Q3
2009
Q3
Actual
Predicted

NCVER 19
Victoria
Queensland
South Australia
0
1000
2000
3000
4000
5000
6000
700019
95 Q
3
1996
Q3
1997
Q3
1998
Q3
1999
Q3
2000
Q3
2001
Q3
2002
Q3
2003
Q3
2004
Q3
2005
Q3
2006
Q3
2007
Q3
2008
Q3
2009
Q3
Actual
Predicted
0
1000
2000
3000
4000
5000
6000
7000
1995
Q3
1996
Q3
1997
Q3
1998
Q3
1999
Q3
2000
Q3
2001
Q3
2002
Q3
2003
Q3
2004
Q3
2005
Q3
2006
Q3
2007
Q3
2008
Q3
2009
Q3
Actual
Predicted
0
250
500
750
1000
1250
1500
1750
2000
1995
Q3
1996
Q3
1997
Q3
1998
Q3
1999
Q3
2000
Q3
2001
Q3
2002
Q3
2003
Q3
2004
Q3
2005
Q3
2006
Q3
2007
Q3
2008
Q3
2009
Q3
Actual
Predicted

20 Effect of the downturn on apprentices and trainees
Western Australia
Tasmania
Northern Territory
0
500
1000
1500
2000
2500
3000
1995
Q3
1996
Q3
1997
Q3
1998
Q3
1999
Q3
2000
Q3
2001
Q3
2002
Q3
2003
Q3
2004
Q3
2005
Q3
2006
Q3
2007
Q3
2008
Q3
2009
Q3
Actual
Predicted
0
100
200
300
400
500
600
700
1995
Q3
1996
Q3
1997
Q3
1998
Q3
1999
Q3
2000
Q3
2001
Q3
2002
Q3
2003
Q3
2004
Q3
2005
Q3
2006
Q3
2007
Q3
2008
Q3
2009
Q3
Actual
Predicted
0
50
100
150
200
250
300
1995
Q3
1996
Q3
1997
Q3
1998
Q3
1999
Q3
2000
Q3
2001
Q3
2002
Q3
2003
Q3
2004
Q3
2005
Q3
2006
Q3
2007
Q3
2008
Q3
2009
Q3
Actual
Predicted

NCVER 21
Australian Capital Territory
Source: Generated from ABS (2003, 2010b) and NCVER Apprentice and Trainee Collection, June 2010.
We repeat the exercise, this time looking at traineeship commencements and employment in non-
trade occupations. Modelling commencements in traineeships between 1995 and 2010 is more
challenging than modelling apprenticeship commencements, because, as figure 5 demonstrates, the
traineeship system experienced exponential growth between 1995 and 2003 as the range of
traineeship occupations expanded and the incentives to employ trainees increased. From 2004
onward, the number of traineeship commencements fluctuated within a much smaller range.
We therefore restrict our analysis to the period 2004—10. Once again we pool the state-level data so
that we have sufficient observations to restrict the analysis to the more recent period after
traineeship commencements stabilised. As before, we weight the non-trade employment data to
reflect the proportion of trainees in each occupational category, using the average proportion
between the third quarter 2003 and the second quarter 2010. This means that changes in the
employment level of managers and professionals, which have proportionately fewer trainees than the
other categories, will be de-emphasised. We set the first quarter of 2004 as the base for this
weighted series.
Table 6 shows the results for this model. The model suggests a training commencement rate of 5.6
trainee commencements per 1000 non-trade employees per quarter. As would be expected, this is
well below the rate for apprentices.
Table 6 Regression of traineeship commencements on trade employment
Variable Parameter estimate
Standard error t value
Commencements traineeships (t-1) 0.957 0.018 53.58 Employment non-trade (t) (‘000s) 0.239 0.101 2.37 R-Square 0.9987
No. of observations 168 Source: NCVER Apprentice and Trainee Collection, June 2010; ABS (2003, 2010b).
We then introduce difference terms into the model to capture more of the dynamics in the
employment situation. We test the same range of lag and lead terms as for trade apprentices. All the
models are summarised in appendix A.
0
50
100
150
200
250
300
350
40019
95 Q
3
1996
Q3
1997
Q3
1998
Q3
1999
Q3
2000
Q3
2001
Q3
2002
Q3
2003
Q3
2004
Q3
2005
Q3
2006
Q3
2007
Q3
2008
Q3
2009
Q3
Actual
Predicted

22 Effect of the downturn on apprentices and trainees
The model that shows the greatest improvement over the basic Ct = ρCt-1 + βEt + e model is the
quadratic model using the t-4 lag. However, in none of the models are the coefficients for the
quadratic terms significant, and an F-test shows that the quadratic model is not significantly better
than the t-4 model with only the difference terms. Further, the t-4 model includes a coefficient with
an unexpected sign: it shows a negative relationship between a positive change in non-trade
employment and traineeship commencements. Therefore, we look to select the best non-quadratic
model that has coefficients with expected signs. This is the model using the five-quarter lag, which
we have shown in table 7.5
Table 7 Regression of traineeship commencements on lagged commencement, employment in non-trade occupations and change in non-trade employment at the state and territory level, 2005—10
Variable Parameter estimate
Standard error
t Value
Commencements non-trade (t-1) 0.950 0.018 0.000
Employment non-trade Et (‘000) 0.291 0.104 0.006
Positive change in non-trade employment (weighted) Et-E t-5 (‘000s) 0.075 0.934 0.936
Negative change in non-trade employment (weighted) Et -E t-5 (‘000s) -6.044 2.42 0.013
R-Square 0.9988
No of observations 168 Source: NCVER Apprentice and Trainee Collection, June 2010; ABS (2003, 2010b).
Figure 7 depicts how well this model does at predicting the change in commencements. Clearly, we
are not able to predict non-trade commencements using employment in non-trade occupations as well
as we were for apprentices. This is mostly attributable to the relatively constant growth in non-trade
employment, even after weighting to take account of the distribution of traineeships. During the
recent downturn there was not a single five-quarter period where non-trades employment declined
Australia-wide, even though there were declines at the state level, since the state-level declines
occurred at different times.
5 A partial F test confirms that the quadratic model for the five-quarter lag is not significantly better than the model
without the quadratic terms.

NCVER 23
Figure 7 Actual and predicted commencements in traineeships, 2004—2010
Australia
New South Wales
Victoria
40000
42000
44000
46000
48000
50000
52000
5400020
04 Q
120
04 Q
220
04 Q
320
04 Q
420
05 Q
120
05 Q
220
05 Q
320
05 Q
420
06 Q
120
06 Q
220
06 Q
320
06 Q
420
07 Q
120
07 Q
220
07 Q
320
07 Q
420
08 Q
120
08 Q
220
08 Q
320
08 Q
420
09 Q
120
09 Q
220
09 Q
320
09 Q
420
10 Q
120
10 Q
2
Actual
Predicted
02000400060008000
100001200014000160001800020000
2004
Q1
2004
Q2
2004
Q3
2004
Q4
2005
Q1
2005
Q2
2005
Q3
2005
Q4
2006
Q1
2006
Q2
2006
Q3
2006
Q4
2007
Q1
2007
Q2
2007
Q3
2007
Q4
2008
Q1
2008
Q2
2008
Q3
2008
Q4
2009
Q1
2009
Q2
2009
Q3
2009
Q4
2010
Q1
2010
Q2
Actual
Predicted
02000400060008000
1000012000140001600018000
2004
Q1
2004
Q2
2004
Q3
2004
Q4
2005
Q1
2005
Q2
2005
Q3
2005
Q4
2006
Q1
2006
Q2
2006
Q3
2006
Q4
2007
Q1
2007
Q2
2007
Q3
2007
Q4
2008
Q1
2008
Q2
2008
Q3
2008
Q4
2009
Q1
2009
Q2
2009
Q3
2009
Q4
2010
Q1
2010
Q2
Actual
Predicted

24 Effect of the downturn on apprentices and trainees
Queensland
South Australia
Western Australia
Source Generated from ABS (2003, 2010b) and NCVER Apprentice and Trainee Collection, June 2010.
0
2000
4000
6000
8000
10000
12000
2004
Q1
2004
Q2
2004
Q3
2004
Q4
2005
Q1
2005
Q2
2005
Q3
2005
Q4
2006
Q1
2006
Q2
2006
Q3
2006
Q4
2007
Q1
2007
Q2
2007
Q3
2007
Q4
2008
Q1
2008
Q2
2008
Q3
2008
Q4
2009
Q1
2009
Q2
2009
Q3
2009
Q4
2010
Q1
2010
Q2
Actual
Predicted
33003400350036003700380039004000410042004300
2004
Q1
2004
Q2
2004
Q3
2004
Q4
2005
Q1
2005
Q2
2005
Q3
2005
Q4
2006
Q1
2006
Q2
2006
Q3
2006
Q4
2007
Q1
2007
Q2
2007
Q3
2007
Q4
2008
Q1
2008
Q2
2008
Q3
2008
Q4
2009
Q1
2009
Q2
2009
Q3
2009
Q4
2010
Q1
2010
Q2
Actual
Predicted
0500
100015002000250030003500400045005000
2004
Q1
2004
Q2
2004
Q3
2004
Q4
2005
Q1
2005
Q2
2005
Q3
2005
Q4
2006
Q1
2006
Q2
2006
Q3
2006
Q4
2007
Q1
2007
Q2
2007
Q3
2007
Q4
2008
Q1
2008
Q2
2008
Q3
2008
Q4
2009
Q1
2009
Q2
2009
Q3
2009
Q4
2010
Q1
2010
Q2
Actual
Predicted

NCVER 25
Tasmania
Northern Territory
Australian Capital Territory
0200400600800
100012001400160018002000
2004
Q1
2004
Q2
2004
Q3
2004
Q4
2005
Q1
2005
Q2
2005
Q3
2005
Q4
2006
Q1
2006
Q2
2006
Q3
2006
Q4
2007
Q1
2007
Q2
2007
Q3
2007
Q4
2008
Q1
2008
Q2
2008
Q3
2008
Q4
2009
Q1
2009
Q2
2009
Q3
2009
Q4
2010
Q1
2010
Q2
Actual
Predicted
0
100
200
300
400
500
600
2004
Q1
2004
Q2
2004
Q3
2004
Q4
2005
Q1
2005
Q2
2005
Q3
2005
Q4
2006
Q1
2006
Q2
2006
Q3
2006
Q4
2007
Q1
2007
Q2
2007
Q3
2007
Q4
2008
Q1
2008
Q2
2008
Q3
2008
Q4
2009
Q1
2009
Q2
2009
Q3
2009
Q4
2010
Q1
2010
Q2
Actual
Predicted
0
200
400
600
800
1000
1200
2004
Q1
2004
Q2
2004
Q3
2004
Q4
2005
Q1
2005
Q2
2005
Q3
2005
Q4
2006
Q1
2006
Q2
2006
Q3
2006
Q4
2007
Q1
2007
Q2
2007
Q3
2007
Q4
2008
Q1
2008
Q2
2008
Q3
2008
Q4
2009
Q1
2009
Q2
2009
Q3
2009
Q4
2010
Q1
2010
Q2
Actual
Predicted
26 Effect of the downturn on apprentices and trainees
Now we move from the aggregate level to the occupational level for commencements and
employment. Initially we examined the aggregate level because it is difficult to generate reliable
seasonally adjusted data at the more detailed occupational level. However, we make use of the
dynamics we observed at the aggregate level. Because the results of the previous section suggest
there are different employment effects for the trades and the non-trades, we plot them separately.
For the change in apprenticeships and traineeships, the downturn covers the period in which
commencements declined, and finishes when they had returned to historical levels (that is,
September quarter 2008 through to December quarter 2009). Our comparison is the period
immediately before the downturn. Once again, to preserve seasonality the comparison period is
September quarter 2007 through to June quarter 2008, with the first two quarters counted twice to
preserve balance. (Seasonally adjusted data are not available at the occupational level.) For trade
occupations, we use the percentage change in employment between February 2010 (approximately
12 months after the middle of the downturn in commencements) and November 2008, 12 months after
the middle of the comparison period.
Figure 8 plots the percentage change in apprenticeship commencements against the change in trades
employment between the respective periods. For the trades, there is a small, positive correlation
(0.29) between the percentage change in employment and the percentage change in apprenticeship
commencements. Most of the trade occupational categories occupy the lower left quadrant. That is,
a decline in apprenticeships accompanied a decline in employment. Included in this group are the
largest trade occupations in terms of apprentice numbers: automotive and engineering and
construction, which together account for approximately half of all apprenticeship commencements.
The other occupations in this quadrant are hairdressing, wood trades workers and textile, clothing
and footwear trades workers. Employment in the food trades recorded a decrease in commencements
between the comparison period and the downturn period and a very small decline in employment. In
three occupations, increases in apprentice commencements during the downturn were followed by
increases in employment. These were skilled animal and horticultural workers, printing trades
workers and engineering, ICT and science technicians. Of these two occupations, skilled animal and
horticultural workers and engineering, ICT and science technicians have quite different
characteristics from the traditional trade occupations, and printing has been in long-term decline.
The other outliers in the lower right quadrant are electrotechnology and telecommunications trades,
which experienced declines in the number of apprenticeship commencements between the
comparison period and the downturn period but which showed increases in employment between
November 2008 and February 2010.

NCVER 27
Figure 8 Change in apprenticeship commencements by change in employment, trade occupations
Sources: NCVER Apprentice and Trainee Collection, June 2010; ABS (2003, 2010b).
Turning now to the non-trade occupations, we plot the percentage change in traineeship
commencements between the downturn period and the reference period against the percentage
change in employment in non-trade occupations between November 2007, five quarters before the
middle of the downturn, and August 2006, five quarters before the middle of the corresponding
growth period. This is following on from the regression results, which indicated that traineeship
commencements were associated with employment in non-trade occupations in the following quarter.
Figure 9 shows there was no overall pattern for the non-trade occupations. Results for the non-trade
occupations are distributed in all four quadrants, without any apparent grouping of occupations at the
one-digit level. The correlation between the percentage change in non-trade employment and the
percentage change in trainee commencements was less than half that for the trades occupations, and
negative (-0.10). This reflects the different labour market dynamics for traineeships compared with
those for apprenticeships (see Cully 2009). Demand for traineeships is not as strongly linked to
demand for employment in non-trade occupations as it is for trade apprenticeships and is confounded
by other factors. While there may be some sort of relationship between commencement numbers and
employment numbers at the aggregate level, this apparent relationship does not hold for the non-
trade occupations when we examine data at the two-digit ANZSCO level.
Eng, IT & Sci Tech
Auto & EngConstruction
Electro
Food
Animal & Hort
Hair
TextileWood
-35.0
-30.0
-25.0
-20.0
-15.0
-10.0
-5.0
0.0
5.0
10.0
-20% -15% -10% -5% 0% 5% 10%
% c
hang
e in
app
rent
ice
com
men
cem
ents
, do
wnt
urn
vs c
ompa
rison
per
iod
% change in employment, Nov 2008 - Feb 2010
Linear (Trades)

28 Effect of the downturn on apprentices and trainees
Figure 9 Change in traineeship commencements by change in employment, non-trade occupations
Sources: NCVER Apprentice and Trainee Collection, June 2010; ABS (2003, 2010b).
In the relationship between commencements and employment, we have observed considerable
variation by occupation, especially in the non-trades. To explore this further, we consider whether
the change in commencements is influenced by the proportion of existing workers taking up
traineeships and, to a lesser extent, apprenticeships. During the downturn, it was suggested that the
subsidies available in the apprenticeship system were used by employers to maintain workers already
in employment. We also find support for this conclusion in the 2010 Apprentice and Trainee
Destination Survey. Among those commencing training in a non-trade occupation, the main reason for
their undertaking the training was that it was recommended by the company (not mandatory), at
31.9% for completers and 32.1% for non-completers, up from 13.7% and 14.3% respectively for 2008
(NCVER 2010, p.9). If this were the case, we would expect to see increases in the proportion of
apprentice and trainee commencements who are existing workers. In figure 10 we see that there has
been an increase in the proportion of existing workers, but those occupations with already high
proportions of existing workers experienced smaller increases. Perhaps this is because of a boundary
effect. For example, if 80% of trainees are existing workers, there is less scope to increase relative to
an occupation in which, say, 40% of trainees are existing workers.
-60.0
-40.0
-20.0
0.0
20.0
40.0
60.0
80.0
-20.0 -10.0 0.0 10.0 20.0 30.0
% c
hang
e in
trai
nee
com
men
cem
ents
, do
wnt
urn
vs c
ompa
rison
per
iod
% change in employment, Aug 2006 - Nov 2007

NCVER 29
Figure 10 Percentage of commencements who are existing workers, downturn vs comparison period
Sources: NCVER Apprentice and Trainee Collection, June 2010.
To tease out whether the characteristics of the occupation can assist our analysis further, we ran a
simple regression. Looking at the two-digit occupational level, we attempted to see whether the
percentage change in commencements between the comparison period in 2007 and the 2008—09
downturn could be explained by the percentage change in employment as well as the characteristics
of apprentices and trainees in the different occupations, including the proportion of existing workers,
the proportion of full-time apprentices, the proportion of female apprentices, the age distribution
and the distribution of the contract duration. However, the results, shown in appendix B, made little
sense, producing a number of curious and unlikely outcomes. Employers’ decisions not to take on new
apprentice and trainee commencements were not consistent with their reactions to changes in
previous downturns, nor is there convincing evidence that the downturn prompted employers of
apprentices and trainees to act in a particular way, such as by prioritising subsidies for existing
workers or favouring occupations with short contract durations.
Instead of examining the number of apprenticeship commencements, Karmel and Mlotkowski (2008)
modelled the impact of labour market conditions on the number of trade apprentices in training,
using annual data from 1967 to 2006. We can use their findings to generate expected values for the
number of trade apprentices and trainees in training, given the changed labour market situations, and
compare them with the actual numbers.
What we can see from the graphs in figure 11 and the summary results in table 8 is that the models
generally over-predicted the number of apprentices and trainees in-training. The only trade which the
model under-predicted was the anomalous printing trade. Its long-term decline means that it is
negatively correlated with total employment. The gap between the actual and predicted numbers is
particularly large for the electrical trades (-20.7%) and the metal and vehicle trades (-13.0%). These
results provide additional evidence that the strong decline in commencements that occurred in
2008—09 was consistent with employers anticipating a decline in employment far worse than this in
reality.
0
20
40
60
80
100
0 20 40 60 80 100
% e
xist
ing
wor
kers
, do
wnt
urn
% existing workers, comparison period
Trades
Non-trade

30 Effect of the downturn on apprentices and trainees
Table 8 Expected and actual numbers of apprentices in training for selected trade occupations, 2009
Expected (’000s)
Actual (’000s)
Difference (%)
Metal & Vehicle 63.3 55.0 -13.0 Electrical 40.3 31.9 -20.7 Building 60.1 53.7 -10.8 Printing 1.3 1.5 12.1 Food 24.4 22.6 -7.5
Notes: Occupations are grouped using ASCO (Australian Standard Classification of Occupations) major headings, for consistency with Karmel and Mlotkowski (2008). Actual values are taken from NCVER Apprentice and Trainee Collection, June 2010, unpublished data. Expected values are calculated using equations presented in Karmel and Mlotkowski (2008), using data from NCVER Apprentice and Trainee Collection, June 2010; ABS (2003, 2010b).
Figure 11 Actual and predicted apprentices in training by trade occupation, 1967—2009
0
10
20
30
40
50
60
70
('000
s)
Year
Metal and vehicle
Actual
Predicted
0
5
10
15
20
25
30
35
40
45
('000
s)
Year
Electrical
Actual
Predicted

NCVER 31
Sources: NCVER Apprentice and Trainee Collection, June 2010; ABS (2003, 2010b).
0
10
20
30
40
50
60
70
('000
s)
Year
Building
Actual
Predicted
0
1
2
3
4
5
6
('000
s)
Year
Printing
Actual
Predicted
0
5
10
15
20
25
30
('000
s)
Year
Food
Actual
Predicted

32 Effect of the downturn on apprentices and trainees
Impact on completion Completions during the downturn will depend on the flow of apprentices and trainees in the system,
which will largely be determined by intakes in the preceding years and completion rates. The major
impact on completions will be in the future, when the diminished cohort who began their training
during the downturn completes their training.
Thus, completion numbers during 2008—09 are mostly a reflection of the economic conditions in the
preceding years, which came at the end of a period of historic growth in the apprentice and trainee
system. For this reason, what we observe is generally an increase in the number of apprentices and
trainees completing their training. Once again comparing the six-quarter downturn period with the
comparison growth period, the number of completions increased by 7.6% for all apprentices and
trainees, with a 12.3% increase for trade occupations and a 5.8% increase for non-trade occupations.
As table 9 shows, the increase was consistent across occupational categories, with the only exceptions
being blue-collar traineeships for machinery operators and drivers and labourers.
Table 9 Number of apprentice and trainee completions
Occupation (ANZSCO — NTIS) group Total completions % change in completions, downturn to growth
periods
Downturn Comparison period
1 Managers 3 891 2 483 56.7 2 Professionals 5 135 2 891 77.6 3 Technicians and trades workers 67 380 59 997 12.3
31 Engineering, ICT and science technicians 2 982 2 345 27.2 32 Automotive and engineering trades workers 18 517 17 016 8.8 33 Construction trades workers 16 842 15 848 6.3 34 Electrotechnology and telecommunications trades workers
10 518 8 122 29.5
35 Food trades workers 5 978 5 522 8.2 36 Skilled animal and horticultural workers 3 033 2 641 14.9 39 Other technicians and trades workers 9 511 8 503 11.9
4 Community and personal service workers 37 820 37 089 2.0 5 Clerical and administrative workers 46 392 42 557 9.0 6 Sales workers 33 616 29 368 14.5 7 Machinery operators and drivers 24 364 27 054 -9.9 8 Labourers 20 760 21 080 -1.5 Non-trades 171 979 162 522 5.8 Total 239 359 222 519 7.6
Source: NCVER Apprentice and Trainee Collection, June 2010.
Where we might expect a more immediate effect of the downturn is on completion rates. The
completion rate reflects the proportion of a cohort who commences an apprenticeship or traineeship
in a given period and who goes on to complete their training at some point in the future. Here we
have conflicting forces, with an increase in apprentices and trainees losing their jobs through
redundancy offset by a reduction in apprentice and trainees leaving their jobs voluntarily as other
employment opportunities dry up. Whether completion rates go up or down is an empirical question,
although Karmel and Misko (2009) argued that they would be more likely to increase, on the basis that
the proportion of apprentices and trainees losing their jobs is relatively small.
NCVER 33
One problem with calculating completion rates is that we need to follow a cohort for a considerable
period of time. In addition, the downturn will impact on a number of cohorts — some at the beginning
of their training, some well into their training and some at the end. We overcome this by estimating
completion rates by applying a life-table approach to cross-sectional data (see Karmel & Mlotkowski
2010). The estimates assume that, as a commencing cohort progresses, the patterns of completions and
cancellations or withdrawals will be the same as those observed in the quarter the cohort commenced.
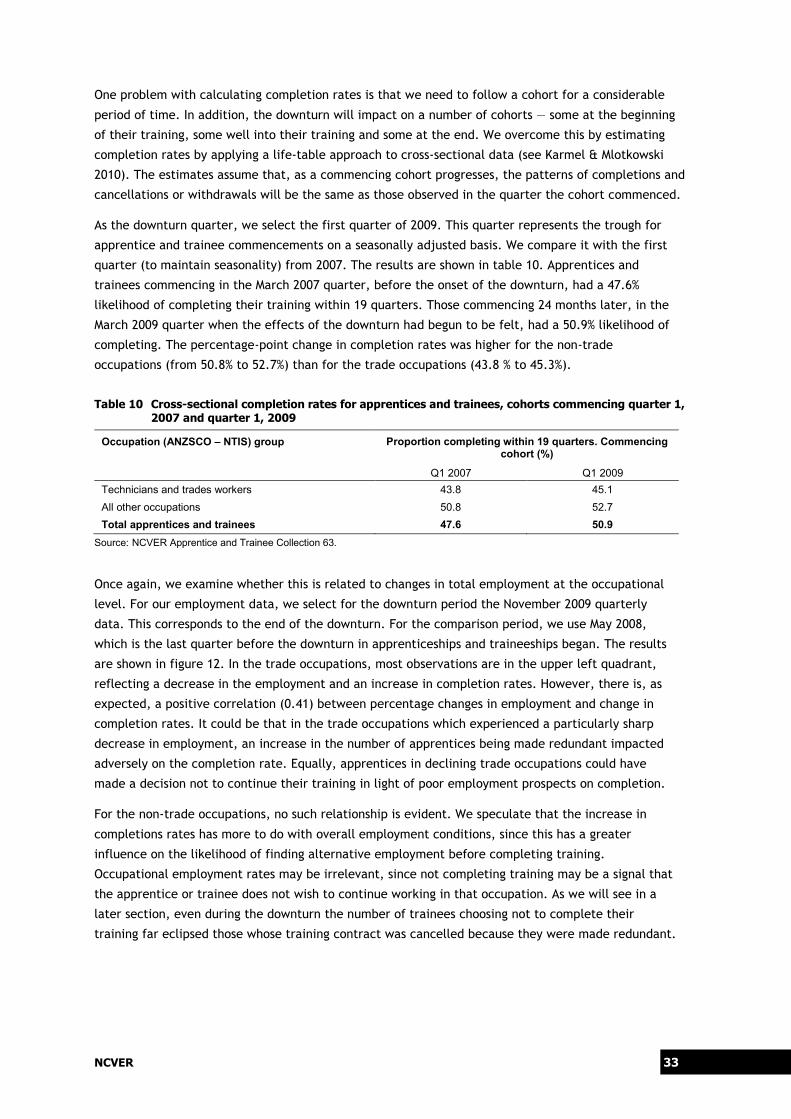
As the downturn quarter, we select the first quarter of 2009. This quarter represents the trough for
apprentice and trainee commencements on a seasonally adjusted basis. We compare it with the first
quarter (to maintain seasonality) from 2007. The results are shown in table 10. Apprentices and
trainees commencing in the March 2007 quarter, before the onset of the downturn, had a 47.6%
likelihood of completing their training within 19 quarters. Those commencing 24 months later, in the
March 2009 quarter when the effects of the downturn had begun to be felt, had a 50.9% likelihood of
completing. The percentage-point change in completion rates was higher for the non-trade
occupations (from 50.8% to 52.7%) than for the trade occupations (43.8 % to 45.3%).
Table 10 Cross-sectional completion rates for apprentices and trainees, cohorts commencing quarter 1, 2007 and quarter 1, 2009
Occupation (ANZSCO – NTIS) group Proportion completing within 19 quarters. Commencing cohort (%)
Q1 2007 Q1 2009 Technicians and trades workers 43.8 45.1 All other occupations 50.8 52.7 Total apprentices and trainees 47.6 50.9
Source: NCVER Apprentice and Trainee Collection 63.
Once again, we examine whether this is related to changes in total employment at the occupational
level. For our employment data, we select for the downturn period the November 2009 quarterly
data. This corresponds to the end of the downturn. For the comparison period, we use May 2008,
which is the last quarter before the downturn in apprenticeships and traineeships began. The results
are shown in figure 12. In the trade occupations, most observations are in the upper left quadrant,
reflecting a decrease in the employment and an increase in completion rates. However, there is, as
expected, a positive correlation (0.41) between percentage changes in employment and change in
completion rates. It could be that in the trade occupations which experienced a particularly sharp
decrease in employment, an increase in the number of apprentices being made redundant impacted
adversely on the completion rate. Equally, apprentices in declining trade occupations could have
made a decision not to continue their training in light of poor employment prospects on completion.
For the non-trade occupations, no such relationship is evident. We speculate that the increase in
completions rates has more to do with overall employment conditions, since this has a greater
influence on the likelihood of finding alternative employment before completing training.
Occupational employment rates may be irrelevant, since not completing training may be a signal that
the apprentice or trainee does not wish to continue working in that occupation. As we will see in a
later section, even during the downturn the number of trainees choosing not to complete their
training far eclipsed those whose training contract was cancelled because they were made redundant.

34 Effect of the downturn on apprentices and trainees
Figure 12 Change in cross-sectional completion rates (March quarter 2007—09) by change in employment (March 2008 – November 2009)
Sources: NCVER Apprentice and Trainee Collection 63; ABS (2003, 2010b).
Anecdotal evidence suggested that in response to the economic downturn employers were making a
conscious effort to sign off trade apprentices and trainees earlier than anticipated rather than having
to terminate their contracts prior to completion. We can use the same completions data to examine
the cumulative completion rate. Looking first of all at the cumulative completion rates for trade
occupations (figure 13), we see a very slight increase of around 1.5 percentage points in the overall
completion rate between 2007 and 2009. We also see a slight increase in the rate of completion,
particularly around 14 quarters (or three-and-a-half years) after commencement. There is a similar
pattern when looking at the cumulative completion rates for non-trade occupations (figure 14). Here,
completion rates for the 2009 downturn cohort have increased by around two percentage points
compared with the cohorts who commenced in the first quarter of 2007.
-10.0
-5.0
0.0
5.0
10.0
15.0
-20.0 -15.0 -10.0 -5.0 0.0 5.0 10.0 15.0 20.0 25.0
perc
enta
ge p
oint
cha
nge
in C
ross
-sec
tiona
l co
mpl
etio
n ra
tes,
coh
orts
com
men
cing
M
ar Q
tr 0
7 -M
ar Q
tr 0
9
% change in employment, May 08 - Nov 09
Trades
Non-trade

NCVER 35
Figure 13 Cumulative completion rates for apprentices and trainees in trade occupations commencing March Quarter 2007 and March quarter 2009
Source: NCVER Apprentice and Trainee Collection 63.
Figure 14 Cumulative completion rates for apprentices and trainees in non-trade occupations commencing March Quarter 2007 and March quarter 2009
Source: NCVER Apprentice and Trainee Collection 63.
0.0
0.1
0.2
0.3
0.4
0.5
Cum
ulat
ive
rate
Quarter ending
2007, Q1
2009, Q1
0.0
0.1
0.2
0.3
0.4
0.5
0.6
Cum
ulat
ive
rate
Quarter ending
2007, Q1
2009, Q1

36 Effect of the downturn on apprentices and trainees
Impact on cancellations and withdrawals It follows that, if we expect more apprentices and trainees to go on to complete their training, there
will be fewer apprentices and trainees who choose not to complete. The lack of alternative
employment opportunities provides a strong incentive to remain in training. However, in a downturn,
this will be offset to an extent by apprentices and trainees who have been made redundant. In the
National Centre for Vocational Education Research (NCVER) administrative collection, anyone who
does not complete their training is recorded as a ‘cancellation’ or in some circumstances (depending
on the state and the time elapsed since commencing the training contract) a ‘withdrawal’. The
reason why the apprentice or trainee did not complete is not recorded. The reasons for non-
completion are collected in the NCVER Apprentice and Trainee Destination Survey, conducted in 2008
and again in 2010. We would therefore expect that the attrition rate would decrease during a
downturn, with redundancies making up a much greater proportion of those remaining cancellations
and withdrawals.
As we observed in the introduction, seasonally adjusted cancellations and withdrawals have been on
the decrease since the economic downturn. Cancellations and withdrawals during the downturn
period were 4.1% lower than during the comparison period. Table 11 shows that among non-trade
occupations the decline was 7.3%, while the number of cancellations and withdrawals among trade
occupations actually increased slightly (0.7%), most likely reflecting the growth in trade apprentices
being made redundant.
Table 11 Change in apprentice cancellations and withdrawals by occupation
Occupation (ANZSCO — NTIS) group Total cancellations & withdrawals
% change in cancellations &
withdrawals, downturn to growth periods
Downturn period
Comparison period
1 Managers 3 075 2 303 33.5 2 Professionals 2 084 2 321 -10.2 3 Technicians and trades workers 77 538 76 972 0.7 31 Engineering, ICT and science technicians 1 782 1 529 16.5 32 Automotive and engineering trades workers 17 389 18 236 -4.6 33 Construction trades workers 21 372 20 543 4.0 34 Electrotechnology and telecommunications trades workers
8 063 7 874 2.4
35 Food trades workers 13 642 14 480 -5.8 36 Skilled animal and horticultural workers 3 118 2 888 8.0 39 Other technicians and trades workers 12 171 11 422 6.6 4 Community and personal service workers 24 917 24 971 -0.2 5 Clerical and administrative workers 26 620 28 514 -6.6 6 Sales workers 26 901 29 326 -8.3 7 Machinery operators and drivers 12 571 15 663 -19.7 8 Labourers 16 144 17 993 -10.3 Non-trades 112 311 121 091 -7.3 Total 189 849 198 063 -4.1
Source: NCVER Apprentice and Trainee Collection 63.

NCVER 37
More meaningful is the decrease in the attrition rate since the downturn began. The cross-sectional
attrition rate is calculated using the same approach as the cross-sectional completion rates. It
represents the proportion of a cohort who commenced an apprenticeship or traineeship in a given
period, who do not complete their training and whose contract is cancelled or withdrawn. The
relevant figures are shown in table 12. The estimated attrition rate for apprentices and trainees
commencing in the March quarter 2007 is 46.3%. For apprentices and trainees who commenced in the
March quarter 2009, it is 43.5%. For the non-trades, the attrition rate declined from 43.3% to 38.6%.
For the trades, there was much less movement, declining from 51.8% to 51.1%.
Table 12 Cross-sectional attrition rates for apprentices and trainees, cohorts commencing quarter 1, 2007 and quarter 1, 2009
Occupation (ANZSCO – NTIS) group Proportion cancelling or withdrawing within 19 quarters Commencing cohort (%)
Q1 2007 Q1 2009 Technicians and trades workers 51.8 51.0 All other occupations 43.3 38.6 Total apprentices and trainees 46.3 43.5
Source: NCVER Apprentice and Trainee Collection 63.
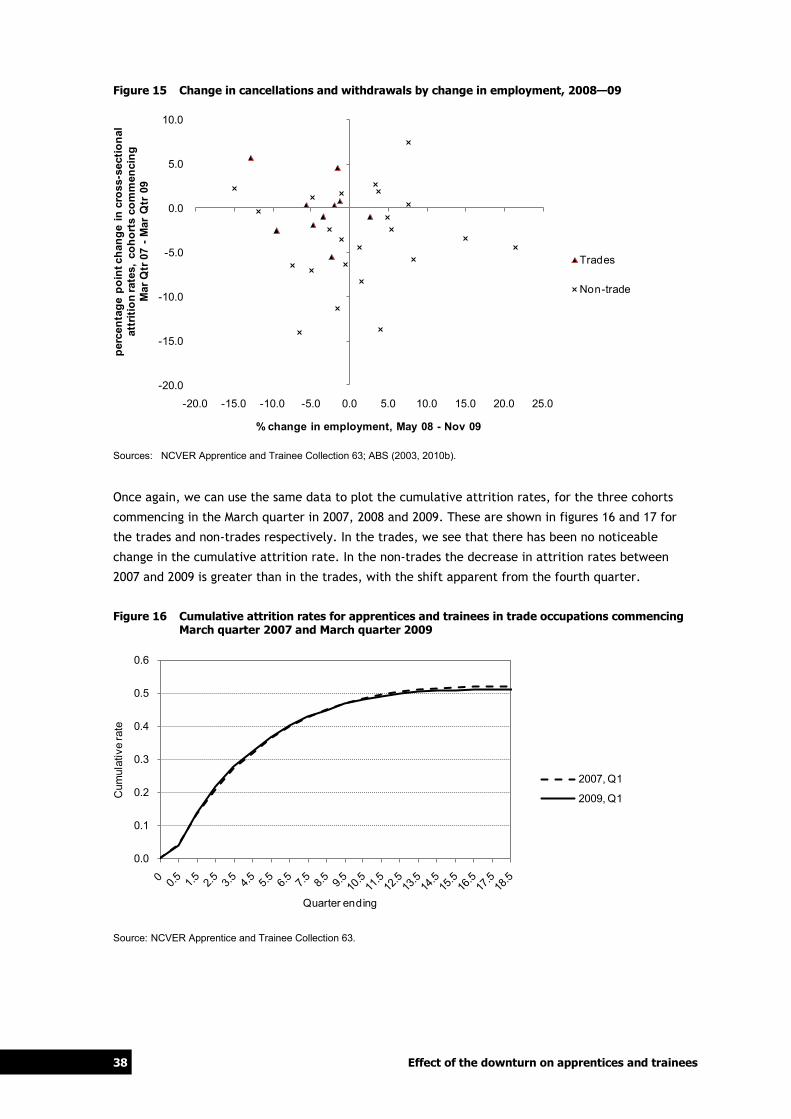
We would expect any relationship between the change in total employment and the change in the
attrition rate to be the same as for the completion rate, except reversed. Figure 15 shows this to be
the case. For the trade occupations, the percentage change in employment is negatively related to
the change in the attrition rate. It is logical for an increase in out-of-trade apprentices to be
accompanied by redundancies among qualified trades workers. For the non-trade occupations, there
is no evident relationship between employment and the attrition rate. However, there is little doubt
that attrition decreased in the majority of cases. It is overall economic conditions that seem to exert
quite a substantial impact on cancellations and withdrawals rather than industry- or occupation-
specific factors. This is consistent with the idea that cancellations and withdrawals, especially in the
non-trades, are driven primarily by the extent of opportunities elsewhere.
38 Effect of the downturn on apprentices and trainees
Figure 15 Change in cancellations and withdrawals by change in employment, 2008—09
Sources: NCVER Apprentice and Trainee Collection 63; ABS (2003, 2010b).
Once again, we can use the same data to plot the cumulative attrition rates, for the three cohorts
commencing in the March quarter in 2007, 2008 and 2009. These are shown in figures 16 and 17 for
the trades and non-trades respectively. In the trades, we see that there has been no noticeable
change in the cumulative attrition rate. In the non-trades the decrease in attrition rates between
2007 and 2009 is greater than in the trades, with the shift apparent from the fourth quarter.
Figure 16 Cumulative attrition rates for apprentices and trainees in trade occupations commencing March quarter 2007 and March quarter 2009
Source: NCVER Apprentice and Trainee Collection 63.
-20.0
-15.0
-10.0
-5.0
0.0
5.0
10.0
-20.0 -15.0 -10.0 -5.0 0.0 5.0 10.0 15.0 20.0 25.0
perc
enta
ge p
oint
cha
nge
in c
ross
-sec
tiona
l at
triti
on ra
tes,
coh
orts
com
men
cing
M
ar Q
tr 0
7 - M
ar Q
tr 0
9
% change in employment, May 08 - Nov 09
Trades
Non-trade
0.0
0.1
0.2
0.3
0.4
0.5
0.6
Cum
ulat
ive
rate
Quarter ending
2007, Q1
2009, Q1

NCVER 39
Figure 17 Cumulative attrition rates for apprentices and trainees in non-trade occupations commencing March Quarter 2007 and March quarter 2009
Source: NCVER Apprentice and Trainee Collection 63.
Between 2008 and 2010, there was a clear change in the reasons for contract cancellations and
withdrawals. Table 13 presents the Apprentice and Trainee Destination Survey results from both years
and shows the main reason for non-completion of an apprenticeship or traineeship. As expected, as
opportunities in the labour market became more restricted, apprentices and trainees stayed with
their contracts of training. In the 2010 survey, fewer were citing reasons such as low pay, poor work
conditions/did not like boss or were unhappy with their training as their reason for leaving.
However, while fewer apprentices and trainees were choosing to leave their training, there was a rise
in the number of cancellations forced upon apprentices and trainees due to the economic downturn,
through redundancy or job loss. Data from the 2010 Apprentice and Trainee Destination Survey, shown
in table 13, shows that 26.8% of non-completers in a trade occupation cited their main reason for non-
completion as job loss or redundancy, up significantly from 9.5% in the 2008 survey. In the
electrotechnology and telecommunication, construction and automotive/engineering trade
occupations, these figures were again higher at 35.5%, 29.1% and 30.2%, respectively. Apprentices and
trainees in non-trade occupations were also affected by job loss and redundancy; cited at 15.2% in
the 2010 survey, up from 7.5% in the 2008 survey.
0.0
0.1
0.2
0.3
0.4
0.5
Cum
ulat
ive
rate
Quarter ending
2007, Q1
2009, Q1

40 Effect of the downturn on apprentices and trainees
Table 13 Main reason for not completing an apprenticeship or traineeship by occupation, 2008 and 2010 (%)
ANZSCO 2008 2010
Job loss or redundancy
Any other reason
Job loss or redundancy
Any other reason
3 Trades and technical workers 9.5 90.5 26.8 73.2 32 Automotive and engineering trades workers
11.3 88.7 30.2 69.8
33 Construction trades workers 6.1 93.9 29.1 70.9 34 Electrotechnology and telecommunications trades workers
15.1 84.9 35.5 64.5
35 Food trades workers 11.5 88.5 12.2 87.8 391 Hairdressers 7.5 92.5 16.1 83.9
Other trades and tech 8.9 91.1 30.4 69.6 Non-trades 7.5 92.5 15.2 84.8 Total apprentices and trainees 8.2 91.8 18.8 81.2
Source: NCVER Apprentice and Trainee Destination Survey, 2008 and 2010.
On the basis of the survey results, we estimate the number of out-of-trade apprentices, using data
from the apprentice and trainee collection (see table 14). Approximately 3366 apprentices and
trainees in trade occupations and 2625 apprentices and trainees in non-trade occupations
discontinued their training because they lost their job or were made redundant between April and
June 2009. To compare, there were 3727 fewer commencements in trade occupations in that quarter
when compared with the June Quarter in 2008 and 7089 fewer commencements in non-trade
occupations. When viewed in isolation, a doubling of the number of out-of-trade apprentices looks
dramatic; however, in context it can be seen as less significant to long-term supply than the decrease
in commencements. What is also clear is that even in the downturn, apprentices and trainees in trade
occupations who decided to leave their training continued to outnumber those who were made
redundant by nearly three to one and the increase in out-of-trade apprentices was more than offset
by the reduction in voluntary cancellations.
Table 14 Number of apprentice and trainee cancellations because of redundancy and other reasons, 2007 and 2009
Reporting period Oct. – Dec. 2007 Apr. – Jun. 2009
Occupation (ANZSCO — NTIS) group Redundant Other reasons
Total Redundant Other reasons
Total
3 Trades and technical workers 1 230 11 748 12 978 3 366 9 190 12 556 32 Automotive and engineering trades workers
349 2 729 3 078
852 1 966 2 818
33 Construction trades workers 210 3 218 3 428 1 001 2 442 3 442 34 Electrotechnology and telecommunications trades workers
196 1 099 1 295 481 876 1 357
35 Food trades workers 294 2 265 2 559 259 1 858 2 117 391 Hairdressers 95 1 169 1 264 179 933 1 112
Other trades and tech 120 1 234 1 354 521 1 190 1 711 Non-trades 1 541 19 058 20 599 2 625 14 677 17 301 Total 2 771 30 806 33 577 5 991 23 867 29 857
Source: NCVER Apprentice and Trainee Destination Survey, 2008, 2010; NCVER Apprentice and Trainee Collection, June 2010.

NCVER 41
Out-of-trade apprentices
Out-of-trade apprentices, those who did not complete their training because of redundancy or job
loss, clearly comprise a more significant group during an economic downturn. The outcomes for trade
apprentices and trainees who did not complete due to job loss or redundancy are shown in table 15.
Compared with trades apprentices who did not complete for other reasons, trade apprentices and
trainees who lost their job or who were made redundant were, approximately nine months after
leaving their training, less likely to be employed, more likely to be unemployed and less likely to be
enrolled in further study (including another apprenticeship or traineeship). However, none of these
differences is statistically significant.
Table 15 Employment and further study outcomes for out of trade apprentices and trainees in trade occupations, (%)
Approximately 9 months after apprenticeship/traineeship
Main reason was job loss or redundancy All other reasons
32 Automotive
& engineering trades
33 Construction
trades
34 Electro-
technology trades
All other trades
workers
3 All trade workers
All trade workers
Employed 68.2 68.7 82.8 64.4 69.6 73.7 Full-time 55.8 57.1 69.1 36.6 52.4 54.4 Part-time 12.4 11.6 13.7 27.8 17.2 19.4
Not employed 31.8 31.3 17.2 35.6 30.4 26.3 Unemployed 24.8 24.8 ** 25.4 23.4 18.8 Not in labour force 7.0 6.5 ** 10.3 7.0 7.5
Employed in same occupation as apprenticeship/traineeship
19.7 20.6 24.4 20.7 21.0 20.3
Enrolled in further study or training 30.1 31.6 46.8 28.6 32.8 36.6 Commenced another apprenticeship or traineeship
16.6 21.0 36.8 14.7 20.4 20.9
Note: **cannot be shown because of insufficient numbers. Source: Apprentice and Trainee Destination Survey 2010.
It would be expected that if training authorities concentrated their efforts on finding new placements
for out-of-trade apprentices, then out-of-trade apprentices would be more likely than other non-
completers in trade occupations to have commenced another apprenticeship. In fact, what we find in
table 16 is considerable wastage. Only one in five apprentices in trade occupations who lost their jobs
or who were made redundant had started another apprenticeship or traineeship. This proportion is
lower than in 2008, but of course, as table 17 demonstrates, the numbers involved are much greater.
The true proportion of out-of-trade apprentices who take up another apprenticeship is somewhat
higher. The sample scope for the Apprentice and Trainee Destination Survey excludes individuals who
stopped their training in the relevant quarter but who commenced another apprenticeship in the
same occupation before the sample was drawn. In the case of the 2010 sample, 4949 clients were
excluded from the pool of 60 973 on this basis. However, these numbers include all apprentices and
trainees who stopped their training, not just those who were made redundant.
As we have seen, the decline in apprentice commencements represents a greater loss to the training
system than the increase in out-of-trade apprentices. Particularly when the number of apprentice
commencements also declines sharply, finding new training places for out-of-trade apprentices is
destined to be a challenge. It may be that allowing out-of-trade apprentices to continue their training
in an institutional setting is the only way to substantially reduce the wastage.

42 Effect of the downturn on apprentices and trainees
Table 16 Proportion of non-completing apprentices who commence another apprenticeship or traineeship, by reason for non-completion, 2008 and 2010 (%)
2008 2010
Job loss or redundancy
Any other reason
Job loss or redundancy
Any other reason
Undertaking another apprenticeship or traineeship 24.4 19.9 20.4 20.9 Related to the type of training in the initial apprenticeship of traineeship
13.7 9.6 12.0 7.9
Not related to the type of training in the initial apprenticeship of traineeship
10.7 10.3 8.4 13.0
Not undertaking another apprenticeship or traineeship
75.6 80.1 79.6 79.1
Source: NCVER Apprentice and Trainee Destination Survey, 2008, 2010; NCVER Apprentice and Trainee Collection, June 2010.
Table 17 Number of out-of-trade apprentices who return to training, 2008 and 2010
Occupation (ANZSCO — NTIS) group 2008 2010
Number made redundant
Number who return
Number made redundant
Number who return
3 Trades and technical workers 1230 301 3366 688 32 Automotive and engineering trades workers
349 ** 852 142
33 Construction trades workers 210 ** 1001 210 34 Electrotechnology and telecommunications trades workers
196 ** 481 177
All other trades and technical workers 475 ** 1032 151 Note: ** There are too few responses to report detail at the two-digit occupational level in 2008. Source: NCVER Apprentice and Trainee Destination Survey, 2008, 2010; NCVER Apprentice and Trainee Collection, June 2010.

NCVER 43
Final comments The apprenticeship and traineeship system experienced a considerable shock as a result of the recent
economic downturn, with a sharp decline in commencements during the second half of 2008 and the
first half of 2009. By comparison, the effect of the downturn on employment was not as severe.
Ultimately, the downturn was short-lived and, given how quickly commencements returned to their
pre-downturn level, completions should also exceed pre-downturn levels once most of the cohort who
commenced in 2008—09 completes its training in 2012—13.
Because of the rapid rebound in apprenticeship commencements, the impact of the downturn on the
skilled labour force will be minimal. Karmel and Rice (2010) forecast employment numbers in the
trade occupations, taking into account the change in apprenticeship commencement numbers but
assuming that occupational and apprentice attrition rates remain the same. On that basis, they
conclude that the shock in commencements will reduce the supply of tradespeople by less than 1%
compared with the counterfactual situation of no decline in commencements. As figure 18 shows, this
represents a ‘once and for all’ change in the supply of tradespeople.
Figure 18 Long-term impact of the decline in commencements, all trades
Source: Karmel and Rice (2010, p.43).
Even at the more detailed occupational level, the interruption to supply is relatively minor. In the
larger trades — automotive and engineering, construction, and electrotechnology and
telecommunications trades workers — the impact ranges between 1.5% and 2.2 % (Karmel & Rice
2010, p.44).
On balance, we are left with the observation that employers initially anticipated a more severe
downturn than actually occurred but the apprentice and trainee system recovered quickly, without
incurring a significant loss of capacity. Ultimately, it is the economy’s quick return to growth that will
impose greater demands on the apprentice and trainee system.
1500
1525
1550
1575
1600
1625
1650
1675
1700
1725
2007 2008 2009 2010
Empl
oyed
('00
0)
YearScenario 1: Actual Scenario 2: Counterfactual

44 Effect of the downturn on apprentices and trainees
References ABS (Australian Bureau of Statistics) 2003, Employed persons by sex, occupation, state, status in
employment, Aug. 1986 to May 1996, cat.no.6291.0.55.003, ABS, Canberra. ——2010a, Australian national accounts: national income, expenditure and product, cat.no.5206.0, ABS,
Canberra. ——2010b, Employed persons by sex, occupation, state, status in employment, August 1996 onwards,
cat.no.6291.0.55.003, ABS, Canberra. ——2010c, Labour force status by sex, cat.no.6202.0, ABS, Canberra.
Cully, M 2009, Youth wages, training wages and productivity: the economic activity of traineeships, Australian Fair Pay Commission, Melbourne.
Kapuscinski, C 2001, Apprenticeships and traineeships in Australia in the last three decades: an empirical overview of the evidence, Department of Education, Training and Youth Affairs, Canberra.
Karmel, T & Misko, J 2009, Apprenticeships and traineeships in the downturn, NCVER, Adelaide.
Karmel, T & Mlotkowski, P 2008, Modelling the trades: an empirical analysis of trade apprenticeships in Australia, 1967—2006, NCVER, Adelaide.
Karmel, T & Mlotkowski, P 2010, Estimating apprentice and trainee completion and attrition rates using a ‘life tables’ approach, NCVER, Adelaide.
Karmel, T & Rice, J 2010, The economics of apprenticeship and traineeships, NCVER, Adelaide.
NCVER (National Centre for Vocational Education Research) 2010, Australian vocational education and training statistics: apprentice and trainee destinations 2010, NCVER, Adelaide.
Treasury 2009, Mid-year economic and fiscal outlook 2009—2010. Canberra.

NCVER 45
Appendix A Table A1 Comparison of regression models testing apprentice commencements against lagged
commencements, trade employment and change in trade employment
Definition of change in employment terms Residual sum of squares
Model without quadratic terms Model with quadratic terms Et Et-8 6 146 922 6 121 702 Et Et-7 6 178 689 6 123 090 Et Et-6 6 171 805 6 156 509 Et Et-5 6 124 871 6 115 679 Et Et-4 6 155 653 6 132 822 Et Et-3 6 128 725 6 100 147 Et Et-2 6 107 650 6 015 986 Et Et-1 6 112 656 6 074 278 Et +1 Et 6 185 274 6 150 138 Et +2 Et 6 058 902 5 965 034 Et +3 Et 5 578 347 5 558 285 Et +4 Et 5 226 694 5 155 136 Et +5 Et 5 290 865 5 282 900 Et +6 Et 5 580 767 5 511 960 Et +7 Et 5 805 040 5 673 293 Et +8 Et 5 942 232 5 837 915
F-test on models, Et +4 Et, apprentice commencements
Model N No. of par
Residual sum squares
F score
sig
Full model with all difference and sq difference terms 440 6 5 155 136 Without square terms 440 4 5 226 694 3.012 0.050
Full model with all difference and sq difference terms 440 6 5 155 136 Restricted model with only employment at t 440 2 6 194 335 21.872 0.000

46 Effect of the downturn on apprentices and trainees
Table A2 Comparison of regression models testing trainee commencements against lagged commencements, trade employment and change in non-trade employment
Definition of change in employment terms Residual sum of squares
Model without quadratic terms Model with quadratic terms Et Et-8 13 826 018 13 811 237 Et Et-7 13 665 807 13 342 422 Et Et-6 13 867 977 13 760 608 Et Et-5 13 434 502 13 201 769 Et Et-4 12 233 505 12 190 651 Et Et-3 12 595 102 12 208 055 Et Et-2 13 142 358 13 015 063 Et Et-1 13 858 818 13 782 114 Et +1 Et 12 964 353 12 719 153 Et +2 Et 13 482 117 13 278 982 Et +3 Et 13 564 098 13 329 592 Et +4 Et 13 698 319 13 358 140 Et +5 Et 13 327 970 13 154 058 Et +6 Et 13 526 428 12 906 504 Et +7 Et 13 813 655 13 417 067 Et +8 Et 13 740 634 13 236 197
F-test on models, Et Et-5, trainee commencements
Model N No of par
Residual sum squares
F score
sig
Full model with all difference and sq difference terms 168 6 13 201 769 Restricted model without square terms 168 4 13 434 502 1.428 0.243
Full model with difference terms 168 4 13 434 502 Restricted model with only employment at t 168 2 14 068 652 3.871 0.023

NCVER 47
Appendix B Table B1 Regression results for change in apprentice and trainee commencements by occupation
Regression results Coefficient Standard error
T-value Sig
Intercept -57.398 18.632 -3.08 0.061 Percentage change in employment between comparison period and downturn period*
-0.171 0.354 -0.48 0.638
% Existing workers, comparison period 0.256 0.336 0.76 0.466 % Female, comparison period 0.095 0.176 0.54 0.803 % Part-time, comparison period 0.163 0.245 0.67 0.927 Age, comparison period % 19 years and under Reference category % 20 to 24 years 1.757 0.685 2.56 0.019 % 25 years and over -0.252 0.308 -0.82 0.099 Duration, comparison period % Less than 1 year 0.303 0.393 0.77 0.810 % Over 1 and up to 3 years 0.452 0.346 1.3 0.193 % Over three years Reference category Note: *The comparison and downturn periods for employment are based on a lead of 4 quarters for trade occupations and a lag
of 5 quarters for non-trade occupations. Source: NCVER Apprentices and Trainees Collection; ABS (2003, 2010b).
Table B2 Model summary for regression of change in apprentice and trainee commencements by occupation
Source DF Sum of squares Mean square F value Pr > F
Model 8 5 717.021 714.628 1.610 0.165 Error 29 12 878.928 444.101 Corrected Total 37 18 595.949 R-Square: Coeff Var: Root MSE: Mean of Per change commencements: 0.307 -663.785 21.074 -3.175
Table B3 F-test results for change in apprentice and trainee commencements by occupation
N No of par
Residual sum squares
F score
df1 df2 Sig value
A Expanded model with age and duration blocks
38 8 12 878.9
B Restricted model with no age block
38 6 16 129.6 3.786 2 36 0.032
C Restricted model with no duration block
38 6 14 726.8 2.152 2 36 0.131

National Centre for Vocational Education Research Ltd
Level 11, 33 King William Street, Adelaide, South Australia
PO Box 8288, Station Arcade, SA 5000 Australia
Telephone +61 8 8230 8400 Facsimile +61 8 8212 3436
Website www.ncver.edu.au Email [email protected]