Effect of Stacking Fault Energy on Microstructure and ...
49
Effect of Stacking Fault Energy on Microstructure and Texture Evolution in Ni-Co Alloys during Severe Plastic Deformation by High Pressure Torsion Elango C A Dissertation Submitted to Indian Institute of Technology Hyderabad In Partial Fulfillment of the Requirements for The Degree of Master of Technology Department of Materials Science and Engineering June, 2013
Transcript of Effect of Stacking Fault Energy on Microstructure and ...

Effect of Stacking Fault Energy on Microstructure and Texture
Evolution in Ni-Co Alloys during Severe Plastic Deformation by
High Pressure Torsion
Elango C
A Dissertation Submitted to
Indian Institute of Technology Hyderabad
In Partial Fulfillment of the Requirements for
The Degree of Master of Technology
Department of Materials Science and Engineering
June, 2013
ii
Declaration
I declare that this written submission represents my ideas in my own words, and where others’ ideas or
words have been included, I have adequately cited and referenced the original sources. I also declare that I
have adhered to all principles of academic honesty and integrity and have not misrepresented or fabricated
or falsified any idea/data/fact/source in my submission. I understand that any violation of the above will be
a cause for disciplinary action by the Institute and can also evoke penal action from the sources that have
thus not been properly cited, or from whom proper permission has not been taken when needed.
(Signature)
Elango C
MS11M02
iii

iv
Acknowledgements
I am extremely indebted a lot to my supervisor Dr. Pinaki Prasad Bhattacharjee, Head of the
Department, Department of Material Science and Engineering, IIT Hyderabad for his excellent
guidance, constructive criticism, valuable suggestions, encouragement and support throughout the
research work.
I extremely also grateful to Prof. Koichi Tsuchiya and their students at Microstructure Design
Group, NIMS Japan.for performing the High Pressure Torsion processing.
I am thankful to Dr. Suhash Ranjan Dey, IIT Hyderabad for providing enough experimental
materials for the research purpose and my Faculty Advisor Dr.Ranjith Ramadurai for generous
assistance regarding enrollment without that I would not have joined IIT Hyderabad.
I would like to thank Mr.Zaid, Mr.Jagga and Mr Dan, PhD scholars at IIT Hyderabad for leading
their valuable time to help me in doing the experimental work, and also Mr.Mohit, PhD student
at Kyoto University for his suggestions in writing the thesis and preparing for presentations.
I would like to thank all the faculty members, research scholars, my classmates and juniors in
Department of Materials Science and Engineering for keeping me active and provide an excellent
atmosphere for doing the research, filled with fun and joy and also a memorable life for me at IIT
Hyderabad.
I would like thank MHRD, Government of India for their financial assistance in the form of
scholarship and financial assistance of Council of Scientific and Industrial Research (CSIR) in the
form of project is acknowledged.
I would also like to thank my B.Tech batchmates Mr.Vivekananda, Mr.Dinesh Kumar who
helped me to apply here at the last moment and Mr Senthil Kumar, Mr Loganathan also for
their moral support.
Last but not least I would like to pay high regards to my brother Mr. Vijaya Sarathi who
shouldered all the family responsibilities, which made me free enough to pursue my interest and
also for his selfless support for my studies. I am grateful to my parents for their love, blessings and
support along with consistent encouragement for my studies in difficult times.

v
Dedicated to
My Uncle Sekar E and
My Brother Vijayasarthi C

vi
Abstract
The effect of stacking fault energy on microstructure, micro texture and hardness evolution
in Ni-Co alloys during severe plastic deformation by high pressure torsion was studied in the
present work. For this purpose a series of Ni-Co alloys have been chosen as model alloy systems
with composition of Ni-20%Co, Ni-40%Co and Ni-60%Co with decreasing stacking fault
energies. These alloys were severe deformed by high pressure torsion (HPT) at room temperature
to different number of rotations (N), namely, N=1/12, 1/4, 1/8, 1/2, 1, 3, 5 and 10 under an applied
load of 5GPa.
The microstructure shows strong presence of low angle boundaries at lower strain levels.
However with increasing the number of rotations (N) the grain size refines and finally an ultrafine
structure formation with high fraction of high angle grain boundaries (~80%) is observed
throughout the HPT processed disks have been observed. The finest grain size along with
remarkable microstructural and hardness homogeneity was achieved in the Ni-60Co alloy having
the lowest SFE amongst the three Ni-Co alloys after N=10 rotations. Hardness homogeneity,
however, could not be achieved in the other two Ni-Co alloys even at this strain level. This clearly
demonstrated the profound effect of lowering of SFE on the evolution of homogeneity in HPT
processed disks.
In all the three alloys the ideal shear orientations the A/A-, A* and C-component were
dominant at lower rotations. As number of rotations increased the texture gradually became weak
in Ni-20%Co. In Ni-60%Co though strong presence of A/A-, A* and C-component were observed
at lower strain and with increase in imposed strain both A/A- and A* became dominant whereas
the C-component was found to become weaker. The microtexture evolution in Ni-40%Co was
found to be somewhat in-between those of Ni-20%Co and Ni-60%Co as it showed significant
presence of C-component as in the case of Ni-20%Co but could not be observed in Ni-60%Co.The
fraction of A/A- and A* was higher similar to the case Ni-60%Co alloys but these component
decreased with increase in imposed strain as was the case of Ni-20%Co. The shear orientations
B/B- usually observed during torsional deformation was present in HPT processing but rather weak
which was a significant difference with conventionally torsion processed materials.

vii
Nomenclature
SPD-Severe Plastic Deformation
UFG-Ultra Fine Grained Material
HPT-High Pressure Torsion
N-Number of Rotations
SFE –Stacking Fault Energy
FCC-Face Center Cubic
ECAP-Equal Channel Angular Pressing
ARB-Accumulate Roll Bonding
NS-Nanostructured Materials
EDM –Electric Discharge Machine
XRD-X-ray Diffraction
FEG-SEM- Field Emission Gun equipped Scanning Electron Microscope
EBSD-Electron Back Scattered Diffraction
Ѳmis -Misorientation Angle
HAGBs-High Angle Grain Boundaries
LAGBs-Low Angle Grain Boundaries
Ѳ-Shear Direction
R-Radial Direction
Z-Shear Plane Normal
Hv-Vicker’s Hardness
GB maps-Grain Boundary Maps
GBCD-Grain Boundary Characters Distribution
PFs-Pole Figures
ODF-Orientation Distribution Function
TEM-Transmission Electron Microscope
TBs-Twin Boundaries

viii
Contents
Declaration……………...…………………………………….…………………............................ii
Approval Sheet………………….…………...……………....……………………………………...iii
Acknowledgements……………………..……………………………………..….…………….....iv
Abstract…………………………………..……………….……………………….….…………..…..vi
Nomenclature……………………..………………………………………………………..………....….viii
1 Introduction……………………….……………………………………….……………………...……..1
1.1 Overview……………………………………………………………………………...….…………1
1.2 Objective and scope …………..………….………………………………...….………...….……...3
2 Literature Review…………………………………….….………………….........................…………4
3 Experimental Procedure………………………………………………………………...…...……….8
3.1 Preparation of sample Disks for HPT…………………………….……………...………………....8
3.2 Severe Plastic Deformation (SPD) Processing………...……….…………………………....……..9
3.2.1 High pressure Torsion Processing…………………….……………………………..……............9
3.3 Characterization……………………………..………………………….....………........…………..9
3.3.1 Characterization of starting materials for HPT….………………..…….……………...…...........9
3.3.2 Characterization of HPT Processed Disks……………...….…………..………..……...….…......9
3.3.2.1 Hardness Test………………………………………………...……..…….……...….……10
3.3.2.2 Microstructural and Textural Characterization…….….…….…………………..……….10
3.4 Flow chart of experimental procedure.......…………………………………………………..........11
4 Experimental Results……………...……………………………………….………..………………….12
4.1 Starting materials characterization…...…………….…………………………………..…..………...12
4.1.1 X-Ray diffraction pattern starting materials Ni-Co alloys………………...................................12
4.1.2 Microstructure and microtexture............................……………………………….……………..13
4.1.3 Hardness Test…………………………………………………………………….…….…..........14

ix
4.2 Microstructure evolution in HPT Processed Ni-Co alloys…………………..…………………...….14
4.2.1 Microstructure evolution in Ni-20%Co during HPT……………………..……………………...14
4.2.2 Microstructure evolution in Ni-40%Co during HPT………………………………..…………...16
4.2.3 Microstructure evolution in Ni-60%Co during HPT…….…….................................…………...18
4.3 Microtexture evolution in HPT Processed Ni-Co alloys………..…....................................….……...20
4.4 Evolution of hardness in Ni-Co alloys during HPT………….....……………………...……..............25
5 Discussion……………………….……………………….………...........................................................27
5.1 Evolution of microstructure and hardness properties……………………………………………….27
5.2 Evolution of texture…………………………………………………………………………………31
6 Summary and Conclusion…………………………………………………………………………...…35
References……………………………………………………………………………………………….36

1
Chapter 1
Introduction
1.1 Overview
Nanostructured materials are fabricated by two different methods which are termed as the
bottom up and top down approach. In the ‘‘bottom-up” approach, the bulk solids are fabricated
through the assembly of individual atoms or nanoparticles solids [1]. Examples are inert gas
condensation [2], electrodeposition [3] and ball milling followed by subsequent consolidation [4].
These approaches have the capability of producing materials with exceptionally small grain sizes
but they also suffer from disadvantages of getting contaminated and having residual porosity. In
contrast, in ‘‘top-down” approach, a bulk solid with a relatively coarse starting grain size is
processed to refine the grain size to achieve bulk ultrafine or nanostructured materials by
imposition of very high strain [1] . As top down processed rely basically on heavy plastic
deformation, these processes assume the generic term severe plastic deformation (SPD)
processing. Formally, SPD processing is defined as any method of metal forming under that may
be used to impart a very high strain to a bulk solid without the introduction of any significant
change in the overall dimensions of the sample and also have the ability to produce exceptional
grain refinement [1]. Examples of top-down approach includes equal-channel angular pressing
(ECAP) [5], accumulative roll-bonding (ARB) [6] and high-pressure torsion (HPT) [7].
Figure 1.1: Schematic of severe plastic deformation processes with (a) equal-channel-angular pressing, (b)
torsion straining, and (c) accumulative roll-bonding [1].
(a) (b) (c)

2
Amongst many SPD processes, HPT is most suitable for achieving extremely high plastic
strain is a range of materials. In the HPT process, a sample in the form of thin disk is placed
between two anvils and is subjected to very high compressive force and simultaneous torsion
strain.
(a) (b)
Figure 1.2: (a) Schematic of HPT processing [7] (b) Equivalent strain as a function of the number of revolutions for
different distances from the center of the HPT disks [8]
The amount of equivalent shear strain imposed (ϵ) can be determined from the following
equation
Where r= radius of the disk in mm, h=thichness of the disk in mm and Ф= angle of rotation in
radian
The equivalent strain increases linearly as the radius of the disk is increased under same
processing conditions. As strain induced is varied, hence, microstructure evolution is also
inhomogenous. Nevertheless the heterogeneity in microstructure could be overcome gradually by
increasing the strain (i.e angle of rotation)[9]. The linear variation of strain is also beneficial for
understanding deformation mechanism and nanostructure formation in materials.
It might be noted that while the SPD processing are quite successful in fabricating ultrafine
(≤ 1μm) to nanostructured materials (grain size< 100nm) [10], however, the fundamentals
understanding concerning the formation of nanostructure (NS) and ultrafine grained (UFG) is not
yet clear. It is well known that intrinsic properties like SFE, solute atoms, initial grain size, grain

3
size distribution etc. and extrinsic properties like deformation methods/modes, temperature, strain
rate plays major role in nanostructure formation [11]. From conventional deformation processing
it has now been understood that stacking fault energy (SFE) and solution hardening plays key role
in microstructure formation and mechanical properties of the materials. Recent investigations on
HPT processed Cu-Zn alloys suggest that SFE by alloying have important role in achieving
nanostructure and enhanced mechanical properties with improved strength and ductility [12].
However, further studies are needed to fully understand these effects.
In the present work a series of Ni-Co alloys are chosen as a model alloys and severe plastically
deformed by HPT. In Ni-Co alloy system, addition of Co to Ni decreases the SFE without
appreciable amount of solution hardening so nanostructure formation is affected primarily by SFE
[13, 14]. It is envisaged that a detailed understanding of the microstructure formation in these
alloys will be helpful in understanding the effect of SFE on the evolution of ultrafine to
nanostructure during SPD processing.
1.2 Objective and Scope
The objectives of the present work is:
To evaluate the effects of stacking fault energy on the evolution of microstructure, texture
and mechanical properties during severe plastic deformation by high pressure torsion.
The present work is envisaged to contribute to design and develop advanced bulk nanostructured
materials with enhanced mechanical properties by tailoring SFE.
4
Chapter 2
Literature review
Stacking fault energy(SFE) plays crucial role on the evolution of microstructure and texture
which has been well established in conventional deformation processing of materials. For
examples high stacking fault energy materials like high purity aluminum, cross slip and recovery
are rather easy. As a consequence heavily deformed microstructure of aluminum shows subgrain
structures with sharp sub-grain boundaries, whereas, deformed low stacking fault energy materials
like austenitic stainless steel, silver etc., reveal typical cell structure with high dislocation density
[15]. Also SFE is an important factor to determine deformation mechanisms; additional
deformation modes such as twinning may become important in case of low SFE materials which
in turn can affect the microstructure and texture development [15]. Thus, in recent times clarifying
the effects on the evolution of microstructure and texture during SPD processing has gained
considerable attention [16-21].
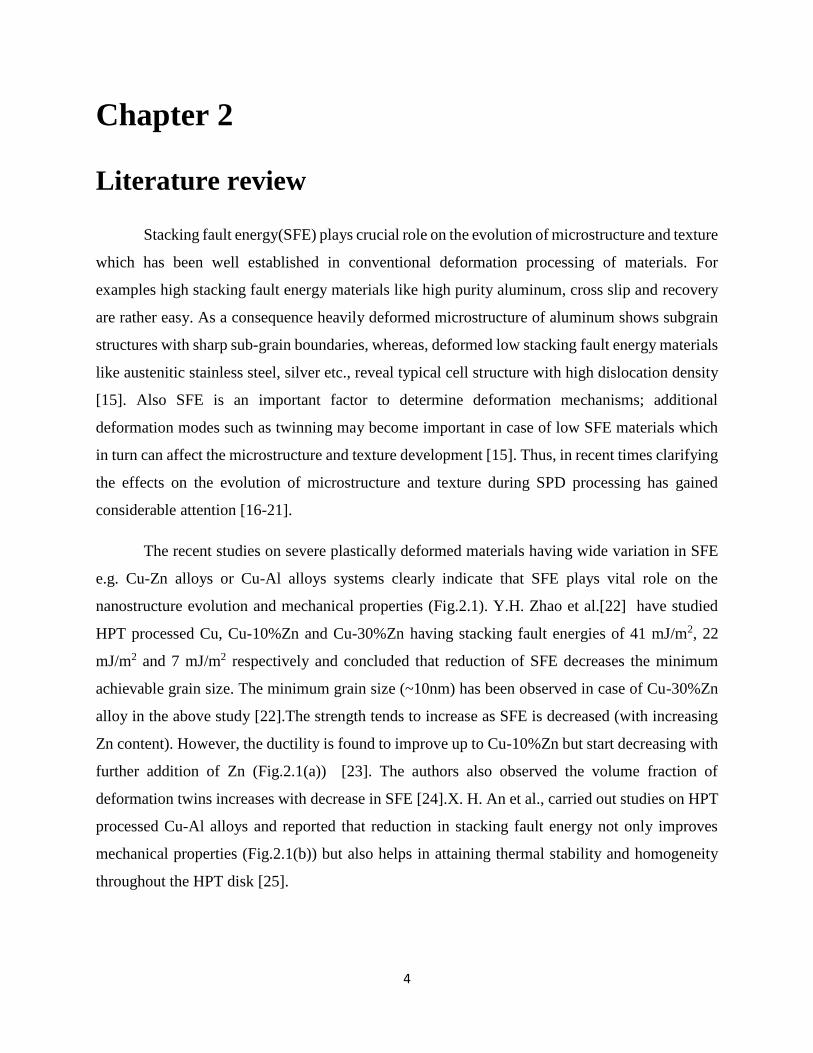
The recent studies on severe plastically deformed materials having wide variation in SFE
e.g. Cu-Zn alloys or Cu-Al alloys systems clearly indicate that SFE plays vital role on the
nanostructure evolution and mechanical properties (Fig.2.1). Y.H. Zhao et al.[22] have studied
HPT processed Cu, Cu-10%Zn and Cu-30%Zn having stacking fault energies of 41 mJ/m2, 22
mJ/m2 and 7 mJ/m2 respectively and concluded that reduction of SFE decreases the minimum
achievable grain size. The minimum grain size (~10nm) has been observed in case of Cu-30%Zn
alloy in the above study [22].The strength tends to increase as SFE is decreased (with increasing
Zn content). However, the ductility is found to improve up to Cu-10%Zn but start decreasing with
further addition of Zn (Fig.2.1(a)) [23]. The authors also observed the volume fraction of
deformation twins increases with decrease in SFE [24].X. H. An et al., carried out studies on HPT
processed Cu-Al alloys and reported that reduction in stacking fault energy not only improves
mechanical properties (Fig.2.1(b)) but also helps in attaining thermal stability and homogeneity
throughout the HPT disk [25].

5
Fig 2.1 Engineering stress strain curve of (a) HPT processed Cu-Zn alloys [24] (b) HPT processed Cu-Al alloys showing
strength and ductility of materials increase with decrease in stacking fault energy [25]
In Cu-Zn and Cu-Al alloys presence of Zn or Al, respectively, also leads to appreciable
amount of solution hardening with concurrent decrease in the stacking fault energy due to
significant difference in atomic size, elastic moduli and shear moduli in these alloy systems. Due
to this, the specific role of stacking fault energy on nanostructure evolution and mechanical
properties is not possible to understand clearly.
Fig.2.2 Engineering stress–strain curves for both Ni–40 wt.% Co alloy and Ni–65 wt.%Co alloy[26].
In order clarify this, Sun et al. have studied Ni-Co alloys systems where addition of Co to
Ni has minimum solid solution hardening effect but significantly reduce the SFE. The HPT
processed and rolled Ni-65%Co show increase in both strength and ductility in comparison to

6
Ni-40%Co alloy (Fig.2.2) which is attributed to the increase in amount of dislocation density and
deformation twins [26]. However, the evolution of texture due to HPT processing was not
investigated.
From perspective of evolution of texture, SFE also plays an important role. During
conventional deformation the high stacking fault energy materials leads to pure metal or copper
type texture and low stacking fault energy materials form alloy type texture or brass type texture
(Fig.2.3) [27,28]. Texture transition from copper type to brass type texture with decreasing
stacking fault energy is considered an important effect of SFE [26-30]. It thus clearly indicates that
the strong correlation between deformation mechanism and texture evolution. However, such
inter-relationship between textural changes and microstructure evolution with decrease in stacking
fault energy is yet to be understood clearly at very high strain levels such as those encountered
during SPD processing.
Fig 2.3. {111} Pole figures showing the rolling textures of: (a) pure Ni; (b) Ni-10% Co; (c) Ni 20% Co ; ( d) Ni 30% Co(e)
Ni~,40% Co; and (f) Ni~60% Co[28].

7
The brief but critical literature review show that stacking fault energy have major role on
the evolution of microstructure texture evolution and mechanical properties no systematic studies
have been done so far to establish the microstructure-texture-property relationship which constitute
the major focus of this work.

8
Chapter 3
Experimental Procedure
3.1 Preparation of sample Disks for HPT
A series of Ni-Co alloys with composition of Ni-20%Co, Ni-40%Co and Ni-60%Co were
used in this present study. Initially these alloys were in the form of plate with dimension
90Lx27Wx5T mm, these plates were then cold rolled up to 1mm in thickness (~80%) by multipass
rolling and subsequent annealing was done at 600°C for 1hr for Ni-20%Co, Ni-40%Co and 700°C
for 1hr for Ni-60%Co. Using Wire-cut EDM, small disks of diameter 10mm were produced from
the annealed sheets. These small disks were then thinned down to ~0.85mm thickness by polishing
on SiC papers with grit size varying from 1000 to 2000. Figure 3.1 shows the flow diagram of
disks preparation for High Pressure Torsion processing.
Fig.3.1.Flow diagram of Disk preparation for HPT Processing
As received Ni-Co alloys
90Lx27
wx5
T mm
Multipass cold rolling to 1Tmm
(80% Reduction)
Annealing Ni-20%Co and Ni-40%Co at 600°C for 1hr
Ni-60%Co at 700°C for 1hr
Disks of 10mm diameter (Wire-Cut EDM)
Thinning down thickness to
~0.85mm
Disks for HPT Processing

9
3.2 Severe Plastic Deformation (SPD) Processing
3.2.1 High pressure Torsion Processing
These small disks were severe plastically deformed by HPT to 1/12, 1/8, 1/2, 1, 3, 5 and
10 numbers of turns(N) with an imposed load of 390KN(~5GPa ) with a rotation speed of 1 rpm
at quasi-constrained conditions[31]. The HPT straining were done at room temperature and
temperature raise recorded during straining was less than 70°C. The HPT Processing was carried
out at Research Center for Strategic Materials, National Institute for Materials Science, Japan.
Figure 3.2 represents schematic diagram of HPT Processing.
Fig.3.2: .Schematic illustration of a set up for HPT-straining [32].
3.3 Characterization
3.3.1 Characterization of starting materials for HPT
The starting materials from which small disks were prepared for high pressure torsion was
characterized by X-ray diffraction (PANalytical, Xpert Pro) in order to find out the change in
lattice parameter due to Co additions. Metallography studies was carried out to determine the
average grain size using mechanical polishing followed by etching in solution of 5g FeCl3,
15mLHCl, 60mL methanol for 15s. Vicker’s microhardness test (EMCO-TEST, Dura Scan-70)
were also carried out to determine the average hardness of the starting materials by applying a load
of 500g and dwell time of 15s.
10
3.3.2 Characterization of HPT Processed Disks
3.3.2.1 Hardness Test
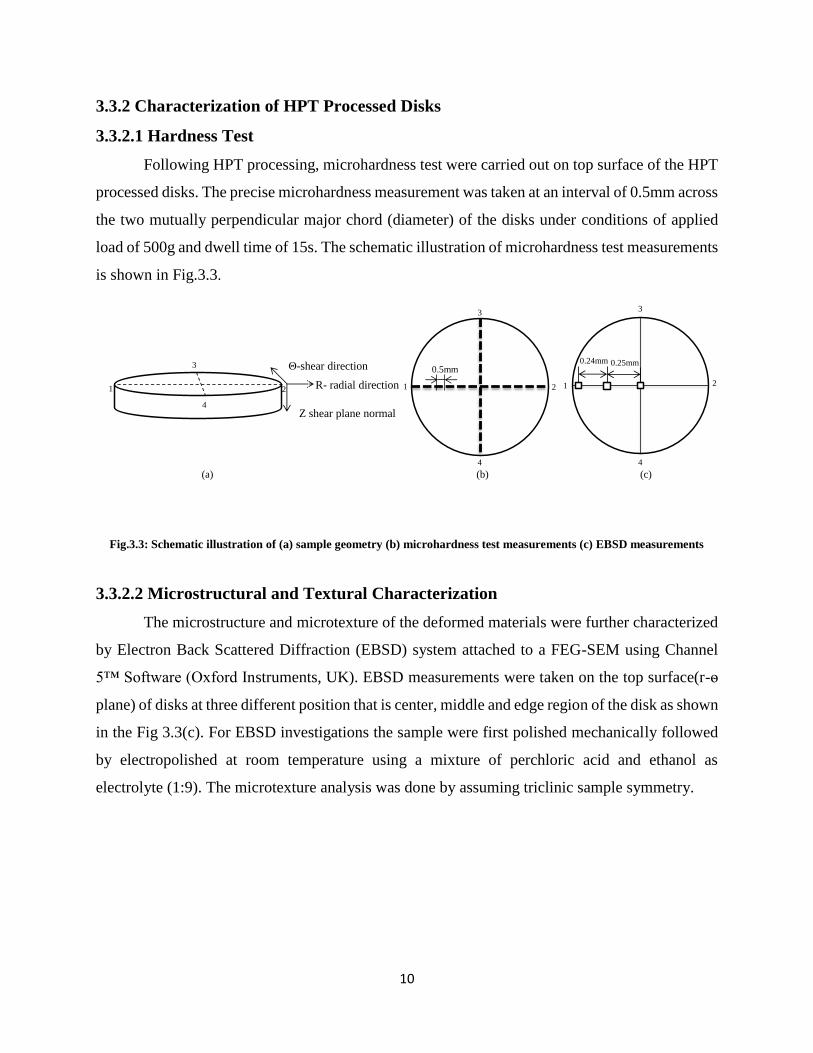
Following HPT processing, microhardness test were carried out on top surface of the HPT
processed disks. The precise microhardness measurement was taken at an interval of 0.5mm across
the two mutually perpendicular major chord (diameter) of the disks under conditions of applied
load of 500g and dwell time of 15s. The schematic illustration of microhardness test measurements
is shown in Fig.3.3.
Fig.3.3: Schematic illustration of (a) sample geometry (b) microhardness test measurements (c) EBSD measurements
3.3.2.2 Microstructural and Textural Characterization
The microstructure and microtexture of the deformed materials were further characterized
by Electron Back Scattered Diffraction (EBSD) system attached to a FEG-SEM using Channel
5™ Software (Oxford Instruments, UK). EBSD measurements were taken on the top surface(r-ѳ
plane) of disks at three different position that is center, middle and edge region of the disk as shown
in the Fig 3.3(c). For EBSD investigations the sample were first polished mechanically followed
by electropolished at room temperature using a mixture of perchloric acid and ethanol as
electrolyte (1:9). The microtexture analysis was done by assuming triclinic sample symmetry.
3
2
4
1
0.5mm0.25mm0.24mm
3
2
4
1
4
Θ-shear direction
R- radial direction
Z shear plane normal
1 2
3
(a) (c)(b)

11
3.4. Flow chart of experimental procedure
The complete experimental procedure flow chart is represented in Fig.3.4
Fig.3.4.Schematic illustration of experimental flow chart

12
Chapter 4
Experimental Results
4.1 Starting materials characterization
4.1.1. X-Ray diffraction pattern starting materials-Ni-Co alloys
The X-ray diffraction (XRD) pattern of the starting materials is shown in Fig.4.1. The XRD
pattern shows that the three Ni-Co alloys remain as single phase alloys with FCC crystal structure.
Also there is no significant changes in the 2Ѳ position of the peaks with increasing Co addition.
Fig.4.1: XRD pattern of starting materials for HPT disk-Ni-Co alloys
20 40 60 80 100 120
-200
0
200
400
600
800
1000
1200
Inte
nsity
Ni-20Co
Ni-40Co
Ni-60Co
(111)
(200)
(220)
(311)
13
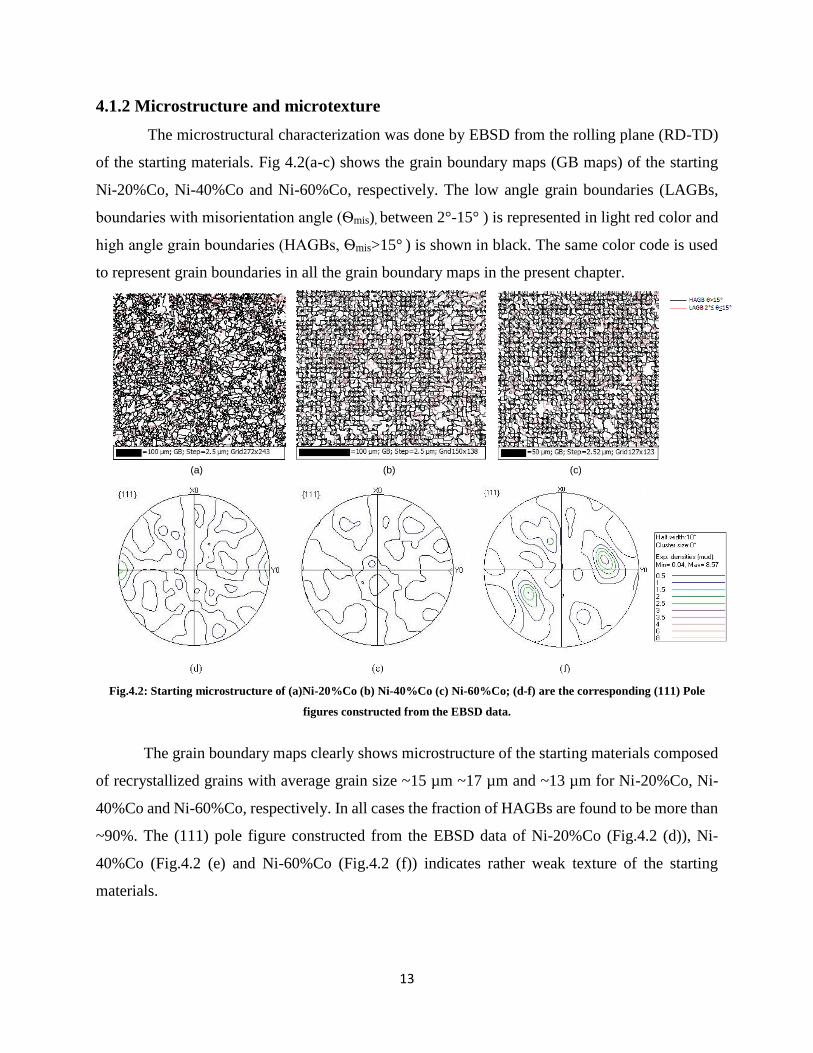
4.1.2 Microstructure and microtexture
The microstructural characterization was done by EBSD from the rolling plane (RD-TD)
of the starting materials. Fig 4.2(a-c) shows the grain boundary maps (GB maps) of the starting
Ni-20%Co, Ni-40%Co and Ni-60%Co, respectively. The low angle grain boundaries (LAGBs,
boundaries with misorientation angle (Ѳmis), between 2°-15° ) is represented in light red color and
high angle grain boundaries (HAGBs, Ѳmis>15° ) is shown in black. The same color code is used
to represent grain boundaries in all the grain boundary maps in the present chapter.
Fig.4.2: Starting microstructure of (a)Ni-20%Co (b) Ni-40%Co (c) Ni-60%Co; (d-f) are the corresponding (111) Pole
figures constructed from the EBSD data.
The grain boundary maps clearly shows microstructure of the starting materials composed
of recrystallized grains with average grain size ~15 µm ~17 µm and ~13 µm for Ni-20%Co, Ni-
40%Co and Ni-60%Co, respectively. In all cases the fraction of HAGBs are found to be more than
~90%. The (111) pole figure constructed from the EBSD data of Ni-20%Co (Fig.4.2 (d)), Ni-
40%Co (Fig.4.2 (e) and Ni-60%Co (Fig.4.2 (f)) indicates rather weak texture of the starting
materials.
(a) (b) (c)

14
4.1.3 Hardness Test
The Vickers’s micro hardness test result of the starting materials is show in the Fig.4.3.The
average hardness value is determined from 15 individual readings taken at an interval of 500µm
with applied load of 500gm and dwell time 15s.The average microhardness of Ni-20%Co, Ni-
40%Co and Ni-60%Co is ~ 99Hv, ~121Hv and ~100Hv in respectively. The microhardness value
of Ni-40%Co is slightly higher than Ni-20%Co and Ni-60%Co.
Fig.4.3. Microhardness values of starting materials Ni-Co alloys
4.2. Microstructure evolution in HPT Processed Ni-Co alloys
4.2.1 Microstructure evolution in Ni-20%Co during HPT
The GB maps of HPT processed Ni-20%Co alloy are shown in Fig.4.4. Figure.4.5
summarizes the evolution of key structural parameters during HPT processing. At low number of
rotation N=1/12, recrystallized grains could still be observed at the center (r/ro ~0). In contrast, at
the middle and edges regions (r/ro ~0.5 and r/ro ~ 1 respectively) significant amount of grain
fragmentation and refinement are observed. The fraction of LAGBs is increased. For N=1/2, the
grains are refined significantly down to ~570nm and ~300nm near the middle and edge regions,
respectively. The fraction of HAGBs increases to ~45% and 58% at the middle and edge regions,
Ni-20%Co Ni-40%Co Ni-60%Co
50
60
70
80
90
100
110
120
130
140
150
Mic
roh
ard
ne
ss,H
v
Alloys

15
respectively. At N=1, the center regions still consist of high fraction of LAGBs with average grains
size ~1.35 µm, but at the middle and edge regions (that is r/ro ~ 0.5 and r/ro ~ 1) the grain size
further decrease to ~260nm and ~200 nm, respectively. The grains also become equiaxed. Beyond
this deformation level, no appreciable changes in the boundary characters or grain size could be
observed near the edge or middle regions indicating that the middle and edge regions of the disk
becomes homogenous with grain size ~240-200nm, fraction of HAGBs is ~81% and average
misorientation angle is ~34°. However, at the center region the grain size continues to decrease
further with increasing deformation. At center region (r/ro ~0) the average grain size is around
~870nm after 1 complete rotation. As the number of rotation increases to 10, at the center region
the average grain size decreases to ~530nm having HAGB fraction of ~55% which is still evidently
coarser as compared to middle or edge regions at the same deformation level.
Fig.4.4: (a) Grain boundary Maps of Ni-20%Co during HPT at r/r˳~0, r/r˳ ~ 0.5 and r/r˳ ~1 for different numbers of
rotations (N) 1/12,1/2,1,5 and 10.

16
Fig.4.4: (b) Grain boundary characters variation (grain size, fraction of HAGBs and average misorientation angle in
Ni-20%Co at r/r˳~ 0, r/r˳~ 0.5 and r/r˳ ~ 1 with increasing number of rotations (N).
4.2.2 Microstructure evolution in Ni-40%Co during HPT
The evolution of microstructure and structural parameters during HPT processing of Ni-
40%Co is shown in Fig.4.5 (a) and 4.5(b), respectively. For N=1/12 rotation, recrystallized grains
are present near the center region. Near the middle and edge regions (at ro/r ~0.5 and ro/r ~1
respectively) higher fraction of LAGBs could be observed indicating the development of cell
structure.
For N=1, the microstructure becomes homogenous between ro/r ~0.5 and ro/r ~1 with equi-
axed grain size of ~160nm and ~140nm, respectively. The fraction of HAGBs at these two
locations are found to be ~72% and ~79% respectively, whereas at ro/r ~0 (center region) well
developed cell structures are observed with 43% fraction of HAGBs and the grain size is refined
to ~630nm. At N=5, appreciable increase in grain size to ~190nm and ~160nm with increase
HAGBs fraction to 84% and 81% is observed near the middle and edge regions, respectively,
possibly resulting from the presence of elongated grains in the direction of shear. In the center
region the grain refinement still continues, grains become reasonably homogenous in nature and
some grains are smaller in size than the average grain size (~340nm). At N=10, grain size is
reduced significantly to ~250nm at the center region which is lower that the value observed in the
Ni-20%Co alloy at the same deformation level.
0
500
1000
1500
2000
2500
3000
3500
4000
4500
5000
5500
Gra
in s
ize,
(nm
)
Location in the Disk
N=1/12
N=1/2
N=1
N=5
N=10
r/r0~0 r/r
0~0.5 r/r
0~1
0.0
0.1
0.2
0.3
0.4
0.5
0.6
0.7
0.8
0.9
1.0
Frac
tion
of H
AG
Bs
Location in the Disk
N=1/12
N=1/2
N=1
N=5
N=10
r/r0~0 r/r
0~0.5 r/r
0~1
0
10
20
30
40
50
Ave
rage
Mis
orie
ntat
ion
angl
e
Location in the Disk
N=1/12
N=1/2
N=1
N=5
N=10
r/r0~0 r/r
0~0.5 r/r
0~1

17
Fig.4.5 (a) Grain boundary Maps of Ni-40%Co during HPT at r/r˳~ 0, r/r˳~ 0.5 and r/r˳~ 1 for different numbers of
rotations (N) 1/12, 1/2, 1, 5 and 10.
Fig.4.5 (b) Grain boundary characters variation (grain size, fraction of HAGBs and Average misorientation angle) in
HPT Ni-40%Co at r/r˳ ̴ 0, r/r˳ ~ 0.5 and r/r˳ ~ 1 with increase in number of rotations (N)
0
500
1000
1500
2000
2500
3000
Gra
in s
ize,
(nm
)
Location in the Disk
N=1/12
N=1/2
N=1
N=5
N=10
r/r0~0 r/r
0~0.5 r/r
0~1
0.0
0.1
0.2
0.3
0.4
0.5
0.6
0.7
0.8
0.9
1.0
Frac
tion
of H
AG
Bs
Location in the Disk
N=1/12
N=1/2
N=1
N=5
N=10
r/r0~0 r/r
0~0.5 r/r
0~1
0
10
20
30
40
50
Ave
rage
Mis
orie
ntat
ion
angl
e
Location in the Disk
N=1/12
N=1/2
N=1
N=5
N=10
r/r0~0 r/r
0~0.5 r/r
0~1
18
4.2.3 Microstructure evolution in Ni-60%Co during HPT
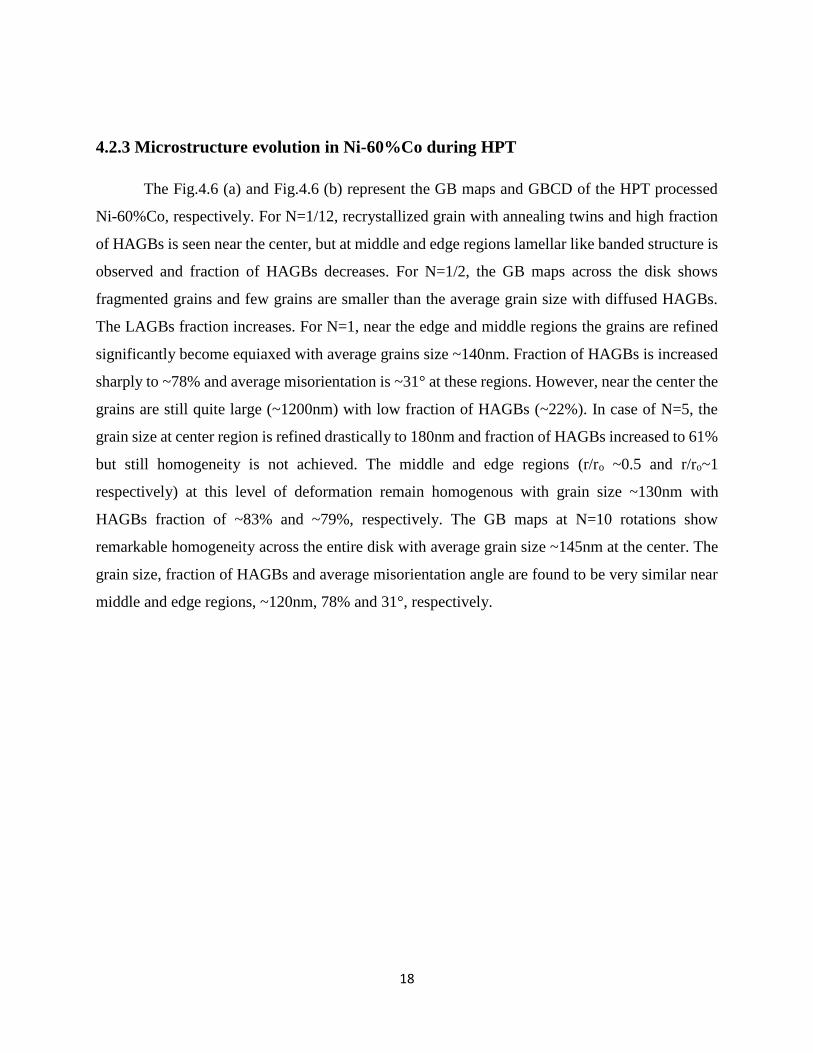
The Fig.4.6 (a) and Fig.4.6 (b) represent the GB maps and GBCD of the HPT processed
Ni-60%Co, respectively. For N=1/12, recrystallized grain with annealing twins and high fraction
of HAGBs is seen near the center, but at middle and edge regions lamellar like banded structure is
observed and fraction of HAGBs decreases. For N=1/2, the GB maps across the disk shows
fragmented grains and few grains are smaller than the average grain size with diffused HAGBs.
The LAGBs fraction increases. For N=1, near the edge and middle regions the grains are refined
significantly become equiaxed with average grains size ~140nm. Fraction of HAGBs is increased
sharply to ~78% and average misorientation is ~31° at these regions. However, near the center the
grains are still quite large (~1200nm) with low fraction of HAGBs (~22%). In case of N=5, the
grain size at center region is refined drastically to 180nm and fraction of HAGBs increased to 61%
but still homogeneity is not achieved. The middle and edge regions (r/ro ~0.5 and r/ro~1
respectively) at this level of deformation remain homogenous with grain size ~130nm with
HAGBs fraction of ~83% and ~79%, respectively. The GB maps at N=10 rotations show
remarkable homogeneity across the entire disk with average grain size ~145nm at the center. The
grain size, fraction of HAGBs and average misorientation angle are found to be very similar near
middle and edge regions, ~120nm, 78% and 31°, respectively.

19
Fig.4.6 (a) Grain boundary Maps of Ni-60%Co during HPT at r/r˳~ 0, r/r˳~ 0.5 and r/r˳~ 1 for different numbers of
rotations (N) 1/12, 1/2, 1, 5 and 10
Fig.4.6 (b) Grain boundary characters variation of Ni-60%Co during HPT at r/r˳~ 0, r/r˳~ 0.5 and r/r˳~ 1 for different
numbers of rotations (N) 1/12, 1/2, 1, 5 and 10
0
500
1000
1500
2000
2500
3000
3500
Gra
in s
ize,
(nm
)
Location in the Disk
N=1/12
N=1/2
N=1
N=5
N=10
r/r0~0 r/r
0~0.5 r/r
0~1
0.0
0.1
0.2
0.3
0.4
0.5
0.6
0.7
0.8
0.9
1.0
Frac
tion
of H
AG
Bs
Location in the Disk
N=1/12
N=1/2
N=1
N=5
N=10
r/r0~0 r/r
0~0.5 r/r
0~1
0
10
20
30
40
50
Ave
rage
Mis
orie
ntat
ion
angl
e
Location in the Disk
N=1/12
N=1/2
N=1
N=5
N=10
r/r0~0 r/r
0~0.5 r/r
0~1
N=1/12 N=1/2 N=1 N=5 N=10
r/ro ̴ 0
r/ro ̴ 1
r/ro ̴ 0.5
r
Ѳ

20
4.3. Microtexture evolution in HPT Processed Ni-Co alloys
The texture components in fcc materials during torsional straining are described in terms
of two different fibers namely {111} <uvw> and {hkl} <110>, where <uvw> represents set of
directions parallel to shear direction and {hkl} set of planes parallel to shear plane[33].The major
ideal shear orientation observed in torsional deformation of FCC materials are listed in Table.1
[34].
Table.1 Ideal shear orientation components in fcc materials during torsional deformation.
The grain orientation maps of the HPT processed Ni-Co alloys are show in the Fig.4.7 (a)
and the variation of volume fraction of different components with number of rotations or imposed
strain is shown in Fig.4.7 (b). In Ni-20%Co alloy among ideal shear orientations the A/A-, A* and
C-component are the strong components. Here as the number of rotations or imposed strain is
increased the fraction of A/A- and A* decreases whereas the fraction of the C component increases,
but overall the volume fractions of these components decrease with increase in number of
rotations. It might be noted that B- one of the ideal shear orientations observed during torsional
deformation is present but it doesn’t vary significantly with increase in imposed strain. In Ni-
40%Co at N=1/12, strong presence of A/A- and A* (~11%) could be noticed, followed by the C-
component (~5%). However, the B- orientation is rather weak (~2%). For N=1/2, fraction of A*
decreases and no significant variation could be observed in the volume fraction of the A, B and C
Shear Components {hkl}<uvw>
A/A-
{1-1-1}<110>
{-111}<-1-10>
A*
{-1-11}<112>
{11-1}<112
B/B-
{-112}<110>
{1-1-2}<-1-10>
C {001}<110>

21
components. Further increasing the number of rotations the fraction of A/A- and C components
decrease and that of the A* increases only slightly. At N=10, grain orientation maps becomes more
random in nature with strong presence of A/A- and A* orientations (~ 9%).
Fig.4.7: (a) Grain orientation maps of Ni-Co alloys at edge regions (r/ro ̴ 1 ) for different numbers of rotation(N) 1/12, 1/2
1,5, and 10.
In case of Ni-60%Co, at N=1/12 the A/A- (~12%), A*(~6%) and C-components (~8%) are
the strong components. The B/B-orientation (~2%) is rather weak. The A/A- and C-component
decreases to ~6% and ~2% following N=1/2. Increasing the number of rotations further the fraction
of A/A- and A* increases continuously and no changes in fraction of C is observed. The fraction
of B/B- is ~2% upto N=1/2 and is increased to ~4% at N=1, further increase in fraction of B/B-
decreases. Though the fraction of B/B-component is less, but new component {110} <1-10>
belong to B fiber {hkl} <110> is observed with volume percentage of ~ 5% and ~6% at N=1/2 and
N=5, respectively.
Component Color
A
A¯
A*
A*
B
B¯
C
{110}<1-10>
{001}<100>

22
The microtexture of Ni-40%Co appears to be in between the Ni-20%Co and Ni-60%Co
alloys as it shows significant presence of C-component as seen in Ni-20%Co, but it is not observed
in Ni-60%Co. The fraction of A/A- and A* is higher similar to the Ni-60%Co alloys but these
component is found to decrease with increase in strain as in the case of Ni-20%Co alloy.
Fig.4.7: (b) Volume fraction of ideal shear texture components at edge regions for different numbers of rotations (N)
in Ni-Co alloys.
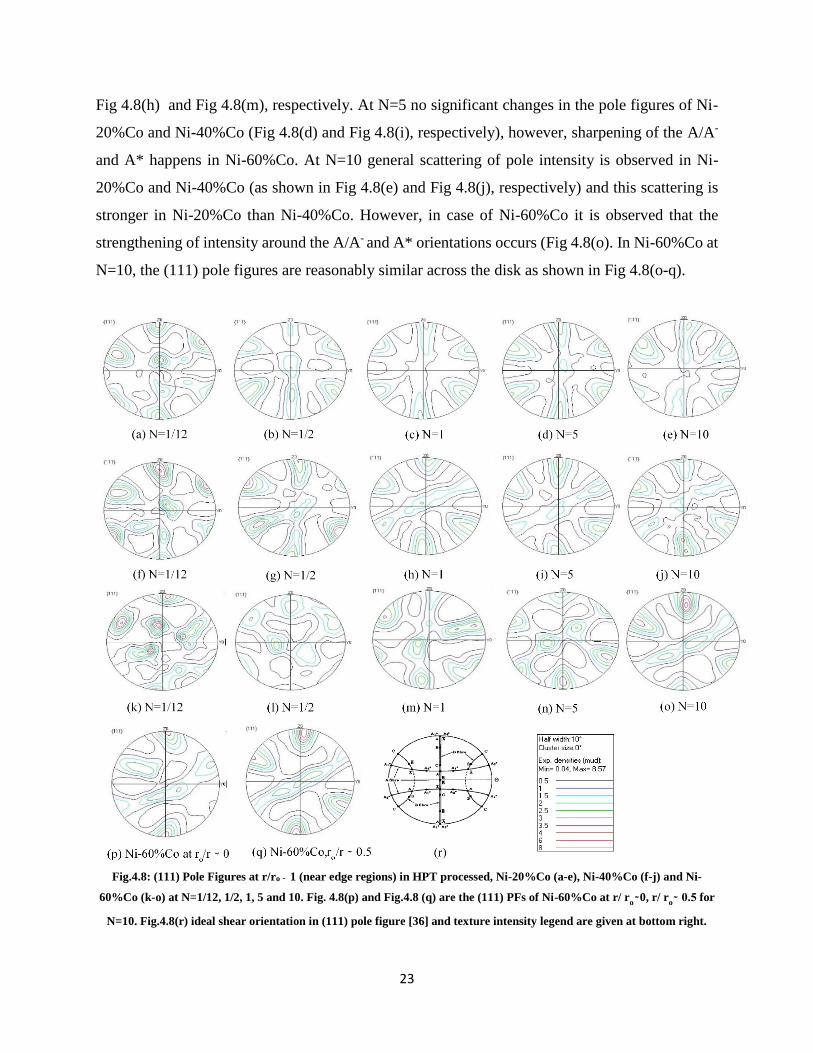
The (111) pole figure constructed from the EBSD data are shown in Fig 4.8 at N=1/12, all
ideal shear fcc orientation A/A-, A*, B/B- and C-component are observed in Ni-20%Co (Fig.4.8a),
Ni-40%Co (Fig. 4.8f) and Ni-60%Co (Fig. 4.8k). At N=1/2, intensity near the ideal location of
A/A-, A* decreases in the three alloys. Intensity around the C-orientation in Ni-20%Co and Ni-
40%Co alloys remains similar to N= 1/12 but decreases drastically in Ni-60%Co. No significant
changes could be observed in B/B- orientations. At N=1, weak A fiber is observed in Ni-20%Co
(Fig 4.8c) but in Ni-40%Co and Ni-60%Co much strong A fiber could be observed as shown in
Ni-20%Co Ni-40%Co
Ni-60%Co
1/12 1/2 1 5 10
0
2
4
6
8
10
12
14
Te
xtu
re c
om
po
ne
nts
Fra
ctio
n(%
)
Number of rotations(N)
A
A*
B
C
1/12 1/2 1 5 10
0
2
4
6
8
10
12
14
Te
xtu
re c
om
po
ne
nts
Fra
ctio
n(%
)
Number of rotations(N)
A
A*
B
C
1/12 1/2 1 5 10
0
2
4
6
8
10
12
14
Te
xtu
re c
om
po
ne
nts
Fra
ctio
n(%
)
Number of rotations(N)
A
A*
B
C
23
Fig 4.8(h) and Fig 4.8(m), respectively. At N=5 no significant changes in the pole figures of Ni-
20%Co and Ni-40%Co (Fig 4.8(d) and Fig 4.8(i), respectively), however, sharpening of the A/A-
and A* happens in Ni-60%Co. At N=10 general scattering of pole intensity is observed in Ni-
20%Co and Ni-40%Co (as shown in Fig 4.8(e) and Fig 4.8(j), respectively) and this scattering is
stronger in Ni-20%Co than Ni-40%Co. However, in case of Ni-60%Co it is observed that the
strengthening of intensity around the A/A- and A* orientations occurs (Fig 4.8(o). In Ni-60%Co at
N=10, the (111) pole figures are reasonably similar across the disk as shown in Fig 4.8(o-q).
Fig.4.8: (111) Pole Figures at r/ro ̴ 1 (near edge regions) in HPT processed, Ni-20%Co (a-e), Ni-40%Co (f-j) and Ni-
60%Co (k-o) at N=1/12, 1/2, 1, 5 and 10. Fig. 4.8(p) and Fig.4.8 (q) are the (111) PFs of Ni-60%Co at r/ ro ̴ 0, r/ r
o ̴ 0.5 for
N=10. Fig.4.8(r) ideal shear orientation in (111) pole figure [36] and texture intensity legend are given at bottom right.

24
The Orientation distribution functions (ODF) calculated using the harmonic series
expansion with a series rank of 22 (lmax=22) and Gaussian smoothing of 5°. The Ф2=45° sections
of the ODF from the edge regions of the different HPT disks is shown in Fig.4.9. For N=1/12, the
Ф2=45° sections show strong presence of A/A- and A* orientations, followed by C-component and
very weak B/B- components as shown in Fig.4.9a, Fig.4.9f, Fig.4.9k. At N=1/2 and N=1,the
volume fractions of A/A- and A* tends to decrease in Ni-20%Co and Ni-40%Co but increases in
Ni-60%Co, the C- component decreases progressively in Ni-60%Co and Ni-40%Co with increase
in number of rotations however it doesn’t varies significantly in case of Ni-20%Co(as represented
in Fig (4.9b, 4.9c) (4.9g, 4.9h) and (4.9l, 4.9m). At N=5 and N=10, fraction of C-component
becomes stronger than A/A- and A* in Ni-20%Co, whereas fraction of A/A- and A* are stronger
in Ni-60%Co and C-components tends to vanish (Fig 4.9n, 4.9o). Nevertheless in Ni-40%Co both
A/A-, A* and C-component are present such orientations are found to be strong and weak
respectively Fig (4.9i, 4.9j).
Fig.4.9: ODF Ф2=45° sections at r
o/r ̴ 1 (near edge regions) in HPT processed, Ni-20%Co(a-e),Ni-40%Co(f-j) and Ni-
60%Co (k-o) for N=1/12,1/2,1,5 and 10. Fig.9 (p) and 9 (q) are the Ф2=45° section of the ODFs of Ni-60%Co at r/ r
o ̴ 0,
r/ ro ̴ 0.5 for N=10, respectively. Position of the ideal shear texture components are shown in 9 (r) [36].
Only weak presence of B/B- orientation is observed in general and the strength doesn’t vary
with number of rotations or imposed strain in Ni-Co alloys. However in HPT processed Ni-60%Co
alloy appreciable amount the new orientation (110) [1-10] which belongs to B fiber ({hkl}<110>)
is observed at N=1/2 and this orientation disappear at N=1, but B/B- orientation is observed at this
rotation level (Fig 4.9(l) and 4.9(m) respectively). With further increase of N to 5, the (110) [1-10]
orientation becomes stronger but becomes rather week at maximum number of rotation N=10. In

25
Ni-60%Co at N=10, strong presence of A/A- &A* is observed at center, middle and edge region
(Fig. 4.9o, 4.9p and 4.9q), respectively.
4.4 Evolution of hardness in Ni-Co alloys during HPT
The microhardness test is the widely used method to examine the effect of linear variation
in strain during torsional straining across the disk from the center to edge region on deformation
heterogeneity. The microhardness evolution during HPT in Ni-20%Co, Ni-40%Co and Ni-60%
are shown in Fig.4.10 (a), 4.10(b) and 4.10(c), respectively. As number of rotation (N) or imposed
strain increases, the hardness value increases gradually from the center to the edge. At N=1,
hardness value reaches saturation near the edge regions to ~365Hv, ~418Hv and 450Hv in Ni-
20%Co, Ni-40%Co and Ni-60%Co respectively.
Fig.4.10: Hardness evolution plot in (a) Ni-20%Co (b) Ni-40%Co (c) Ni-60%Co and (d)Ni-Co alloys at N=10
-5 -4 -3 -2 -1 0 1 2 3 4 5
100
150
200
250
300
350
400
450
Mic
roh
ard
ne
ss, H
v
Distance from the centre of Disk (mm)
N=1/12
N=1/8
N=1/4
N=1/2
N=1
N=3
N=5
N=10
Initial hardness
Ni-20%Co
-5 -4 -3 -2 -1 0 1 2 3 4 5
100
150
200
250
300
350
400
450
Mic
roh
ard
ne
ss, H
v
Distance from the centre of Disk (mm)
N=1/12
N=1/8
N=1/4
N=1/2
N=1
N=3
N=5
N=10
Initial Hardness
Ni-40%Co
-5 -4 -3 -2 -1 0 1 2 3 4 5
100
150
200
250
300
350
400
450
Mic
roh
ard
ne
ss, H
v
Distance from the centre of Disk (mm)
N=1/12
N=1/8
N=1/4
N=1/2
N=1
N=3
N=5
N=10
Initial Hardness
Ni-60%Co
-5 -4 -3 -2 -1 0 1 2 3 4 5
100
150
200
250
300
350
400
450
500
Mic
roh
ard
ne
ss, H
v
Distance from the centre of Disk (mm)
Ni-20Co
Ni-40Co
Ni-60Co

26
Further increase in number of rotation to 3 and 5 the hardness value near the edge region
decreases slightly whereas increase in regions close to the center could be observed in Ni-20%Co
and Ni-40%Co alloy. No significant changes could be seen in the edge region of Ni-60%Co alloy.
At N=10, the hardness (~ 442Hv) across the disk becomes remarkably homogenous in the Ni-
60%Co alloy. In contrast, even after 10 rotations homogeneity could not be achieved in Ni-40%Co
and Ni-20%Co alloys. The hardness value is lower near the center region in these alloys even after
N=10. Noticeable decrease in hardness value to ~349Hv and ~396Hv is observed in Ni-20%Co
and Ni-40%Co, respectively.

27
Chapter 5
Discussion
5.1. Evolution of microstructure and hardness properties
It might be noted that grain refinement in plastic deformation processes particularly at
ambient temperature and moderate to heavy strain regime has been explained on the basis of grain
subdivision behavior [37-41]. In essence the theory relates the evolution of ultrafine to
nanostructure to the mechanism of dislocation propagation and interaction of dislocations to form
dislocation tangles and formation of typical cell and cell block structure. With increasing strain the
misorientation between the cells increases while the cells decrease in size finally leading to
conversion of cell structure bounded by LAGBs into ultrafine structure bounded by HAGBs. It
might thus be interesting to discuss the present observations on the basis of grain subdivision
behavior.
In all the three alloys the progressive evolution of ultrafine structure follows a similar
pathway i.e. (i) initial coarse structure exists throughout the disk, (ii) at low strain an evident cell
structure formation with high fraction of LAGBs and (iii) finally at higher strain level the
transformation of the cell structure dominated by LAGBs into ultrafine structure subdivided by
HAGBs. Thus the evolution of microstructure is very much in agreement with the microstructural
evolution as outlined in the grain subdivision. This also indicates that the grain subdivision
mechanism is the key reason for the evolution of ultrafine structure in the three Ni-Co alloys. As
already observed before, the grain refinement starts from the edge region of the disks and progress
towards the center with increase in number of rotations since the maximum strain will be
experienced by the edge regions (Fig.4.4, Fig.4.5, and Fig.4.6). The observed microstructural
evolution in the different Ni-Co alloys is thus typical of HPT processed disks [1].
In order to further understand the differences in the microstructural evolution in the three
nickel alloys it is felt helpful to additionally compare the edge regions. The variation of grain size,
fraction of HAGBs and average misorientation angle near the edge regions (r/ro ̴ 1) with number
28
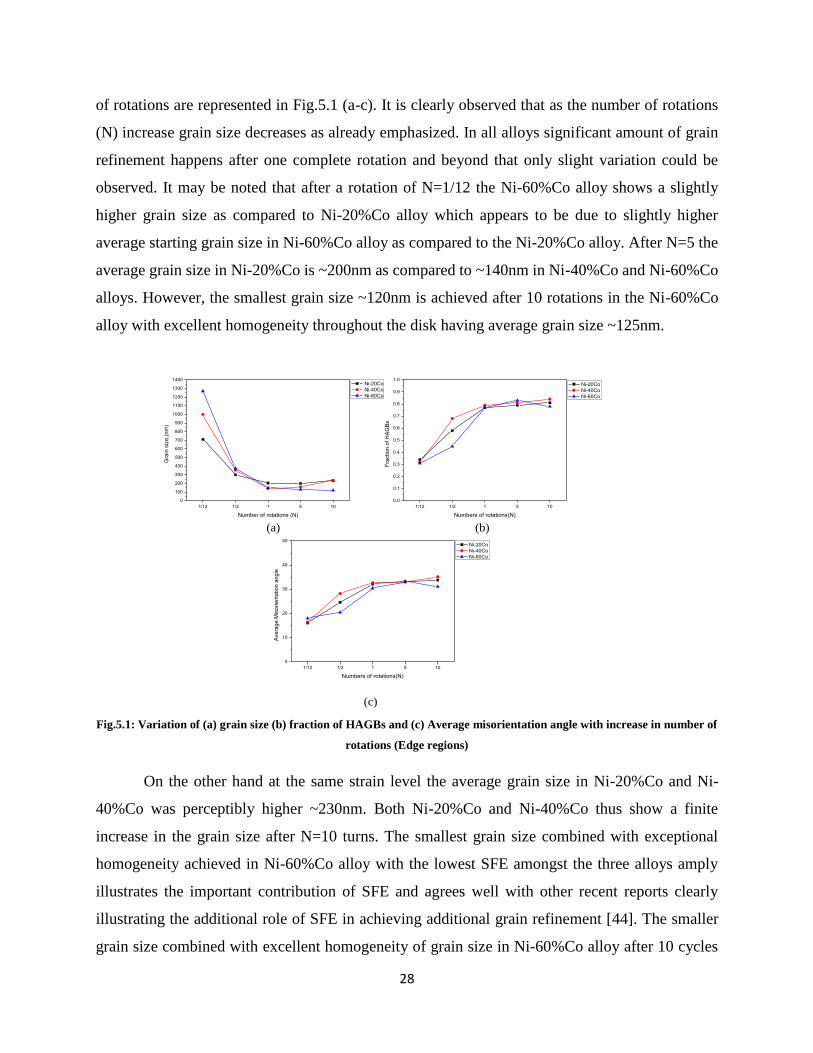
of rotations are represented in Fig.5.1 (a-c). It is clearly observed that as the number of rotations
(N) increase grain size decreases as already emphasized. In all alloys significant amount of grain
refinement happens after one complete rotation and beyond that only slight variation could be
observed. It may be noted that after a rotation of N=1/12 the Ni-60%Co alloy shows a slightly
higher grain size as compared to Ni-20%Co alloy which appears to be due to slightly higher
average starting grain size in Ni-60%Co alloy as compared to the Ni-20%Co alloy. After N=5 the
average grain size in Ni-20%Co is ~200nm as compared to ~140nm in Ni-40%Co and Ni-60%Co
alloys. However, the smallest grain size ~120nm is achieved after 10 rotations in the Ni-60%Co
alloy with excellent homogeneity throughout the disk having average grain size ~125nm.
Fig.5.1: Variation of (a) grain size (b) fraction of HAGBs and (c) Average misorientation angle with increase in number of
rotations (Edge regions)
On the other hand at the same strain level the average grain size in Ni-20%Co and Ni-
40%Co was perceptibly higher ~230nm. Both Ni-20%Co and Ni-40%Co thus show a finite
increase in the grain size after N=10 turns. The smallest grain size combined with exceptional
homogeneity achieved in Ni-60%Co alloy with the lowest SFE amongst the three alloys amply
illustrates the important contribution of SFE and agrees well with other recent reports clearly
illustrating the additional role of SFE in achieving additional grain refinement [44]. The smaller
grain size combined with excellent homogeneity of grain size in Ni-60%Co alloy after 10 cycles
(a) (b)
(c)
1/12 1/2 1 5 10
0
10
20
30
40
50
Ave
rag
e M
iso
rie
nta
tio
n a
ng
le
Numbers of rotations(N)
Ni-20Co
Ni-40Co
Ni-60Co
1/12 1/2 1 5 10
0.0
0.1
0.2
0.3
0.4
0.5
0.6
0.7
0.8
0.9
1.0
Fra
ctio
n o
f H
AG
Bs
Numbers of rotations(N)
Ni-20Co
Ni-40Co
Ni-60Co
1/12 1/2 1 5 10
0
100
200
300
400
500
600
700
800
900
1000
1100
1200
1300
1400
Gra
in s
ize
,(n
m)
Number of rotations (N)
Ni-20Co
Ni-40Co
Ni-60Co

29
of HPT processing also results in higher hardness and remarkable homogeneity in hardness
distribution. This is quite evident from the hardness distribution plot of the different HPT
processed disks (Fig.4.10).
The mechanism of grain refinement with model for minimum achievable grain size in ball
milling has been proposed by Mohammed et al [42] based on a balance between the rate of
hardening and rate of recovery. The salient features of the above mechanism are (1) accumulation
of high dislocation density at the vicinity of shear bands, (2) formation of cell and sub-grain
structure and (3) conversion of the sub grain structure to an equiaxed structure by accumulation of
dislocations at boundaries. This model although successful in predicting the minimum achievable
grain size high to medium SFE materials fails to predict the much smaller grain size of ball milled
Ag [42] or SPD processed low SFE materials as compared to the theoretically predicted value [24,
43].
The mechanism of additional grain refinement in low SFE alloys has recently been pointed
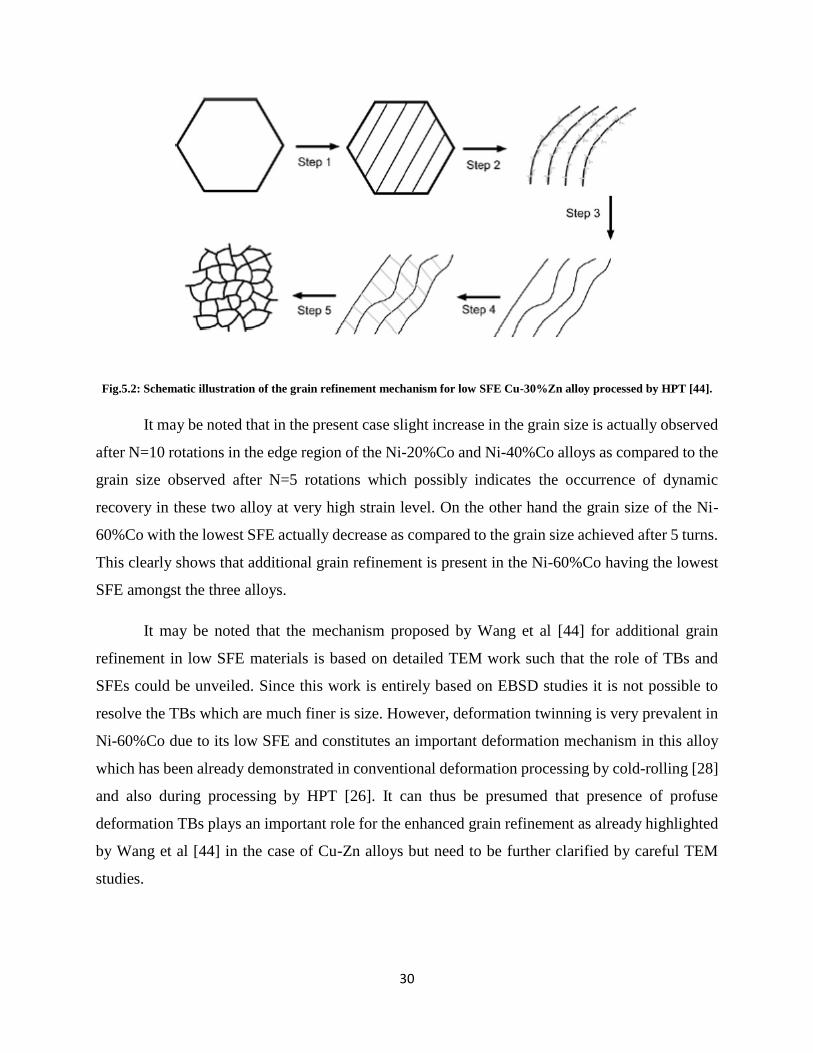
out based on TEM studies and illustrated in Fig.5.2 [44]. It has been argued in the proposed
mechanism that the UFG grains are divided in thin lamellae due to the emission of partial
dislocations from the GBs (Step 1 in Fig. 5.2). With increasing shear strains the density of stacking
faults and twin boundaries (TBs) increases (Step 2 in Fig.5.2) and the dislocations start getting
accumulated at the TBs as these are the effective barriers to dislocation motion (Step 2 in Fig.5.2).
The TBs are converted into HAGBs with increasing misorientation (step 3 in Fig.5.2). These new
HAGBs act as new sources of dislocations as partial dislocations are emitted from the GBs in such
a manner that GBs and TBs intersect to form domains and lead to the formation of new refined
microstructure (step 4 in Fig.5.2). Continued deformation converts the secondary TBs into HAGBs
as already mentioned. Grain rotation further converts the structure into a random nanostructure
(step 5 in Fig.5.2).
30
Fig.5.2: Schematic illustration of the grain refinement mechanism for low SFE Cu-30%Zn alloy processed by HPT [44].
It may be noted that in the present case slight increase in the grain size is actually observed
after N=10 rotations in the edge region of the Ni-20%Co and Ni-40%Co alloys as compared to the
grain size observed after N=5 rotations which possibly indicates the occurrence of dynamic
recovery in these two alloy at very high strain level. On the other hand the grain size of the Ni-
60%Co with the lowest SFE actually decrease as compared to the grain size achieved after 5 turns.
This clearly shows that additional grain refinement is present in the Ni-60%Co having the lowest
SFE amongst the three alloys.
It may be noted that the mechanism proposed by Wang et al [44] for additional grain
refinement in low SFE materials is based on detailed TEM work such that the role of TBs and
SFEs could be unveiled. Since this work is entirely based on EBSD studies it is not possible to
resolve the TBs which are much finer is size. However, deformation twinning is very prevalent in
Ni-60%Co due to its low SFE and constitutes an important deformation mechanism in this alloy
which has been already demonstrated in conventional deformation processing by cold-rolling [28]
and also during processing by HPT [26]. It can thus be presumed that presence of profuse
deformation TBs plays an important role for the enhanced grain refinement as already highlighted
by Wang et al [44] in the case of Cu-Zn alloys but need to be further clarified by careful TEM
studies.

31
5.2. Evolution of texture
It may be helpful at this stage to discuss the development of texture in the three nickel
alloys, namely, Ni, Ni-30%Co and Ni-60%Co under conventional torsion deformation (without
application of high pressure) which has been studied in depth by Hughes et al [45] to elucidate the
effects of SFE on the texture development. The qualitative and detailed quantitative analysis by
these authors reveal significant impact of SFE on texture development as has been reported in case
of conventional deformation [28]. The main observations from the above study are summarized in
Fig. 5.3. It is observed that at all strain levels the A, B and C components are presence in Ni and
Ni-30%Co alloys although at lower strain levels the A and B component dominate over the C
component. The volume fractions of the A and B components are higher in Ni as compared to Ni-
30%Co alloy. At higher strain levels the C component becomes the strongest component.
Fig.5.3: Volume fractions of the texture components with increasing strain for the three materials (a) A and B
components (b) C-component (c) A* -components[45]

32
In contrast the texture development in the Ni-60%Co alloy was very different. Here the C
component is very weakly developed and disappears at higher strain. The major components in
the Ni-60%Co alloy are the A/A-, B/B- and A*.
Fig.5.4: Volume fractions of the texture components with increasing number of rotations for the HPT Processed three
alloys: (a) A/A-
and B/B- components; (b) A*-components; (c) C-component
The texture evolution in HPT processed Ni-Co alloys shows presence of same ideal shear
components A/A-, A*, B/B- and C which are also observed during conventional torsional
deformation (Fig.5.4). In Ni-20%Co at lower strain levels (N=1/12) strong presence of A/A-, A*
and C components with weak B/B- could be seen. Usually with increase in strain consistent
strengthening of the C component at the expense of A/A- and A* has been observed either during
torsional deformation at room temperature as in materials like Al, Cu, Ni, Ni-30%Co [34, 46] or
during HPT processing as in the case of pure Al [17, 18]. It might be noted that the work carried
out by Orlov et al [17, 18] is up to a much smaller strain level in comparison to the present work.
A rise in the volume fraction of the C component is observed in the strain regime corresponding
to 1/12 to 1/2 rotation and is not so different from the strain regime in the study reported by Orlov
et al. Nevertheless, here such consistent strengthening of the C component could not be observed
in HPT processed Ni-20%Co. At the highest strain level the C component shows the highest
1/12 1/2 1 5 10
0
2
4
6
8
10
12
14
Te
xtu
re c
om
po
ne
nts
Fra
ctio
n(%
)
Number of rotations(N)
Ni-20Co C
Ni-40Co C
Ni-60Co C
1/12 1/2 1 5 10
0
2
4
6
8
10
12
14
Te
xtu
re c
om
po
ne
nts
Fra
ctio
n(%
)
Number of rotations(N)
Ni-20Co A*
Ni-40Co A*
Ni-60Co A*
1/12 1/2 1 5 10
0
2
4
6
8
10
12
14
Te
xtu
re c
om
po
ne
nts
Fra
ctio
n(%
)
Number of rotations(N)
Ni-20Co A
Ni-20Co B
Ni-40Co A
Ni-40Co B
Ni-60Co A
Ni-60Co B
(a) (b)
(c)
33
volume fraction ~9% which is very similar to the volume fraction of the A* component and only
marginally higher than the volume fraction of the A/A- component ~6.5%. The B/B- component
does not show any significant variation with imposed strain and remains much weaker as compared
to the other components.
The textures of the Ni-40%C and Ni-60%Co show some similarities amongst them. In both
the cases the A/A-, and A* components emerge as the strongest components at high deformation
level. However, In Ni-60%Co alloy both these components show consistent increase at strain
beyond one turn. The C component remains much weaker particularly for the Ni-60%Co alloy
where it decreases abruptly after ½ turn and remains almost unchanged with increasing strain. It
may be noted that this is very consistent with the observations obtained during conventional
torsional deformation [45].
The present observations can also be compared with the simulation results obtained by
various researchers. As the number of rotations increased periodic cyclic rise and fall of A/A-, A*
and C is observed, this is might due to the successive lattice rotations of the A₁* into A₂*, A₂* into
C, and then C into A₁* which has been predicted by Gilormini et.al [46]. Although variations in
texture components is observed but such cyclic variation as predicted by the simulation results
does agree with experimental results. At maximum number of rotation (that is N=10), overall
volume fraction of shear components is found to decrease and the texture become weaker and more
randomized. The weakening of texture also coincides with extreme grain refinement where grain
rotation may play a role and appears to contribute to texture weakening.
The texture evolution in Ni-60%Co is similar to Ni-40%Co and Ni-20%Co at lower strain
level (N =1/12). Further increase in imposed strain level the volume fraction of A/A-, A* and C
orientations drops initially, but A/A-, A* orientation increase continuously and C-components
decrease continuously thereafter. The increase in fraction of A/A-, A* and decrease in fraction of
C is similar to the case of Ni-60%Co deformed by simple shear [46]. The major difference in
texture evolution of Ni-60%Co during HPT and torsional deformation is lies in fraction of B/B-,
which becomes dominant orientations in low SFE materials at higher strain during torsional
deformation. Though quite reasonable amount of this orientation could be observed in HPT but it
does not becomes dominant as in the case of torsional deformation [45, 47]. This might be due to
the growth of mechanical twins with increase in strain as it is well known that formation of
deformation twins will occurs in low SFE materials, so only the volume fraction of A* increase

34
continuously while fraction of B/B- decreases [48]. M.G. Stout et.al [48] also found the weak
presence of B/B- and C-components during simple shear deformation of brass at Von mises
equivalent strain of 1.5.
The texture evolution in Ni-40%Co appears in-between Ni-20%Co and Ni-60%Co such
that it has significant amount of C-component as Ni-20%Co, strong presence of A/A- and A* as in
Ni-60%Co and gradually the volume fraction of A/A- and C decrease with increasing strain. This
intermediate texture in Ni-40%Co alloy agrees very well with its SFE which is intermediate
between the SFE values of Ni-20%Co and Ni-60%Co alloys.

35
Chapter 6
Summary and Conclusion
The effect of SFE on microstructure evolution, microtexture and microhardness in Ni-Co alloys
during SPD by HPT processing is studied and summarized as follows
1. The grain refinement starts to occur from the edge region and continues towards the center
of the disk with increasing strain or number of rotations (N) consistent with the strain
distribution in torsion deformation. Significant grain refinement occurs within one
complete rotation and this is followed by much slower rate of microstructural evolution.
2. The microhardness evolution with increase in strain is inconsistent with microstructure
evolution.
3. The finest grain size along with remarkable microstructural and hardness homogeneity is
achieved in the Ni-60Co alloy having the lowest SFE amongst the three Ni-Co alloys after
N=10 rotations. Hardness homogeneity, however, could not be achieved in the other two
Ni-Co alloys even at this strain level. This clearly demonstrated the profound effect of
lowering of SFE on the evolution of homogeneity in HPT processed disks.
4. In all the three alloys the texture evolution is similar at lower strain level. With increase in
strain, periodic rise and fall in fraction of A/A-, A* and C is observed in Ni-20%Co and at
higher rotations (N>5) the texture becomes weak. In contrast, with increase in strain the
fraction of A/A-, A* and C orientations drops initially, but A/A-, A* fraction increase and
C-components decrease continuously thereafter in Ni-60%Co.
5. The microtexture evolution in Ni-40%Co is appears to between Ni-20%Co and Ni-60%Co
because it shows reasonable fraction of C-component as in Ni-20%Co, strong presence of
A/A- and A* as in Ni-60%Co and the volume fraction of A/A- and C decrease with increase
in number of rotations slowly.

36
References
[1] Zhilyaev AP, Langdon TG. Using high-pressure torsion for metal processing:
Fundamentals and applications. Progress in Materials Science 53 (2008) 893.
[2] Gleiter H. In: Hansen N, Horsewell A, Leffers T, Lilholt H, editors. Deformation of
polycrystals: Mechanisms and microstructures. Roskilde, Denmark: Riso National
Laboratory; (1981) 15.
[3] Erb U, El-Sherik AM, Palumbo G, Aust KT. Synthesis, structure and properties of
electroplated nanocrystalline materials Nanostructured Materials 2 (1993) 383.
[4] Koch CC, Cho YS. Nanocrystals by high energy ball milling Nanostructured Materials 1
(1992) 207.
[5] Valiev RZ, Langdon TG. Principles of equal-channel angular pressing as a processing tool
for grain refinement. Progress in Materials Science 51(2006) 881.
[6] Tsuji N, Saito Y, Lee S-H, Minamino Y. ARB (Accumulative Roll-Bonding) and other
new Techniques to Produce Bulk Ultrafine Grained Materials. Advanced Engineering
Materials 5 (2003) 338.
[7] Smirnova NA, Levit VI, Pilyugin VI, Kuznetsov RI, Davydova LS, Sazonova VA. Fiz
Metal Metalloved 61 (1986) 1170.
[8] Zhilyaev AP, Nurislamova GV, Kim BK, Baro MD, Szpunar JA, Langdon TG.
Experimental parameters influencing grain refinement and microstructural evolution
during high-pressure torsion Acta Materialia 51 (2003) 753.
[9] Zhilyaev AP, Lee S, Nurislamova GV, Valiev RZ, Langdon TG. Microhardness and
Microstructural Evolution in Pure Nickel during High-Pressure Torsion Scripta Materialia
44, (2001) 2753.
[10] Zhilyaev AP, McNelley TR, Langdon TG. Evolution of microstructure and microtexture
in FCC metals during high-pressure torsion, Journal of Materials Science 42 (2007) 1517.

37
[11] R.Z. Valiev, Y. Estrin, Z. Horita, T.G. Langdon, M.J.Zehetbauer, Y.T. Zhu, Processing
of Bulk Ultrafine Grained Materials by Severe Plastic Deformation, Journal of Materials
Science 58 (2006) 33.
[12] Zhang P., An X.H., Zhang Z.J., Wu S.D., Li S.X., Zhang Z.F., Figueiredo R.B., Gao
N,Langdon T.G., Optimizing strength and ductility of Cu-Zn alloys through severe plastic
deformation, Scripta Materialia (2012).
[13] Hughes, D. A., Nix, W. D. 1988 The absence of steady-state flow during large strain
deformation of some FCC metals at low and intermediate temperatures. Metall. Trans. A
19 (1988) 3013.
[14] P. C. J. Gallagher, The Influence of Alloying, Temperature, and Related Effects of the
Stacking Fault Energy Metallurgical Transactions1, (1970) 2429.
[15] M.A. Meyers and K.K. Chawla, Mechanical Behavior of Materials, Prentice-Hall, Upper
Saddle River, NJ, 1999
[16] Zhilyaev A. P., Langdon T. G., Microstructure and microtexture evolution in pure metals
after ultra-high straining, Journal of Materials Science 47 (2012) 7888.
[17] Dmitry Orlov, Pinaki Prasad Bhattacharjee, Yoshikazu Todaka, Minoru Umemoto and
Nobuhiro Tsuji, Reversal straining to manage structure in pure aluminum under SPD
Materials Science Forum.584-586 (2008) 133.
[18] Dmitry Orlov, Pinaki Prasad Bhattacharjee, Yoshikazu Todaka, Minoru Umemoto and
Nobuhiro Tsuji Texture evolution in pure aluminum subjected to monotonous and reversal
straining in high-pressure torsion. Scripta Materialia 60 (2009) 893.
[19] Edalati K., Horita Z., High-pressure torsion of pure metals: Influence of atomic bond
parameters and stacking fault energy on grain size and correlation with hardness Acta
Materialia 59 (2011) 6831.
[20] Zhang Z.J., Duan Q.Q., An X.H., Wu S.D., Yang G., Zhang Z.F, Microstructure and
mechanical properties of Cu and Cu–Zn alloys produced by equal channel angular pressing,
Materials Science and Engineering A 528 (2011) 4259.
[21] Wang Z.W, Wang.Y B, Liao X.Z., Zhao Y.H., Lavernia E.J., Zhu Y.T., Horita Z.
,Langdon T.G., Influence of stacking fault energy on deformation mechanism and
dislocation storage capacity in ultrafine-grained materials, Scripta Materialia 60 (2009).

38
[22] Zhao Y.H., Liao X.Z, Zhu Y.T., Horita Z., Langdon T.G., Influence of stacking fault
energy on the minimum grain size achieved in severe plastic deformation Materials Science
and Engineering A 463 (2007) 22.
[23] Zhao Y.H., Liao X.Z, Zhu Y.T., Horita Z., Langdon T.G., Influence of stacking fault
energy on nanostructure formation under high pressure torsion. Materials Science and
Engineering a-Structural Materials Properties Microstructure and Processing, 410 (2005)
188.
[24] Zhao YH, Liao XZ, Horita Z, Langdon TG, Zhu YT. Determining the optimal stacking
fault energy for achieving high ductility in ultrafine-grained Cu-Zn alloys. Materials
Science and Engineering: A 493 (2008) 123.
[25] An X.H., Lin Q.Y., Wu S.D., Zhang Z.F., Figueiredo R.B., Gao N. and Langdon T.G. The
influence of stacking fault energy on the mechanical properties of nanostructured Cu and
Cu–Al alloys processed by high-pressure torsion Scripta Materialia 64 (2011) 954.
[26] Sun P-L, Zhao YH, Cooley JC, Kassner ME, Horita Z, Langdon TG, Lavernia EJ, Zhu
YT. Effect of stacking fault energy on strength and ductility of nanostructured alloys: An
evaluation with minimum solution hardening. Materials Science and Engineering: A
525(2009) 83.
[27] Kallend J.S., Davies G. J., The Development of Texture in Copper and Copper-Zinc
Alloys, Texture 1 (1972) 51.
[28] Ray, R.K., Rolling textures of pure nickel, nickel-iron and nickel-cobalt alloys. Acta
Metallurgica Et Materialia, 43 (1995) 3861.
[29] J. Hirsch, K. Lücke, and M. Hatherly. Overview No. 76. Mechanism of deformation and
development of rolling textures in polycrystalline f.c.c. Metals-III. The influence of slip
inhomogeneities and twinning. Acta Metallurgica 36 (1988) 2905.
[30] Dillamore, I. L. The Stacking Fault Energy Dependence of the Mechanisms of
Deformation in Fcc Metals, Metallurgical Transactions I, (1970) 2463.
[31] Hyoung S.K, Finite element analysis of high pressure torsion processing, Journal of
Materials Processing Technology 113 (2001) 617.
[32] Todaka Y., Umemoto M., Yamazaki A., Sasaki J. and Tsuchiya K., Influence of High-
Pressure Torsion Straining Conditions on Microstructure Evolution in Commercial Purity
Aluminum, Materials Transactions, 49 (2008) 7.

39
[33] Canova, G. R., Kocks, U. F. & Jonas, J. J. Theory of torsion texture development. Acta
Metallurgica 32 (1984) 211.
[34] Montheillet, F., Cohen, M.,Jonas, J. J. Axial stresses and texture development during the
torsion testing of Al, Cu and α-Fe. Acta Metallurgica 32 (1984) 2077.
[35] Kyung Keun Um, Hyo Tae Jeong, Dong Nyung Lee, Comparison of Torsion Textures to
Rolling Texture, Materials Science Forum 408-412 (2002) 649.
[36] Loucif A., Baudin.T, Figueiredo R.B., Brisset.F, Hilbert A.L., Chemam. R, Langdon. T.G,
Microstructure and microtexture evolution with aging treatment in an Al–Mg–Si alloy
severely deformed by HPT, Journal of Materials Science(2012)
[37] Bay, B., et al., Overview No-96 - Evolution of Fcc Deformation Structures in Polyslip.
Acta Metallurgica Et Materialia, (1992). 40(2): p. 205-219.
[38] Hughes, D.A. and N. Hansen, High angle boundaries formed by grain subdivision
mechanisms. Acta Materialia, (1997). 45(9): p. 3871-3886.
[39] Hughes, D.A. and N. Hansen, Microstructural Evolution in Nickel during Rolling from
Intermediate to Large Strains. Metallurgical Transactions a-Physical Metallurgy and
Materials Science, (1993). 24(9): p. 2021-2037.
[40] Hughes, D.A. and N. Hansen, Deformation structures developing on fine scales.
Philosophical Magazine, (2003). 83(31-34): p. 3871-3893.
[41] Hansen, N. and D.J. Jensen, Development of microstructure in FCC metals during cold
work. Philosophical Transactions of the Royal Society of London Series a-Mathematical
Physical and Engineering Sciences, (1999). 357(1756): p. 1447-1469.
[42] Mohamed, F.A., A dislocation model for the minimum grain size obtainable by milling.
Acta Materialia, (2003). 51(14) 4107.
[43] Zhao, Y.H., Zhu Y. T., Liao X. Z., HoritaZ.,. Langdon T. G., Tailoring stacking fault
energy for high ductility and high strength in ultrafine grained Cu and its alloy. Applied
Physics Letters, 89 (2006).
[44] Wang, Y.B., Liao X.Z., Zhao Y.H., Lavernia E.J.,. Ringer S.P, Horita Z.,. Langdon T.G,
The role of stacking faults and twin boundaries in grain refinement of a Cu-Zn alloy
processed by high-pressure torsion. Materials Science and Engineering: A. 527 (2010)
4959.

40
[45] Hughes, D.A., Lebensohn R.A, Wenk H.R, Kumar A., Stacking fault energy and
microstructure effects on torsion texture evolution. Proceedings of the Royal Society of
London. Series A: Mathematical, Physical and Engineering Sciences, 2000. 456(1996)
921.
[46] Gilormini P., Toth L.S., Jonas J.J., Reference ODF calculations for the torsion Of fcc rate
sensitive polycrystals Textures and Microstructures, 14-18 (1991) 1197.
[47] P. Van Houtte., Simulation of the rolling and shear Texture of brass by the Taylor theory
adapted for mechanical twinning Acta Metallurgica 26 (1978) 591.
[48] M.G. Stout., O’Rourke, Experimental Deformation Textures of OFE Copper and
70:30 Brass from Wire Drawing, Compression, and Torsion Metallurgical Transactions A
20A (1989) 125.