EFFECT OF SPECIMEN THICKNESS ON FATIGUE-CRACK …
36
NASA TECHNICAL NOTE CO r^. ^ NASA TN D-7173 EFFECT OF SPECIMEN THICKNESS ON FATIGUE-CRACK-GROWTH BEHAVIOR AND FRACTURE TOUGHNESS OF 7075-T6 AND 7178-T6 ALUMINUM ALLOYS by C. Michael Hudson and J. C. Newman, Jr. Langley Research Center Hampton, Va. 23365 NATIONAL AERONAUTICS AND SPACE ADMINISTRATION • WASHINGTON, D. C. • APRIL 1973
Transcript of EFFECT OF SPECIMEN THICKNESS ON FATIGUE-CRACK …

NASA TECHNICAL NOTE
COr .
^
NASA TN D-7173
EFFECT OF SPECIMEN THICKNESS
ON FATIGUE-CRACK-GROWTH BEHAVIOR
AND FRACTURE TOUGHNESS OF 7075-T6
AND 7178-T6 ALUMINUM ALLOYS
by C. Michael Hudson and J. C. Newman, Jr.
Langley Research Center
Hampton, Va. 23365
NATIONAL AERONAUTICS AND SPACE ADMINISTRATION • WASHINGTON, D. C. • APRIL 1973
1.
4.
7.
9.
12.
Report No. 2. Government Accession No.
NASA TN D-7173Title and Subtitle
EFFECT OF SPECIMEN THICKNESS ON FATIGUE-CRACK-GROWTH BEHAVIOR AND FRACTURE TOUGHNESS OF7075-T6 AND 7178-T6 ALUMINUM ALLOYS
Author(s)
C. Michael Hudson and J. C. Newman, Jr.
Performing Organization Name and Address
NASA Langley Research CenterHampton, Va. 23365
Sponsoring Agency Name and Address
National Aeronautics and Space AdministrationWashington, D.C. 20546
3.
5.
6.
8.
10.
11.
13.
14.
Recipient's Catalog No.
Report DateApril 1973
Performing Organization Code
Performing Organization Report No.
L-8731Work Unit No.
501-22-02-01Contract or Grant No.
Type of Report and Period Covered
Technical NoteSponsoring Agency Code
15. Supplementary Notes
16. Abstract
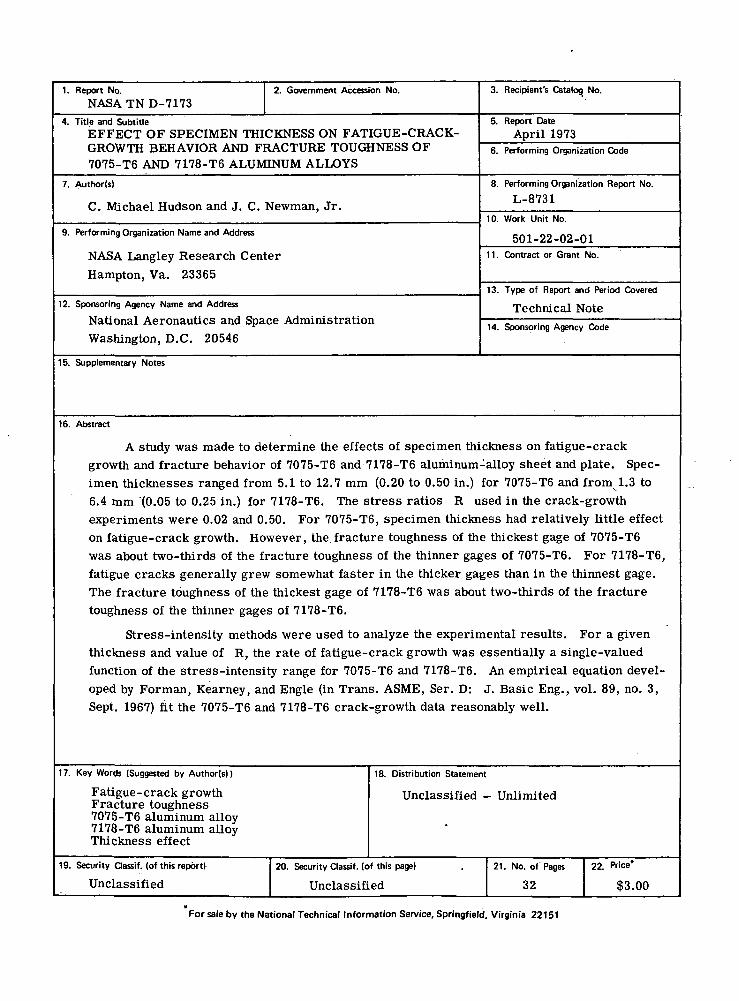
A study was made to determine the effects of specimen thickness on fatigue-crackgrowth and fracture behavior of 7075-T6 and 7178-T6 aluminum-alloy sheet and plate. Spec-imen thicknesses ranged from 5.1 to 12.7 mm (0.20 to 0.50 in.) for 7075-T6 and from 1.3 to6.4 mm '(0.05 to 0.25 in.) for 7178-T6. The stress ratios R used in the crack-growthexperiments were 0.02 and 0.50. For 7075-T6, specimen thickness had relatively little effecton fatigue-crack growth. However, the fracture toughness of the thickest gage of 7075-T6was about two-thirds of the fracture toughness of the thinner gages of 7075-T6. For 7178-T6,fatigue cracks generally grew somewhat faster in the thicker gages than in the thinnest gage.The fracture toughness of the thickest gage of 7178-T6 was about two-thirds of the fracturetoughness of the thinner gages of 7178-T6.
Stress-intensity methods were used to analyze the experimental results. For a giventhickness and value of R, the rate of fatigue-crack growth was essentially a single-valuedfunction of the stress-intensity range for 7075-T6 and 7178-T6. An empirical equation devel-oped by Forman, Kearney, and Engle (in Trans. ASME, Ser. D: J. Basic Eng., vol. 89, no. 3,Sept. 1967) fit the 7075-T6 and 7178-T6 crack-growth data reasonably well.
17. Key Words (Suggested by Author(s))
Fatigue-crack growthFracture toughness7075-T6 aluminum alloy7178-T6 aluminum alloyThickness effect
18. Distribution Statement
Unclassified - Unlimited
19. Security dassif. (of this report)
Unclassified
20. Security Classif. (of this page)
Unclassified
21. No. of Pages
32
22. Price*
$3.00
For sale by the National Technical Information Service, Springfield, Virginia 22151

EFFECT OF SPECIMEN THICKNESS ON FATIGUE-CRACK-GROWTH
BEHAVIOR AND FRACTURE TOUGHNESS OF 7075-T6
AND 7178-T6 ALUMINUM ALLOYS
By C. Michael Hudson and J. C. Newman, Jr.Langley Research Center
SUMMARY
A study was made to determine the effects of specimen thickness on fatigue-crackgrowth and fracture behavior of 7075-T6 and 7178-T6 aluminum-alloy sheet and plate.Specimen thicknesses ranged from 5.1 to 12.7 mm (0.20 to 0.50 in.) for 7075-T6 andfrom 1.3 to 6.4 mm (0.05 to 0.25 in.) for 7178-T6. The stress ratios R used in thecrack-growth experiments were 0.02 and 0.50. For 7075-T6, specimen thickness hadrelatively little effect on fatigue-crack growth. However, the fracture toughness of thethickest gage of 7075-T6 was about two-thirds of the fracture toughness of the thinnergages of 7075-T6. For 7178-T6, fatigue cracks generally grew somewhat faster in thethicker gages than in the thinnest gage. The fracture toughness of the thickest gage of7178-T6 was about two-thirds of the fracture toughness of the thinner gages of 7178-T6.
Stress-intensity methods were used to analyze the experimental results. For agiven thickness and value of R, the rate of fatigue-crack growth was essentially a single-valued function of the stress-intensity range for 7075-T6 and 7178-T6. An empiricalequation developed by Forman, Kearney, and Engle (in Trans. ASME, Ser. D: J. BasicEng., vol. 89, no. 3, Sept. 1967) fit the 7075-T6 and 7178-T6 crack-growth data reasonablywell.
INTRODUCTION
Fatigue cracks of various sizes have been discovered during the service life ofmany aircraft structures. As a result, the predictions of fatigue-crack-growth ratesand fracture toughness of parts containing fatigue cracks have become of considerableinterest to aircraft designers and operators. In order to make such predictions, theeffects of a wide range of parameters must be understood. Many of these parameters,such as component configuration, stress ratio, loading sequence, and environment, havealready been investigated at NASA Langley Research Center and are reported in refer-ences 1 to 7. However, relatively little research has been conducted on the effects of

material thickness on fatigue behavior. Consequently, a series of axial-load fatigue-crack-growth and fracture-toughness experiments were conducted on 7075-T6 and7178-T6 aluminum-alloy specimens ranging in thickness from 5.1 to 12.7 mm (0.20 to0.50 in.) and from 1.3 to 6.4 mm (0.05 to 0.25 in.), respectively. These materials wereselected because of their frequent use in aircraft construction.
Stress-intensity methods were used to analyze the data because these methods haveshown great promise for predicting fatigue-crack propagation and fracture in complexstructures. For example, Poe (ref. 8) showed that fatigue-crack growth in stiffenedpanels can be predicted from stress-intensity parameters and the data from tests ofsimple sheet specimens.
An empirical equation developed by Forman, Kearney, and Engle (ref. 9) was fittedby least-squares techniques to the fatigue-crack-propagation data. This equation fit thefatigue-crack-growth data generated in a previous study of stress-ratio effects reason-ably well (ref. 3).
SYMBOLS
The units used for the physical quantities defined in this paper are given in both theInternational System of Units (SI) and the U.S. Customary Units. The measurements andcalculations were made in the U.S. Customary Units. Factors relating the two systemsare given in reference 10 and those used in the present investigation are presented inappendix A.
a half-length of a central symmetrical crack, mm (in.)
a: half-length of crack at start of a fracture-toughness test, mm (in.)
C constant in fatigue-crack-growth equation
da/dN rate of fatigue-crack growth, nm/cycle (in./cycle)
E Young's modulus of elasticity, GN/m2 (psi)
e elongation in 51-mm (2-in.) gage length, percent
Kcn critical stress-intensity factor, MN/m ' (psi-in '7
/ 3/2 ( l/2\Kmax maximum stress-intensity factor, MN/m ' \ psi -in ' J

Kmin minimum stress-intensity factor, MN/m ' (psi-in ' J
/ 3/2 ( l/2\AK stress-intensity-factor range, MN/m ' Ipsi-in ' /
N number of load cycles
n exponent in fatigue-crack-growth equation
Pa amplitude of load applied in a cycle, N (Ibf)
Pj maximum load applied to specimen during fracture-toughness test, N (Ibf)
Pm mean load applied in a cycle, N (Ibf)
pmax maximum load applied in a cycle, Pm + Pa, N (Ibf)
Pmin minimum load applied in a cycle, Pm - Pa, N (Ibf)
R ratio of minimum stress to maximum stress
Sa alternating gross stress, Pa/wt, MN/m2 (psi or ksi)
Sf maximum gross stress applied to specimen during fracture-toughness test,Pf/wt, MN/m2 (psi)
Sm mean gross stress, P / w t , MN/m^ (psi or ksi)
maximum gross stress, Pmax/wt> MN/m2 (psi)
minimum gross stress, Pmin/wt, MN/m2 (psi)
t Specimen thickness, mm (in.)
w specimen width, mm (in.)
OL secant correction factor for stress intensity in a finite width panel, I/sec -|^
au ultimate tensile strength, MN/m^, (ksi)
ff yield strength (0.2-percent offset), MN/m^ (ksi)

SPECIMENS, TESTS, AND PROCEDURES
Specimens
Through-crack test specimens were made from three thicknesses each of 7075-T6and 7178-T6 aluminum alloys. The thicknesses and tensile properties of these alloys arelisted in table I. The tensile specimens used to obtain these properties met ASTM Stan-dards (ref. 11). The nominal chemical compositions of the two alloys are shown intable H.
The specimen configuration used in both the crack-propagation and fracture-toughness tests is shown in figure 1. These specimens were 292 mm (11.5 in.) wide and889 mm (35.0 in.) long. The longitudinal axes of all specimens were parallel to the roll-ing direction of the material. A notch 2.54 mm (0.10 in.) long by 0.25 mm (0.01 in.) widewas cut into the center of each specimen by use of an electrical discharge machining pro-cess. The heat-affected zone resulting from this process is less than 0.25 mm (0.01 in.)wide. Consequently, after crack initiation, all of the material through which the fatiguecrack propagates is unaltered by the cutting process.
A reference grid (ref. 12) was photographically printed on the surface of the spec-imen for crack-propagation monitoring. The spacing between grid lines was 1.3 mm(0.050 in.). Metallographic examination and tensile tests conducted on 7075-T6 speci-mens bearing the grid indicated no detrimental effect on the material.
Testing Machines
Three axial-load fatigue-testing machines were employed in this investigation. Thecapabilities of these machines are listed in the following table:
Machine type
Subresonant
Hydraulic
Combination:As subresonant unitAs hydraulic unit
Maximum loadcapacity
kN
89
1334
467587
Ibf
20 000
300 000
105 000132 000
Operatingfrequency used
Hz
30
1 to 5
140.7 to 1.0
cpm
1800
60 to 300
84040 to 60
Machinedescribed in —
Ref. 13
App. B
Ref. 14
The 1334-kN (300 000-lbf) tester described in the preceding table was also used forfracture-toughness tests requiring loads in excess of 534 kN (120 000 Ibf). A hydraulic

axial-load universal testing machine was used for fracture-toughness tests requiringlower loads. This universal machine had a load capacity of 534 kN (120 000-lbf).
Test Procedure
Axial-load fatigue-crack-propagation experiments were conducted at stress ratiosR of 0.02 and 0.50. The maximum gross stresses in these experiments ranged from 69to 276 MN/m2 (10 to 40 ksi) for 7075-T6 and from 52 to 155 MN/m2 (7.5 to 22.5 ksi) for7178-T6. The alternating and mean loads were kept constant throughout each test. Thefatigue-crack-growth data were obtained by observing crack growth through 10 powermicroscopes. The number of cycles required to propagate the crack to each grid linewas recorded so that crack-propagation rates could be determined.
Fracture-toughness data were obtained two ways. Most of these data came fromstandard toughness tests in which fatigue-cracked specimens were monotonically loadedto failure at a load rate of 2.2 kN/sec (30 000 Ibf/min). The remainder of these datacame from fatigue-crack-propagation tests which were continued up to specimen failure.In these tests, the maximum load in the fatigue-crack-propagation test was assumed to bethe load at failure.
When a centrally cracked sheet specimen is loaded in axial tension, transversecompressive stresses are generated near the crack surface (ref. 15). These compres-sive stresses can buckle thin specimens out of the plane of the sheet near the crack. Theincrease in stress-intensity factor due to this buckling is difficult to calculate; conse-quently the thinner gage specimens (t = 5.1 mm (0.20 in.) for 7075-T6 and t = 1.3 and4.1 mm (0.05 and 0.16 in.) for 7178-T6) were clamped between oiled guide plates(ref. 16) to restrain buckling. The thicker specimens did not buckle; therefore guideplates were not used.
RESULTS AND DISCUSSION
Fatigue-Crack-Growth Experiments
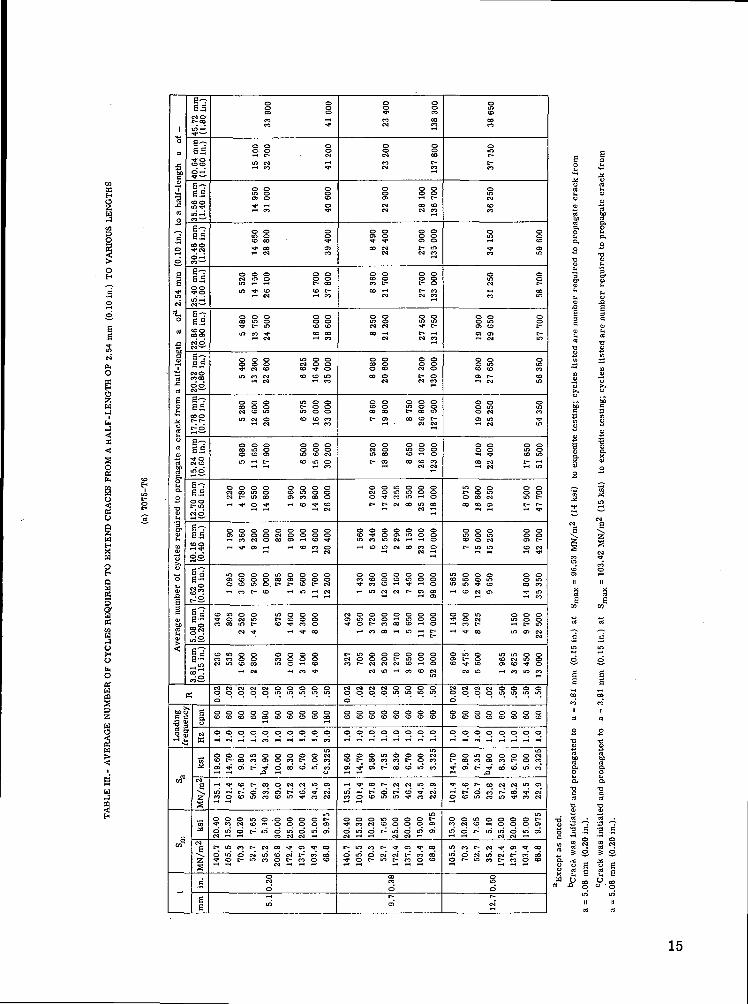
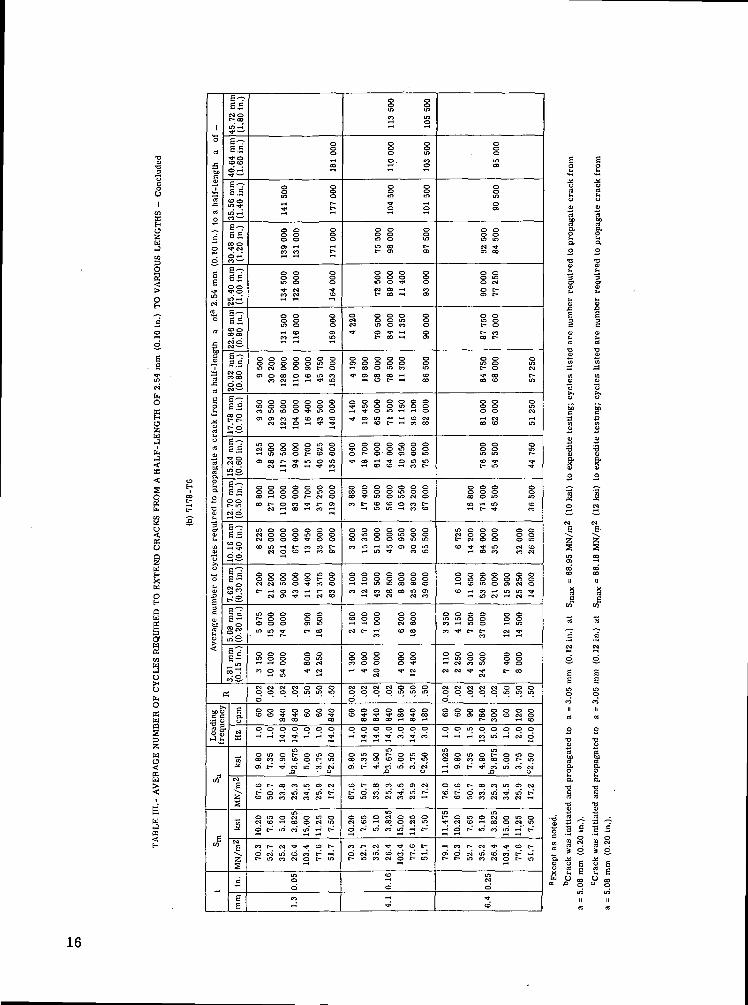
The results of the fatigue-crack-growth experiments on the 7075-T6 and 7178-T6specimens are presented in table III. This table gives the average number of cyclesrequired for a through-crack to propagate from a half-length of 2.54 mm (0.10 in.) tothe listed half-lengths. Fatigue-crack-growth rates were determined graphically fromcrack-growth curves which were faired through the data of table ffl.
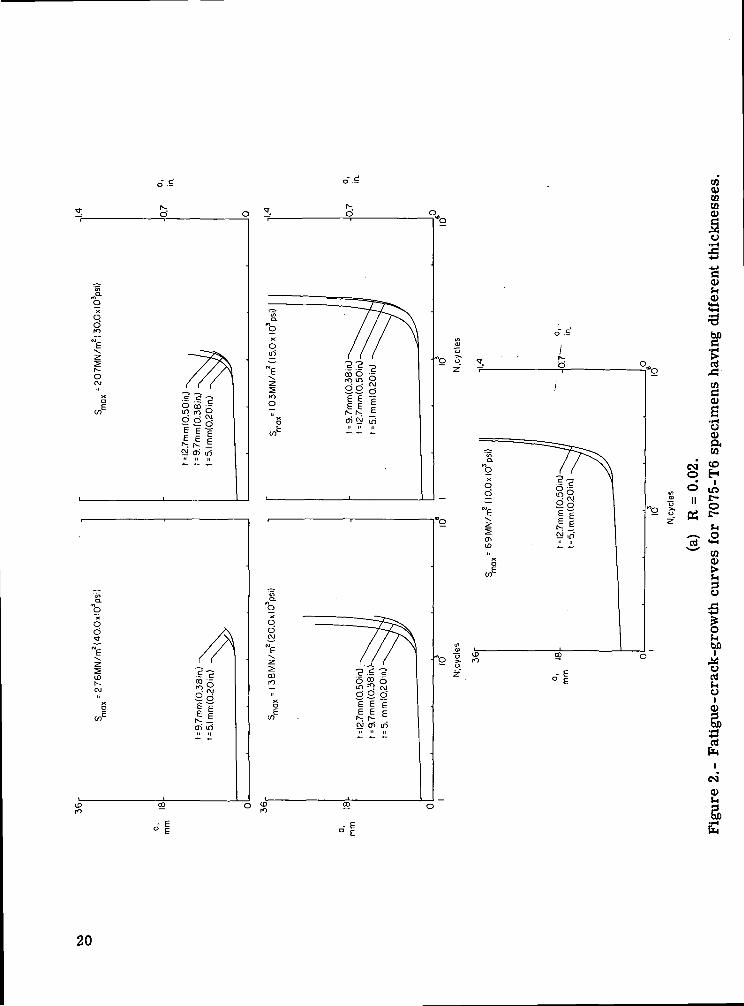
The fatigue-crack-growth curves for the 7075-T6 specimens of different thicknessesare presented in figure 2. At eight of nine stress levels, fatigue cracks propagated fastestin the 5.1-mm-thick (0.20-in.) 7075-T6 specimens. However, for a given stress level,

the ratio of the maximum to the minimum number of cycles required to reach a givencrack length never exceeded 1.7, thereby indicating a relatively small thickness effect.
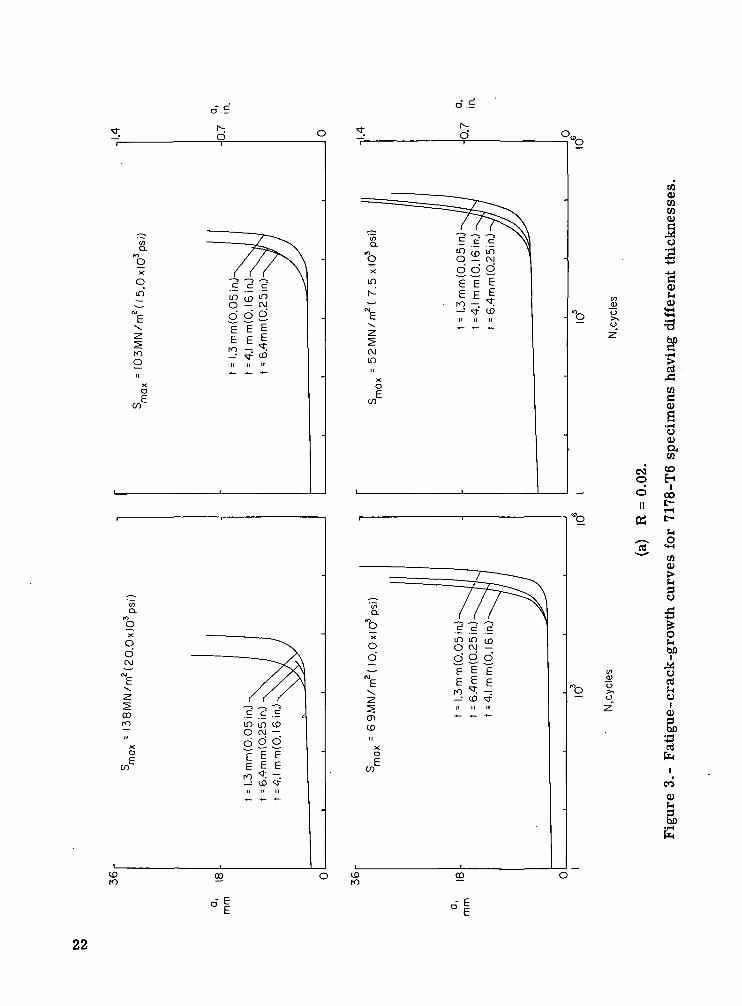
The fatigue-crack-growth curves for the 7178-T6 specimens are presented in fig-ure 3. At six of seven stress levels, fatigue cracks propagated slowest in the 1.3-mm-thick (0.05-in.) 7178-T6 specimens. For a given stress level, the ratio of the maximumto the minimum number of cycles required to reach a given crack length never exceeded2.7, thereby indicating a moderate thickness effect.
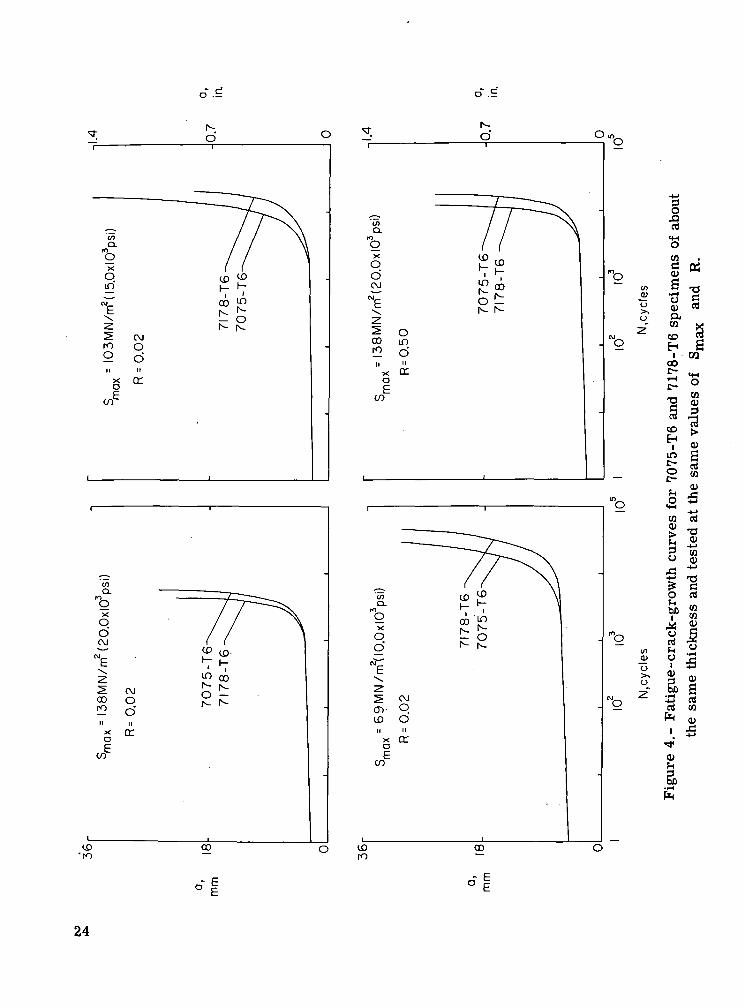
Fatigue-crack-growth curves for 7075-T6 and 7178-T6 specimens of about the samethickness (5.1 and 4.1 mm (0.20 and 0.16 in.), respectively) and tested at the same valuesof Smax and R are shown in figure 4. For a given stress level, the ratio of the max-imum to the minimum number of cycles required to reach a given crack length neverexceeded 1.7. In two instances fatigue cracks grew fastest in 7075-T6, and in the twoother instances, fastest in 7178-T6. Thus, in the thickness range of 4 to 5 mm (0.16 to0.20 in.), the two alloys appear about equally resistant to fatigue-crack propagation.
Inspection of the fracture surfaces of the specimens (fig. 5, for example) indicatedthat intermittent bursts of crack growth (referred to hereinafter as "pop-in" (ref. 17))occurred in the interior of specimens having thicknesses as small as 4.1 mm (0.16 in.).The dark areas in figure 5 indicate pop-in. The light areas indicate normal, microscopicfatigue-crack growth. The reason for this pop-in is not understood at this time.
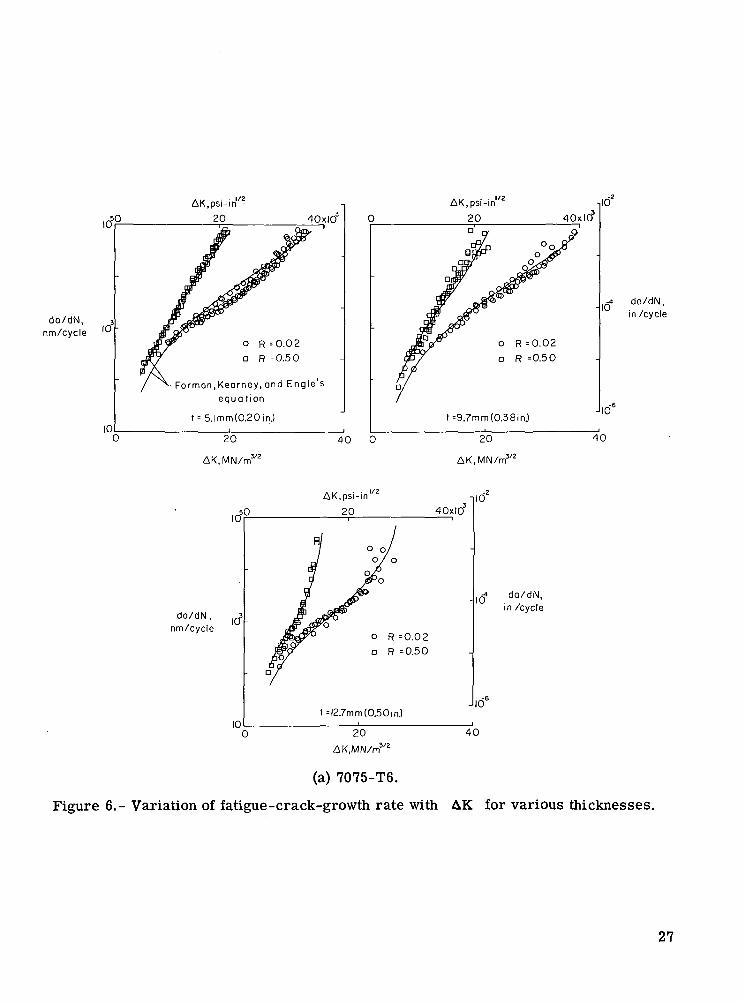
The fatigue-crack-growth data in table III were analyzed by using stress-intensitymethods (see appendix C). For a given thickness and value of R, the rate of fatigue-crack growth was a single-valued function of the stress-intensity range for 7075-T6 and7178-T6 (fig. 6).
An empirical fatigue-crack-growth equation developed by Forman, Kearney, andEngle (ref. 9) was fitted to the test data. This equation has the form
da C(AK)n m
dN (1 _ R)Kcn - AK
(The symbol K^ is denoted by Kc in ref. 9.)
The empirical constants C and n were determined by using least-squares tech-niques to fit the equation to the data. When these constants were determined in SI Units,AK and Kcn were given in MN/m«v2 ancj da/dN was given in nm/cycle. When Cand n were computed in U.S. Customary Units, AK and Kcn were given in psi-inl/2and da/dN was given in in./cycle. The values of C and n determined for the differ-ent thicknesses are listed in the following table:

Aluminumalloy
7075-T6
7178-T6
t
mm
5.19.7
12.7
1.34.16.4
in.
0.20.38.50
0.05.16.25
C
SI Units
25.923.158.2
18.523.863.2
U.S. Customary Units
1.05 x 10"11
1.19 x 10-112.77 x ID'9
3.63 x 10-H2.96 x 10-H1.80 x 10~8
n
2.692.631.99
2.452.521.72
Equation (1) fit the test data reasonably well.
Fracture-Toughness Experiments
The results of the fracture-toughness experiments on the 7075-T6 and 7178-T6specimens are listed in table IV. This table gives the half-length of the crack at thestart of the fracture-toughness test a^, the maximum gross stress applied to the testspecimen during the fracture-toughness test Sf, and the critical stress-intensity factorKcn. This factor was calculated by using the equation
(2)
where a is given in appendix C.
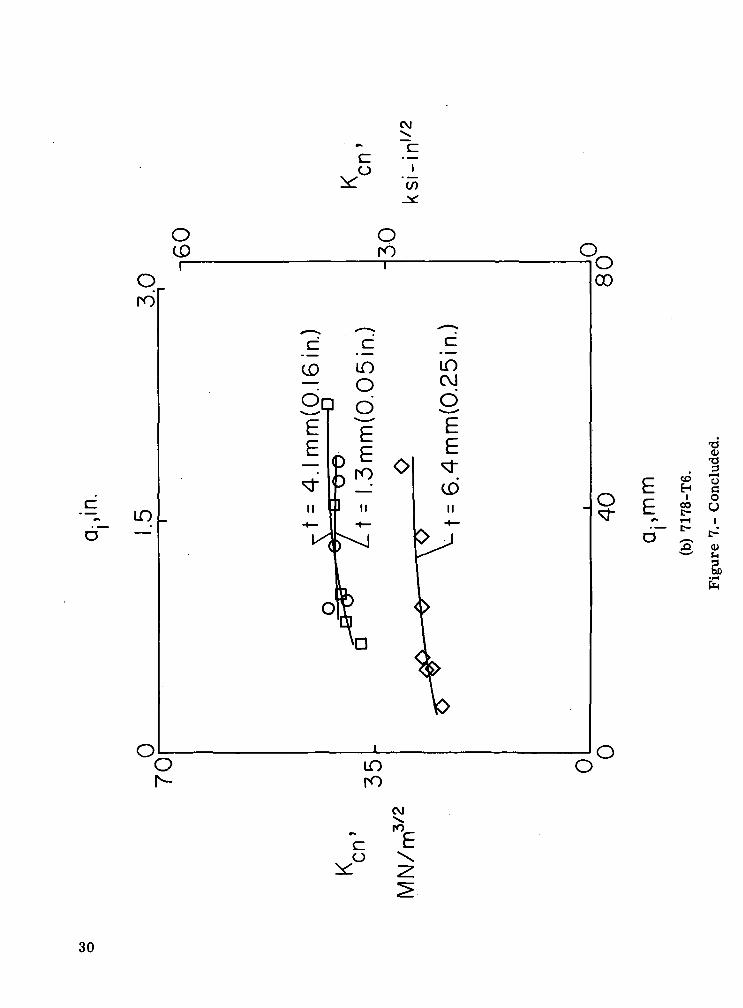
The values of Kcn for the various thicknesses are plotted against a^ in figure 7.Analysis of the data in figure 7 indicates that the fracture toughness of the 12.7-mm-thick(0.50-in.) 7075-T6 was, on the average, about two-thirds of the fracture toughness of thethinner gages of 7075-T6. The average fracture toughness of the 6.4-mm-thick (0.25-in.)7178-T6 was about two-thirds of the fracture toughness of the thinner gages of 7178-T6.Figure 7 also indicates that Kcn increased with increasing crack length. A similarvariation of Kcn with crack length occurred in tests on through-cracked 2014-T6 and2219-T87 aluminum alloys (ref. 18).
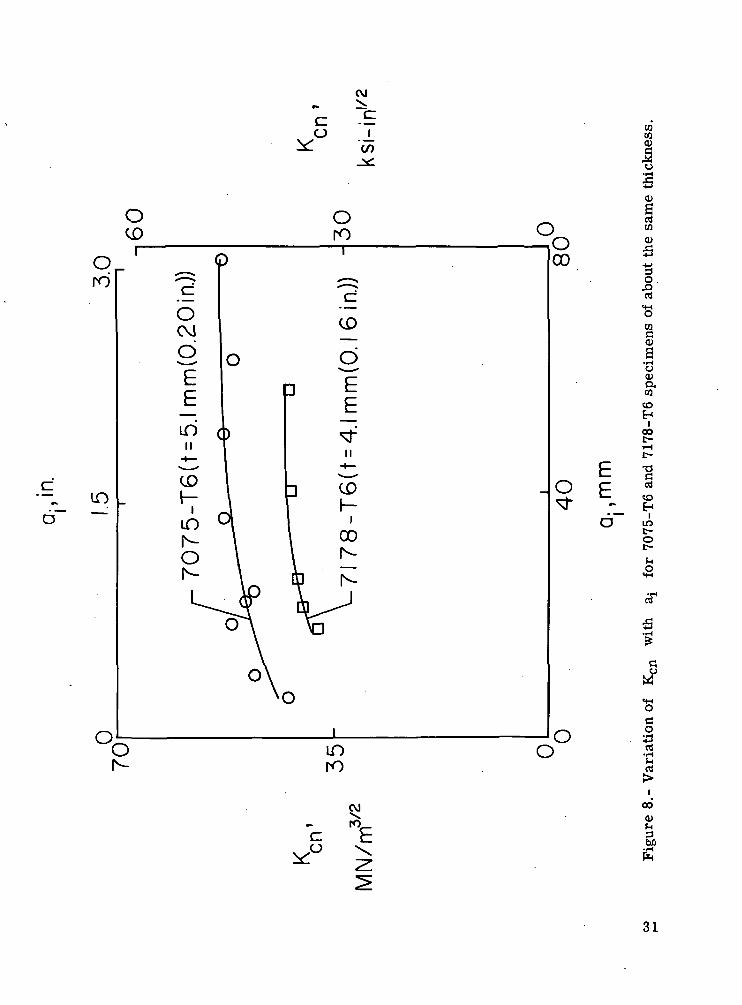
Values of Kcn for 7075-T6 and 7178-T6 specimens of about the same thickness(5.1 and 4.1 mm (0.20 and 0.16 in.)) are plotted against a^ in figure 8. The fracturetoughness of 7075-T6 was about 20 percent higher than the fracture toughness of 7178-T6.
CONCLUSIONS
A study was made to determine the effects of specimen thickness on fatigue-crackgrowth and fracture behavior of 7075-T6 and 7178-T6 aluminum-alloy sheet and plate.

The 7075-T6' specimens had thicknesses of 5.1, 9.7, and 12.7 mm (0.20, 0.38, and0.50 in.); the 7178-T6 specimens had thicknesses of 1.3, 4.1, and 6.4 mm (0.05, 0.16, and0.25 in.). The stress ratios R (ratio of the minimum stress to the maximum stress)used in these experiments were 0.02 and 0.50. The experimental results were analyzedby using stress-intensity methods, and an empirical equation was fitted to the data. Thefollowing conclusions can be drawn from this study:
1. For 7075-T6, material thickness had relatively little effect on fatigue-crackgrowth. The fracture toughness of the 12.7-mm-thick (0.50-in.) 7075-T6 was about two-thirds of the fracture toughness of the thinner gages of 7075-T6.
2. For 7178-T6, fatigue cracks generally grew somewhat faster in the thicker gagesthan in the thinnest gage. The fracture toughness of the 6.4-mm-thick (0.25-in.) 7178-T6was about two-thirds of the fracture toughness of the thinner gages of 7178-T6.
3. For a nominal thickness of 5.1 mm (0.20 in.), fatigue cracks in 7075-T6 and7178-T6 propagated to a given crack length in approximately the same number of cycles.For the same nominal thickness, the fracture toughness of 7075-T6 was about 20 percenthigher than the fracture toughness of 7178-T6.
4. During the fatigue-crack-growth tests, intermittent bursts of crack growth (pop-in) occurred in the interior of the 7075-T6 and 7178-T6 specimens having thicknesses§4.1 mm (0.16 in.). The reason for this pop-in is not understood at present.
5. An empirical equation developed by Forman, Kearney, and Engle (in Trans.ASME, Ser. D: J. Basic Eng., vol. 89, no. 3, Sept. 1967) fit both the 7075-T6 and 7178-T6crack-growth data reasonably well.
6. For a given thickness and value of R, the rate of fatigue-crack growth wasessentially a single-valued function of the stress-intensity range for 7075-T6 and 7178-T6.
Langley Research Center,National Aeronautics and Space Administration,
Hampton, Va., February 20, 1973.

APPENDIX A
CONVERSION OF SI UNITS TO U.S. CUSTOMARY UNITS
The International System of Units (SI) was adopted by the Eleventh General Con-ference on Weights and Measures held in Paris in 1960 (ref. 10). Conversion factorsrequired for units used herein are given in the following table:
Physical quantity
ForceLengthStressStress intensityFrequency
SI Unit(a)
newtons (N)meters (m)newtons per sq meter (N/m2)newtons per meters/2 (N/m3/2jhertz (Hz)
Conversionfactor
(b)
0.2248.3937 x 102
.145 x 10-6
.9099 x 10'6
60
U.S. CustomaryUnit
Ibfin.ksi = 103 lbf/in2
ksi-inl/2cpm
aPrefixes and symbols to indicate multiples of units are as follows:
Multiple
10-9
10-3103
106
109
Prefix
nanomillikilomegagiga
Symbol
nmkMG
^Multiply value given in SI Unit by conversion factor to obtain equivalent in U.SCustomary Unit.

APPENDIX B
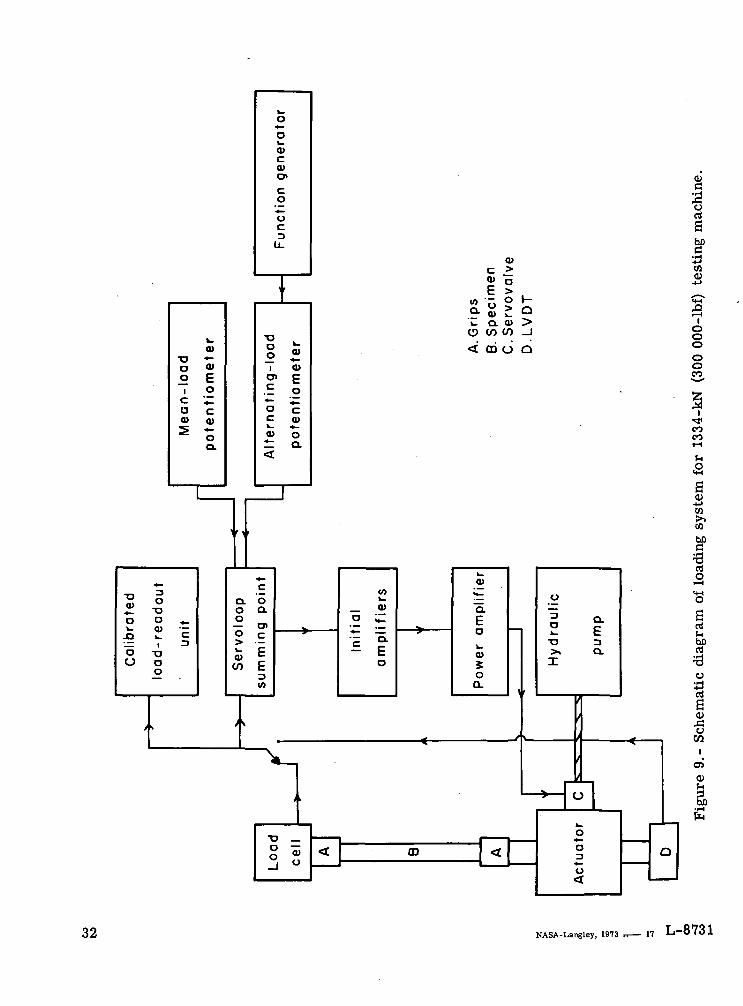
DESCRIPTION OF 1334-kN (300 000-lbf) FATIGUE TESTER
The 1334-kN (300 000-lbf) machine is an analog closed-loop servohydraulic fatigue-testing system. A schematic diagram of the loading system is shown in figure 9. To usethis system, the operator first sets in the desired mean load by adjusting the mean-loadpotentiometer. Then the desired alternating load is set by adjusting the alternating-loadpotentiometer (which controls the amplitude of the function generator signal).
The voltages from the mean-load potentiometer and the function generator are com-bined to form a command signal which is fed into the servoloop summing point. The volt-age from a transducer - either the load cell or the linearly variable displacement trans-former (LVDT) - is also fed into this summing point. The command and transducervoltages are summed and suitably amplified to form a signal which drives the servovalve.This servovalve directs oil to the appropriate side of the hydraulic cylinder to obtain thecommanded load. Load repeatability for this testing system is ±0.5 percent of the appliedload.
Loads are monitored by comparing on an oscilloscope the output voltage from theload cell (or LVDT) with an adjustable bias voltage which corresponds to the desired loadlevel for the test. When the sum of these voltages is zero, the desired load is on the testspecimen. (This comparison is made at both the maximum and minimum loads in thecycle.) The accuracy of this monitoring system is better than ±0.1 percent of full scale.
10

APPENDIX C•
FATIGUE -CRACK-GROWTH ANALYSIS
The fatigue -crack- growth data were correlated by the stress -intensity methods.Paris (ref. 19) hypothesized that the rate of fatigue-crack growth was a function of thestress -intensity range; that is
(Cl)
where
AK = Kmax - Kmin <C2>
For centrally cracked specimens subjected to a uniformly distributed axial load
(C3)
and
Kmin = «smin^ (C4)
The term a is a factor intended to correct for the finite width of the specimen (ref. 20)and is given by
01 =
11

REFERENCES
1. Hudson, C. Michael: Investigation of Fatigue Crack Growth in Ti-8Al-lMo-lV(Duplex-Annealed) Specimens Having Various Widths. NASA TN D-3879, 1967.
2. Figge, I. E.: Residual-Static-Strength and Slow-Crack-Growth Behavior of Duplex-Annealed Ti-8Al-lMo-lV Sheet. NASA TN D-4358, 1968.
3. Hudson, C. Michael: Effect of Stress Ratio on Fatigue-Crack Growth in 7075-T6 and2024-T3 Aluminum-Alloy Specimens. NASA TN D-5390, 1969.
4. Hudson, C. Michael; and Hardrath, Herbert F.: Effects of Changing Stress Amplitudeon the Rate of Fatigue-Crack Propagation in Two Aluminum Alloys. NASATND-960, 1961.
5. Hudson, C. Michael; and Raju, K. N.: Investigation of Fatigue-Crack Growth UnderSimple Variable-Amplitude Loading. NASA TN D-5702, 1970.
6. Figge, I. E.; and Hudson, C. Michael: Crack Propagation, Delayed Failure, andResidual Static Strength of Titanium, Aluminum, and Stainless Steel Alloys inAqueous Environments. NASA TN D-3825, 1967.
7. Figge, I. E.; and Newman, J. C., Jr.: Fatigue Crack Propagation in Structures WithSimulated Rivet Forces. Fatigue Crack Propagation, Spec. Tech. Publ. No. 415,Amer. Soc. Testing Mater., 1967, pp. 71-93.
8. Poe, C. C., Jr.: Fatigue Crack Propagation in Stiffened Panels. Damage Tolerancein Aircraft Structures, Spec. Tech. Publ. No. 486, Amer. Soc. Testing Mater., 1971,pp. 79-97.
9. Forman, R. G.; Kearney, V. E.; and Engle, R. M.: Numerical Analysis of Crack Prop-agation in Cyclic-Loaded Structures. Trans. ASME, Ser. D: J. Basic Eng., vol. 89,no. 3, Sept. 1967, pp. 459-464.
10. Comm. on Metric Pract.: ASTM Metric Practice Guide. NBS Handbook 102, U.S.Dep. Com., Mar. 10, 1967.
11. Anon.: Standard Methods of Tension Testing of Metallic Materials. ASTM Designa-tion: E 8-69. Pt. 31 of 1971 Annual Book of ASTM Standards. Amer. Soc. Test-
( ing Mater., c.1971, pp. 194-213.
12. Hudson, C. Michael: Fatigue-Crack Propagation in Several Titanium and Stainless-Steel Alloys and One Superalloy. NASA TN D-2331, 1964.
13. Grover, H. J.; Hyler, W. S.; Kuhn, Paul; Landers, Charles B.; and Howell, F. M.:Axial-Load Fatigue Properties of 24S-T and 75S-T Aluminum Alloy as Determinedin Several Laboratories. NACA Rep. 1190, 1954. (Supersedes NACA TN 2928.)
12
14. Hudson, C. Michael; and Hardrath, Herbert F.: Investigation of the Effects ofVariable-Amplitude Loadings on Fatigue Crack Propagation Patterns. NASATND-1803, 1963. /
15. Kuhn, Paul; and Figge, I. E.: Unified Notch-Strength Analysis for Wrought AluminumAlloys. NASA TND-1259, 1962.
16. Brueggeman, W. C.; and Mayer, M., Jr.: Guides for Preventing Buckling in AxialFatigue Tests of Thin Sheet-Metal Specimens. NACA TN 931, 1944.
17. Hartbower, C. E.; Gerberich, W. W.; and Liebowitz, H.: Investigation of Crack-Growth Stress-Wave Relationships. Eng. Fracture Mech., vol. 1, no. 2, Aug. 1968,pp. 291-308.
18. Orange, Thomas W.; Sullivan, Timothy L.; and Calfo, Frederick D.: Fracture of ThinSections Containing Through and Part-Through Cracks. NASA TN D-6305, 1971.
19. Paris, Paul C.: The Fracture Mechanics Approach to Fatigue. Fatigue — An Inter-disciplinary Approach, John J. Burke, Norman L. Reed, and Volker Weiss, eds.,Syracuse Univ. Press, 1964, pp. 107-132.
20. Brown, William F.; and Srawley, John E.: Plane Strain Crack Toughness Testing ofHigh Strength Metallic Materials. Spec. Tech. Publ. No. 410, Amer. Soc. TestingMater., c.1966.
13

TABLE I.- AVERAGE TENSILE PROPERTIES OF ALUMINUM ALLOYS TESTED
tmm in.
CTu
MN/m2 ksi
CTyMN/m2 ksi
e,%
E
GN/m2 psiNo. oftests
7075-T6
5.1
9.712.7
0.20.38.50
595574598
86.383.386.7
542
528551
78.676.679.9
13.012.615.5
69.069.769.7
10.0 x 10⁶
10.110.1
7178-T6
1.34.16.4
0.05.16.25
608624
622
88.290.590.2
564
586593
81.885.086.0
12.712.813.0
66.969.069.7
9.7 x 10⁶
10.010.1
6
66
366
TABLE H.- NOMINAL CHEMICAL COMPOSITIONS OF
ALUMINUM ALLOYS TESTED
Aluminumalloy
7075-T6
7178-T6
t
mm
5.1
9.7
12.7
1.34.16.4
in.
0.20.38
.50
0.05.16.25
Element, percent by weight
Si
0.11.11.11
0.11.08
.08
Fe
0.28.25
.28
0.28.28.28
Cu
1.721.691.72
1.762.062.06
Mn
0.13.07.13
0.05.07.07
Mg
2.742.512.74
2:642.992.99
Ni
0.01.02
.01
0.02.02
.02
Cr
0.21.20.21
0.19.20.20
' Z n
5.635.705.63
6.976.866.86
Ti
0.05.05
.05
0.04.03
.03
Al
Bal.Bal.Bal.
Bal.Bal.Bal.
14
§
oH
1"oa
g,
1Ctt
C
0
0
££
ineg
t,O
rt
if"rt
rt
rack f
rom
o>
It*a.o•aVi.•A
co
uCJ
"30)
p
vera
ge n
u
fl0 g
""•is
of
nS
£5
S 5S§
sl
lft — I
"8
OO
E.StoococnCMO*.
£.5CMOCOCO
o'o*CM*-^
E7COOt*-t-
£.5TOeg CDm*o
£.S00finego"_
E.£<DO
OS
|5s»C-'S
ico1"!co'S
i;
* £aCJ
tg
"wM
eg
.-
eg
Sc
££
0 O
S oCD
CO ~HCO T
O O OO O O~H f egin CM ^i-l CO T
S o Oo o
T i-H O
0 O 0in o o
1-1 eg co
O O O 0 0eg m o o oIft iH ^ C- CO
m T CD co t-'-t eg -H co
ooo o oco in o o o
in eo T to eo
§ 00 in o oo o e>a o o
in eo eg co co m.1-1 eg 1-1 co
eg CD in in o oin eg O co co co
^H ca r-t co
o co cn in co egin I-H D- co in o
O O O O O O O Oeg co m o co in o oeg f in CD c n c o c o o
§ 0 0 0 0 0 0 0 0^ C O O O C N O O O O
•-i «-" eg
m o o o m o o o oo i c o o o c o c n o o o
~ « r- « - « - 2
c o m o o i n o o oT O c g i n t - c o o oc o o o i n c - C D T C O O
eg T IH -q- co
C O C O O O C O O O O
1-1 ea 1-1 co T
c M e g e g e g e g o o o o o
o
O O O O O O O O O OC D C D C D C O C O C O C D C O C O C O
o o o o o o o o o o
S O O t n o o o o o e gc - - c o e o c n o c o c - o c o
r* -H £i i-i y
- H T c o t - c o o e g e g i n c n
e o o c D ^ e o c D i n T c o c ,
o o o m o . o o o o t -
omo t-in o i n o incneg *-* ^H co eg eg ~*
T O c - i n c o O t - c o o c o
O
0
m*
§ |eo coeg co
§ §eg ooeo C-eg co
1 IIeg co coeg eg eo
S o o o0 00
co eg D- ineg eg co
S o o o0 0 O
CO t- C- 0
CO i-( C- COeg ea co
o o o oin o in ineg eg T t-co -« t- --H
eg eg eo
o o o oCO O O Oo CD eg oeo o c- o
eg eg co
o o oooco o in o oco co t- co mt- cn co CD t-
I-H eg eg
o o oooeg o m o om co co 1-1 oC- CO CO CO CO-H CM eg
O O in o o Oea o in in o oo •* co in --t ot- t- eg co in co
1-1 eg i-<
o o o o o o oCD ^ o cn in o oin co m eg <-• i-» oI-H CD m ea co co o
1-1 eg i-»
CO CD O CD in O O
»H in CM ea t- cn cn^* r-t cn
C M O O O O O O O
T O t - e o c o c o — 1 01-1 co co IH in ~* c-
<-* c-
t - m o o o o o oe g o o o c - m o o
ea in i-i co CD egin
c M c x i e g e g o o o oo o o o i f t i n t n i nO
O O O O O O O O
o o o o o o o o
S o o ut» o o o egC- CO CO CO C- O CO
^ ^ c o t - e a e g i n c n
c o o c o m i f t T c o e g
ino o o m o o o t -T c o e g c o o o o c n
eg 1-1 --i eg eg '-'
o m o e g e g c - c o c oT O C - i n t - c o o c o
COCO
0
c-cn
oinCD
COCO
oinc-c-co
segCDCO
0 Oin oi-H CD
T enco in
O 0in oCM C-
1-1 COeo in
en co c-01 0 C-I-H eg in
§ in inCO CO
cn t- coI-H eg in
§ 0 0
eg coOi Ift TI-H eg in
§§ S|CO CM t- i-H•-i eg *H m
t- O in o oo co eg in t-co CD cn t- t-
o o o o oin o in o oCD o CM cn c-r— in in CD eg
in o o o O OCD in o in o m
>H co eg 01 T ini-H r-t CO
o o »n ooo^* o eg in o o•• co c- *-< t- inI-H T co in en CM
CM
O in o in in o O01 c~ o co ea in oCO T}* CD Oi tO T O
eg o r-< eo m co
g cM eg CM O O O Oo o o in in in in
0
O O O O O O O OC O C O C D C D C D C D C O C O
O O O O O O O O
mo o i n o o o o e gc - c o c o c n c o t - o c oT c n f ^ - c o c o m c o
^ • c o i > c o e g e g i n c n
o c D i n c o i n T c o c g
tno o m o o o o r -
i f t o r - m ' i f t o t n c r ii-« I-H CM eg ^
i n o e g m e g c - c o c oO t - i n c o c - e o O c o
S0
c-eg*
|
zCJ
0)
rt
o"Lla2•a
1sc
u
tn0)
i0)
ss
1
|
eo
cnu
E
rt
C
m
££
iirt
0
•o
rt
0
Q.
aT3
•a | X
I S 5
rt £ 0.
. AJ
8 2 1«a-°§
IIrt
g.
ga.
1•8
°, S °,
E
15
Iu_Iw
§
>
g
O
g
I
QWS
<y
CJJo
m
ZW
W
Sm
1o
a
bfie
"rtjzrto
c
ofH
o
£E
•<»•inCM
$<O
rt
£C0)1artJ3rt
rack
fro
mD
agat
e a
c
0LIa0
9o"0>I*en0)*oo
*0
1pg0)bD2a>
<
g,g
n a
J £
wj
£~£3MOD-CO
tri i-<
s =CO COO-H•v — •
£~£.5(DOin^>m' .-Ico^
E~SS
00 0•* eg
O-HCO*—"
£~£5oo-q-0
tn «-l"CM*-^
5-e.sCDOco a>
S'S
S.SNOCOCO
Sse^S.S0) Ot^ c-
^"S
e^S.S
CM CD
iri o.
E!°-sN C^
S.Sto o-1 -31
®s
7.62
m
m(0
.30 in
.)
|7
»s,r>S
11-i *"
«eE
* Sa,u
* NX
'co
*CN
S
z
3
N
2T
C
£E
ooo
CO
o og §,-« e-•* r-
§ o oo oo o
o> -< -iCO CO l>
S O O0 0
mo O•fl« eg •**MM tQ
§ o o0 O
in o o^H CD enCO ~* 10
§ 0 o o o o oo o o o m o
in CM O O CB t- OOl O CO O CD in CO
eo ca —< ^H TJ« us
o o o o o o oin O O O O O Oco m to o ^* tf3 Oo 01 eo ^ co tn co
M W O 1-1 *3* •*
m o o o o irt oM O O O O C-l O>-» in 10 o t- CD oOJ CO C- -V lO O »ft
cj -H 01 ^-t -^ e-j
O O O O O O OO O O O O lO OCO ^ O O £- C«J OCO C- O m' ff C- Ol
esi ^H ao 1-1 oo --M
to o O O O O OCN O O O IO O OW 0 0 O -^ O OCO IO <H t- « CO O
Cfl O CD ^H rt Ol
§ O O O O 1/5 Oo o o o t- o
M M t« O ^ M OC- — I O « ^H C- «
rg o> v •-* « to
moo o Ot- O O O OO O O O> U3m in •<*• c- co
.-1 t- .-1
g oo o oO O O irt
>-»>- * O CO «
•-H Ift ^H
M M CM CJ O O OO O O O IT3 LO tfi
0
0 0 0 0 0 O OCD CO *3" ^ CD tP -V
CO CO CO
O O O O O O O
^ ^ S S "" ^ 2m
o m o c- o in oCO CO OS CD O C~ m
J3 - 0
CD C- GO « tO CP CMc~ o oo tfi 'j' to t-CO ITS M CM C-3 CJ "H
inO in O M O lO OM CD —1 CO O C3 «3
" - -c- m w cq o f- m
IOoocr>
O 0
g g2 2
§ go inO eo-* o
o oo oen tn• - --I0 0
§ o o
o inin co E-t- a> 01
0 0 O 0O O O Otn o •<*• oeg 01 —i Mt- CO — I O>
0 O 0 0 OM o o m oeg m o m off O -O1 "H O
r- ao 1-4 o>
o o o o o o0> 0 O O 0 O•-i co o in M m• 0 CO CO -I CO
-H CD t- i-l 00
o o o o o o o^. to o o in o o,-H ^ o m -H *4 o^« 01 in ~* "H co eg
I-H CD c- <-H m co
§ § g § g § §O c~ O ' O O) O in•^ co •-* ^ o m m
r-t CD CD <-H M C-
O 0 0 O O 0 Oco o o o in o oco -^ tn o us ej o« t- CD CD O to C-
-H in m >-« M CD
o o o o o o oO tn o o m o O
•-• in ^ m m
o o o o o o oo o o o o o o.-i -i m in co ai oM ea to co co tn ai
-H ^* « « CO
S o o o o00 O 0
i-H -H O CN COCM t- ~* CD CO
CO -<
§ g g g gco o o o ^r
CJ ~*
eg eg CM M o o oo o O o in us m0
o o o o o o oCD ^ -V •V CO T CO
CO CO 00 ^H 00 i-"
O O O O O O O
"* 2 2 S m 2 M
ino in o c- o in oco « as CD o t- m
£i U
CD t- oo co in o> egc- o co in -^ m ir-co in co eg co N ^-"
mO m o eg o tft oeg CD 1-1 co o eg m
- -
t- m co CM o t- in
CD
O
TT
oootn0
1oO5
0 Oo om ineg ij»en co
o o§tn
eg
§ r-t-
in ot- 0c- coCO C-
m o int- O eg•«• co t-00 CD to
o o mo O eg^H ca ^CO CD IO
o o oo o mm tn i>tO "T TC- lO ->ji
o o o oo o o oco O if> tnin TH m co^H c- TT eo
iO o O O O OM O O O O Oc— CM O o o mCD - r m CM co
^H CD CO CO CM
O in o o o in o~H CD in o as eg oCD ^ co i-< in tn tr
rf tn eg >-« eg —«
S O O 0 0 Oin o o o o
co i-f in o — t i nCO -C1 t- t- CM T»-
CO ^ '-<
O O O O O O~H iO O O O O^ CM eo tn ^ o
CM
e s i e g e g e g e g o o oO O O O O t n t n i n0
o o o o o o o oc D c D c n o o o c o e g ot- CO i-l CO
o o m o o o o o- . - H - H c o « - . e g o
m ine g o m o c - o i n oo c o c o c n c o o c - t n
-4 £1 0
O C D C - C O C O t n O J C Mc o t - o c o m ^ ' i n i r -t - c o i n c o c s i c o e g ' - i
m toc - o i n o c M O i n o^ c M c o ^ H c o o e a i n
-H -. ° -H
t - t - i n c o c g o t ~ " n
inea0
•*CD
S S2 S
•3 -3rt rtt, hCJ O
O Vrt rtbo bO
a ag sa. a2 2•O "O
Ll Pi
1. '10) CDLi Li
Li LtS S1 1g iOJ CULi (Hrt rt
5 5J01 W
3 3CO COO 0)73 13u u
£ £a avi tn<" |
Sj S
S £0 0
3 SO CO
E S^
^ ^S Sm ooen "iCO CDCD CO
tl 11
S SS E
rf ra
c ej
0. O,
£ S£ Em in
ll nrt ca
2 2•o -a
rt «bC bort Rf
2 Sa a
rt «•a -a
•-o 2 ^. S ~S S e SI eS S .5 a .5
S « S « 8« » o s =>o. j ji:g u s « e
«w .u S o° g
II tlrt n
16
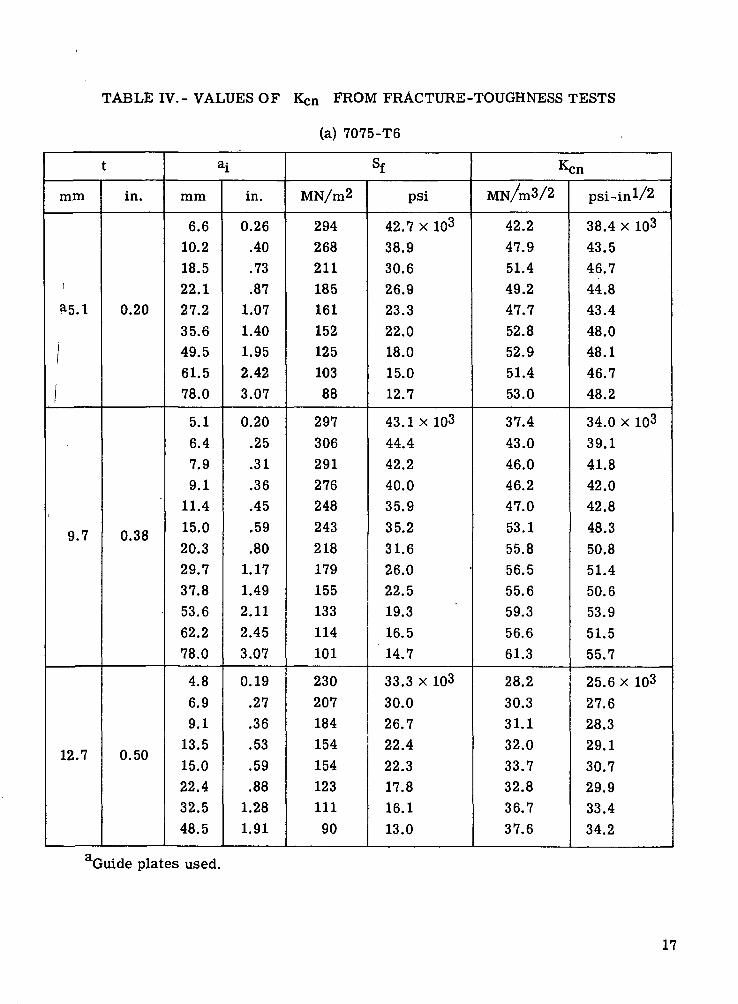
TABLE IV.- VALUES OF Kcn FROM FRACTURE-TOUGHNESS TESTS
(a) 7075-T6
t
mm
i
as.l
I
I
9.7
12.7
in.
0.20
0.38
0.50
ai
mm
6.610.218.522.127.235.649.561.578.0
5.16.4
7.99.1
11.415.020.329.737.853.662.278.0
4.8
6.99.1
13.515.022.432.548.5
in.
0.26.40.73.87
1.071.401.952.423.07
0.20.25.31.36.45.59
.801.171.492.112.453.07
0.19.27.36.53.59.88
1.281.91
Sf
MN/m2
29426821118516115212510388
297
306291276248243
218179155133
114101
230207184154
154123111
90
psi
42.7 x 10³
38.930.626.923.322.018.015.012.7
43.1x10344.442.240.035.935.231.626.022.519.316.514.7
33.3 x 10330.026.722.422.317.816.113.0
Ken
MN/m3/2
42.247.951.449.247.752.852.951.453.0
37.443.046.046.247.053.155.856.555.659.356.661.3
28.230.331.132.033.732.836.737.6
psi-inV2
38.4 x 10343.546.744.843.448.048.146.748.2
34.0 x 10³
39.141.842.042.848.350.851.450.653.951.555.7
25.6 x 10327.628.329.130.729.933.434.2
Guide plates used.
17

TABLE IV.- VALUES OF Kcn FROM FRACTURE-TOUGHNESS TESTS - Concluded
(b) 7178-T6
tmm
ai.3
a4.1
6.4
in.
0.05
0.16
0.25
ai
mm
23.624.933.844.247.5
17.821.325.940.156.6
7.613.513.715.523.935.346.7
in.
0.93.98
1.331.741.87
0.70.84
1.021.582.23
0.30.53.54
.61
.941.391.84
Sf
MN/m2
153
140124
10399
156152139
112
91
157
128122122
9879
75
psi
22.2 x 10³
20.318.014.914.4
22.6 x 10³
22.120.216.213.2
22.8 x 10³
18.517.717.714.211.410.9
Ken
MN/m3/2
42.539.741.540.740.9
37.239.740.641.742.3
24.326.525.527.127.427.330.8
psi-inV2
38.6 x 10³
36.237.837.137.2
33. 9 x 10³
36.136.937.938.5
22. lx 103
24.123.224.624.924.928.0
Guide plates used.
18

0.25(0.01)
I. 2.54 J Ti in in) I
Detail of notch
Figure 1.- Specimen configuration. All dimensions in mm (in.).
19
n. S
"oX
oc>to
oo
o co •-in rr> O2CJS
II!2J CTi in
roO
6
22 SE E -f
CMo
&
- I
O>coto<u
c0)^0>
IPICQ
(1)
a•rHU<U&CQ
inc-o
co
CJ
5IU
o
iSi
co'
20

Is-.o o — •
Q.
"b
co
S
CO
oi CM tn
en
II
Q.
"oXtoro'ro
Oro
OdCM
COro
IE!!?co o oro in CMdo b£ E ~E
*E E EN r-. —crj CM m
7301
73
'oGOOi
<M'CD
bo
"O 5,— o
00 CDrr>
00
21
Q.roo
qiri
roO
8
CQ0)COCQ0)
•CDtiCD
ICO
CD
oo>O.co
a.toOX
qdC\J
00ro
oE
d c .Em in toO CM —o 22
I I Iro . —;—i U) ^3"
O)ID
oE
"b
CQ0)
f-i
35IibD
urt
g>
=3
CO
cu
oo toro
00
- £0 E
22

d
s.
OOC\J
COro
o
X
Oiri^"e\zt .roO
XoE
00
i i i \ \
S ?? \m ID mO — CMd d d
. E E EE E Ero - r.— * ID
1
1
"
-
in<u
ro °
- H•
in mCM OOEE E*. roID —'
O dE E
U)ro 00
oino
.—• <a- 1001ID
oE
130)
"C^HucouI
CO
0)S-i
IDro
00 O
23
o.E
N-d
inQ.
xqdCM
00ro
OinO
o
co
inCL
"2xOd
OV(D
o
coE
CMqd
Mo:
O>,o
rt
co0)s•3o>CO
coHi
oo
CO
c-oc-
8
rtcoCD
" J2* *CQ
3 rao g
O rt
^ s
v+3 oioi co
fe o>
O)(H
roCD
24

toHinc-or-
o.abJS<nwsCO
CD
^b£s
25

CMI
COt-I
oo>oCLOi_Q.i
J5COov_OI
<D3O>
•«—O
OoQL
co
COc-
tuIuo
'Irt
gg,
26
do/dN,nm/cycle 10"
10
AK,psi-in20 40x10
o R=0.02c R =0.50
-Formon,Kearney , and Engle'sequa t ion
t = 5.lmm(0.20in.)
AK,psi-in"2
20 40xl03
Id2
o R =0.02D R =0.50
t=9.7mm(0.38in.)
20
AK.MN/m3'
io5
40 0
AK,psi-in
20
20
AK,MN/m3'2
40x10
da/dN, 3nm/cycle
10
o R =0.02D R =0.50
da/dN,in /cycle
t=l2.7mm(0.50inj10°
20 40
10da/dN,in/cycle
40
AK.MN/m3'2
(a) 7075-T6.
Figure 6.- Variation of fatigue-crack-growth rate with AK for various thicknesses.
27

I05P-
da/dN,nm/cycle
10
AK,psi-in"2
20 40xl03
o R = 0.02a R = 0.50
-Forman,Kearney,and Engle'sequation
t = l.3mm(0.05in.)
20
AK,MN/m3/
40 0
AK,psi-in'/2
20 40x10
t = 4.lmm(O.I6in.)
20
AK,MN/m3'
.4 da/dN,
in /cycle
40
10"50
da/dN,
nm/cycleio3
10
AK, psi-in
20 40xl03
o R = 0.02a R=0.50
t = 6.4mm(0.25in.)
20
AK,MN/m3/2
(b) 7178-T6.
Figure 6.- Concluded.
10da/dN,
in /cycle
J10°
~40
28

O
O(D
Oro O
Ord
n
Q
ooo
oEE
co
O IT)ro
OO
co0>COcoo>
c0)!HCU
a*IaOO)
CO
t- oO <inC-
flj TO
§
Ic-0)^s,
cO
CMXro
29
CM
o '^ •</)
aoCDr~
Oro O.
loo
—~ LO
EE
CO o
H Ci O
CO O
— c- It><u
o IDro
OO
o
CM
to.
30
CM
o J_C/J
coCO
Io
O
oro
O.O
Oro
inro
CM
CO
OOoo
P E
OO
CO
o>
O
(Uo.01co
oo
rt
inc-oc-J-lo
8*
•3
o
iCO
0>»-(
31
Fu
nct
ion
ge
ne
s1rtSbJO
a>
Me
an
-lo
ad
po
ten
tio
me
ter
Alt
ern
ati
ng
-lo
ad
po
ten
tio
me
ter
.11</> •- o l-
'C Q. o> >o to co _i
< CD O Q
'§°ooCO
COCO
S(V
CO
CO
bD
Irt
%3
o
«H
32 NASA-Langley, 1973 • 17 L-8731

NATIONAL AERONAUTICS AND SPACE ADMINISTRATION
WASHINGTON. D.C. 2O546
OFFICIAL BUSINESS
PENALTY FOR PRIVATE USE 93OO SPECIAL FOURTH-CLASS RATEBOOK
POSTAGE AND FEES PAIDNATIONAL AERONAUTICS AND
SPACE ADMINISTRATION451
POSTMASTER : If Undeliverable (Section 158Postal Manual) Do Not Return
"The aeronautical and space activities of the United States shall beconducted so as to contribute . . . to the expansion of human knowl-edge of phenomena in the atmosphere and space. The Administrationshall provide for the widest practicable and appropriate disseminationof information concerning its activities and the results thereof."
—NATIONAL AERONAUTICS AND SPACE ACT OF 1958
NASA SCIENTIFIC AND TECHNICAL PUBLICATIONSTECHNICAL REPORTS: Scientific andtechnical information considered important,complete, and a lasting contribution to existingknowledge.
TECHNICAL NOTES: Information less broadin scope but nevertheless of importance as acontribution to existing knowledge.
TECHNICAL MEMORANDUMS:Information receiving limited distributionbecause of preliminary data, security classifica-tion, or other reasons. Also includes conferenceproceedings with either limited or unlimiteddistribution.
CONTRACTOR REPORTS: Scientific andtechnical information generated under a NASAcontract or grant and considered an importantcontribution to existing knowledge.
TECHNICAL TRANSLATIONS: Informationpublished in a foreign language consideredto merit NASA distribution in English.
SPECIAL PUBLICATIONS: Informationderived from or of value to NASA activities.Publications include final reports of majorprojects, monographs, data compilations,handbooks, sourcebooks, and specialbibliographies.
TECHNOLOGY UTILIZATIONPUBLICATIONS: Information on technologyused by NASA that may be of particularinterest in commercial and other non-aerospaceapplications. Publications include Tech Briefs,Technology Utilization Reports andTechnology Surveys.
Details on the availability of these publications may be obtained from:
SCIENTIFIC AND TECHNICAL INFORMATION OFFICE
NATIONAL A E R O N A U T I C S A N D S P A C E ADMINISTRATION
Washington, D.C. 20546