Effect of Solvent and pH on the Structure of …wag.caltech.edu/publications/sup/pdf/607.pdfEffect...
13
Effect of Solvent and pH on the Structure of PAMAM Dendrimers Prabal K. Maiti, Tahir C ¸ ag ˇ ın, ‡ Shiang-Tai Lin, and William A. Goddard, III* Materials and Process Simulation Center, California Institute of Technology, Pasadena, California 91125 Received April 28, 2004; Revised Manuscript Received October 19, 2004 ABSTRACT: We report various structural and conformational properties of generations 4, 5, and 6 PAMAM (polyamidoamine) dendrimer [EDA (ethylenediamine) core)] at various protonation levels through extensive molecular dynamics (MD) simulations in explicit solvent. The presence of solvent leads to swelling of the dendrimer (by 33% for G5 compared to the case of no solvent). We find that decreasing the solution from high pH (∼10, no protonation) to neutral (∼7, only primary amines protonated) to low pH (∼4, tertiary amines also protonated) changes the radius of gyration of G5 from 21 to 22 to 25 Å, respectively. We also report such other structural quantities as radial density, distribution of terminal groups, solvent accessible surface area and volume, shape, and structure factors (to compare with SAXS and SANS experiments) at various pH conditions. We find significant back-folding of the outer subgenerations in the interior of the molecules at all levels of pH, contrary to original expectations and some SANS experiments but in agreement with other SANS experiments. We find significant water penetration inside the dendrimer, with ∼3 water/tertiary amine for high pH and ∼6 water/tertiary amine for low pH (all for G5). This indicates that the interior of the dendrimer is quite open with internal cavities available for accommodating guest molecules, suggesting using PAMAM dendrimer for guest- host applications. This estimate of internal waters suggests that sufficient water is available to facilitate metal ion binding. 1. Introduction PAMAM dendrimers have primary amine groups at each branch end and tertiary amine groups at each branching point. As the dendrimer generation g is increased, Table 1 shows that the number of primary amines grows as N ) cm g and the number of tertiary amines grows as N ) cm g - 2, where c is the number of branches of the core and m is the multiplicity of monomer. For EDA cored PAMAM, c ) 4 and m ) 2. At physiological pH 7.4, most of the primary amines are protonated, and by pH 4 all of the tertiary amines are also protonated. 1 The protonation level of the PAMAM can be altered by changing the solution pH, which in turn affects significantly the structure of PAMAM dendrimer. The size of the dendrimers also depends on the solvent quality, but there is disagreement concern- ing the magnitude and sign. 2,3 Small-angle neutron scattering experiments (SANS) in dilute solutions of D(CD 2 ) m OD (with m ) 0, 1, 2, 4) show 2 that with decreasing solvent quality the radius of gyration of generations 5 and 8 PAMAM dendrimer decreases by approximately 10%. However, other experiments con- tradict these findings. Recently, Nisato et al. 4 have studied the effect of ionic strength and pH on the conformational change of generation 8 PAMAM den- drimer in D 2 O using small-angle neutron scattering. They observed that the size of the generation 8 PAMAM dendrimer is insensitive to the variations of pH. This is also contrary to the predictions of Monte Carlo (MC) simulation studies by Welch and Muthukumar, 5 who predicted almost a 180% increase in dendrimer size as the ionic concentration and pH of the solvent are increased. Similarly, a Brownian dynamics study by Murat and Grest 6 revealed an increase in internal segment density when the dendrimer and solvent interactions are less favorable, which results in a 45%- 48% decrease of the size of the PAMAM structures. A major goal of this paper is to investigate systemati- cally the behavior of PAMAM dendrimer at various protonation levels in a good solvent. A few simulations 7 have been reported on the effect of protonation, but these simulations were performed in the absence of explicit solvent as well as counterions. Such approxima- tions may lead to unphysical results in the size and shape of the dendrimer. Also, the presence of solvent as well and counterions may significantly modify the end-group distribution within the dendrimer. In this paper we study systematically the effect of different levels of protonation in a polar solvent (water) on the structure of the dendrimer and more specifically their effect on the end-group distributions. Some applications of dendrimers require interior voids to accommodate guest molecules for guest-host ap- plications. The size of the internal cavities can be large Present address: Department of Physics, Indian Institute of Science, Bangalore, India 560012. ‡ Present address: Department of Chemical Engineering, Texas A&M University, College Station, Texas 77845-3122. * To whom all correspondence should be addressed: e-mail [email protected]. Table 1. Number of Atoms as Well as Primary and Tertiary Nitrogens in Different Generation PAMAM Dendrimer for Fully Atomistic Model generation no. of atoms no. of primary nitrogens no. of tertiary nitrogens 0 84 4 2 1 228 8 6 2 516 16 14 3 1092 32 30 4 2244 64 62 5 4548 128 126 6 9156 256 254 7 18372 512 510 8 36804 1024 1022 9 73668 2048 2046 10 147396 4096 4094 11 294852 8192 8190 979 Macromolecules 2005, 38, 979-991 10.1021/ma049168l CCC: $30.25 © 2005 American Chemical Society Published on Web 01/13/2005
Transcript of Effect of Solvent and pH on the Structure of …wag.caltech.edu/publications/sup/pdf/607.pdfEffect...

Effect of Solvent and pH on the Structure of PAMAM Dendrimers
Prabal K. Maiti,† Tahir Cagın,‡ Shiang-Tai Lin, and William A. Goddard, III*
Materials and Process Simulation Center, California Institute of Technology,Pasadena, California 91125
Received April 28, 2004; Revised Manuscript Received October 19, 2004
ABSTRACT: We report various structural and conformational properties of generations 4, 5, and 6PAMAM (polyamidoamine) dendrimer [EDA (ethylenediamine) core)] at various protonation levels throughextensive molecular dynamics (MD) simulations in explicit solvent. The presence of solvent leads toswelling of the dendrimer (by 33% for G5 compared to the case of no solvent). We find that decreasingthe solution from high pH (∼10, no protonation) to neutral (∼7, only primary amines protonated) to lowpH (∼4, tertiary amines also protonated) changes the radius of gyration of G5 from 21 to 22 to 25 Å,respectively. We also report such other structural quantities as radial density, distribution of terminalgroups, solvent accessible surface area and volume, shape, and structure factors (to compare with SAXSand SANS experiments) at various pH conditions. We find significant back-folding of the outersubgenerations in the interior of the molecules at all levels of pH, contrary to original expectations andsome SANS experiments but in agreement with other SANS experiments. We find significant waterpenetration inside the dendrimer, with ∼3 water/tertiary amine for high pH and ∼6 water/tertiary aminefor low pH (all for G5). This indicates that the interior of the dendrimer is quite open with internalcavities available for accommodating guest molecules, suggesting using PAMAM dendrimer for guest-host applications. This estimate of internal waters suggests that sufficient water is available to facilitatemetal ion binding.
1. IntroductionPAMAM dendrimers have primary amine groups at
each branch end and tertiary amine groups at eachbranching point. As the dendrimer generation g isincreased, Table 1 shows that the number of primaryamines grows as N ) cmg and the number of tertiaryamines grows as N ) cmg - 2, where c is the number ofbranches of the core and m is the multiplicity ofmonomer. For EDA cored PAMAM, c ) 4 and m ) 2.At physiological pH 7.4, most of the primary amines areprotonated, and by pH 4 all of the tertiary amines arealso protonated.1 The protonation level of the PAMAMcan be altered by changing the solution pH, which inturn affects significantly the structure of PAMAMdendrimer. The size of the dendrimers also depends onthe solvent quality, but there is disagreement concern-ing the magnitude and sign.2,3 Small-angle neutronscattering experiments (SANS) in dilute solutions ofD(CD2)mOD (with m ) 0, 1, 2, 4) show2 that withdecreasing solvent quality the radius of gyration ofgenerations 5 and 8 PAMAM dendrimer decreases byapproximately 10%. However, other experiments con-tradict these findings. Recently, Nisato et al.4 havestudied the effect of ionic strength and pH on theconformational change of generation 8 PAMAM den-drimer in D2O using small-angle neutron scattering.They observed that the size of the generation 8 PAMAMdendrimer is insensitive to the variations of pH. Thisis also contrary to the predictions of Monte Carlo (MC)simulation studies by Welch and Muthukumar,5 whopredicted almost a 180% increase in dendrimer size asthe ionic concentration and pH of the solvent are
increased. Similarly, a Brownian dynamics study byMurat and Grest6 revealed an increase in internalsegment density when the dendrimer and solventinteractions are less favorable, which results in a 45%-48% decrease of the size of the PAMAM structures.
A major goal of this paper is to investigate systemati-cally the behavior of PAMAM dendrimer at variousprotonation levels in a good solvent. A few simulations7
have been reported on the effect of protonation, butthese simulations were performed in the absence ofexplicit solvent as well as counterions. Such approxima-tions may lead to unphysical results in the size andshape of the dendrimer. Also, the presence of solventas well and counterions may significantly modify theend-group distribution within the dendrimer. In thispaper we study systematically the effect of differentlevels of protonation in a polar solvent (water) on thestructure of the dendrimer and more specifically theireffect on the end-group distributions.
Some applications of dendrimers require interior voidsto accommodate guest molecules for guest-host ap-plications. The size of the internal cavities can be large
† Present address: Department of Physics, Indian Institute ofScience, Bangalore, India 560012.
‡ Present address: Department of Chemical Engineering, TexasA&M University, College Station, Texas 77845-3122.
* To whom all correspondence should be addressed: [email protected].
Table 1. Number of Atoms as Well as Primary andTertiary Nitrogens in Different Generation PAMAM
Dendrimer for Fully Atomistic Model
generation no. of atomsno. of primary
nitrogensno. of tertiary
nitrogens
0 84 4 21 228 8 62 516 16 143 1092 32 304 2244 64 625 4548 128 1266 9156 256 2547 18372 512 5108 36804 1024 10229 73668 2048 2046
10 147396 4096 409411 294852 8192 8190
979Macromolecules 2005, 38, 979-991
10.1021/ma049168l CCC: $30.25 © 2005 American Chemical SocietyPublished on Web 01/13/2005

enough to accommodate relatively big molecules suchas dye Bengal Rose.8,9 On the other hand, very littleinformation is available on the internal structures andavailability of inner cavities for PAMAM dendrimer atvarious solvent conditions. In this study we obtaindetailed structural information about the interior ofG4-G6 PAMAM dendrimers and provide a quantitativeestimate of the available space inside. Several recentexperiments10-13 show that PAMAM dendrimers canform complexes with metal ions and those complexescan be used to produce metal nanoparticles upon reduc-tion of the dendrimer-metal complexes.14 However,taking into consideration the conventional binding modeof Cu(II) with the primary and tertiary amines fails toexplain the uptake of metal ions at all Cu(II)-den-drimer loadings. To explain the enhanced uptake of Cu-(II) ions at some loadings, we do a systematic investi-gation of the extent of water binding inside PAMAMdendrimer at various pH conditions. Our results on thenumber of water molecules trapped inside the PAMAMdendrimer correctly explain the extent of binding ofCu(II) ions in the recent experiment on aqueous solutionof PAMAM and Cu(II) ions.15 The results from oursimulation studies provide a different binding mode forthe Cu(II) ions, which helps explain the experimentalresults.
2. Simulation Methods
To mimic the targeted pH conditions, we carried outsimulations at three protonation levels: (i) high pH: Noprotonation (pH > 12); (ii) intermediate or neutral pH:all the primary amines (64 for G4, 128 for G5, and 256for G6) are protonated, but none of the tertiary amines(pH ∼ 7); (iii) low pH: all the primary amines andtertiary amines (62 for G4, 126 for G5, and 254 for G6)are protonated (pH < 4). This is the same range followedin the work by Baker and co-workers.7 Not reported hereare simulations we carried for other protonation levelsto mimic the continuous variation in pH from high tolow. The results of those studies will be publishedelsewhere16 where we elucidate the protonation mech-anisms in PAMAM dendrimer. Here, we present theresults of our simulation studies on G4-G6 dendrimersat high, intermediate, and low pH in explicit water inthe presence of counterions.
We generated the initial 3-dimensional atomisticstructures of PAMAM dendrimers using the CCBBMonte Carlo method.17,18 The structures generated werethen subjected to conjugate gradient optimization toobtain lower energy configurations. We further annealedthe minimized structures at very high temperature andcooled to room temperature. Then 200-400 ps ofdynamics was performed at room temperature in theabsence of explicit solvent. The final dynamic structureafter 200-400 ps runs was protonated at various levels.For neutral and low pH cases Cl- counterions wereadded to bring charge neutrality, resulting in a numberof counterions present in the system that varies withthe degree of protonation. The initial positions of theCl- ions were ∼3.8 Å from the primary and tertiaryamine sites for neutral and low pH cases, respectively.
We used the F3C model for water since it givessatisfactory properties of bulk water at various temper-atures.19 We started with a preequilibrated box of water,which was copied and repeated, in all three spatialdirections to create a box sufficiently large to containthe dendrimer. This complex was then immersed in the
solvent box while deleted waters that overlap thedendrimer or counterion atoms. The box was selectedto be large enough that the distance between the wallof the box and the closest atom of dendrimer was 10 Åin each direction. Since the size of the dendrimerincreases in going from G4 to G6, the number of watersin a 10 Å thick water layer surrounding the dendrimeralso increases. The resulting number of atoms in thesimulation box is given in Table 2. After constructingthe dendrimer inside the solvent box, an additional100-200 ps of MD was performed to equilibrate thesystem before collecting data.
We then carried out MD simulations at 300 K forgenerations 4-6 in explicit water at various protonationlevels. These simulations employed the Dreiding forcefields20 to describe the interactions.
The partial charges on the atoms were derived usingthe charge equilibration (QEq) method.21 First, weevaluated the QEq charges for the ethylenediamine(EDA) core as a neutral molecule using generation 0,i.e., with all four terminal H atoms replaced by fourmonomers of PAMAM dendrimer. Then, we evaluatedthe QEq charges for the full monomer of PAMAM, withall three H atoms replaced by three monomers ofPAMAM and required charge neutrality. Finally, weevaluated the QEq charges for the terminal PAMAMmonomers, with the two terminal H atoms kept as Hand the other H by a monomer of PAMAM dendrimer.These charges for the terminal PAMAM monomer werethen scaled to be neutral and used for the terminalgeneration. This procedure ensures that each generationis neutral. In the case of intermediate pH where allprimary amines are protonated, we found that thechange of atomic charges is quite localized; therefore,it is sufficient to recalculate only their charges onterminal monomers. However, for the low-pH case whenboth primary and tertiary amines are protonated thecharge was distributed to the added proton only for thetertiary proton site. We also calculated the Qeq chargesover all atoms of the dendrimer for G4-G5 at low pHand found out that structural properties remain un-changed for the above two charge schemes.
To evaluate the nonbonded interactions (Coulomb andvan der Waals), we used the cell multipole method(CMM)22 with appropriate level which resulted in anaverage of 10-15 particles per leaf cell. To enhance thespeed of simulation, we performed simulations fornonperiodic systems; i.e., the PAMAM is immersed ina spherical droplet of water (10 Å water layer corre-sponding to 3-4 solvation layers around dendrimer). Allcalculations were carried out with the MPSim pro-gram.23 The Verlet equations of motion were integratedusing an integration step of 1 fs. A Nose-Hoover typethermostat with a relaxation time of 0.1 ps was used tocontrol the temperature. The simulations were con-
Table 2. Details of the Simulation Parameters
generation pHno. ofatoms
no. ofwaters
dendrimercharge
no. ofCl-
4 high 2244 5083 0 0neutral 2308 5301 64 64low 2370 5297 126 126
5 high 4548 9406 0 0neutral 4676 9374 128 128low 4802 12977 254 254
6 high 9156 19525 0 0neutral 9412 20294 256 256low 9666 20272 510 510
980 Maiti et al. Macromolecules, Vol. 38, No. 3, 2005
ducted at T ) 300 K. The lengths of simulations are400 ps (200 ps for equilibration and an additional 200ps for data collection). These simulation times provedto be sufficient to obtain equilibrium properties as seenfrom the time evolution of the total energy of the systemas well as the radius of gyration of the dendrimer (seeFigure 1). We saved snapshots for every 0.5 ps intervalin the simulations and used these configurations todetermine the average properties at T ) 300 K. The nextsection presents the results.
3. Results
To characterize the structure and properties of den-drimers as a function of generation at various pHconditions, we chose the following quantities: radius ofgyration, shape tensor, monomer density distribution,molecular surface area, end-group distribution, solventaccessible surface, molecular volume, and spatial ar-rangement of branch points. To compare with the recentSANS experiments, we computed the single particleform factors at various simulation conditions. We havealso studied the penetration of water inside dendrimerby computing the number of waters inside the den-drimer as a function of the distance form the center-of-mass of the dendrimer.
3.1. Size and Shape. A quantitative estimate of thedendrimer shape and size can be described by the mean-square radius of gyration ⟨Rg
2⟩ and shape tensor of theindividual chain. For a dendrimer with N atoms themean-square radius of gyration is given by
where R is the center-of-mass of the dendrimer, ri andmi are the position and mass of the ith atom, and M isthe total mass of the dendrimer. Figure 2 shows theradius of gyration Rg as a function of number ofmonomers for various dendrimer generations at differ-ent protonation levels. For comparison, we also showthe available experimental values for lower generationsdendrimer obtained from small angles X-ray scattering(SAXS)24,25 and SANS experiments.2 The values of Rgobtained from our simulations along with the experi-mental values are also tabulated in Table 3.
• At high pH when there is no protonation, just thepresence of a good solvent like water increases the sizeof the dendrimer by almost 10-15%. This trend issimilar in all the generations reported in this paper.
• At neutral pH when all the primary amines areprotonated there is no significant change in the den-drimer size as it is evident from very small increase inradius of gyration.
• As the pH is lowered further, eventually all thetertiary amines are also protonated, and at that proto-nation level we see almost 30-40% increase in radiusof gyration compared to the case when no solvent ispresent.
These observations are consistent with recent experi-mental findings2 which report the effect of varyingsolvent quality on the size of generation 5 and 8PAMAM dendrimers. Using holographic relaxation spec-troscopy (HRS), Stechmesser et al.26 studied the size ofvarious generation PAMAM dendrimer under varyingsolvent conditions. They reported a significant swellingof dendrimer in good solvents for larger generations (G> 4). Our simulation results are consistent with theirexperimental findings. However, this contradicts theexperimental findings on generation 8 PAMAM den-drimer by Nisato et al.4 They studied the behavior ofG8 PAMAM dendrimer in D2O at various pH levelsusing SANS and found that the dendrimer size isessentially independent of the ionic strength of thesolvent.
In the presence of a polar solvent like water, we findsignificant penetration of water throughout the interiorof the dendrimer, which causes the dendrimer structureto swell. This results from the favorable interaction ofthe solvent with the primary and tertiary amines. Boththe excluded-volume interactions and the Coulombicrepulsions between the protonated primary and tertiaryamines give rise to the dramatic increase in Rg atvarious protonation levels. The presence of counterionsalso increases the swelling. Depending on the degree ofprotonation, a significant portion of the counterions
Figure 1. Time evolution of the radius of gyration (Rg) of theG5 PAMAM dendrimer at various solvent conditions.
⟨Rg2⟩ )
1
M⟨[∑
i)1
N
mi|ri - R|2]⟩ (1)
Figure 2. Radius of gyration as a function of number ofmonomers. For comparison, we also plot the experimental Rgfrom three different sources. The lines are best power law fitto the data and has the form Rg ) 1.45 + 1.06N0.33 for thecase of no solvent; Rg ) -0.18 + 1.28N0.33 for the case of highpH; Rg ) 0.15 + 1.29N0.33 for the case of neutral pH; Rg )-0.62 + 1.48N0.33 for the case of low pH. The fits indicate thatat various solvent conditions radius of gyration follow samescaling relationship.
Macromolecules, Vol. 38, No. 3, 2005 PAMAM Dendrimers 981
condense within the dendrimer, residing very close tothe protonated sites (see Table 4), with some solvatedby the water. As the protonation level increases, thereare more counterions inside dendrimer and the den-drimer swells more at higher protonation levels.
Figure 2 plots Rg as a function of number of monomersin the dendrimer using a log-log scale. The lines arethe best fit to a power law dependence with exponents∼0.33. This scaling law holds for various solvent condi-tions as has been observed in HRS studies on PAMAMdendrimer in water, methanol, and butanol.26 Thisscaling exponent is in excellent agreement with therecent SAXS results on PAMAM dendrimers up togeneration 825 which find an exponent of 0.33. SANSstudies on poly(benzyl ether) dendrimers27 also indi-cated an exponent of 0.33. Murat and Grest6 predicteda scaling exponent of 0.33 based on Brownian dynamicssimulations on model dendrimers under varying solventconditions. This scaling exponent indicates a compactspace-filling object under various solvent conditions. Tocompare our simulation results with those of Welch andMuthukumar,5 we also calculate the effective Debyelength in our simulations. The effective Debye radiusκ-1 is calculated using the following:
Here ci and zi are the concentration and valence of theith ion. lB is the Bjerrum length in water at 300 K, whichis taken to be 7.1 Å. The salt concentration in oursimulation corresponds to a Debye length in the range3-4 Å (4.3 Å for neutral pH and 3.6 Å for low pH forsimulation conditions for G5), which represents the caseof high salt concentration. Welch and Muthukumar,5 onthe other hand, report simulations with Debye lengthranging from 3 to 300 Å. At larger Debye length(corresponding to very low salt concentration) due to lowelectrostatics screening dendrimer structure swellsmore, leading to larger increase in Rg in their study.Attaining such low salt concentration or larger Debyeradius will require inclusion of very large number ofwater molecules in the simulation, which will requiremuch more computational time.
To study the change in dendrimer conformations asa function of solution pH, we have calculated the shapeof the dendrimer at various solvent conditions. The
shape tensor describing the mass distribution is givenby28
The three eigenvalues of the shape tensor G, Iz, Iy, andIx (in descending order), are the principal moments ofthe equivalent ellipsoid. The sum of these eigenvaluesis an invariant of G, giving ⟨Rg
2⟩. The ratio of these threeprincipal moments is a measure of asphericity (minor-major axes ratio) of the shape ellipsoid of the dendrimer.
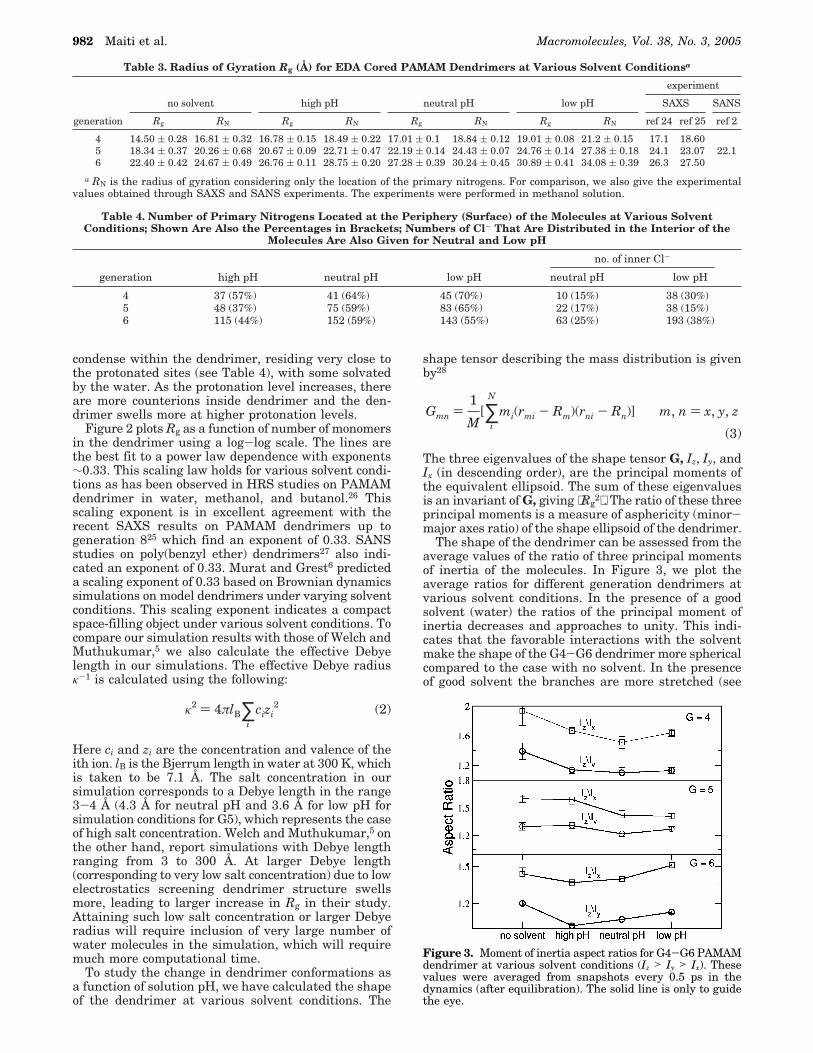
The shape of the dendrimer can be assessed from theaverage values of the ratio of three principal momentsof inertia of the molecules. In Figure 3, we plot theaverage ratios for different generation dendrimers atvarious solvent conditions. In the presence of a goodsolvent (water) the ratios of the principal moment ofinertia decreases and approaches to unity. This indi-cates that the favorable interactions with the solventmake the shape of the G4-G6 dendrimer more sphericalcompared to the case with no solvent. In the presenceof good solvent the branches are more stretched (see
Table 3. Radius of Gyration Rg (Å) for EDA Cored PAMAM Dendrimers at Various Solvent Conditionsa
experiment
no solvent high pH neutral pH low pH SAXS SANS
generation Rg RN Rg RN Rg RN Rg RN ref 24 ref 25 ref 2
4 14.50 ( 0.28 16.81 ( 0.32 16.78 ( 0.15 18.49 ( 0.22 17.01 ( 0.1 18.84 ( 0.12 19.01 ( 0.08 21.2 ( 0.15 17.1 18.605 18.34 ( 0.37 20.26 ( 0.68 20.67 ( 0.09 22.71 ( 0.47 22.19 ( 0.14 24.43 ( 0.07 24.76 ( 0.14 27.38 ( 0.18 24.1 23.07 22.16 22.40 ( 0.42 24.67 ( 0.49 26.76 ( 0.11 28.75 ( 0.20 27.28 ( 0.39 30.24 ( 0.45 30.89 ( 0.41 34.08 ( 0.39 26.3 27.50
a RN is the radius of gyration considering only the location of the primary nitrogens. For comparison, we also give the experimentalvalues obtained through SAXS and SANS experiments. The experiments were performed in methanol solution.
Table 4. Number of Primary Nitrogens Located at the Periphery (Surface) of the Molecules at Various SolventConditions; Shown Are Also the Percentages in Brackets; Numbers of Cl- That Are Distributed in the Interior of the
Molecules Are Also Given for Neutral and Low pH
no. of inner Cl-
generation high pH neutral pH low pH neutral pH low pH
4 37 (57%) 41 (64%) 45 (70%) 10 (15%) 38 (30%)5 48 (37%) 75 (59%) 83 (65%) 22 (17%) 38 (15%)6 115 (44%) 152 (59%) 143 (55%) 63 (25%) 193 (38%)
κ2 ) 4πlB∑
i
cizi2 (2)
Gmn )1
M[∑
i
N
mi(rmi - Rm)(rni - Rn)] m, n ) x, y, z
(3)
Figure 3. Moment of inertia aspect ratios for G4-G6 PAMAMdendrimer at various solvent conditions (Iz > Iy > Ix). Thesevalues were averaged from snapshots every 0.5 ps in thedynamics (after equilibration). The solid line is only to guidethe eye.
982 Maiti et al. Macromolecules, Vol. 38, No. 3, 2005
Figures 6 in the branch point distribution section),giving rise to greater uniformity in the spatial distribu-tion of various branches and thus a greater sphericity.Similar behavior is also observed in the Monte Carlosimulation of star polymers in good solvent.29,30 Atneutral or low pH electrostatic repulsion between theprimary and tertiary amines leads to further stretchingof branches. The solvation of the dendrimers (high pH)results in more spherical overall structures for G4through G6, and neutral pH conditions leads to furtherincrease in sphericity for G4 and G5. Low-pH conditionswhich led to further increase in size and stretchingconsistently lead to less spherical shapes compared tohigh- and neutral-pH cases. This effect is more pro-nounced in G6; in this case asphericity is larger thaneven from the no solvent condition.
3.2. Radial Monomer Density Profiles. The aver-age radial monomer density F(r) can be defined bycounting the number of atoms whose centers-of-massare located within the spherical shell of radius r andthickness ∆r. Hence, the integration over r yields thetotal number of atoms N(R) as
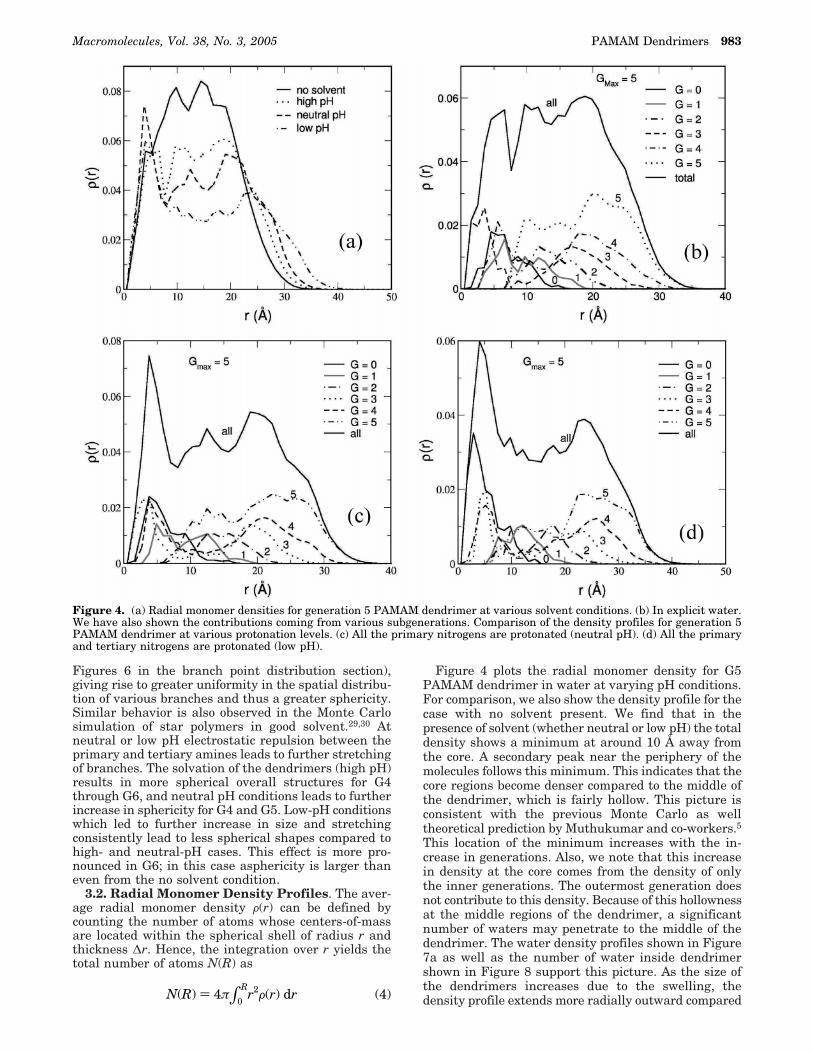
Figure 4 plots the radial monomer density for G5PAMAM dendrimer in water at varying pH conditions.For comparison, we also show the density profile for thecase with no solvent present. We find that in thepresence of solvent (whether neutral or low pH) the totaldensity shows a minimum at around 10 Å away fromthe core. A secondary peak near the periphery of themolecules follows this minimum. This indicates that thecore regions become denser compared to the middle ofthe dendrimer, which is fairly hollow. This picture isconsistent with the previous Monte Carlo as welltheoretical prediction by Muthukumar and co-workers.5This location of the minimum increases with the in-crease in generations. Also, we note that this increasein density at the core comes from the density of onlythe inner generations. The outermost generation doesnot contribute to this density. Because of this hollownessat the middle regions of the dendrimer, a significantnumber of waters may penetrate to the middle of thedendrimer. The water density profiles shown in Figure7a as well as the number of water inside dendrimershown in Figure 8 support this picture. As the size ofthe dendrimers increases due to the swelling, thedensity profile extends more radially outward compared
Figure 4. (a) Radial monomer densities for generation 5 PAMAM dendrimer at various solvent conditions. (b) In explicit water.We have also shown the contributions coming from various subgenerations. Comparison of the density profiles for generation 5PAMAM dendrimer at various protonation levels. (c) All the primary nitrogens are protonated (neutral pH). (d) All the primaryand tertiary nitrogens are protonated (low pH).
N(R) ) 4π∫0
Rr2F(r) dr (4)
Macromolecules, Vol. 38, No. 3, 2005 PAMAM Dendrimers 983

to the no solvent case. This behavior is more pronouncedat higher protonation level when the pH is low. Thecontributions of the monomers belonging to consecutivegenerations are also shown. Compared to the no solventcase, we see that the presence of a good solvent like
water reduces significantly the back-folding of the outergenerations. As a result, the contributions coming fromeach subgenerations to the total density gradually
Figure 5. Radial monomer density distribution of the primarynitrogens at various solvent conditions for (a) G4, (b) G5, and(c) G6 PAMAM dendrimer. Figure 6. Branch point distance distributions functions.
Distance is measured from the center-of-mass of the core tothe branch point for G4-G6 PAMAM dendrimer
984 Maiti et al. Macromolecules, Vol. 38, No. 3, 2005

decrease near the core of the dendrimer. Consequently,the total monomer density shows a minimum at the coreand gradually increases with a maximum at somedistance from the core, which roughly corresponds toits radius of gyration. Beyond that it decays monotoni-cally.
3.3. Terminal Amine Group Distribution. Manyof the applications of the dendrimer rely heavily on theavailability of the functional end groups as well as theirdistribution over the molecule. Several experimentaland computational studies indicate that there is sig-nificant back-folding of the outer subgeneration through-out the interior of the molecules.
A recent SANS experiment on G7 PAMAM den-drimer31 was interpreted to indicate that the terminalunits are located at the periphery of the molecules. Theirargument was based on the observations that the radiusof gyration of the terminal groups (RN) was larger thanthe Rg of the entire dendrimer. However, our earlierpaper17 showed that this is not an accurate measuresince distribution functions with RN g Rg can beachieved even when most of the end groups are locatedwithin the interior of the dendrimer molecules. Lyulinet al.32,33 also came to the same conclusion based ontheir Brownian dynamics simulations. On the otherhand, on the basis of rotational-echo-double-resonance
(REDOR) of the Frechet-type dendrimers, Wooley etal.34 showed that even in the solid state there issignificant back-folding with the radial monomer den-sity decaying monotonically with the increasing distancefrom the center-of-mass of the molecules. Measurementsof spin-lattice relaxation in polyaryl dendrimers witha paramagnetic core35 also reveal that the end groupsare close to the core of the molecules. Thus, thereremains a controversy over whether the end groups arelocated at the periphery of the molecule or located insidethe dendrimer molecule due to substantial folding backof the end groups.
To probe this issue, we calculated the distribution ofterminal nitrogens for various generations, as shownin Figure 5. We see that the end groups of a givendendrimer are sufficiently flexible to interpenetrate thewhole molecule. In particular, the end groups of thehigher generations even come very close to the core ofthe molecule. Earlier, we demonstrated17 that in thecase of no solvent the terminal groups are distributedthroughout the interior of the molecule. We see similarbehavior in a good solvent in various pH levels. How-ever, the location of the maximum terminal densitygradually shifts toward the periphery with the increasein protonation level. Also, the density profile exhibitsmultiple peaks for all generations at all pH levels. Asthe pH is lowered so that the tertiary amines get
Figure 7. (a) Degree of water penetration in generation 5PAMAM dendrimer when all the primary amines are proto-nated. (b) Structure of innermost water layer for generation 5PAMAM at low pH. The water surface is shown in gray color.Surfaces of various dendrimer atoms are shown in RGB CPKcolor: blue for nitrogen, red for oxygen, mauve for carbon, andwhite for hydrogen.
Figure 8. Number of water inside (a) generation 5 and (b)generation 6 PAMAM dendrimer as a function of distance fromthe center of core at various pH levels
Macromolecules, Vol. 38, No. 3, 2005 PAMAM Dendrimers 985

protonated, the density profile of the primary nitrogenatoms are pushed further toward the periphery of themolecule due to the new electrostatics interactions thatprevent back-folding of the primary (terminal) nitrogenatoms. To obtain a quantitative measure of the degreeof back-folding, Table 4 shows the number of primarynitrogens at the periphery of the dendrimer moleculesfor various generation PAMAM dendrimer at variouspH levels. For G5 at high pH only 37% of the primaryamines are located at the outer periphery of themolecules. As the solution pH is lowered to protonatethe primary and tertiary amines, almost 65% of theprimary amines are now on the surface. We observedsimilar trends for G4 and G6 as well.
3.4. Branch Point Distribution. The distributionsof the end groups are highly dependent on how thedifferent branch points (“spacers”) are arranged inspace. The overall shape of the dendrimer may alsodepend on the arrangements of various branches withinthe molecule. The de Gennes and Hervet paper36 as-sumed that the spacers near the center of the moleculesbehave like flexible coils or less stretched, while thoseat the outer regions are elongated. To see how thepresence of solvent as well as various solvent conditionsaffects the distribution of branch points, we calculatedthe branch point distance from the center of core of thedendrimer as a function of the branch point generations.This helps us understand how the spacers or the branchpoints are spatially arranged. Figure 6 shows the branchpoint distance from the center of core of the dendrimeras a function of the branch point generations for G4-G6 PAMAM dendrimer at various solvent conditions.In all the cases the presence of a good solvent helps tostretch out the successive branch points radially. Withdecreased pH, we see that the various branch points arepushed out even further causing a greater expansionof various branches. The greater expansion of variousbranches helps to achieve favorable interaction with thesolvent as well as higher conformational entropy. Thisallows various branches to accommodate the interatomicrepulsion without excessive overcrowding at the inte-rior.
This observation is consistent with the relative in-crease in Rg as well as the increasingly sphericalcharacter with lower solvent pH. Similar behavior hasbeen reported for regular star polymers in a goodsolvent. Because of this increase in branch point dis-tance from the center of the molecule, there is a dropin the density in the middle of the dendrimer as evidentfrom the density profile shown in Figure 4. Anotherimportant feature that can be extracted from Figure 6is that the bonds at the core are more stretched, afeature that becomes stronger for larger generations.On the other hand, the terminal branch points are theleast stretched. This is consistent with our earlierobservation that the core domain is denser for lowergeneration dendrimers in comparison to the highergeneration.
3.5. Water Penetration. Because of the swelling ofthe dendrimer structure in the presence of good sol-vents, a significant part of the inner surface and volumeof the dendrimer are accessible to the solvent. Conse-quently, we see that large number of water moleculeshas penetrated throughout the interior of the den-drimer. Figure 7a plots the density profile for watermolecules and dendrimer for G5 PAMAM dendrimers
at neutral pH. The density profiles for G4 and G6dendrimer at various pH have similar features.
Figure 8a,b also shows the number of waters as afunction of distance as we go radially outward from thecore of the dendrimer. We see a significant number ofwaters inside the dendrimer, which come within adistance of 10 Å from the core of the dendrimers. Asthe protonation level is increased, the dendrimer struc-ture swells, and there is a gradual increase in thenumber of waters inside dendrimer for all the genera-tions.
The structure of first solvation shell within thedendrimer is shown in Figure 7b. A quantitative esti-mate of the solvent penetration is given by counting thenumber of waters bound by the dendrimer outer surface.Because of the nonuniformity as well as asphericity ofthe dendrimer surface, special care must be taken toidentify the bound water, as simple spherical cutoff willoverestimate the numbers of waters within the den-drimer. To have an accurate estimate of the number ofbound waters, we have used following criteria: We firstcalculated the molecular surface area (MSA) for eachof the dendrimer atom using a large probe radius (6 Å).With this probe radius the generated surface of thedendrimer becomes almost spherical and smooth. Thoseatoms with nonzero MSA represent the surface atomsof the dendrimer. Using these surface atoms, we identifyall the surface waters that are within 4 Å of the surfaceatoms. Next, we identify all the waters close to the inneratoms (with zero MSA), excluding all the previouslydefined surface waters. The number of bound waterscalculated this way is listed in Table 5.
For example, for G5 at high pH we have three water/tertiary amines (378 waters for 126 tertiary amines),while this number increases to six water/tertiary amines(756 waters for 126 tertiary amines) at low pH. Thissignificant penetration of solvent molecules inside thedendrimer structure is in agreement with the recentSANS studies on poly(benzyl ether)27 and polycarbosi-lane dendrimers.37 In these experiments the number ofsolvent molecules inside the dendrimer was calculatedfrom the change in neutron scattering density. Ingeneral, a lower relative density leads to a larger solventcontent inside the dendritic structure and vice versa.27
Recent measurements of Cu(II) binding to PAMAMdendrimers show15 that extent of Cu(II) binding exceedsthat expected for specific binding by primary andtertiary amines alone. In fact, considering only thebinding mode by primary and tertiary amines asproposed by Ottovani et al.12,38 accounts for a part ofthe metal ion binding. But considering the binding ofCu(II) by the interior waters provides an estimate ofthe extent of binding that is in close agreement withthe experimental observations.15 The calculated numberof waters inside dendrimer gives significant insight intothe possible mechanism of Cu(II) ions binding in PAM-AM dendrimer.
3.6. Solvent Accessible Molecular Surface andVolume. We have seen there is significant solvent
Table 5. Average Number of Water Inside Dendrimer atVarious pH Levels for Different Generation PAMAM
Dendrimersa
generations high pH neutral pH low pH
4 138 201 3255 378 524 7576 890 1344 1731
a For criteria used in identifying the bound waters see the text.
986 Maiti et al. Macromolecules, Vol. 38, No. 3, 2005
penetration to the interior of the dendrimer molecules.This leads to a more open molecular structure for thedendrimers. The interaction of the dendrimers with thesolvent is largely determined by its solvent accessiblesurface area (SASA) and solvent excluded volume. Therestill remains significant accessible internal surface areain a solvent-filled dendrimer. To calculate the solventaccessible surface area and volume, we assume a fused-sphere model for the solute where each sphere hasradius ri equal to the van der Waals radius of the atomit represents, ri
vdW extended by the probe radius of thesolute, rp, i.e., ri ) ri
vdW + rp. The SASA is defined asthe surface traced by the center of a spherical solventprobe as it rolls around the van der Waals spheres ofthe solute. For the calculation of SASA and solventaccessible volume we used analytical volume general-ized Born method (AVGB) developed in the Goddardgroup.
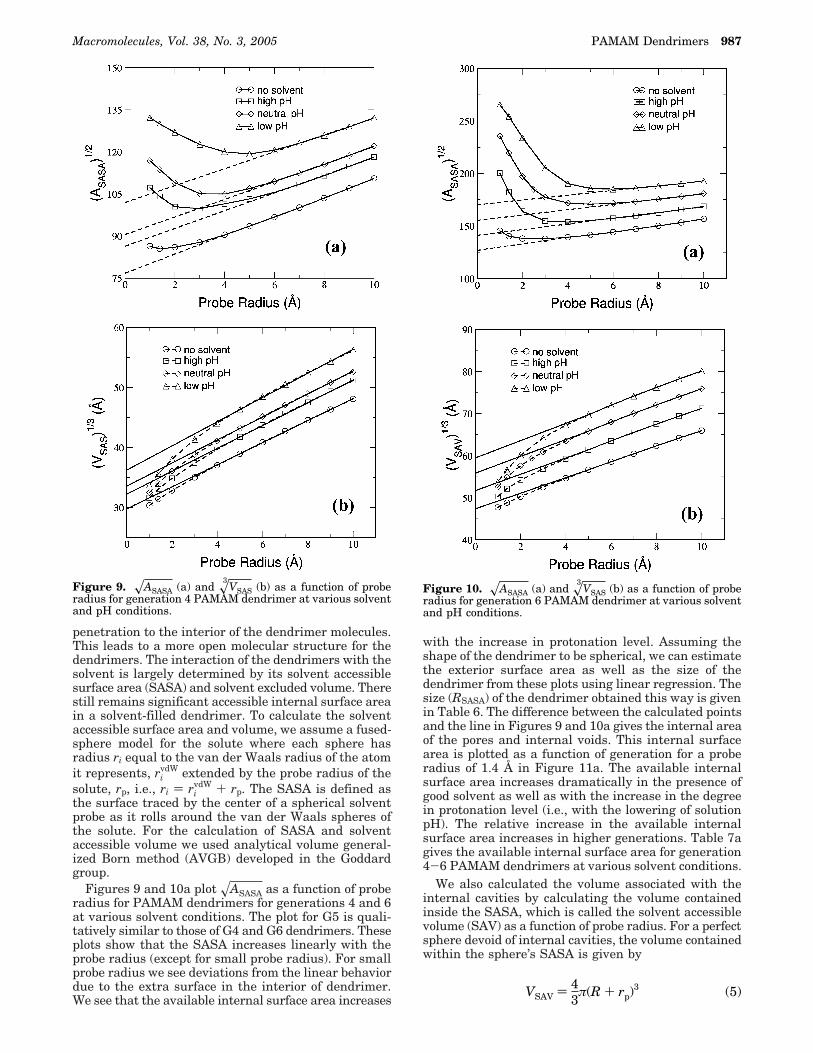
Figures 9 and 10a plot xASASA as a function of proberadius for PAMAM dendrimers for generations 4 and 6at various solvent conditions. The plot for G5 is quali-tatively similar to those of G4 and G6 dendrimers. Theseplots show that the SASA increases linearly with theprobe radius (except for small probe radius). For smallprobe radius we see deviations from the linear behaviordue to the extra surface in the interior of dendrimer.We see that the available internal surface area increases
with the increase in protonation level. Assuming theshape of the dendrimer to be spherical, we can estimatethe exterior surface area as well as the size of thedendrimer from these plots using linear regression. Thesize (RSASA) of the dendrimer obtained this way is givenin Table 6. The difference between the calculated pointsand the line in Figures 9 and 10a gives the internal areaof the pores and internal voids. This internal surfacearea is plotted as a function of generation for a proberadius of 1.4 Å in Figure 11a. The available internalsurface area increases dramatically in the presence ofgood solvent as well as with the increase in the degreein protonation level (i.e., with the lowering of solutionpH). The relative increase in the available internalsurface area increases in higher generations. Table 7agives the available internal surface area for generation4-6 PAMAM dendrimers at various solvent conditions.
We also calculated the volume associated with theinternal cavities by calculating the volume containedinside the SASA, which is called the solvent accessiblevolume (SAV) as a function of probe radius. For a perfectsphere devoid of internal cavities, the volume containedwithin the sphere’s SASA is given by
Figure 9. xASASA (a) and x3VSAS (b) as a function of probe
radius for generation 4 PAMAM dendrimer at various solventand pH conditions.
Figure 10. xASASA (a) and x3VSAS (b) as a function of probe
radius for generation 6 PAMAM dendrimer at various solventand pH conditions.
VSAV ) 43
π(R + rp)3 (5)
Macromolecules, Vol. 38, No. 3, 2005 PAMAM Dendrimers 987
Figures 9 and 10b show x3VSAV as a function of probe
radius rp for different generations PAMAM dendrimer.For larger probe radius x3
VSAV is linear in rp with aslope x34/3π. The intercept at zero probe radius leadsto an estimate of the volume contained inside thedendrimer, including all internal pores and cavities.Using the limit of the line in Figures 9 and 10b for rp )0 leads to an estimate the size RSAV of the dendrimerin Table 6.
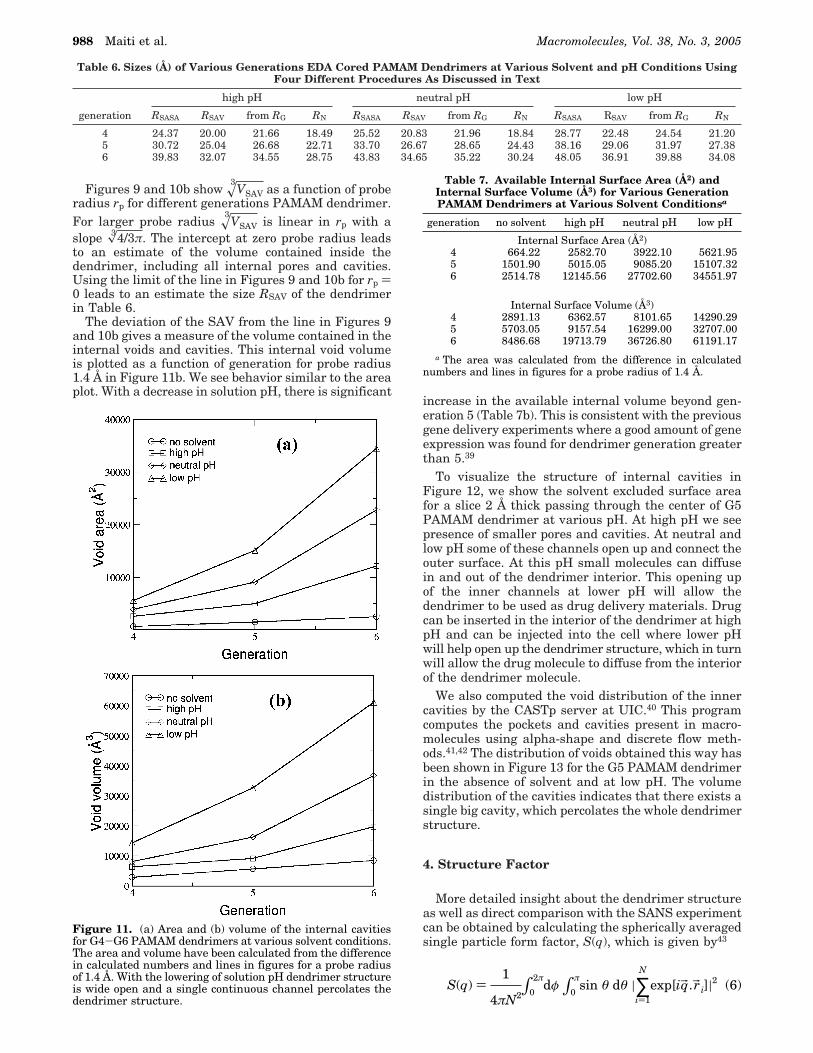
The deviation of the SAV from the line in Figures 9and 10b gives a measure of the volume contained in theinternal voids and cavities. This internal void volumeis plotted as a function of generation for probe radius1.4 Å in Figure 11b. We see behavior similar to the areaplot. With a decrease in solution pH, there is significant
increase in the available internal volume beyond gen-eration 5 (Table 7b). This is consistent with the previousgene delivery experiments where a good amount of geneexpression was found for dendrimer generation greaterthan 5.39
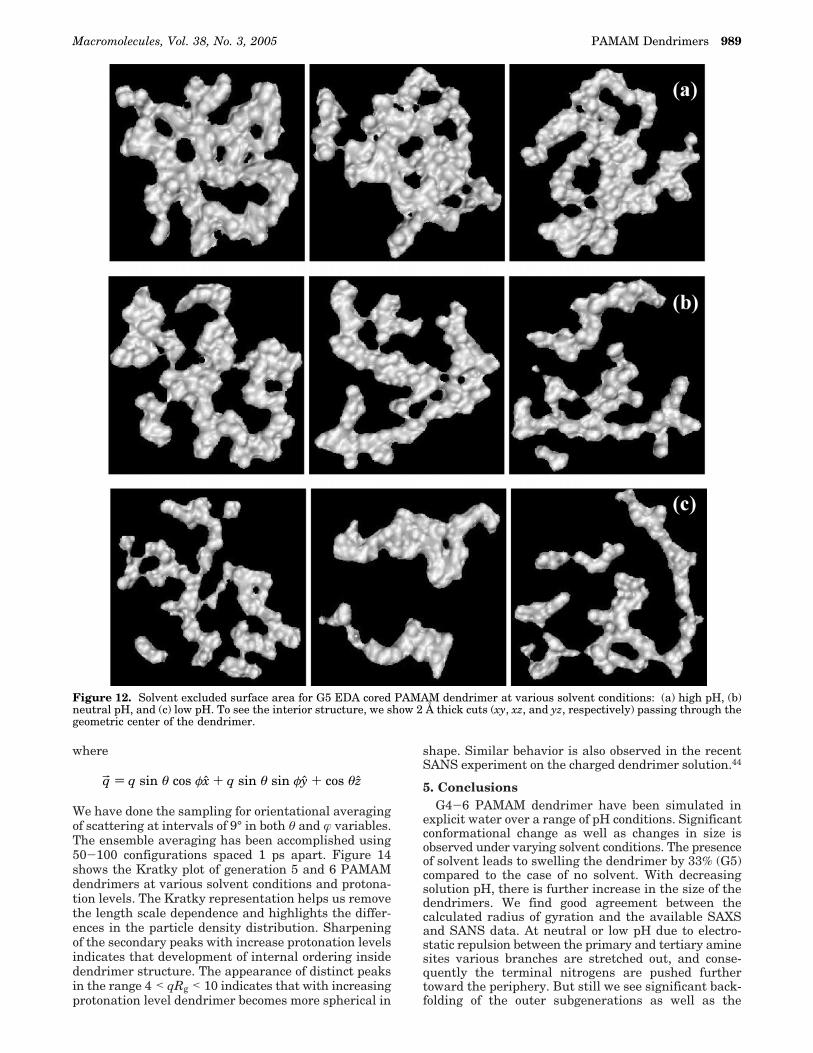
To visualize the structure of internal cavities inFigure 12, we show the solvent excluded surface areafor a slice 2 Å thick passing through the center of G5PAMAM dendrimer at various pH. At high pH we seepresence of smaller pores and cavities. At neutral andlow pH some of these channels open up and connect theouter surface. At this pH small molecules can diffusein and out of the dendrimer interior. This opening upof the inner channels at lower pH will allow thedendrimer to be used as drug delivery materials. Drugcan be inserted in the interior of the dendrimer at highpH and can be injected into the cell where lower pHwill help open up the dendrimer structure, which in turnwill allow the drug molecule to diffuse from the interiorof the dendrimer molecule.
We also computed the void distribution of the innercavities by the CASTp server at UIC.40 This programcomputes the pockets and cavities present in macro-molecules using alpha-shape and discrete flow meth-ods.41,42 The distribution of voids obtained this way hasbeen shown in Figure 13 for the G5 PAMAM dendrimerin the absence of solvent and at low pH. The volumedistribution of the cavities indicates that there exists asingle big cavity, which percolates the whole dendrimerstructure.
4. Structure Factor
More detailed insight about the dendrimer structureas well as direct comparison with the SANS experimentcan be obtained by calculating the spherically averagedsingle particle form factor, S(q), which is given by43
Table 6. Sizes (Å) of Various Generations EDA Cored PAMAM Dendrimers at Various Solvent and pH Conditions UsingFour Different Procedures As Discussed in Text
high pH neutral pH low pH
generation RSASA RSAV from RG RN RSASA RSAV from RG RN RSASA RSAV from RG RN
4 24.37 20.00 21.66 18.49 25.52 20.83 21.96 18.84 28.77 22.48 24.54 21.205 30.72 25.04 26.68 22.71 33.70 26.67 28.65 24.43 38.16 29.06 31.97 27.386 39.83 32.07 34.55 28.75 43.83 34.65 35.22 30.24 48.05 36.91 39.88 34.08
Figure 11. (a) Area and (b) volume of the internal cavitiesfor G4-G6 PAMAM dendrimers at various solvent conditions.The area and volume have been calculated from the differencein calculated numbers and lines in figures for a probe radiusof 1.4 Å. With the lowering of solution pH dendrimer structureis wide open and a single continuous channel percolates thedendrimer structure.
Table 7. Available Internal Surface Area (Å2) andInternal Surface Volume (Å3) for Various GenerationPAMAM Dendrimers at Various Solvent Conditionsa
generation no solvent high pH neutral pH low pH
Internal Surface Area (Å2)4 664.22 2582.70 3922.10 5621.955 1501.90 5015.05 9085.20 15107.326 2514.78 12145.56 27702.60 34551.97
Internal Surface Volume (Å3)4 2891.13 6362.57 8101.65 14290.295 5703.05 9157.54 16299.00 32707.006 8486.68 19713.79 36726.80 61191.17
a The area was calculated from the difference in calculatednumbers and lines in figures for a probe radius of 1.4 Å.
S(q) )1
4πN2∫0
2πdφ ∫0
πsin θ dθ |∑
i)1
N
exp[iqb.rbi]|2 (6)
988 Maiti et al. Macromolecules, Vol. 38, No. 3, 2005
where
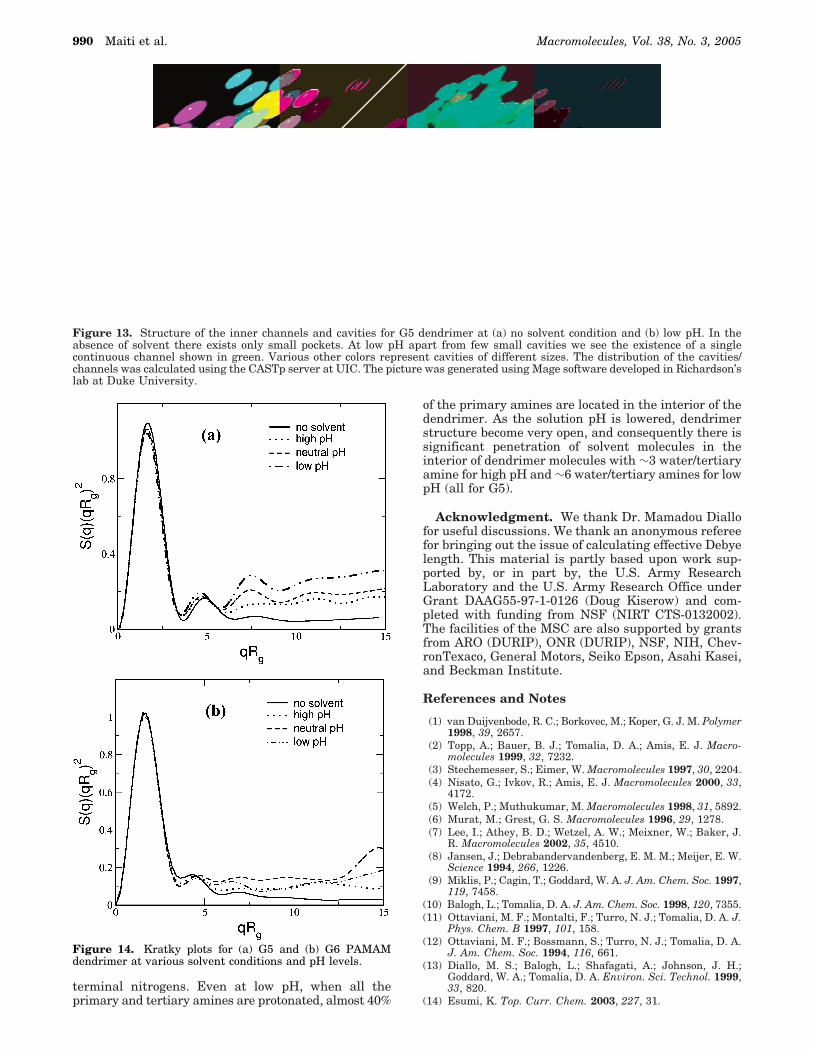
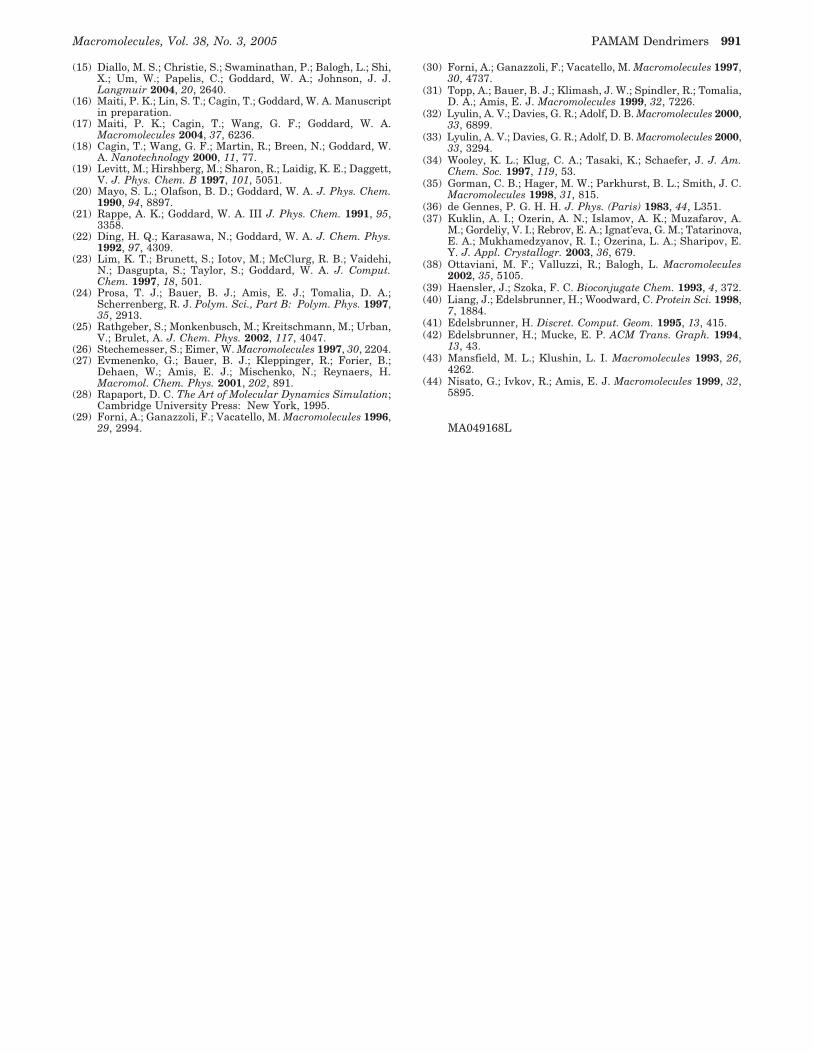
We have done the sampling for orientational averagingof scattering at intervals of 9° in both θ and æ variables.The ensemble averaging has been accomplished using50-100 configurations spaced 1 ps apart. Figure 14shows the Kratky plot of generation 5 and 6 PAMAMdendrimers at various solvent conditions and protona-tion levels. The Kratky representation helps us removethe length scale dependence and highlights the differ-ences in the particle density distribution. Sharpeningof the secondary peaks with increase protonation levelsindicates that development of internal ordering insidedendrimer structure. The appearance of distinct peaksin the range 4 < qRg < 10 indicates that with increasingprotonation level dendrimer becomes more spherical in
shape. Similar behavior is also observed in the recentSANS experiment on the charged dendrimer solution.44
5. ConclusionsG4-6 PAMAM dendrimer have been simulated in
explicit water over a range of pH conditions. Significantconformational change as well as changes in size isobserved under varying solvent conditions. The presenceof solvent leads to swelling the dendrimer by 33% (G5)compared to the case of no solvent. With decreasingsolution pH, there is further increase in the size of thedendrimers. We find good agreement between thecalculated radius of gyration and the available SAXSand SANS data. At neutral or low pH due to electro-static repulsion between the primary and tertiary aminesites various branches are stretched out, and conse-quently the terminal nitrogens are pushed furthertoward the periphery. But still we see significant back-folding of the outer subgenerations as well as the
Figure 12. Solvent excluded surface area for G5 EDA cored PAMAM dendrimer at various solvent conditions: (a) high pH, (b)neutral pH, and (c) low pH. To see the interior structure, we show 2 Å thick cuts (xy, xz, and yz, respectively) passing through thegeometric center of the dendrimer.
qb ) q sin θ cos φx + q sin θ sin φy + cos θz
Macromolecules, Vol. 38, No. 3, 2005 PAMAM Dendrimers 989
terminal nitrogens. Even at low pH, when all theprimary and tertiary amines are protonated, almost 40%
of the primary amines are located in the interior of thedendrimer. As the solution pH is lowered, dendrimerstructure become very open, and consequently there issignificant penetration of solvent molecules in theinterior of dendrimer molecules with ∼3 water/tertiaryamine for high pH and ∼6 water/tertiary amines for lowpH (all for G5).
Acknowledgment. We thank Dr. Mamadou Diallofor useful discussions. We thank an anonymous refereefor bringing out the issue of calculating effective Debyelength. This material is partly based upon work sup-ported by, or in part by, the U.S. Army ResearchLaboratory and the U.S. Army Research Office underGrant DAAG55-97-1-0126 (Doug Kiserow) and com-pleted with funding from NSF (NIRT CTS-0132002).The facilities of the MSC are also supported by grantsfrom ARO (DURIP), ONR (DURIP), NSF, NIH, Chev-ronTexaco, General Motors, Seiko Epson, Asahi Kasei,and Beckman Institute.
References and Notes
(1) van Duijvenbode, R. C.; Borkovec, M.; Koper, G. J. M. Polymer1998, 39, 2657.
(2) Topp, A.; Bauer, B. J.; Tomalia, D. A.; Amis, E. J. Macro-molecules 1999, 32, 7232.
(3) Stechemesser, S.; Eimer, W. Macromolecules 1997, 30, 2204.(4) Nisato, G.; Ivkov, R.; Amis, E. J. Macromolecules 2000, 33,
4172.(5) Welch, P.; Muthukumar, M. Macromolecules 1998, 31, 5892.(6) Murat, M.; Grest, G. S. Macromolecules 1996, 29, 1278.(7) Lee, I.; Athey, B. D.; Wetzel, A. W.; Meixner, W.; Baker, J.
R. Macromolecules 2002, 35, 4510.(8) Jansen, J.; Debrabandervandenberg, E. M. M.; Meijer, E. W.
Science 1994, 266, 1226.(9) Miklis, P.; Cagin, T.; Goddard, W. A. J. Am. Chem. Soc. 1997,
119, 7458.(10) Balogh, L.; Tomalia, D. A. J. Am. Chem. Soc. 1998, 120, 7355.(11) Ottaviani, M. F.; Montalti, F.; Turro, N. J.; Tomalia, D. A. J.
Phys. Chem. B 1997, 101, 158.(12) Ottaviani, M. F.; Bossmann, S.; Turro, N. J.; Tomalia, D. A.
J. Am. Chem. Soc. 1994, 116, 661.(13) Diallo, M. S.; Balogh, L.; Shafagati, A.; Johnson, J. H.;
Goddard, W. A.; Tomalia, D. A. Environ. Sci. Technol. 1999,33, 820.
(14) Esumi, K. Top. Curr. Chem. 2003, 227, 31.
Figure 13. Structure of the inner channels and cavities for G5 dendrimer at (a) no solvent condition and (b) low pH. In theabsence of solvent there exists only small pockets. At low pH apart from few small cavities we see the existence of a singlecontinuous channel shown in green. Various other colors represent cavities of different sizes. The distribution of the cavities/channels was calculated using the CASTp server at UIC. The picture was generated using Mage software developed in Richardson’slab at Duke University.
Figure 14. Kratky plots for (a) G5 and (b) G6 PAMAMdendrimer at various solvent conditions and pH levels.
990 Maiti et al. Macromolecules, Vol. 38, No. 3, 2005
(15) Diallo, M. S.; Christie, S.; Swaminathan, P.; Balogh, L.; Shi,X.; Um, W.; Papelis, C.; Goddard, W. A.; Johnson, J. J.Langmuir 2004, 20, 2640.
(16) Maiti, P. K.; Lin, S. T.; Cagin, T.; Goddard, W. A. Manuscriptin preparation.
(17) Maiti, P. K.; Cagin, T.; Wang, G. F.; Goddard, W. A.Macromolecules 2004, 37, 6236.
(18) Cagin, T.; Wang, G. F.; Martin, R.; Breen, N.; Goddard, W.A. Nanotechnology 2000, 11, 77.
(19) Levitt, M.; Hirshberg, M.; Sharon, R.; Laidig, K. E.; Daggett,V. J. Phys. Chem. B 1997, 101, 5051.
(20) Mayo, S. L.; Olafson, B. D.; Goddard, W. A. J. Phys. Chem.1990, 94, 8897.
(21) Rappe, A. K.; Goddard, W. A. III J. Phys. Chem. 1991, 95,3358.
(22) Ding, H. Q.; Karasawa, N.; Goddard, W. A. J. Chem. Phys.1992, 97, 4309.
(23) Lim, K. T.; Brunett, S.; Iotov, M.; McClurg, R. B.; Vaidehi,N.; Dasgupta, S.; Taylor, S.; Goddard, W. A. J. Comput.Chem. 1997, 18, 501.
(24) Prosa, T. J.; Bauer, B. J.; Amis, E. J.; Tomalia, D. A.;Scherrenberg, R. J. Polym. Sci., Part B: Polym. Phys. 1997,35, 2913.
(25) Rathgeber, S.; Monkenbusch, M.; Kreitschmann, M.; Urban,V.; Brulet, A. J. Chem. Phys. 2002, 117, 4047.
(26) Stechemesser, S.; Eimer, W. Macromolecules 1997, 30, 2204.(27) Evmenenko, G.; Bauer, B. J.; Kleppinger, R.; Forier, B.;
Dehaen, W.; Amis, E. J.; Mischenko, N.; Reynaers, H.Macromol. Chem. Phys. 2001, 202, 891.
(28) Rapaport, D. C. The Art of Molecular Dynamics Simulation;Cambridge University Press: New York, 1995.
(29) Forni, A.; Ganazzoli, F.; Vacatello, M. Macromolecules 1996,29, 2994.
(30) Forni, A.; Ganazzoli, F.; Vacatello, M. Macromolecules 1997,30, 4737.
(31) Topp, A.; Bauer, B. J.; Klimash, J. W.; Spindler, R.; Tomalia,D. A.; Amis, E. J. Macromolecules 1999, 32, 7226.
(32) Lyulin, A. V.; Davies, G. R.; Adolf, D. B. Macromolecules 2000,33, 6899.
(33) Lyulin, A. V.; Davies, G. R.; Adolf, D. B. Macromolecules 2000,33, 3294.
(34) Wooley, K. L.; Klug, C. A.; Tasaki, K.; Schaefer, J. J. Am.Chem. Soc. 1997, 119, 53.
(35) Gorman, C. B.; Hager, M. W.; Parkhurst, B. L.; Smith, J. C.Macromolecules 1998, 31, 815.
(36) de Gennes, P. G. H. H. J. Phys. (Paris) 1983, 44, L351.(37) Kuklin, A. I.; Ozerin, A. N.; Islamov, A. K.; Muzafarov, A.
M.; Gordeliy, V. I.; Rebrov, E. A.; Ignat’eva, G. M.; Tatarinova,E. A.; Mukhamedzyanov, R. I.; Ozerina, L. A.; Sharipov, E.Y. J. Appl. Crystallogr. 2003, 36, 679.
(38) Ottaviani, M. F.; Valluzzi, R.; Balogh, L. Macromolecules2002, 35, 5105.
(39) Haensler, J.; Szoka, F. C. Bioconjugate Chem. 1993, 4, 372.(40) Liang, J.; Edelsbrunner, H.; Woodward, C. Protein Sci. 1998,
7, 1884.(41) Edelsbrunner, H. Discret. Comput. Geom. 1995, 13, 415.(42) Edelsbrunner, H.; Mucke, E. P. ACM Trans. Graph. 1994,
13, 43.(43) Mansfield, M. L.; Klushin, L. I. Macromolecules 1993, 26,
4262.(44) Nisato, G.; Ivkov, R.; Amis, E. J. Macromolecules 1999, 32,
5895.
MA049168L
Macromolecules, Vol. 38, No. 3, 2005 PAMAM Dendrimers 991