Effect of Seawater Ageing on Dielectric Properties of...
23
145 Chapter 6 Effect of Seawater Ageing on Dielectric Properties of Epoxy Nanocomposites 6.1 Introduction Nanocomposites exhibit novel performance due to incorporation of fillers which are nano scales and high specific surface area. Significant and high quality of research has been carried out in recent years by incorporating different nano particles into existing dielectric systems in a cost effective manner, to derive improved benefits over conventional composites. However, the effect of seawater which is important for marine applications and condition of high humidity on nanocomposites is still far from being well established. The weakness imparted by seawater has a detrimental effect on the mechanical and electrical behavior of nanocomposites. For example, epoxy resin can consume up to a few wt.%, of water and this may lead to an overall degradation of the dielectric performance. This could be further compounded by additional absorption by nanofillers caused by their tendency to increase the free volume (e.g. through cracks, voids or through inhibiting cross-linking). In practical applications, water absorbance in materials is inevitable. The absorbed water can bring many negative influences to insulating materials, such as distortion of electric field distribution, inducing water trees, creating structural damage etc. Therefore, it is very important to understand the effect of absorbed water on the dielectric performance of epoxy nanocomposites. In this chapter, the dielectric performance of epoxy nanocomposites in terms of seawater absorption, hydrophobicity of the material, diffusion co-efficient, T g , free volume, dielectric properties, and percolation phenomenon of epoxy matrix and epoxy nanocomposites is discussed. 6.2 Seawater absorption of epoxy nanocomposites For better understanding the effect of seawater absorption on the epoxy nanocomposites, water absorption measurement were carried out and the results of weight gain as a function of time in hours are shown in Figure 6.1(a-c). The epoxy- SiO 2 /Al 2 O 3 /ZnO nanocomposites absorb less water except at 20wt.% filler loading than unfilled epoxy. The rate of water absorption is comparatively higher up to 100h and there after the absorption rate reduces up to 200h and beyond this the sorption/absorption rate becomes negligible. The absolute weight gain of the unfilled epoxy is 45% at 100h but for nanocomposites it has an average value of 33% for epoxy SiO 2 system, (5 to 20wt.%), 20% for epoxy-Al 2 O 3 system (5 to 20wt.%) and 23% for epoxy-ZnO system (over 5 to 15wt.%) for 100h of ageing.
Transcript of Effect of Seawater Ageing on Dielectric Properties of...
145
Chapter 6
Effect of Seawater Ageing on Dielectric Properties of
Epoxy Nanocomposites
6.1 Introduction
Nanocomposites exhibit novel performance due to incorporation of fillers which are
nano scales and high specific surface area. Significant and high quality of research has
been carried out in recent years by incorporating different nano particles into existing
dielectric systems in a cost effective manner, to derive improved benefits over
conventional composites. However, the effect of seawater which is important for
marine applications and condition of high humidity on nanocomposites is still far
from being well established. The weakness imparted by seawater has a detrimental
effect on the mechanical and electrical behavior of nanocomposites. For example,
epoxy resin can consume up to a few wt.%, of water and this may lead to an overall
degradation of the dielectric performance. This could be further compounded by
additional absorption by nanofillers caused by their tendency to increase the free
volume (e.g. through cracks, voids or through inhibiting cross-linking). In practical
applications, water absorbance in materials is inevitable. The absorbed water can
bring many negative influences to insulating materials, such as distortion of electric
field distribution, inducing water trees, creating structural damage etc. Therefore, it is
very important to understand the effect of absorbed water on the dielectric
performance of epoxy nanocomposites.
In this chapter, the dielectric performance of epoxy nanocomposites in terms
of seawater absorption, hydrophobicity of the material, diffusion co-efficient, Tg, free
volume, dielectric properties, and percolation phenomenon of epoxy matrix and
epoxy nanocomposites is discussed.
6.2 Seawater absorption of epoxy nanocomposites
For better understanding the effect of seawater absorption on the epoxy
nanocomposites, water absorption measurement were carried out and the results of
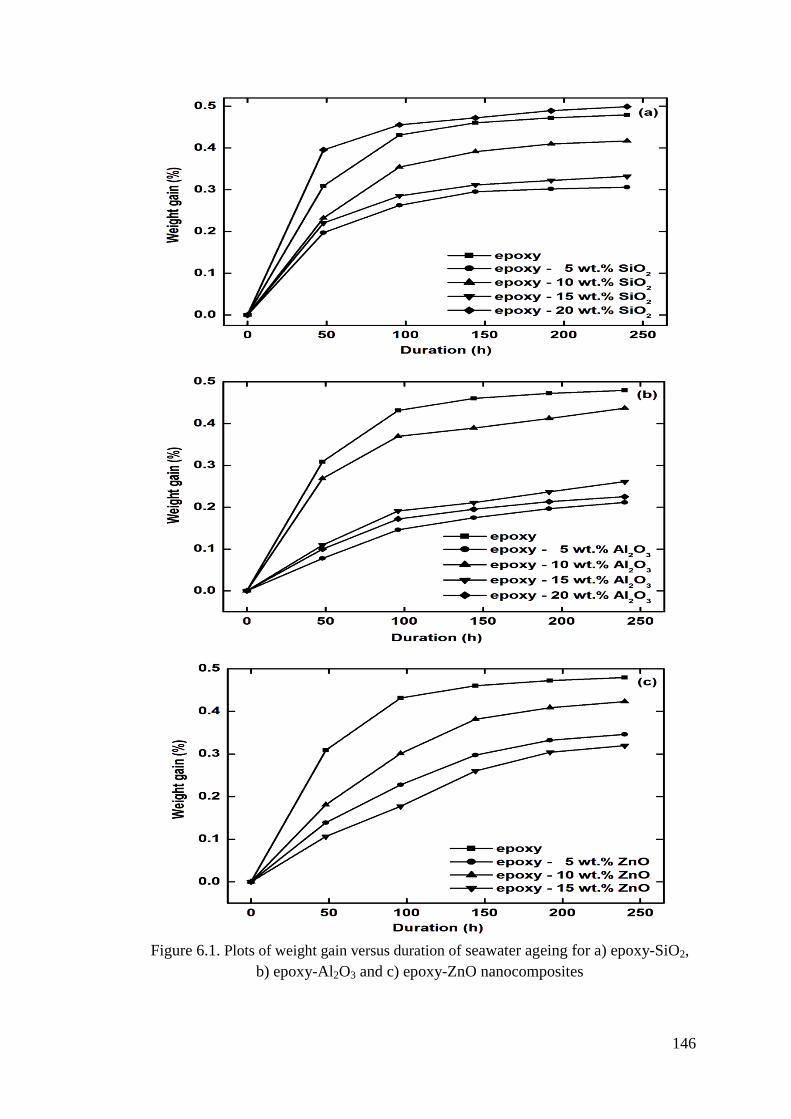
weight gain as a function of time in hours are shown in Figure 6.1(a-c). The epoxy-
SiO2/Al2O3/ZnO nanocomposites absorb less water except at 20wt.% filler loading
than unfilled epoxy. The rate of water absorption is comparatively higher up to 100h
and there after the absorption rate reduces up to 200h and beyond this the
sorption/absorption rate becomes negligible. The absolute weight gain of the unfilled
epoxy is 45% at 100h but for nanocomposites it has an average value of 33% for
epoxy SiO2 system, (5 to 20wt.%), 20% for epoxy-Al2O3 system (5 to 20wt.%) and
23% for epoxy-ZnO system (over 5 to 15wt.%) for 100h of ageing.
146
Figure 6.1. Plots of weight gain versus duration of seawater ageing for a) epoxy-SiO2,
b) epoxy-Al2O3 and c) epoxy-ZnO nanocomposites

147
From the Figure 6.1(a-c) it can be observed that the water sorption rate
saturates in epoxy-SiO2 nanocomposites at 23% in epoxy-Al2O3 nanocomposites at
53% and in epoxy-ZnO system at 46% as compared to pure epoxy value of 43%.
Among three nanocomposite systems, water absorption is least in epoxy-Al2O3
system.
This may be due to the high specific interfacial area (particle area per
composite volume) where water may be localized due to congregate and increase free
volume [34, 255]. Moreover, the equilibrium water content depends not only on the
free volume in the matrix, but also on the concentration of hydrogen bonds formed
between water and network polar groups [310] and the interfacial effects.
From the water sorption results shown in Figure 6.1(b) it can be seen that the
water sorption characteristics of epoxy and the nanoAl2O3 filled epoxy characteristics
are almost similar at 10wt.%. However at 5, 15 and 20wt.% of filler loading, some
difference are observed. This shows that the incorporation of Al2O3 nanoparticles and
its concentration do not influence the basic water diffusion mechanism in epoxy and it
is independent of duration of water treatment. Water absorption shows decrease with
increasing nanoAl2O3 content and this can be explained by two factors: 1) The
volume of epoxy for water diffusion is reduced with increasing nanoAl2O3content. 2)
The presence of the nanoparticles can increase the path length for diffusion of water
molecules [311]. The reduction in weight gain due to water absorption in epoxy-
SiO2/Al2O3/ZnO nanocomposites system may be due to the inability of spherical nano
particles in comparison to the layered silicates in introducing torturous-paths for
diffusion of water molecules [312].
6.3 Hydrophobicity characterization of nanocomposites
The measure of contact angle of a water droplet is an indirect measure of
hydrophobicity of the material.
6.3.1 Effect of filler loading
Figure 6.2 shows variation in contact angle of epoxy-SiO2/Al2O3/ZnO
nanocomposites at room temperature. It is observed that the contact angle increases
up to10wt,% of SiO2/Al2O3 loading in comparison to pure epoxy. However a higher
value of contact angle of 28% is observed at 15wt.% of ZnO loading and this
indicates an increase in hydrophobicity of epoxy-ZnO nanocomposites. It is well
known that increase in contact angle of the specimen reduces the wettability of the
surface [313]. With the addition of 15wt.% and 20wt.% of SiO2 and Al2O3 nanofillers
in epoxy, a reduction of 24% in contact angle is observed as compared to 10wt.% of
SiO2/Al2O3 filled epoxy nanocomposite. Compared to epoxy-SiO2/Al2O3/ZnO
nanocomposite systems, the lowest value of contact angle is observed in epoxy-SiO2
system. The hydrophobicity of any material is not only dependant on chemical
composition and nature of the surface, but also on the surface morphology and
roughness. Therefore, by increasing surface heterogeneity and roughness of material,
hydrophobicity increases.

148
The increase in contact angle for 5, 10 and 15wt.% of epoxy nanocomposite
indicates that the surface of the nanocomposite remains hydrophobic. It is therefore
evident that the electrical performance of insulation can be considered as acceptable
because of the control over leakage current. On the other hand, at 15wt.% and 20wt.%
of SiO2/Al2O3 filled epoxy nanocomposite, contact angle reduces indicating decrease
in hydrophobicity.
Figure 6.2. Variation of contact angle with filler loading of epoxy nanocomposites
This may lead to increase in leakage current. Existence of Si-O and hydrogen
bonds at the surface may result in good adhesion between epoxy and nanofiller. Due
to surface functionalization and lower surface energy of nanocomposite; higher
hydrophobicity will be achieved.
6.3.2 Effect of seawater ageing on contact angle
The variation in contact angle of the pure epoxy and epoxy nanocomposites aged in
seawater at 25C are shown in Figure 6.3. It can be observed from Figure 6.3 that
there is an average decrease in contact angle of 8% in epoxy-SiO2 nanocomposites
after seawater ageing for 240h at 25C. Comparing the contact angle of the pure
epoxy resin with epoxy-SiO2 nanocomposite, it is observed that increase in filler
content leads to increase of contact angle and therefore higher hydrophobicity results.
From Table 6.1 an average decrease in contact angle of 5% and 6% in epoxy-
Al2O3 and epoxy-ZnO nanocomposites after seawater ageing for 240h at 25°C is
observed. The variation in contact angle of the seawater aged epoxy nanocomposite is
less as compared to that of dried epoxy nanocomposite. This implies that the
nanocomposite retains its hydrophobicity even after seawater ageing for 240h and
hydrophobic filler does not permit water to form a continuous film on the surface.

149
Figure 6.3. Effect of seawater ageing of contact angle in epoxy-SiO2 nanocomposites
at 25°C
Table 6.1. Contact angle of dried and saturated for epoxy-Al2O3/ZnO nanocomposites
Composition
(wt.%)
Contact angle (degree)
epoxy-Al2O3 epoxy-ZnO
Dried Saturated Dried Saturated
0 71.09 65.27 71.09 65.27
5 76.82 71.12 73.18 68.34
10 86.47 79.48 80.43 75.80
15 75.86 70.13 90.71 85.61
20 69.94 64.86 Not measured
The absorption of the seawater and adhesion of salts to the surface increases
the surface free energy of epoxy, epoxy-SiO2/Al2O3/ZnO nanocomposites and
therefore there is decrease in contact angle. Similarly, the recovery of the contact
angle is also related to the change in the surface free energy. Further, surface
degradation due to oxidation at high salinity and higher temperature has a permanent
effect and is likely to result in a permanent increase in surface free energy. This
causes a decrease in the contact angle.
6.4 Diffusion co-efficient of nanocomposites
The diffusion co-efficient of epoxy, epoxy-SiO2/Al2O3/ZnO nanocomposites was
computed using, the equation (6.1) and the results are shown in Table 6.2
2
0 5
0 564
.
.
LD
t
(6.1)
Here, D is the diffusion co-efficient, L0.5 is thickness of the specimen, t0.5 =
m(t)/m(∞), m(t) is the initial time of water absorption and m(∞) is the saturation
time of water absorption.

150
From Table 6.2, it is observed that with SiO2/Al2O3 loading of epoxy there is
an increase in diffusion co-efficient by 16% and 44% up to 20wt.%, at 25C. In
epoxy-ZnO nanocomposites the diffusion co-efficient shows decrease at 5wt.% where
as at 10wt.% of nanofiller loading, the value is enhanced to 1.155x10⁻¹²
m2/s. With
further increases in filler loading to 15wt.% diffusion co-efficient decreases to
0.894x10⁻¹²
m2/s with respect to the basic value of pure epoxy. It is observed that
epoxy-Al2O3 nanocomposite have higher diffusion co-efficient values, Further it is
observed that the diffusion co-efficient of nanocomposite increases with increase in
temperature in epoxy-SiO2/Al2O3/ZnO nanocomposite systems.
The results indicate that the epoxy-SiO2 nanocomposite are more hydrophobic
than pure epoxy because of ceramic nature, surface functionalization of SiO2 and
better interfacial adhesion between the matrix and SiO2 filler. NanoSiO2 loading of
20wt.%, causes a slight increase in diffusion coefficient of epoxy-SiO2
nanocomposites. This is attributed to local inhomogeneities in adhesion, pores,
defects and pin holes that exist at the interface. A slight increase in diffusion
coefficient of epoxy-Al2O3 nanocomposites may be attributed to the presence of water
content, free charge carriers on the surfaces of Al2O3 nanoparticles and higher density
of Al2O3 nanoparticles as discussed under section 4.2.2 on FTIR characterization of
Al2O3 nanoparticles.
Table 6.2. Variation of diffusion co-efficient of epoxy nanocomposites
Composition (wt.%) Diffusion co-efficient (m
2/s)10
-12
25°C % change
(1.0)
50°C % change
(1.0)
75°C % change
(1.0)
epoxy-SiO2
0 0.935 - 1.160 - 2.332 -
5 0.860 8.02 1.075 7.32 2.151 7.76
10 0.914 2.20 1.141 1.64 2.283 2.10
15 0.917 1.96 1.146 1.20 2.293 1.67
20 1.025 8.78 1.281 9.37 2.562 8.97
epoxy-Al2O3
5 0.767 21.9 0.958 17.4 1.917 17.7
10 1.179 20.6 1.470 21.1 2.948 20.8
15 1.294 27.7 1.617 27.9 3.235 27.9
20 1.371 31.8 1.713 32.0 3.427 31.9
epoxy-ZnO
5 0.799 14.5 0.999 14.6 1.998 14.3
10 1.155 19.0 1.441 19.4 2.886 19.1
15 0.894 4.35 0.352 69.8 2.235 4.15
6.5 Effect of seawater on glass transition temperature
Most epoxy manufactures declare that the Tg of epoxy resin does not or only slightly
decrease with moisture. Some researchers have claimed that absorbed water
molecules which form double hydrogen bonds would cause an increase in Tg [314].
On the contrary, the absorbed water in epoxy materials would lead to a decrement of
glass transition temperature due to the plasticizing effect of water [315].

151
Figure 6.4. The plots showing the variation of Tg on a) epoxy-SiO2, b) epoxy-Al2O3
and c) epoxy-ZnO nanocomposites

152
To confirm this finding, DSC experiments were carried out and results are
discussed. Figure 6.4 shows the Tg of the epoxy nanocomposites in both “dried” and
“240h seawater aged” samples. It can be seen that the seawater saturated epoxy
nanocomposites have lower Tg as compared with the dried ones. For epoxy
nanocomposites loaded with 5wt.% of nanoSiO2 fillers, the difference of Tg between
dried and seawater saturated sample is 16°C, whereas for 10, 15 and 20wt.% samples,
there is a difference of ~17°C . In epoxy-Al2O3 system, the difference of Tg is ~12°C
and in epoxy-ZnO system it is ~13°C between dried and saturated samples. The study
shows that the water absorbed by epoxy nanocomposites tends to accumulate at the
interface between polymer molecular and the organic nanosize fillers [316].
The water absorption of epoxy nanocomposites is enhanced by the presence of
nanosize fillers as a result of hydration. The bound water will disrupt the Vander
Waals force between molecular chains and the hydrogen bonds as well. In such a case
the chain mobility will increase, resulting in lower Tg. Polymer composites used
above their Tg, will tend to degrade in terms of physical and mechanical properties
[314, 315].
DSC results also show that the depression of Tg caused by water is
recoverable. Thus drying of samples helps in recovery of Tg. It seems likely that
reversible interactions have occurred between water and the resin under the
experimental conditions used in this study. However, exposure to moisture at elevated
temperatures is expected to produce irreversible effects, which can be attributed to the
chemical degradation of the matrix and to the attack on the fillers/resin interfaces.
This causes an increase of the internal voids of the entangling polymer chain,
promoting chain expansion and the microcracks formation into the polymer matrix
[317].
6.6 Effect of seawater on free volume of nanocomposites
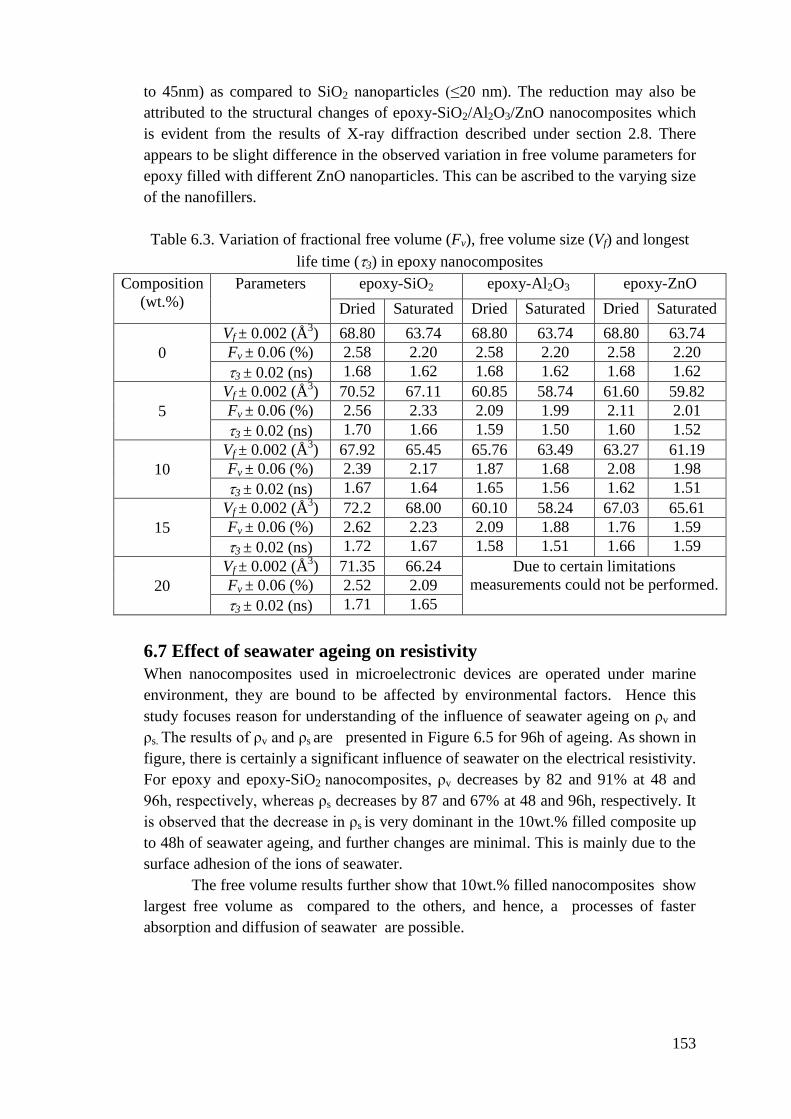
The variation of free volume content or fractional free volume (Fv), free volume size
(Vf) and longest life time (3) with different wt.% of SiO2 in epoxy nanocomposites
are shown in Table 6.3. It is observed that,3 shows increase from 1.62 to 1.67ns, Vf
and Fv also increase from 63.74 to 68Å3
and 2.20 to 2.23% respectively, but for
20wt.% of filler loading, all these parameters show decreasing trend.
With increase in seawater sorption up to 240h, the free volume parameters Vf,
3 and Fv in epoxy-SiO2/Al2O3/ZnO nanocomposites show decreasing tendancy as in
Table 6.3. These changes can be attributed to the size of water molecules ingressed
into the sample which is ~1.5Å in radius. This is less than the existing free volume
size ~2.5Å in radius (measured from PALS) in the nanocomposite. Therefore, as the
seawater gets sorbed in to the nanocomposite (up to saturated level of 240h) the water
molecules certainly occupy the existing free volume space present in the
nanocomposite and this results in the decreasing tendency of free volume parameters.
As compared to epoxy-SiO2 nanocomposites, for epoxy-Al2O3/ZnO
nanocomposites, both in dried and water saturated conditions, a decrease in the free
volume parameters is observed. This might be due to the interaction between the
matrix-filler interface regions and also the filler size of Al2O3/ZnO nanoparticles (30
153
to 45nm) as compared to SiO2 nanoparticles (≤20 nm). The reduction may also be
attributed to the structural changes of epoxy-SiO2/Al2O3/ZnO nanocomposites which
is evident from the results of X-ray diffraction described under section 2.8. There
appears to be slight difference in the observed variation in free volume parameters for
epoxy filled with different ZnO nanoparticles. This can be ascribed to the varying size
of the nanofillers.
Table 6.3. Variation of fractional free volume (Fv), free volume size (Vf) and longest
life time (3) in epoxy nanocomposites
Composition
(wt.%)
Parameters epoxy-SiO2 epoxy-Al2O3 epoxy-ZnO
Dried Saturated Dried Saturated Dried Saturated
0
Vf ± 0.002 (Å3) 68.80 63.74 68.80 63.74 68.80 63.74
Fv ± 0.06 (%) 2.58 2.20 2.58 2.20 2.58 2.20
3 ± 0.02 (ns) 1.68 1.62 1.68 1.62 1.68 1.62
5
Vf ± 0.002 (Å3) 70.52 67.11 60.85 58.74 61.60 59.82
Fv ± 0.06 (%) 2.56 2.33 2.09 1.99 2.11 2.01
3 ± 0.02 (ns) 1.70 1.66 1.59 1.50 1.60 1.52
10
Vf ± 0.002 (Å3) 67.92 65.45 65.76 63.49 63.27 61.19
Fv ± 0.06 (%) 2.39 2.17 1.87 1.68 2.08 1.98
3 ± 0.02 (ns) 1.67 1.64 1.65 1.56 1.62 1.51
15
Vf ± 0.002 (Å3) 72.2 68.00 60.10 58.24 67.03 65.61
Fv ± 0.06 (%) 2.62 2.23 2.09 1.88 1.76 1.59
3 ± 0.02 (ns) 1.72 1.67 1.58 1.51 1.66 1.59
20
Vf ± 0.002 (Å3) 71.35 66.24 Due to certain limitations
measurements could not be performed. Fv ± 0.06 (%) 2.52 2.09
3 ± 0.02 (ns) 1.71 1.65
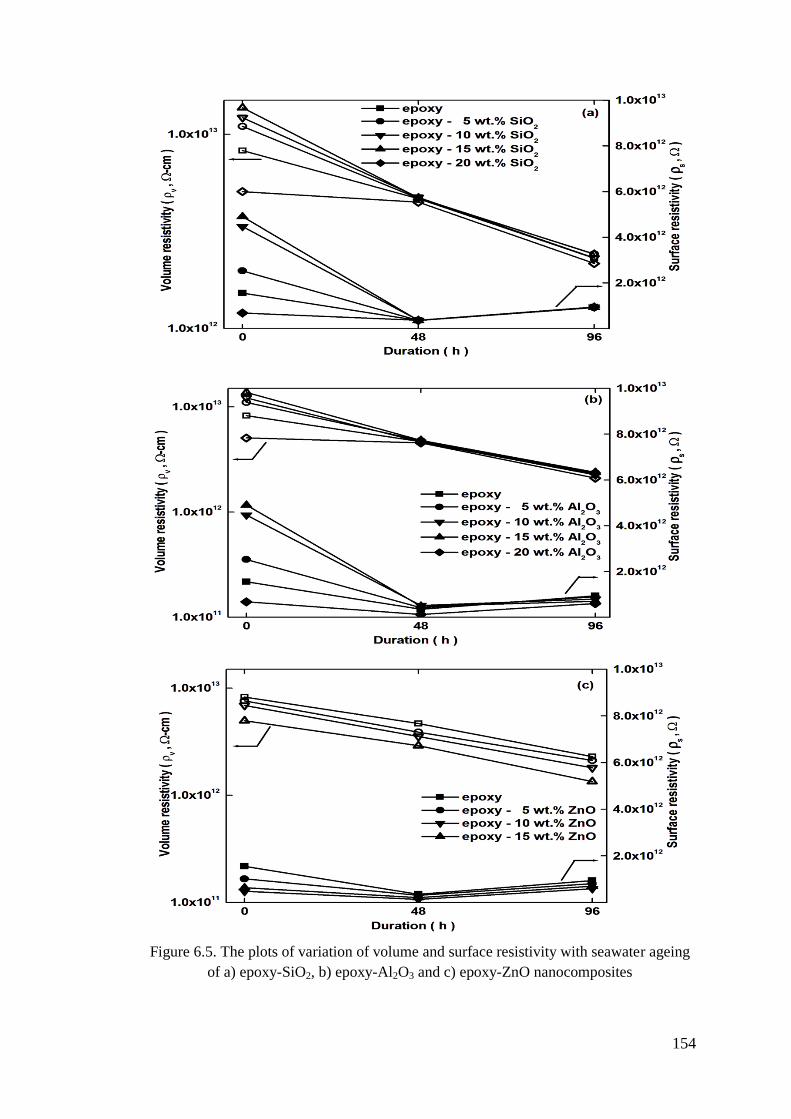
6.7 Effect of seawater ageing on resistivity
When nanocomposites used in microelectronic devices are operated under marine
environment, they are bound to be affected by environmental factors. Hence this
study focuses reason for understanding of the influence of seawater ageing on ρv and
ρs. The results of ρv and ρs are presented in Figure 6.5 for 96h of ageing. As shown in
figure, there is certainly a significant influence of seawater on the electrical resistivity.
For epoxy and epoxy-SiO2 nanocomposites, ρv decreases by 82 and 91% at 48 and
96h, respectively, whereas ρs decreases by 87 and 67% at 48 and 96h, respectively. It
is observed that the decrease in ρs is very dominant in the 10wt.% filled composite up
to 48h of seawater ageing, and further changes are minimal. This is mainly due to the
surface adhesion of the ions of seawater.
The free volume results further show that 10wt.% filled nanocomposites show
largest free volume as compared to the others, and hence, a processes of faster
absorption and diffusion of seawater are possible.
154
Figure 6.5. The plots of variation of volume and surface resistivity with seawater ageing
of a) epoxy-SiO2, b) epoxy-Al2O3 and c) epoxy-ZnO nanocomposites

155
For seawater sorption, the rate of sorption is initially higher because of the
ionic nature of water, which results in increase in conductivity and increase/decrease
of resistivity [338]. As shown in Figure 6.5, ρv shows a continuous decrease up to
96h, but ρs remains more or less constant after 48h of ageing. The constancy of ρs
after 48h of ageing suggests a possible saturation of the surface with ionic species,
whereas ρv does not show such effects because it is the bulk parameter and the ions
require more time for diffusion. The mechanism leading to decrease in the dc
resistivity results may be explained as follows:
The absorbed water is not confined to one layer but is formed in different
layers of the epoxy matrix. Thus transfer of charge carriers occurs more rapidly and
the conductivity starts increasing. The first few water molecules might be firmly
bound to the nanoparticle. Other water molecules may be loosely bound by Vander
Waals forces. Therefore, concentration of water in the matrix may be sufficient for
conduction through a channel for charge carriers. This results in a decrease in ρv.
Further, high polarity of water molecules attracts charge carriers, particularly at the
filler-matrix interface, and this leads to significant decrease in resistivity [318].
Though the experiments were carried out up to 240h, results are shown only up to 96h
since saturation is observed beyond 96h.
6.8 Effect of seawater on dielectric constant
The variations in dielectric constant as a function of frequency in case of epoxy
nanocomposites with treated SiO2/Al2O3/ZnO nanofillers are shown in Figure 6.6(a-
d). It can be seen from the Figure 6.6 that there is an increase in by 6.4%, 36% and
60% in epoxy-SiO2/Al2O3/ZnO nanocomposite systems after seawater ageing as
compared to dried samples. It is also observed from the results that effective dielectric
constant of epoxy nanocomposites is strongly influenced by the presence of inorganic
nanofillers and their surface characteristics.
It is also observed from Figure 6.6(b-d) that the real part of dielectric constant
is highest in case of epoxy-SiO2 and the lowest in epoxy-ZnO as compared to epoxy-
Al2O3 nanocomposites.
In SiO2 systems, it can be seen from Figure 6.6(b) that at 5 and 10wt.% of
filler loadings, the ' at all frequencies are lower than that of pure epoxy, but at 15 and
20wt.% of filler loading, ' shows higher values. On the other hand, in Al2O3 and
ZnO filled systems results of which are shown in Figure 6.9(c-d), ' over the entire
frequency range is lower than the corresponding values of pure epoxy up to 15wt.%.
The difference in dielectric constant is a result of the reduction of mobility of
the dipolar groups within the composites which will reduce the polarization within the
composites [71]. When the nanofillers are introduced into the polymer materials, an
interaction region between polymer matrix and nanofiller is formed. The multi-core
model proposed by Tanaka [16] can be applied in this case to explain the dielectric
constant variations, details of which are discussed under Chapter 4.

156
Figure 6.6. Plots of variation of dielectric constant with frequency after seawater
ageing of a) epoxy, b) epoxy-SiO2, c) epoxy-Al2O3 and d) epoxy-ZnO
nanocomposites
157
The reasons for increase in dielectric constant with seawater ageing are:
i) Stronger dipoles of water as compared to epoxy.
ii) Damage of polymer chains and,
iii) Increase in segmental mobility due to plasticization increase in free volume and
breaking of weak bonds
Reasons for decrease in dielectric constant with seawater ageing are:
i) Increase in free volume from loose structure.
ii) Increase in free volume due to mobile interlayer nanovoids.
iii) Restricted molecular movements -OH radicals.
These factors result in increase in total dipole strength of the nearby segments [319,
320].
The decrease in dielectric constant of the epoxy matrix with different SiO2
content is due to increase in free volume resulting in a loose structure of polymer
matrix [321]. Due to increase in free volume, a highly mobile interlayer or nanovoid
can be formed around the nanofiller [322]. When silane is used as a coupling agent,
the molecular movement is restricted through OH radicals due to silane coupling. The
surface treatment of SiO2/Al2O3/ZnO nanofillers also leads to a better particle
dispersion rate in the base polymer materials and results in a contribution to the
volume fraction. Therefore, in the present study, the epoxy-SiO2/Al2O3/ZnO
nanocomposites loaded with treated nanofillers have slightly lower dielectric constant.
It can also be observed that the dielectric constant of epoxy and epoxy-Al2O3
nanocomposites, the effect of seawater ageing is minimal.
6.9 Effect of seawater on dissipation factor
The variation of seawater ageing on tanδ value in epoxy-SiO2/Al2O3/ZnO
nanocomposites with different concentrations are presented in Figure 6.7(a-c). It can
be seen from the Figure 6.7 that there is an increase in tanδ by 50%, 84% and 74% in
epoxy-SiO2/Al2O3/ZnO nanocomposite systems after seawater ageing as compared to
dried specimen. In fact, water sorption is higher in epoxy-ZnO system as compared to
epoxy-SiO2/Al2O3 systems. The reasons for increase in tanδ with seawater ageing are
as follows:
i) The tanδ increases because water molecule is polar and the increase in water
content of the nanocomposites leads to increase in the orientation polarization
processes. In addition other physical and chemical degradations may lead to
increase in polarization and conduction processes.
ii) The increase in tanδ is relatively lower in SiO2/ZnO nanocomposite systems as
compared to epoxy-Al2O3 nanocomposites when aged in seawater. This can be
explained on the basis of different morphologies of the two fillers. For epoxy-
Al2O3 nanocomposite, water shell is likely to be located around the lamellae, to
create path which according to literature [314, 323] can increase conduction
current leading to increase in tanδ.

158
Figure 6.7. Graphs showing variation of tanδ with frequency after seawater ageing of
a) epoxy-SiO2, b) epoxy-Al2O3 and c) epoxy-ZnO nanocomposites
159
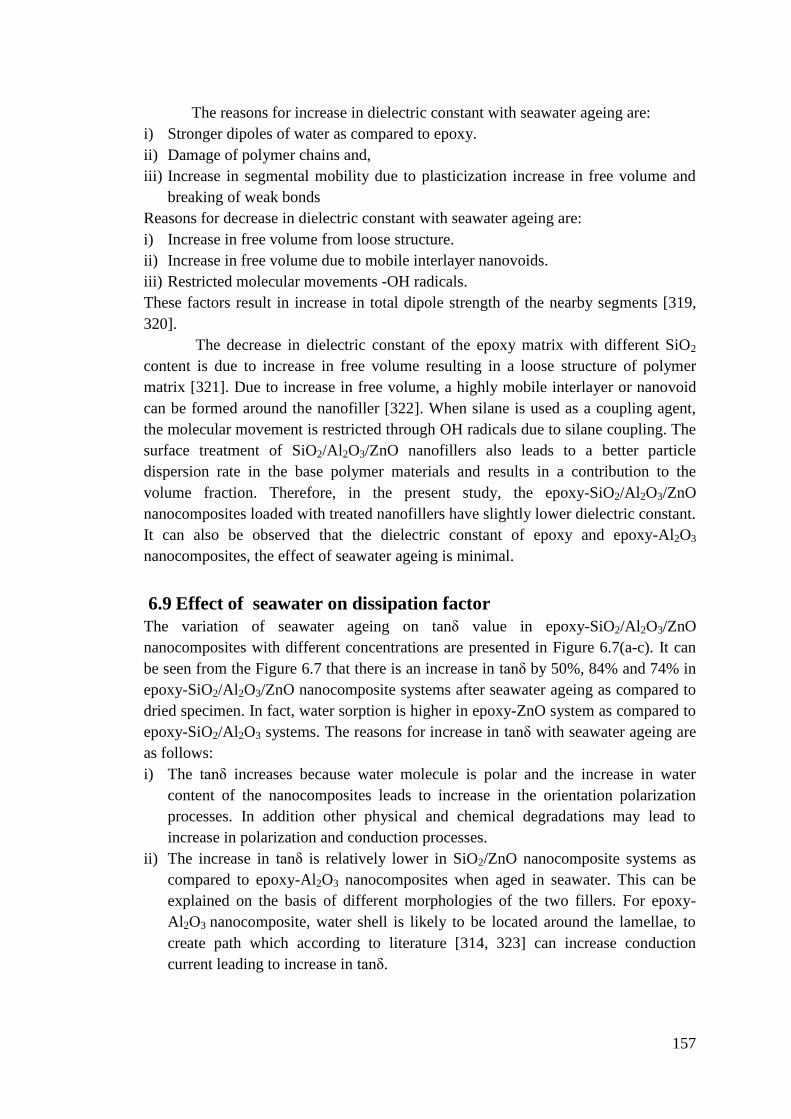
6.10 Effect of seawater on breakdown strength of nanocomposites
The ac breakdown strength of seawater saturated unfilled epoxy resin, and epoxy-
SiO2/Al2O3/ZnO nanocomposites (for 5, 10, 15 and 20wt.%) are evaluated and the
results are shown in Figure 6.8(a-c).
Figure 6.8. Weibull plots of dielectric strength after saturation for a) epoxy-SiO2,
b) epoxy-Al2O3 and c) epoxy-ZnO nanocomposites
160
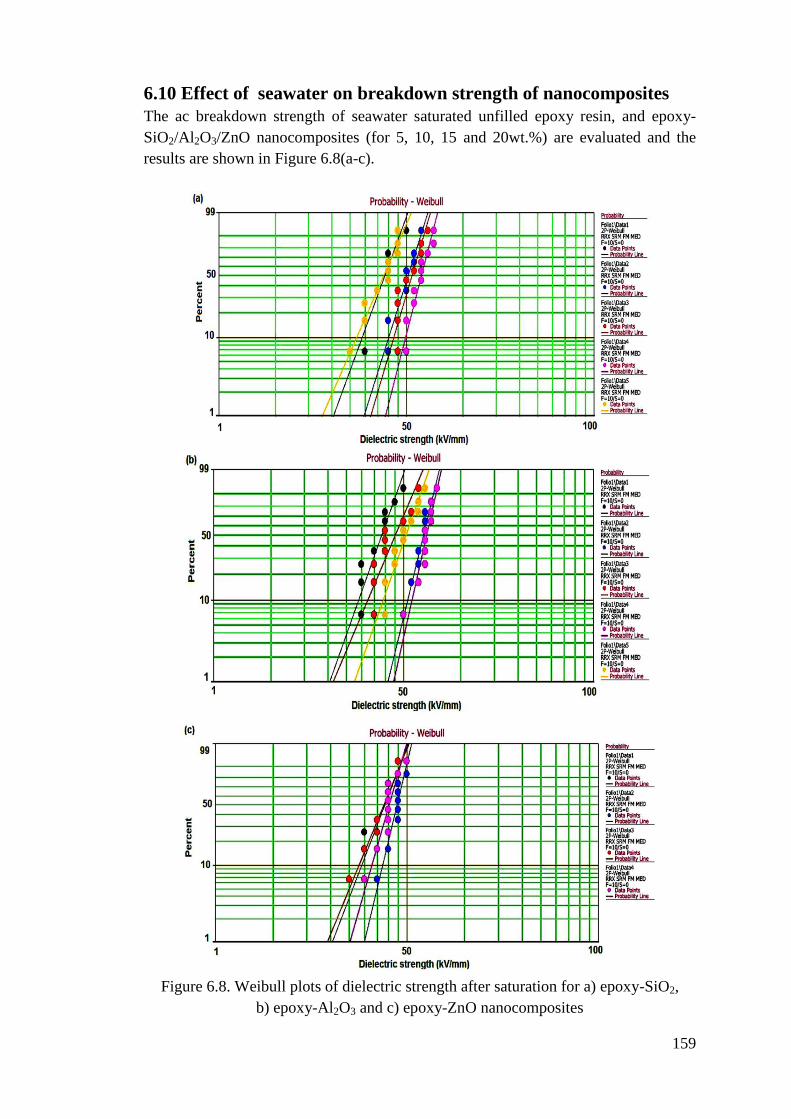
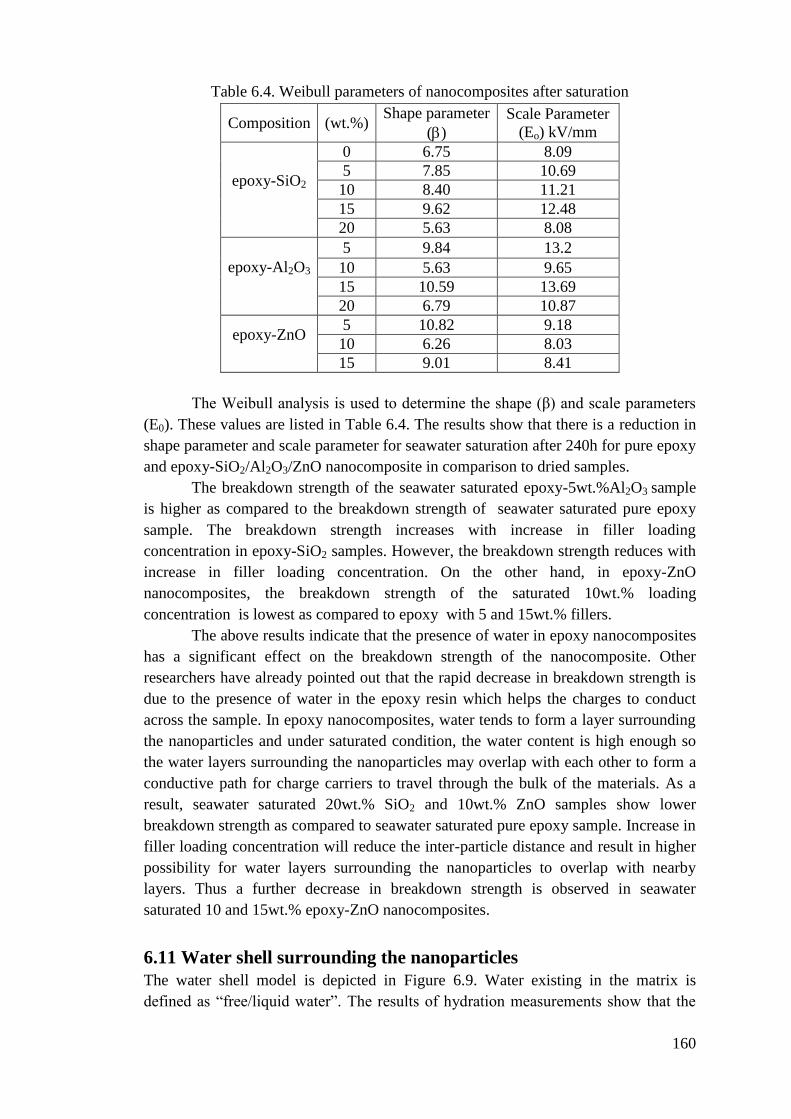
Table 6.4. Weibull parameters of nanocomposites after saturation
Composition (wt.%) Shape parameter
()
Scale Parameter
(Eo) kV/mm
epoxy-SiO2
0 6.75 8.09
5 7.85 10.69
10 8.40 11.21
15 9.62 12.48
20 5.63 8.08
epoxy-Al2O3
5 9.84 13.2
10 5.63 9.65
15 10.59 13.69
20 6.79 10.87
epoxy-ZnO
5 10.82 9.18
10 6.26 8.03
15 9.01 8.41
The Weibull analysis is used to determine the shape (β) and scale parameters
(E0). These values are listed in Table 6.4. The results show that there is a reduction in
shape parameter and scale parameter for seawater saturation after 240h for pure epoxy
and epoxy-SiO2/Al2O3/ZnO nanocomposite in comparison to dried samples.
The breakdown strength of the seawater saturated epoxy-5wt.%Al2O3 sample
is higher as compared to the breakdown strength of seawater saturated pure epoxy
sample. The breakdown strength increases with increase in filler loading
concentration in epoxy-SiO2 samples. However, the breakdown strength reduces with
increase in filler loading concentration. On the other hand, in epoxy-ZnO
nanocomposites, the breakdown strength of the saturated 10wt.% loading
concentration is lowest as compared to epoxy with 5 and 15wt.% fillers.
The above results indicate that the presence of water in epoxy nanocomposites
has a significant effect on the breakdown strength of the nanocomposite. Other
researchers have already pointed out that the rapid decrease in breakdown strength is
due to the presence of water in the epoxy resin which helps the charges to conduct
across the sample. In epoxy nanocomposites, water tends to form a layer surrounding
the nanoparticles and under saturated condition, the water content is high enough so
the water layers surrounding the nanoparticles may overlap with each other to form a
conductive path for charge carriers to travel through the bulk of the materials. As a
result, seawater saturated 20wt.% SiO2 and 10wt.% ZnO samples show lower
breakdown strength as compared to seawater saturated pure epoxy sample. Increase in
filler loading concentration will reduce the inter-particle distance and result in higher
possibility for water layers surrounding the nanoparticles to overlap with nearby
layers. Thus a further decrease in breakdown strength is observed in seawater
saturated 10 and 15wt.% epoxy-ZnO nanocomposites.
6.11 Water shell surrounding the nanoparticles
The water shell model is depicted in Figure 6.9. Water existing in the matrix is
defined as “free/liquid water”. The results of hydration measurements show that the
161
nanocomposites absorb water up to 23% in epoxy-SiO2, 53% in epoxy-Al2O3 and
46% in epoxy-ZnO, which is less than the pure epoxy matrix.
In Figure 6.4, the glass transition temperature (Tg) of epoxy-SiO2/Al2O3/ZnO
nanocomposites, measured by DSC, shows reduction in Tg from dried to fully water-
saturated specimens. This shows that in epoxy-SiO2/Al2O3/ZnO nanocomposites, the
amount of water in the resin is almost independent of the concentration of filler.
However, it is observed that there is up to 23% extra water in SiO2 nanofilled
specimens. It is not possible for the extra water to have been located in the bulk of the
epoxy since its Tg would be reduced further for the water saturated case. The most
obvious implication is that the extra water is located around the nanoparticles, most
likely at the interfaces.
Under this assumption, some water will surround each nanoparticles and the
rest of the water exists in the epoxy matrix in the form of “free” or “liquid” water. In
any case, the link between silica and epoxy is more likely to be broken by water and
the adhesion of the epoxy to the silica also becomes weak so as to reduce mechanical
strength of the nanocomposite.
Since the density of silica is higher than that of epoxy matrix, its volume
percent is ~0.79%. In other words, the distance between one nanoparticle and its
neighbor particle is about seven times larger than the average size of particles under
conditions of dispersion. If the size of nanoparticles is same, e.g., 21nm, the distance
between one particle and its neighbors will be 105-141nm. For a given humidity,
assuming that pure epoxy absorbs x% of water and nanofilled epoxy absorbs y% of
water, extra water absorbed by the nanofilled epoxy is therefore (y-x) %. Hence, the
thickness of each water shell can be calculated using this concept.
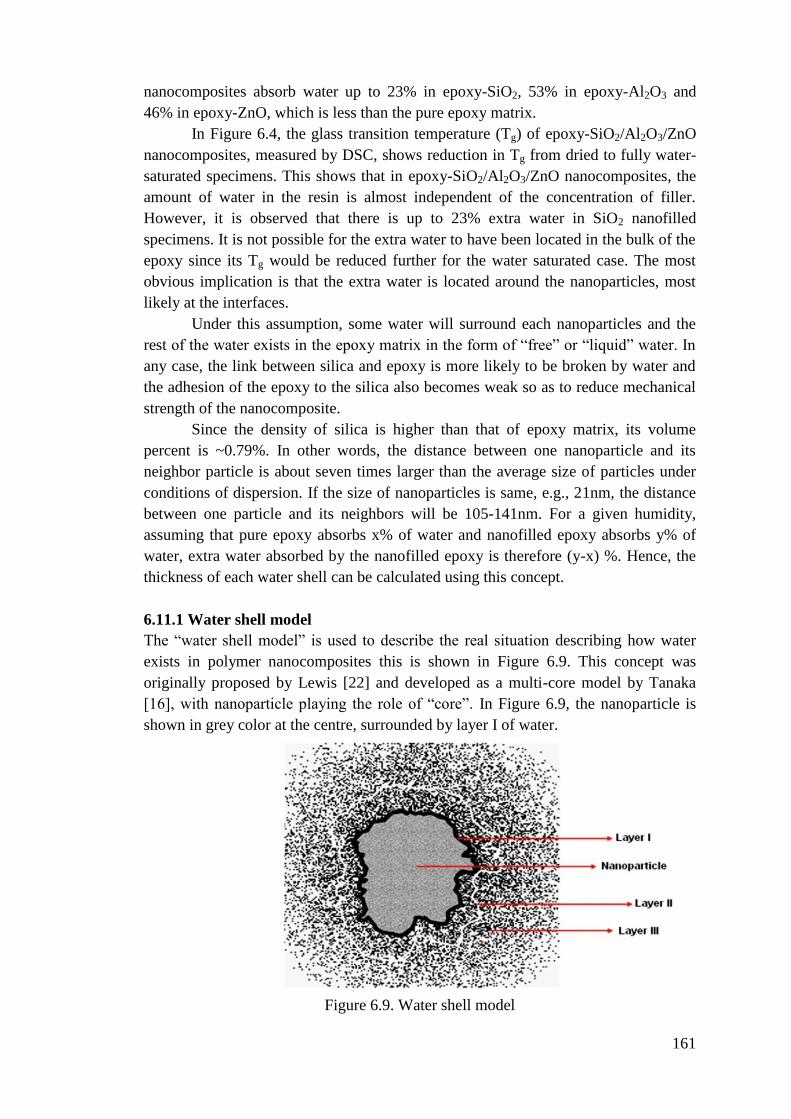
6.11.1 Water shell model
The “water shell model” is used to describe the real situation describing how water
exists in polymer nanocomposites this is shown in Figure 6.9. This concept was
originally proposed by Lewis [22] and developed as a multi-core model by Tanaka
[16], with nanoparticle playing the role of “core”. In Figure 6.9, the nanoparticle is
shown in grey color at the centre, surrounded by layer I of water.
Figure 6.9. Water shell model
162
A higher concentration of water is present in layer II as an interconnected
region which is indicated by white region. Outside this layer, which is layer III, water
is in lower concentration and may not be conductive.
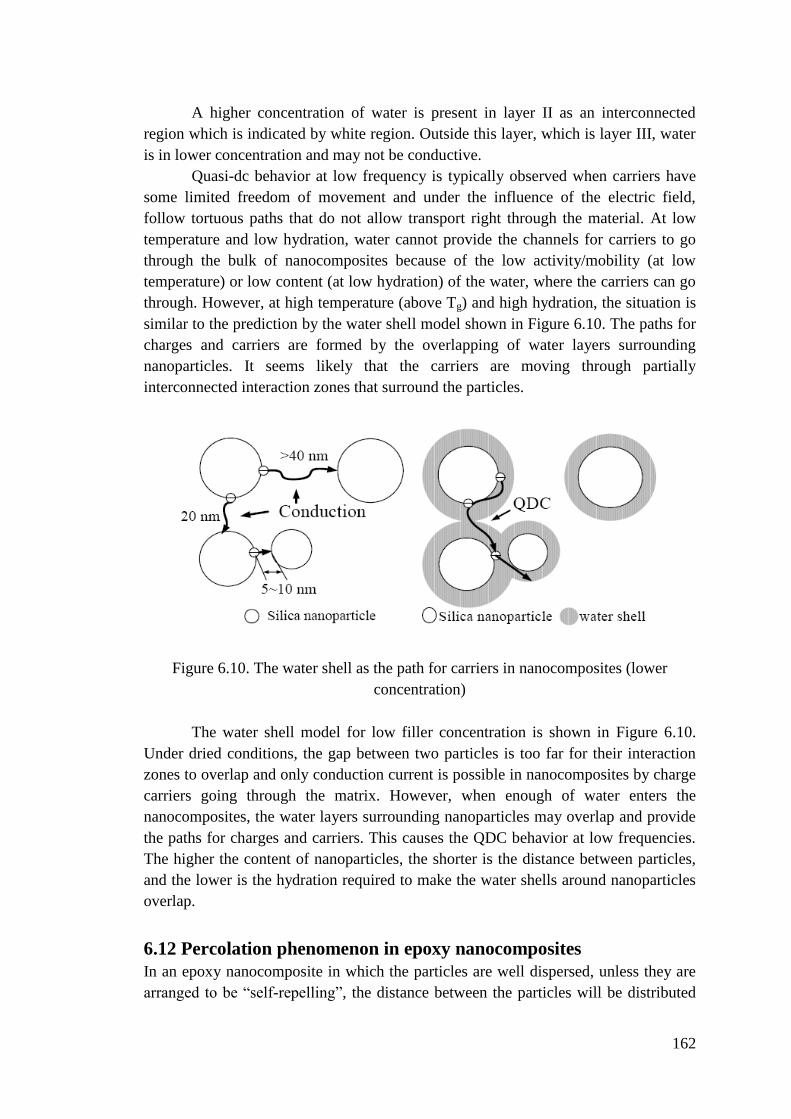
Quasi-dc behavior at low frequency is typically observed when carriers have
some limited freedom of movement and under the influence of the electric field,
follow tortuous paths that do not allow transport right through the material. At low
temperature and low hydration, water cannot provide the channels for carriers to go
through the bulk of nanocomposites because of the low activity/mobility (at low
temperature) or low content (at low hydration) of the water, where the carriers can go
through. However, at high temperature (above Tg) and high hydration, the situation is
similar to the prediction by the water shell model shown in Figure 6.10. The paths for
charges and carriers are formed by the overlapping of water layers surrounding
nanoparticles. It seems likely that the carriers are moving through partially
interconnected interaction zones that surround the particles.
Figure 6.10. The water shell as the path for carriers in nanocomposites (lower
concentration)
The water shell model for low filler concentration is shown in Figure 6.10.
Under dried conditions, the gap between two particles is too far for their interaction
zones to overlap and only conduction current is possible in nanocomposites by charge
carriers going through the matrix. However, when enough of water enters the
nanocomposites, the water layers surrounding nanoparticles may overlap and provide
the paths for charges and carriers. This causes the QDC behavior at low frequencies.
The higher the content of nanoparticles, the shorter is the distance between particles,
and the lower is the hydration required to make the water shells around nanoparticles
overlap.
6.12 Percolation phenomenon in epoxy nanocomposites
In an epoxy nanocomposite in which the particles are well dispersed, unless they are
arranged to be “self-repelling”, the distance between the particles will be distributed

163
according to Poisson distribution [19]. The probability P, that one interaction zone
will overlap with one of its neighbor‟s (for low concentration) is then given by
equation 6.2 for spherical particles and is as shown in Figure 6.11. Here„t‟ is the zone
thickness and„d‟ is the average particle separation [23]. For a 50% probability of
overlap, t/d would be 0.345 and a 20nm particle would require an interaction zone
thickness of 9.078nm [23].
21
tP exp
d
(6.2)
For charge carriers to percolate through overlapping shells, the volumetric
concentration zone and spherical particle must exceed 19% [324]. Figure 6.11 shows
the required ratio of shell thickness to particle radius as a function of volumetric
concentration of particle for complete percolation to occur [19]. For 10wt.%, of the
volumetric concentration, it is approximately 5%. Thus, for these 10nm radius
particles, the thickness of layers 1 and 2 must exceed 10nm for full percolation [19].
One would therefore expect extended charge carrier movement but at a sub-
percolation levels [19].
Figure 6.11. Probability of interacting particle zones
At low levels of RH and at lower concentration of filler, the shells would not
be expected to overlap much and conduction could be largely determined by the
conduction through the epoxy matrix between the particles. This would result in a low
frequency dielectric characteristic in which is directly proportional to 0
and is
directly proportional to -1
. This is observed in epoxy-SiO2/Al2O3/ZnO
nanocomposite systems at lower RH levels, the higher activation energies observed at
low levels of RH in the matrix are similar to that for 5wt.%, in which the volumetric
concentration of particles is ~1.5%. In 5wt.%, percolation through overlapping water
shell will be less common.

164
In Figure 6.12, the value of zone thickness or particle radius as a function of
filler content is shown. At lower levels of relative humidity and lower filler
concentration shells do not overlap and conduction is through the matrix between
filler particles as seen in low frequency response. This accounts for behavior at
5wt.%. Hence percolation through overlapping water shell is less possible. Thus drift
velocity for charge transport will be determined by the carrier movement through the
epoxy rather than through percolation overlapping in water shell. However, in
10wt.%, percolation is much more likely.
Figure 6.12. Percolation occurs on the “ ” side of the line
If both epoxy matrix and inorganic filler (with their interfacial phase) are
considered as capacitive, it can be assumed that a series model is applicable to epoxy
composites as shown in Figure 6.13.
Figure 6.13 The equivalent circuit of epoxy nanocomposites
According to Figure 6.13, the following relation can be obtained
1 1 2 2
1 1
' " ' " ' "
T T
P P
i i i (6.3)
Here P (0 < P < 1) is a ratio coefficient to describe the contribution of epoxy part. The
contribution of particle part is (1-P). Hence,
165
2 2 1 1
1 1 1
1
' " ' " ' "
T T
P
i P i i
1 1 1 1 1 12 2 2
1 1
1
' ' " " ' ' " ' ' " " "' T T T T T T
' ' " "
T T
( )( P ) ( )( P )( P ).
( P ) ( P )
(6.4)
1 1 1 1 1 12 2 2
1 1
1
" ' ' " ' ' ' ' " " " "" T T T T T T
' ' " "
T T
( )( P ) ( )( P )( P ).
( P ) ( P )
(6.5)
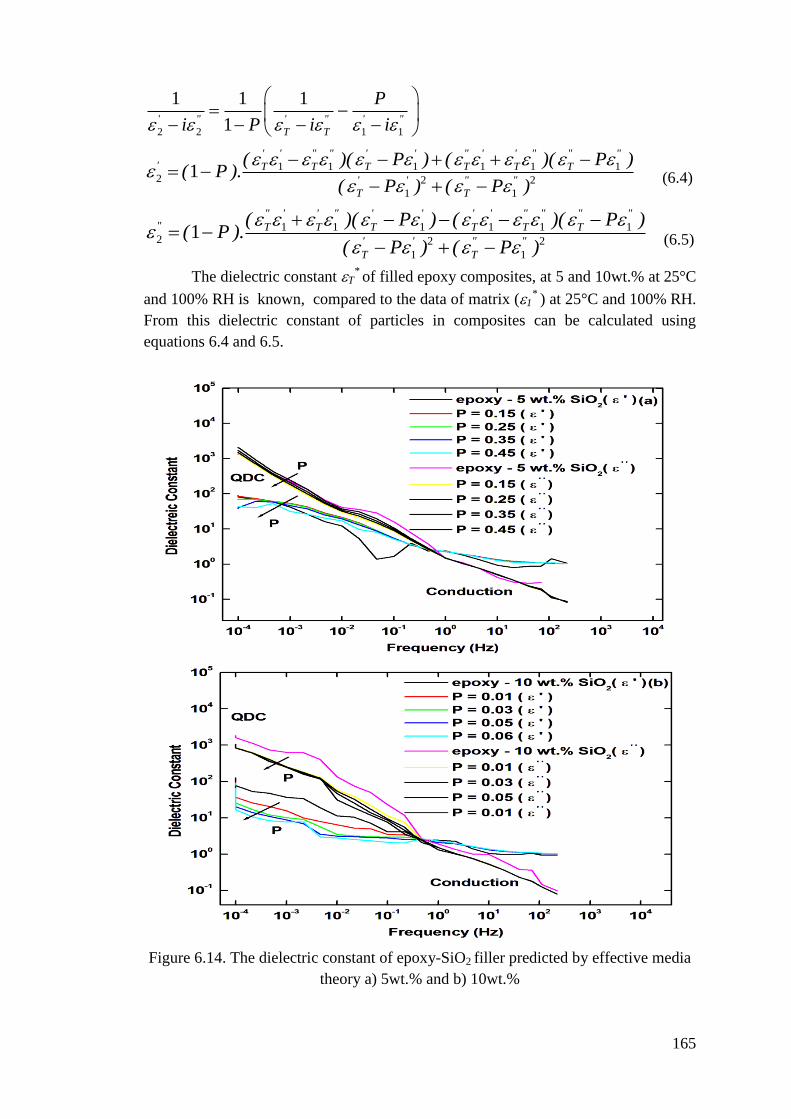
The dielectric constant T*
of filled epoxy composites, at 5 and 10wt.% at 25°C
and 100% RH is known, compared to the data of matrix (1*
) at 25°C and 100% RH.
From this dielectric constant of particles in composites can be calculated using
equations 6.4 and 6.5.
Figure 6.14. The dielectric constant of epoxy-SiO2 filler predicted by effective media
theory a) 5wt.% and b) 10wt.%

166
By adjusting the value of P, and using the raw data of epoxy matrix (1 and
1) and nanocomposites (T
and T
) at 100% RH and 25°C, the dielectric constant of
particle part in nanocomposites (the interfacial part is also included as the particle
part) at 25°C and 100% RH, can be calculated using equations 6.4 and 6.5. Under the
real condition, 2 > 0, 2
> 0, and the value of P should be chosen appropriately to
maintain this requirement.
Figure 6.14 shows, calculated real and imaginary dielectric constant at 25°C
and 100% RH for (a) 5wt.% nanoparticle system and (b) 10wt.% nanoparticle system
on the basis of equation 6.4 and 6.5. From Figure 6.14(a-b), it is possible to observe
QDC behavior for all possible values of P. At high temperatures, the nanoparticles are
surrounded by water shell and they behave similar to the epoxy matrix.
6.13 Ageing
Rowe [325] has proposed an “alternative scenario” for ageing of composite materials
in which the interfaces between the particles and the host material gradually weaken
as shown in Figure 6.15.
Figure 6.15. Representation of the “Alternative Ageing Scenario”, showing water
degraded, filler interfaces [325]
In this case, water may weaken the interfaces between the epoxy and silica.
Thus accumulation of water modifies the mechanical strength, the dielectric
properties and the electrical strength of these tiny regions [325]. Since this
degradation is diffused and occurs at all interfaces at the same time, it can be thought
of as ageing in the true sense [34]. Gradually a network of semi-interconnected
pathways builds up through the labyrinth of filler particles. If percolation through
these graded regions occurs, (Figure 6.15), an electrical pathway is formed and leads
to breakdown. This “alternative ageing scenario” for highly filled HV insulation is
fundamentally different from other concepts of ageing. In particular, the ageing
precursor is not dependent upon the electrical field, charge, etc. It is only after the
damage has been initiated by water, which is inevitably present, that electrical
degradation starts to occur [325].

167
6.14 Conclusions
In this work, the effect of water uptake on the dielectric properties of epoxy materials
has been studied. Both theoretical considerations and experimental results show that
some water content can exist in epoxy nano structures because of relatively larger free
volume.
i) The weight gain due to water absorption in samples increases in epoxy-ZnO
system as compared epoxy-SiO2/Al2O3 systems.
ii) The contact angle increases up to 10% in epoxy-SiO2/Al2O3 systems, but in
epoxy-ZnO systems it increases up to 15wt.%.
iii) Diffusion coefficient, free volume and breakdown strength show variations
with increase in filler loading in the case of epoxy-ZnO systems.
iv) Dielectric constant and tanδ show increase and glass transition temperature
decreases in epoxy-SiO2/Al2O3/ZnO nanocomposite systems due to water
absorption. Volume and surface resistivity show similar trends in variation due
to water absorption.
v) In particular electrical conductivity and dielectric loss increases while electric
strength shows a considerable decrease due to water absorption. The
difference in the electrical properties of the composites due to water
absorption can be associated directly to different filler morphological
characteristics like the nanoparticle aspect ratios.
vi) With increasing temperature, once the hydration in epoxy nanocomposites
reaches a certain level, the dielectric properties at the low frequencies will
transform into a quasi-dc/LFD process due to conduction process. This
phenomenon is explained by a "water shell" model, which assumes that a
water shell around nanoparticles provides a channel for charges.
vii) The dielectric behavior of epoxy composites are influenced by low
concentration of nanofillers. Thus small amount of fillers can be used to tailor
the properties of composites. However in epoxy composites, it is important to
control hydration in epoxy materials.
viii) The influence of water on the dielectric properties of epoxy composites can
be explained by "water shell" model. Experimental results show that nanofiller
water absorption leads to increase in dielectric constant and tanδ, on the other
hand, breakdown strength and resistivity shows reduction in the epoxy-
nanocomposites.
This investigation, aims at analyzing nanocomposites for proper selection of
filler for achieving desired modifications in electrical properties of nanocomposites,
in relation to its morphology and water absorption characteristics. This will aid the
design and manufacturing processes of nanostructured materials for optimization of
its performance.
Electrical insulation failures are invariably due to surface stresses leading to
wear and bulk stresses leading to mechanical breakdowns. The mechanical
characteristics of the nanocomposites are presented and discussed in Chapter 7.