EFFECT OF SALINE INTAKE ON OSMOTIC HOMEOSTASIS 'IN DUCKS
127
EFFECT OF SALINE INTAKE ON OSMOTIC HOMEOSTASIS 'IN DUCKS by DARIN CHRIS BENNETT B.Sc, The University of Gueiph, 1986 M.Sc, The University of British Columbia, 1993 A THESIS SUBMITTED IN PARTIAL FULHLLMENT OF THE REQUIREMENTS FOR THE DEGREE OF DOCTOR OF PHILOSOPHY in THE FACULTY OF GRADUATE STUDIES (Department of Zoology) We accept this thesis as conforming to the required standard THE UNIVERSITY OF BRITISH COLUMBIA July 2002 © Darin Chris Bennett, 2002
Transcript of EFFECT OF SALINE INTAKE ON OSMOTIC HOMEOSTASIS 'IN DUCKS
E F F E C T OF S A L I N E INTAKE O N OSMOTIC HOMEOSTASIS 'IN D U C K S
by
DARIN CHRIS B E N N E T T
B . S c , The University of Gueiph, 1986 M . S c , The University of British Columbia, 1993
A THESIS SUBMITTED IN PARTIAL F U L H L L M E N T OF
THE REQUIREMENTS FOR THE DEGREE OF
DOCTOR OF PHILOSOPHY
in
THE F A C U L T Y OF GRADUATE STUDIES
(Department of Zoology)
We accept this thesis as conforming to the required standard
THE UNIVERSITY O F BRITISH COLUMBIA
J u l y 2002
© Darin Chris Bennett, 2002
In presenting this thesis in partial fulfilment of the requirements for an advanced
degree at the University of British Columbia, I agree that the Library shall make it
freely available for reference and study. I further agree that permission for extensive
copying of this thesis for scholarly purposes may be granted by the head of my
department or by his or her representatives. It is understood that copying or
publication of this thesis for financial gain shall not be allowed without my written
permission.
Department
The University of British Columbia Vancouver, Canada
DE-6 (2/88)
A B S T R A C T
Salinity appears to be an important barrier to habitat selection by ducks, yet little is
known about the osmoregulatory abilities of ducks that use saline environments. This
thesis examines the physiological mechanisms by which ducks maintain osmotic balance
when exposed to saline. I first used domesticated Pekin ducks (Anas platyrhynchos) as a
model to identify the osmoregulatory traits that confer saline tolerance in ducks. I then
compared these in wi ld species selected to represent ducks that utilize freshwater,
estuarine and marine habitats: Mallards (Anasplatyrhynchos), Canvasbacks (Aythya
valisineria) and Barrow's Goldeneyes (Bucephala islandica), respectively. M y major
hypothesis is that among the three species of wi ld ducks, the ability to maintain osmotic
homeostasis during acclimation to saline, habitat affinity, and their ability to secrete
excess N a + are correlated.
When Pekin ducks were given increasing concentrations of saline to drink, they
maintained water and osmotic balance at salinities up to 300 m M N a C l by producing salt
gland secretion slightly higher than 300 m M N a + . This concentration is roughly half that
produced in response to intravenous saline infusion (500-600 m M Na + ) . When the three
species o f wi ld ducks were similarly acclimated to saline, Canvasbacks and Goldeneyes
were both more saline tolerant than Pekin ducks and maintained water balance at
salinities equivalent to full strength seawater. Mallards did not tolerate salinities greater
than 225 m M N a C l . Evaluation of the relationship between maximum saline tolerance
and maximum concentrating ability of the salt glands could not be tested because ducks
did not secrete spontaneously when handled.
Pekin ducks acclimated to 300 m M N a C l move extracellular water and N a + into the
cells, a mechanism that may be important to the ability to initiate salt gland secretion. I
then examined the relative roles of extracellular fluid volume and concentration in the
stimulation of salt gland secretion. Increases in extracellular fluid volume and
concentration worked interactively to stimulate salt gland secretion. Ducks with a small
initial extracellular fluid volume took longer to initiate salt gland secretion and secreted
less of the imposed saline load than ducks with a larger extracellular fluid volume. Initial
volume of extracellular fluid and its expansion in response to saline loading may be the
dominant determinants of the secretory response. The results obtained from the Pekin
duck experiments showed that redistribution of extracellular water and N a + might be
important in the control of salt gland secretion and in conferring tolerance to saline in
ducks. When wi ld ducks drank freshwater, total volume of body water did not differ
among the three species, but Goldeneyes, the most marine species, had the largest
extracellular fluid volume and was the only species that shifted water and N a + into the
cells in response to saline acclimation.
The last study examined kidney and salt gland functions by which wi ld ducks eliminate
excess N a + , but maintain water balance. I found that renal filtration was unaffected by
saline intake in any of the three species, but saline tolerance was determined by rates of
renal tubular water and N a + reabsorption and salt gland N a + secretion. Goldeneyes had the
highest rates of all these processes and were the only species that secreted all the infused
N a + via the salt glands. Mallards had lower rates, although saline acclimated Mallards
eliminated all the infused N a + by combined renal and extrarenal excretion. Canvasbacks
tolerated higher drinking water salinities than Mallards, even though their renal and
extrarenal N a + excretion rates during acute saline loading indicated they should not be able
to do so. This suggests osmoregulation in Canvasbacks may involve N a + and water
regulation at other sites, such as the gut. Postrenal modification of urine may play an
important role in conservation of water in Canvasback.

iv
T A B L E O F C O N T E N T S
Abstract jj
Table of Contents l v
List of Tables v j j i
List of Figures x i
Acknowledgements x i i
Preface vii i
Chapter 1. General Introduction 1
Aims of the thesis 3
Studies of Pekin ducks 4
Studies of wi ld ducks ' 5
Chapter 2. Effect of Saline Intake on Water Flux and Osmotic Homeostasis in
Pekin ducks (Anas platyrhynchos). 8
Preface 8
Introduction 8
Materials and methods 11
Experimental animals 11
Experimental procedures 11
Analytical methods 12
Statistics 13
Results 13
Sexual differences 13
Body mass, T B W and water flux 13
Blood status 15
Discussion 22
Sexual differences 22
Response to saline acclimation 22
Water flux 25
Chapter 3. Effect of saline acclimation on body water and sodium
compartmentalization in Pekin ducks (Anasplatyrhynchos). 30
Preface 30
Introduction 30
Materials and methods 31
Experimental animals 31
Experimental procedures 31
Statistics and calculations 33
Results 34
Blood composition and hormone concentrations 34
Water and sodium compartmentalization 34
Discussion 39
Chapter 4. Interaction of osmotic and volemic components in initiating salt gland
secretion in Pekin ducks. 43
Preface 43
Introduction 43
Materials and methods 44
Experimental animals 44
Experimental procedures 44
Analytical procedures 45
Calculations and statistics 45
Results 46
Male-female comparisons 46
Salt gland secretion 46
Discussion 52

vi
Chapter 5. Effect of saline intake on osmotic homeostasis in three species of wild
ducks. 55
Introduction 55
Materials and Methods 56
Experimental animals 56
Experimental procedures. 57
Experiment 1. Saline acclimation 57
Experiment 2. Body water and sodium
compartmentalization 57
Statistics 57
Results 58
Experiment 1. Response to saline acclimation 58
Body mass, T B W and water flux 58
Plasma 58
Urine 58
Salt gland secretion 59
Osmoregulatory hormones 59
Experiment 2. Body water and sodium
compartmentalization 59
Discussion 59
Response to saline acclimation 59
Body water compartmentalization 70

vi i
Chapter 6. Comparison of renal and salt gland function in three species of wi ld
ducks. 73
Introduction 73
Materials and Methods 74
Single injection technique 74
Constant infusion technique 74
Experimental animals 74
Experimental procedures 74
Calculations and statistics 75
Results 76
Single injection technique 76
Constant infusion technique 76
Plasma composition 76
Kidney function 81
Salt gland function 84
Discussion 87
Kidney function 87
Salt gland function 91
Chapter 7 General Discussion 93
Studies of Pekin ducks 93
Studies of wi ld ducks 94
Extracellular fluid volume 97
Salt gland and kidney function 97
Literature Cited 103

V l l l
L I S T O F T A B L E S
Table 2.1. Calculated water budget for Pekin ducks maintained on freshwater and saline. 27
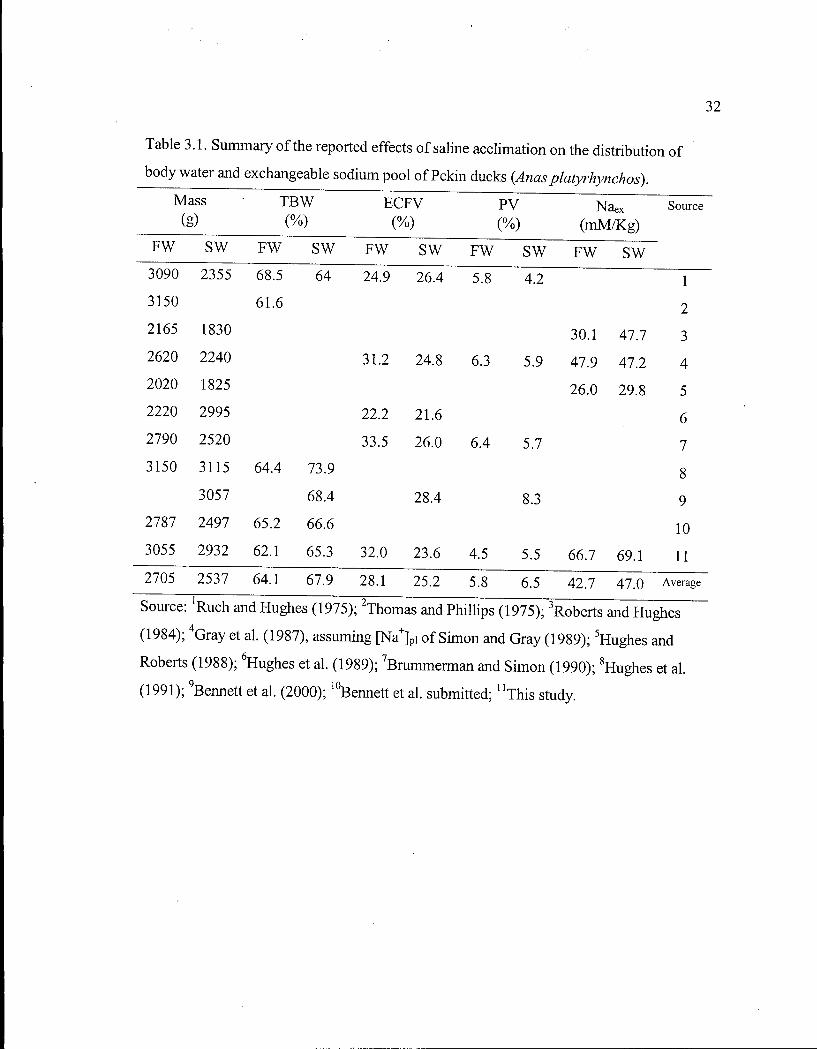
Table 3.1. Summary of the reported effects of saline acclimation on the distribution of body water and exchangeable sodium pool of Pekin ducks. 32
Table 3.2. Effect of saline acclimation on blood composition and hormone concentration of Pekin ducks. 35
Table 4.1. Plasma ionic concentrations in saline acclimated Pekin ducks before and after N a C l infusion. 47
Table 4.2. Plasma osmolality, relative plasma volume, and plasma concentrations of angiotensin II and arginine vasotocin in saline acclimated Pekin ducks before and after N a C l infusion. 48
Table 6.1. Glomerular filtration rate of freshwater and saline acclimated Mallards, Canvasbacks and Barrow's Goldeneyes. 77
Table 6.2. Salt gland secretion sodium concentration and flow rate o f freshwater and saline acclimated Mallards, Canvasbacks and Barrow's Goldeneyes. 86
Table 6.3. Glomerular filtration rate and effective renal plasma flow of birds with and without salt gland in relation to habitat. 88
Table 7.1. Total body water and extracellular fluid volume of various species of birds in relation to habitat type. 98

ix
L I S T O F F I G U R E S
Figure 1.1. Sodium concentration of plasma, urine, cloacal fluid and spontaneous salt gland secretions of Pekin ducks in relation to drinking water salinity. 2
Figure 2.1. Sodium concentration of urine and spontaneous salt gland secretion of Pekin ducks in relation to drinking water salinity. 9
Figure 2.2. Body mass, body water, water influx and water efflux of Pekin ducks in relation to drinking water salinity. 14
Figure 2.3. Plasma osmolality and relative plasma volume of Pekin ducks in relation to drinking water salinity. 16
Figure 2.4. Plasma concentrations of N a + , K + , and C l " of Pekin ducks in relation to drinking water salinity. 17
Figure 2.5. Plasma concentrations of angiotensin II, arginine vasotocin and atrial natriuretic peptide of Pekin ducks in relation to drinking water salinity. 18
Figure 2.6. Relationship between plasma arginine vasotocin and plasma osmolality during saline acclimation in Pekin ducks. 19
Figure 2.7. Relationship between plasma angiotensin II and relative plasma volume and plasma osmolality during saline acclimation in Pekin ducks. 20
Figure 2.8. Relationship between plasma atrial natriuretic peptide and relative plasma volume, total body water and water influx during saline acclimation in Pekin ducks. 21
Figure 3.1. Body mass in relation to drinking water salinity during saline acclimation in Pekin ducks. 36
Figure 3.2. Total volume of body water and its distribution between the extracellular and the intracellular compartments in relation to drinking water salinity during saline acclimation in Pekin ducks. 37
Figure 3.3. Volume of interstitial fluid and plasma in relation to drinking water salinity during saline acclimation in Pekin ducks. 38

X
Figure 3.4. Size of exchangeable sodium pool and its distribution between the extracellular and intracellular compartments in relation to drinking water salinity during saline acclimation in Pekin ducks. 40
Figure 4.1. Correlation between the increase in plasma ion concentrations at the start of salt gland secretion and their preinfusion values in saline-acclimated male and female Pekin ducks.. 49
Figure 4.2. Plasma osmolality as a function of relative plasma volume in saline acclimated males and female Pekin ducks. 50
Figure 4.3. Relationship of time to secrete, volume of secretion, and total amount of N a and K secreted to preinfusion relative plasma volume in saline acclimated males and female Pekin. 51
Figure 5.1. Body mass and total body water of male and female Mallards, Canvasbacks and Barrow's Goldeneyes in relation to drinking water salinity. 60
Figure 5.2. Water flux o f male and female Mallards, Canvasbacks and Barrow's Goldeneyes in relation to drinking water salinity. 61
Figure 5.3. Relative plasma volume of Mallards, Canvasbacks and Barrow's Goldeneyes in relation to drinking water salinity. 62
Figure 5.4. Plasma and urine osmolality and their ratio of Mallards, Canvasbacks and Barrow's Goldeneyes in relation to drinking water salinity. 63
Figure 5.5. Plasma and urine sodium concentration and their ratio of Mallards, Canvasbacks and Barrow's Goldeneyes in relation to drinking water salinity.
64 Figure 5.6. Plasma and urine potassium concentration and their ratio of Mallards,
Canvasbacks and Barrow's Goldeneyes in relation to drinking water salinity. 65
Figure 5.7. Plasma concentrations of A V T and A l l of Mallards, Canvasbacks and Barrow's Goldeneyes in relation to drinking water salinity. 66
Figure 5.8. Comparison of total body water volume and extracellular fluid volume of freshwater and saline acclimated Mallards, Canvasbacks and Barrow's Goldeneyes in relation to saline treatment. 67
x i
Figure 5.9. Comparison of total exchangeable sodium pool and extracellular sodium pool of freshwater and saline acclimated Mallards, Canvasbacks and Barrow's Goldeneyes in relation to saline treatment.
68
Figure 6.1. Effect o f hypotonic and hypertonic saline infusion on plasma and urine osmolality and their ratio of freshwater and saline acclimated Mallards, Canvasbacks and Barrow's Goldeneyes. 78
Figure 6.2. Effect of hypotonic and hypertonic saline infusion on plasma and urine sodium concentration and their ratio of freshwater and saline acclimated Mallards, Canvasbacks and Barrow's Goldeneyes. 79
Figure 6.3. Effect of hypotonic and hypertonic saline infusion on plasma and urine potassium concentration and their ratio of freshwater and saline acclimated Mallards, Canvasbacks and Barrow's Goldeneyes. 80
Figure 6.4. Effect of hypotonic and hypertonic saline infusion on effective renal plasma flow, glomerular flow rate and urine flow rate of freshwater and saline acclimated Mallards, Canvasbacks and Barrow's Goldeneyes. 82
Figure 6.5. Effect of hypotonic and hypertonic saline infusion on the fractional reabsorption of water, sodium and potassium of freshwater and saline acclimated Mallards, Canvasbacks and Barrow's Goldeneyes. 83
Figure 6.6. Relationship between urine flow rate and glomerular filtration rate and the fractional reabsorption of water of freshwater and saline acclimated Mallards, Canvasbacks and Barrow's Goldeneyes. 85
Figure 7.1. Comparison of extracellular fluid volume of freshwater and saline acclimated Mallards, Pekin ducks, Canvasbacks and Barrow's Goldeneyes. 96
Figure 7.2. Comparison of extracellular fluid volume of birds in relation to habitat. 99
Figure 7.3. Comparison of glomerular filtration rate of birds with salt glands from freshwater and marine habitats. 101

X l l
A C K N O W L E D G M E N T S
I would like to express my appreciation to my supervisor Dr. Maryarme Hughes for
her guidance, encouragement and friendship. I also wish to thank my supervisory
committee, Drs. Lee Gass, John Gosline, Peter Hochachka, and George Iwama. I would
especially like to thank Dr. David Gray for conducting the hormone assays, and for his
warm hospitality when I visited South Africa.
I have benefited from help and friendship from many individuals during this project. I
thank Arthur Van der Horst, Sam Gopaul, and Andy Jeffries for animal care, Elsje Alblas,
Anne Ching, Cristina De Sabrino, David Kojwang, Jeff N g , Stephanie Olson, Terry
Sullivan, and numerous high school students who participated in many of the experiments
conducted in this thesis.
I thank my Karate family for their friendship and support. I thank George, Marilyn,
Adam, Daniel, and Sami Iwama, Qiioc Phung, Eva Ziduliak, Koyabu-sensei, Claudio
Lerner, Paige Ackerman, Jesus Calvino-Fraga, Brenda Guild, M i k e Kishimoto, Dan
McCal lum, John McKin l ey and especially Misako Yoneyama.
I especially thank my family for their support, assistance and understanding throughout
the entire study.
Financial support for this research was provided from the Natural Sciences and
Engineering Research Council of Canada (MRH) .
1
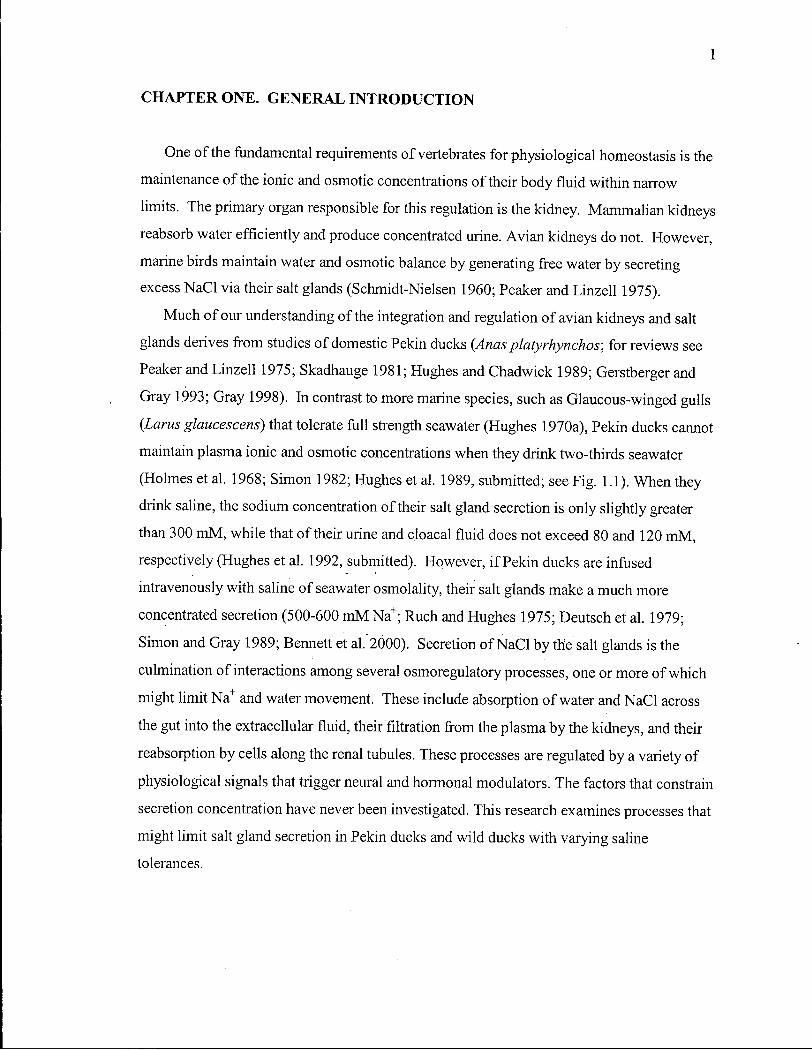
CHAPTER ONE. GENERAL INTRODUCTION
One of the fundamental requirements of vertebrates for physiological homeostasis is the
maintenance of the ionic and osmotic concentrations of their body fluid within narrow
limits. The primary organ responsible for this regulation is the kidney. Mammalian kidneys
reabsorb water efficiently and produce concentrated urine. Avian kidneys do not. However,
marine birds maintain water and osmotic balance by generating free water by secreting
excess N a C l via their salt glands (Schmidt-Nielsen 1960; Peaker and Linzell 1975).
Much of our understanding of the integration and regulation of avian kidneys and salt
glands derives from studies of domestic Pekin ducks (Anas platyrhynchos; for reviews see
Peaker and Linzell 1975; Skadhauge 1981; Hughes and Chadwick 1989; Gerstberger and
Gray 1993; Gray 1998). In contrast to more marine species, such as Glaucous-winged gulls
(Larus glaucescens) that tolerate full strength seawater (Hughes 1970a), Pekin ducks cannot
maintain plasma ionic and osmotic concentrations when they drink two-thirds seawater
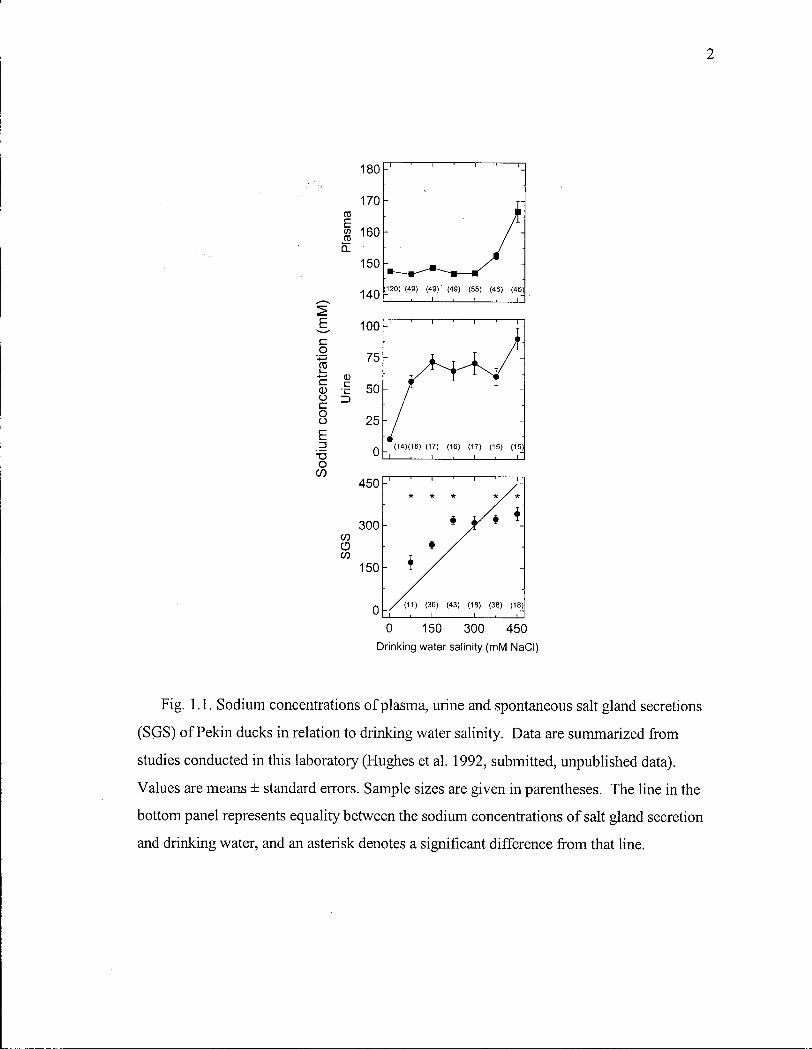
(Holmes et al. 1968; Simon 1982; Hughes et al. 1989, submitted; see Fig. 1.1). When they
drink saline, the sodium concentration of their salt gland secretion is only slightly greater
than 300 m M , while that of their urine and cloacal fluid does not exceed 80 and 120 m M ,
respectively (Hughes et al. 1992, submitted). However, i f Pekin ducks are infused
intravenously with saline of seawater osmolality, their salt glands make a much more
concentrated secretion (500-600 m M N a + ; Ruch and Hughes 1975; Deutsch et al. 1979;
Simon and Gray 1989; Bennett et al. 2000). Secretion of N a C l by the salt glands is the
culmination of interactions among several osmoregulatory processes, one or more of which
might limit N a + and water movement. These include absorption o f water and N a C l across
the gut into the extracellular fluid, their filtration from the plasma by the kidneys, and their
reabsorption by cells along the renal tubules. These processes are regulated by a variety of
physiological signals that trigger neural and hormonal modulators. The factors that constrain
secretion concentration have never been investigated. This research examines processes that
might limit salt gland secretion in Pekin ducks and wild ducks with varying saline
tolerances.
2
Fig. 1.1. Sodium concentrations of plasma, urine and spontaneous salt gland secretions
(SGS) of Pekin ducks in relation to drinking water salinity. Data are summarized from
studies conducted in this laboratory (Hughes et al. 1992, submitted, unpublished data).
Values are means ± standard errors. Sample sizes are given in parentheses. The line in the
bottom panel represents equality between the sodium concentrations of salt gland secretion
and drinking water, and an asterisk denotes a significant difference from that line.
3
Species of ducks differ in their use of saline habitats. This presumably reflects that the
salt content of some habitats exceeds their osmoregulatory capacities (Nystrom and
Pehrsson 1988). The capacity to secrete excess N a C l extra-renally has been correlated with
habitat choice in Charadriiform birds (Stalland 1967, 1968). However, whether salinity
tolerance of ducks reflects only salt gland concentrating capacity or is constrained by the
uptake of N a C l in the gut and/or kidneys is not known.
Aims of the thesis
In this thesis I describe the mechanisms by which ducks maintain osmotic homeostasis
during acclimation to saline (saline tolerance). I first examined Pekin ducks to gain a general
understanding of the mechanisms involved in saline acclimation in ducks (Chapters 2-4).
Then I examined adaptations of these osmoregulatory traits that allow some species of ducks
to exploit a marine environment and limit other species to freshwater or estuarine
environments (Chapters 5 and 6).
Most osmoregulatory studies in ducks have been primarily concerned with the
mechanisms that regulate salt gland and/or kidney function (see reviews by Skadhauge
1981; Hughes and Chadwick 1989; Gerstberger and Gray 1993; Gray 1998; Goldstein and
Skadhauge 2000). Typically to study these functions, ducks are intravenously infused with a
hypertonic saline solution, and the osmoregulatory response of the system of interest is
examined. In contrast, in this laboratory, studies examined responses of ducks in which the
saline load is self-imposed (Hughes et al. 1989, 1992, submitted; Zenteno-Savin 1990).
Since each duck acquires its salt load by drinking, it can adjust its own salt intake. Our
basic protocol is to increase the salinity of the drinking water incrementally and to measure
the osmotic responses after each increase. The responses should reflect the integration of all
the organ systems involved.
The acute salt loading and gradual salt loading methods provide different pictures of the
osmoregulatory abilities of ducks. Infused salt loads maximise the response of the kidneys
and salt glands, but bypass any gut regulation. When ducks are allowed to drink saline,
osmotic responses are regulated by the interactions of all three organs systems. Together
both approaches yield information needed to more fully understand the osmoregulatory
capacities of ducks. In this thesis, I use both approaches.

4
I now outline the rationale and briefly summarize the major finding of each portion of
the thesis. Further details on the background and rationale of each experiment are given in
the chapter introductions.
Studies of Pekin ducks. I first examined the osmoregulatory response of Pekin ducks
to saline intake, describing water flux, plasma volume and concentration and their hormonal
regulators (Chapter 2), then the effect of saline intake on the distribution of water and N a +
among the fluid compartments (Chapter 3) and finally, the relationship between
extracellular fluid volume and concentration as stimuli for salt gland secretion (Chapter 4).
Chapter 2. As outlined above, Pekin ducks cannot produce sufficient free water to
maintain plasma ionic and osmotic concentrations when they drink two-thirds seawater
(Holmes et al. 1968; Simon 1982; Hughes et al. 1989, submitted) because their salt gland
secretion is only slightly more concentrated than 300 m M N a + (Hughes et al. 1992,
submitted; Fig. 1.1). Increasing drinking water salinity of Pekin ducks from freshwater to
300 m M N a C l increases water flux by 70% (Hughes et al. 1991), suggesting that, as the
difference between drinking water and SGS concentrations diminishes (Fig. 1.1), drinking
rate increases to enhance free water production. To date, no comprehensive water balance
study had been conducted during saline acclimation to test this hypothesis.
I slowly acclimated ducks to increasingly saline drinking water (Hughes et al. 1989,
1992, submitted) and at the end of each increment measured several osmoregulatory
variables. These include those that are homeostatically regulated (body water volume,
plasma osmolality and ion concentrations) and those that achieve this regulation (water flux,
plasma hormone concentrations) (Goldstein 1997, 1999). I hypothesized that Pekin ducks
gradually increase water influx until they drink 300 m M N a C l , and decrease water efflux at
higher salinities. However, results did not support my hypothesis. Pekin ducks did not
increase drinking, but maintained water influx and the total volume of their body water, until
the concentration of their drinking water exceeded that of their salt gland secretions (300
m M NaCl). A t higher salinities, they decreased drinking and used body water to get rid of
the excess salt.
Chapter 3. I found that Pekin ducks maintained total volume of body water when
drinking 300 m M N a C l , a concentration previously shown to decrease extracellular fluid
5
volume (Gray et al. 1987; Bmmmermann and Simon 1990). I hypothesised that the
decrease in extracellular fluid volume is due to a redistribution of water from the
extracellular fluid into the intracellular fluid. To test this hypothesis, I measured the total
volume of body water and its compartmentalization in individual Pekin ducks drinking
freshwater and after sequential acclimation to 300 m M and 400 m M N a C l . I found that
Pekin ducks drinking high, but tolerable salinities, maintain total volume of body water, but
redistribute N a + and water from interstitial fluid to the intracellular fluid compartment. This
supports my hypothesis. When stressed beyond their ability to maintain total body water
(400 m M NaCl) , they lose water from the intracellular fluid.
Chapter 4. Imbibed water and N a C l are absorbed across the gut and equilibrate within
the extracellular fluid. These increases in extracellular fluid volume and concentration are
the driving forces for initiating salt gland secretion (Hughes 1989b). However, in the
absence of extracellular fluid volume expansion, increased extracellular fluid concentration
is not sufficient to stimulate salt gland secretion in Pekin ducks (Hughes 1989a).
Extracellular fluid volume and concentration are inversely related in ducks secreting in
response to intravenous saline infusion (Kaul and Hammel 1979; Hammel et al. 1980).
Despite the importance of their role in the control of salt gland function, the relative
contributions of extracellular fluid volume and concentration have not been clearly
described. I hypothesised that the initial volume of extracellular fluid and its expansion in
response to saline loading are the dominant determinants of salt gland secretion. I found that
ducks with a small initial extracellular fluid volume took longer to initiate salt gland
secretion and secreted less of the imposed saline load than ducks with a larger extracellular
fluid volume, thus supporting my hypothesis. However, my results further suggest that
extracellular fluid volume and concentration work interactively to stimulate salt gland
secretion.
Studies of wild ducks. In the second portion o f this thesis (Chapters 5,6), I compared
the effect of saline intake on osmotic homeostasis of three species of wi ld ducks chosen
to represent different habitat affinities and diet: Mallards (tribe Anatini, Anas
platyrhynchos), Canvasbacks (tribe Aythyini, Aythya valisineria) and Barrow's
Goldeneyes (tribe Mergini , Bucephala islandica). Mallards occupy freshwater or

6
terrestrial habitats, but may winter along the coast in estuaries. They are omnivorous,
eating variable amounts of terrestrial and aquatic plants and invertebrates. Previous
studies have shown that they are less saline tolerant than Pekin ducks (Schmidt-Nielsen
and K i m 1964). Canvasbacks winter along the coast, on brackish lagoons and estuaries.
Their diet consists of a variety of aquatic plants and invertebrates. Barrow's Goldeneyes
(hereafter Goldeneyes) winter mostly along coasts, on estuaries and saltwater bays. Their
diet consists mainly of molluscs and crustaceans.
I tested the hypothesis that the ability to maintain osmotic homeostasis during
acclimation to saline (saline tolerance) varies among the three species of ducks and is
correlated with habitat affinity. Specifically, marine Goldeneyes maintain osmotic balance
at higher drinking water salinities than freshwater Mallards, while estuarine Canvasbacks
have an intermediate saline tolerance. I ask two basic questions. First, what is the maximum
salinity these three species of ducks can drink and remain in osmotic balance? Second, what
osmoregulatory traits or adaptations allow Goldeneyes to exploit a marine environment and
limit Mallards to a freshwater or estuarine environment? To answer these questions, I first
examined the osmoregulatory response of all three species of ducks to saline intake,
describing water flux, plasma volume and concentration and their hormonal regulators and
then the effect of saline intake on the distribution of water and N a + among the fluid
compartments (Chapter 5), and finally, the interaction between kidney and salt gland
function in maintaining water and salt balance (Chapter 6).
Chapter 5 . I slowly acclimated all three species to increasing concentrations of saline
drinking water and measured several osmoregulatory variables, as was done for Pekin ducks
(Chapter 2). Both Canvasbacks and Goldeneyes maintained water balance at all drinking
water salinities tested, but Mallards lost body water when they drank 225 m M NaCl . This
supports my hypothesis that Goldeneyes maintain osmotic balance at higher drinking water
salinities than freshwater Mallards, but not that Canvasbacks have an intermediate saline
tolerance. I had predicted that the concentrating ability of the salt glands of each species
would determine the salinity of water they can tolerate, as was shown for Pekin ducks
(Chapter 2), but was unable to test this because ducks did not secrete when handled. Based
on the results obtained for of Pekin ducks (Chapter 3), I also predicted that, as drinking
water salinity increases, body water and N a + shift from the extracellular to the intracellular

7
compartment. When all ducks drank freshwater, Goldeneyes had a similar total body water
volume, but a larger extracellular fluid volume, than either Canvasbacks or Mallards. When
they drink saline, only Goldeneyes redistributed water and N a + from the extracellular and
into the intracellular compartment.
Chapter 6. In this chapter I explore three of the principal osmoregulatory processes by
which wild ducks eliminate excess N a + , but maintain water balance. These are: filtration of
N a + and water from the plasma by the kidneys, reabsorption of filtered water and N a + by
cells along the renal tubules, and secretion of N a + by the salt glands.
Goldeneyes, the most marine species, had the highest rates of filtration, fractional
reabsorption of water and N a + , and salt gland N a + excretion, and was the only species that
secreted all the infused salt via the salt glands. Rates of these processes were all lower in
Mallards, the most freshwater species. However, their higher urine volume and N a +
concentration, coupled with extrarenal N a + secretion enabled saline acclimated Mallards
to eliminate all the infused N a + . Canvasbacks tolerated higher drinking water salinities
than Mallards (Chapter 5), although their measured renal and extrarenal N a C l excretion
(Chapter 6) did not account for all the imbibed N a + (chapter 5). Comparison of studies of
imbibed (Chapter 5) and infused (Chapter 6) saline suggests the possibility that the gut
plays an important role in the osmotic balance of ducks, particularly in Canvasback.
In Chapter 7,1 discuss and integrate the main findings of the thesis and identify some
areas for future research.

8
CHAPTER TWO. EFFECT OF SALINE INTAKE ON WATER FLUX AND
OSMOTIC HOMEOSTASIS IN PEKIN DUCKS (ANAS PLATYRHYNCHOS).
PREFACE
This chapter is adapted from a paper submitted as Bennett D C , Gray D A , Hughes M R .
Effect of saline intake on water flux and osmotic homeostasis in Pekin ducks (Anas
platyrhynchos). J Comp Physiol B . (submitted December 2001). I was responsible for data
collection, analysis and presentation. David Gray measured the hormones. Both co-authors
provided guidance and editorial advice.
INTRODUCTION
The cephalic salt glands of marine birds secrete excess ingested N a C l in less water than
was imbibed with it (Schmidt-Nielsen 1960). This process generates osmotically free water
that remains in the body (Schmidt-Nielsen 1960). Birds with salt glands have similar total
body water (TBW), but twice the water flux, of birds that lack salt glands (Hughes et al.
1987). Drinking water salinity does not affect drinking rate of species that produce highly
concentrated salt gland secretion (SGS; Harriman 1967; Walter and Hughes 1978). These
birds become dehydrated only when they drink water more concentrated than their SGS.
Pekin ducks, Anas platyrhynchos, have functional salt glands. Their water flux, when
they drink freshwater (Thomas and Phillips 1975; Hughes et al. 1991), is twice that
predicted allometrically for seabirds (Hughes et al. 1987; Nagy and Peterson 1988). Water
intake (Fletcher and Holmes 1968) accounts for 94% of this water flux. A s the salinity of
their drinking water gradually increases, they make SGS only slightly more concentrated
than drinking water (Hughes et al. 1992, submitted), and their urine becomes more
concentrated but its sodium concentration does not exceed 100 m M (Hughes et al.
submitted) (Fig. 2.1). Consequently they gain no free water renally and little free water by
SGS. When drinking water salinity reaches 300 m M N a C l , SGS and drinking water

9
Fig. 2.1. Sodium concentrations of urine (top panel) and spontaneous salt gland secretion
(bottom panel) of Pekin ducks in relation to drinking water salinity. Urine data from Hughes
et al. (submitted) and SGS data from Hughes et al. (1992, submitted). Values are means ±
standard errors. Sample sizes are given in parentheses. In the bottom panel, the line
represents equality between the sodium concentrations of SGS and drinking water salinity,
and an asterisk denotes a significant difference from that line.

10
concentrations do not differ (Hughes et al.1992, submitted) and the ducks gain no free water
from SGS. After their drinking water salinity was increased from freshwater to 300 m M
NaCl , Pekin ducks increased water flux by 70% (Hughes et al. 1991). This suggests that, as
the difference between drinking water and SGS concentrations diminishes, Pekin ducks
drink more to enhance free water production by their salt glands.
Based on these observations, I hypothesized that Pekin ducks gradually increase water
influx until they drink 300 m M NaCl , and decrease water efflux at higher salinities. To test
this hypothesis, I measured body mass, T B W and water flux (both influx and efflux) in
ducks drinking freshwater and during each of the six subsequent weeks during which their
drinking water salinity gradually increased to 450 m M N a C l in equal increments. Based on
the results of this and other studies from this laboratory, I constructed a water budget to
assess the contributions of the various avenues by which Pekin ducks gain (influx) and lose
(efflux) of water.
Body water volume and composition are regulated by several physiological mechanisms
that include two classes of variables: those that are homeostatically regulated (total body
water, hematocrit, plasma osmolality and ion concentrations) and those that achieve this
regulation (water flux, plasma hormone concentrations) (Goldstein 1997, 1999; Goldstein
and Bradshaw 1998). Deviation in a regulating variable implies an adjustment to maintain
homeostasis, whereas deviation in a regulated variable may imply a demand on the system
(Goldstein 1997). Goldstein (1999) advocated both types of variables be measured in order
to define periods of physiological stress and better understand how a species tolerates
various and varying environments. I used this approach to better describe the relationship
between water flux, the complex of homeostatically maintained parameters, and their
regulators. A l l variables were measured at the end of each increment in saline drinking
water during the entire saline acclimation. Using continuous two-phase linear regression
(Nickerson et al. 1989), I generated, for each variable, a pair of intersecting linear models to
describe its relationship to drinking water salinity. The first phase describes the initial
period of saline acclimation, when the variable is maintained around some homeostatic set
point; the second phase describes the subsequent period, when it is not. I hypothesized that

11
regulating variables begin to deviate at lower salinities than regulated variables and body
water increases in concentration before it decreases in volume. Both sexes were included in
this study, since male and female ducks differ in kidney size (Hughes et al. 1995),
glomerular filtration rate (Hughes et al. 1989), postrenal urine modification (Hughes et al.
1999), and saline tolerance (Hughes et al. 1992).
M A T E R I A L S A N D M E T H O D S
Experimental animals. Twelve adult Pekin ducks (Anas platyrhynchos) were held in
large partially covered outdoor enclosures at the University of British Columbia Animal
Care Facility. They drank freshwater and ate duck maintenance pellets (Buckerfield's,
Abbottsford, B . C . ; 12.7% water, 17% protein, 2750 kcal/kg, and [Na +], [ K + ] , and [CF] 83,
153.5 and 99 mmol/kg, respectively; Bennett et al. 2000) ad libitum. Drinking water was
presented in 70 L plastic wading pools and was replenished twice daily. For four weeks
prior to the experiment, ducks were repeatedly caught, weighed, and bled to obtain groups
of compatible birds and to accustom the ducks to the experimental procedures.
Experimental procedures. A l l ducks drank freshwater during the first week of the
experiment. Then half were acclimated to 450 m M N a C l (SW) in six equal weekly
increments (Hughes et al. 1992), while the other half continued to drink freshwater (FW).
Both groups contained three male and three female ducks. Initially, at the end of week on
freshwater, and at the end of each subsequent saline increment, ducks were fasted overnight
with free access to drinking water. Water was removed for 1 h before the bird was weighed.
Blood for determination of background 3 H activity was collected from the median
metatarsal vein and then 10 uCi H2O (in 0.7 mL) were injected in a wing vein. Load
volume was determined gravimetrically. Ducks were returned to their enclosures (without
water) and blood was taken after a minimum of 1 h. Drinking water was replaced. Blood
was also taken 2, 5, and 7 days post-injection, after an overnight fast and with access to
water. A l l blood samples were 1 mL, except on day 7, when an additional 4 m L were taken
for determination of plasma concentrations of ions and osmoregulatory hormones. Ducks

12
were sampled alternately from, and randomly within, groups.
Analytical methods. Triplicate microhematocrit tubes were immediately filled from
each blood sample and centrifuged with it for 3 min at 15,600 x g. The plasma was stored
at -20°C until assayed. Plasma and injectate 3 H concentrations were determined using a
Beckman L S 9000 liquid scintillation counter. Plasma [3H20] of each duck was corrected
to body water [3H20] by dividing by the percentage water in the plasma (established by
weight loss of plasma aliquants dried to constant weight at 98°C). T B W (mL) was
determined at the beginning and end of each increment and was calculated by dividing total 3 H20 injected (dpm) by body water [3H20] at time of injection (the antilogarithm of the y
intercept of the line regressing natural logarithm of body water [ H2O] on time post-
injection). Water turnover (mL- d"1) was determined using equations from Nagy and Costa
(1980) assuming any change in T B W during the measurement period was linear. Plasma
sodium and potassium concentration ([Na+] pi and [ K + ] p i , respectively) were determined by
cesium internal standard flame photometry (Model 943, Instrumentation Laboratory S.p.A,
Milano, Italy); plasma chloride concentration ([Cl"]pi) by electrimetric titration (Buchler
digital chloridometer; Searle Buchler Instruments, Fort Lee, N J , U S A ) ; and plasma
osmolality (Osm pi) by vapor pressure osmometry (Model 5500; Wescor Inc., Logan U T ,
U S A ) .
Blood for hormone radioimmunoassays was immediately transferred into a chilled
Vacutainer tube (Becton-Dickinson, Mississauga, O N , Canada) containing 0.07 m L 15% K -
E D T A and 0.014 mg K-sorbate and kept in an ice bath until centrifuged at 4°C for 10 min at
3,000 x g. Each plasma sample was transferred into a clean 1.5 m L centrifuge tube
containing 100 uX 0.025 M 0-phenanthroline, an inhibitor of angiotensin converting
enzyme (Dusterdieck and McElwee 1971) and stored at -20°C until extracted, using a single
Sep-Pak C-18 cartridge (Waters Chromotography Division Mill ipore Corporation, Milford
M A ) following a method adapted by Raveendran (1987) and Zenteno-Savin (1991) from
Hartter (1986). Eluates were dried under nitrogen and assayed for arginine vasotocin
( [AVT ] p i , Gray and Simon 1983), angiotensin JJ ([AJJ]pi, Gray and Simon 1985) and atrial
natriuretic peptide ([ANP] p i , Gray et al. 1991).

Statistics. Data are reported as means ± standard errors and analyzed statistically using
S Y S T A T 9 for Windows (SPSS Science, Chicago, IL). Relative plasma volume (RPV) is
100 - hematocrit (%). At the end of the initial week, when all ducks drank freshwater, birds
that were to remain on freshwater were compared to ducks that were to be acclimated to
saline using two-way A N O V A with treatment (FW, SW) and sex as main effects.
Subsequent effects of saline acclimation and sex were assessed by repeated measures
A N O V A . I used continuous two-phase linear regression (Nickerson et al. 1989) to relate
each variable (body mass, T B W , water influx, Osm pi, [ A V T ] p i , [AJJJpi, and [ A N P ] p i ) to
drinking water salinity to determine the salinity at which each variable diverged from its
homeostatic set point (threshold salinity) in individual ducks. This was implemented using
the N O N L I N module of S Y S T A T 9 for Windows. Threshold salinities of different
variables were then compared using repeated measures A N O V A with contrasts.
Relationships among variables were determined using simple correlation.
R E S U L T S
Sexual differences. There were no significant sex-related differences in either F W or
S W ducks at any stage of the experiment. Treatment means are presented in figures.
Body mass, T B W and water flux. During the first week, when all ducks drank
freshwater, body mass of ducks that were to continue to drink freshwater did not differ from
that of ducks to be saline acclimated. Ducks that continued on freshwater tended to have a
larger T B W (P = 0.09) and had greater absolute water influx (P = 0.02) and efflux (P =
0.04; Fig. 2.2). When S W ducks drank 75 m M NaCl , both their water influx and efflux
increased significantly (P = 0.001 and P = 0.03, respectively), but these were unaltered in
F W ducks. Thereafter, flux values of F W and S W ducks did not differ. Continuous two-
phase linear regression suggests SW ducks begin to decrease body mass, water influx, and
T B W at drinking water salinities of 288 ± 23, 329 ± 15 and 335 ± 30 m M N a C l ,
respectively.

14
1200r-
4 5 0
Dr ink ing w a t e r sa l in i ty ( m M N a C l )
Fig. 2.2. Body mass, body water, water influx and water efflux o f Pekin ducks in relation to
drinking water salinity. Open and filled circles represent freshwater ducks and saline
acclimated ducks, respectively. Values are means ± standard errors. Asterisks indicate that
values for ducks drinking freshwater and ducks drinking saline are significantly different
(PO.05).

1 5
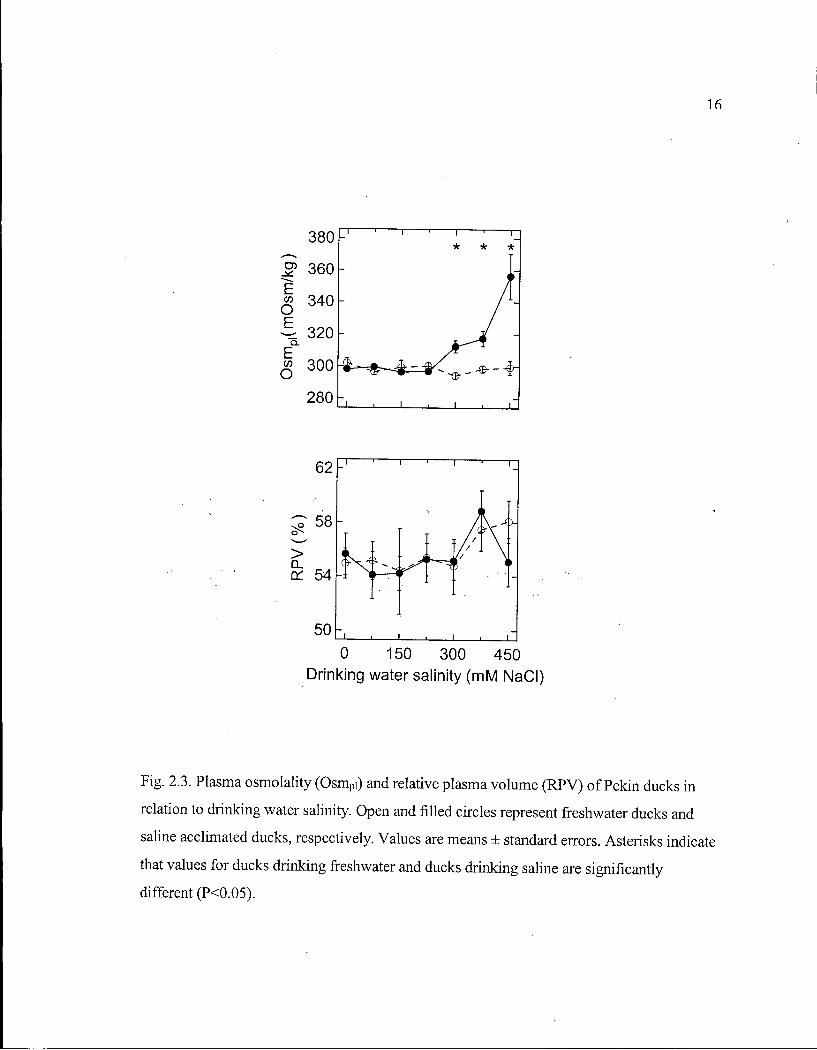
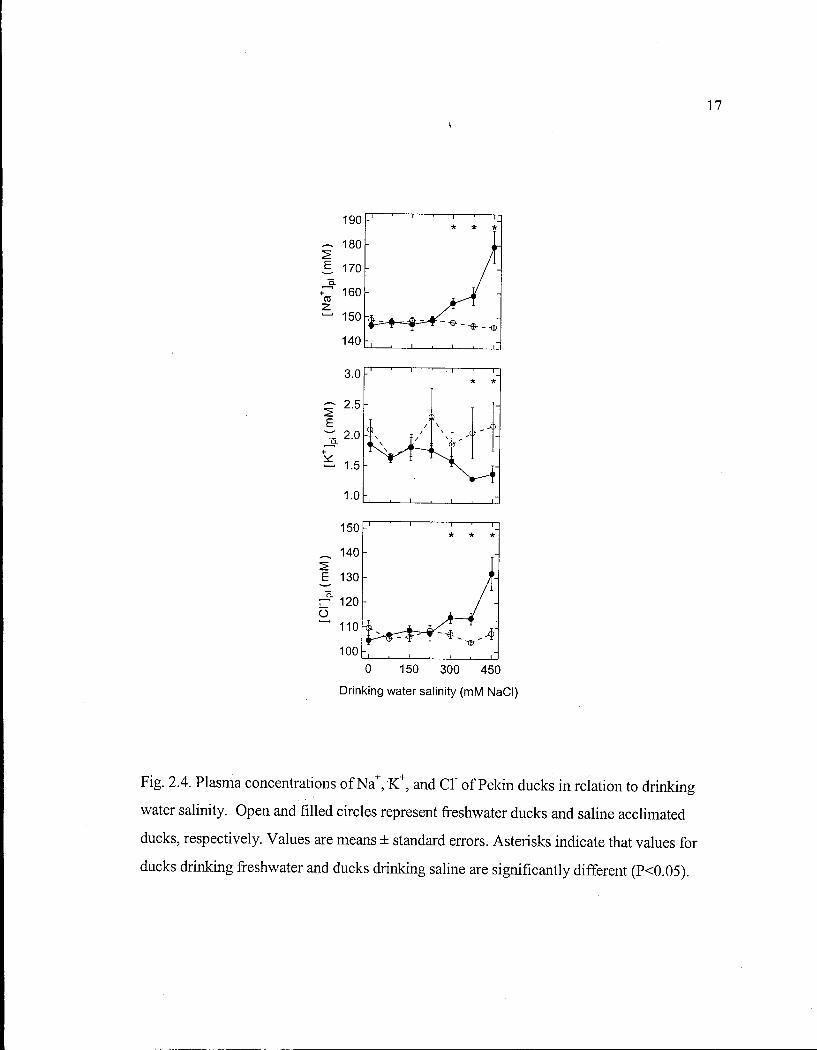
Blood status. During the initial week, when all ducks drank freshwater, Osm pi, R P V
(Fig. 2.3), and plasma ion (Fig. 2.4) and hormone (Fig. 2.5) concentrations did not differ
between the control and experimental groups. Subsequent acclimation to saline did not
affect Osm pi , [Na + ] p i or [CT] pi until they increased after S W ducks drank 300 m M N a C l
(Fig. 2.3, 2.4). [ K + ] p i did not differ between F W and S W ducks, until it decreased after S W
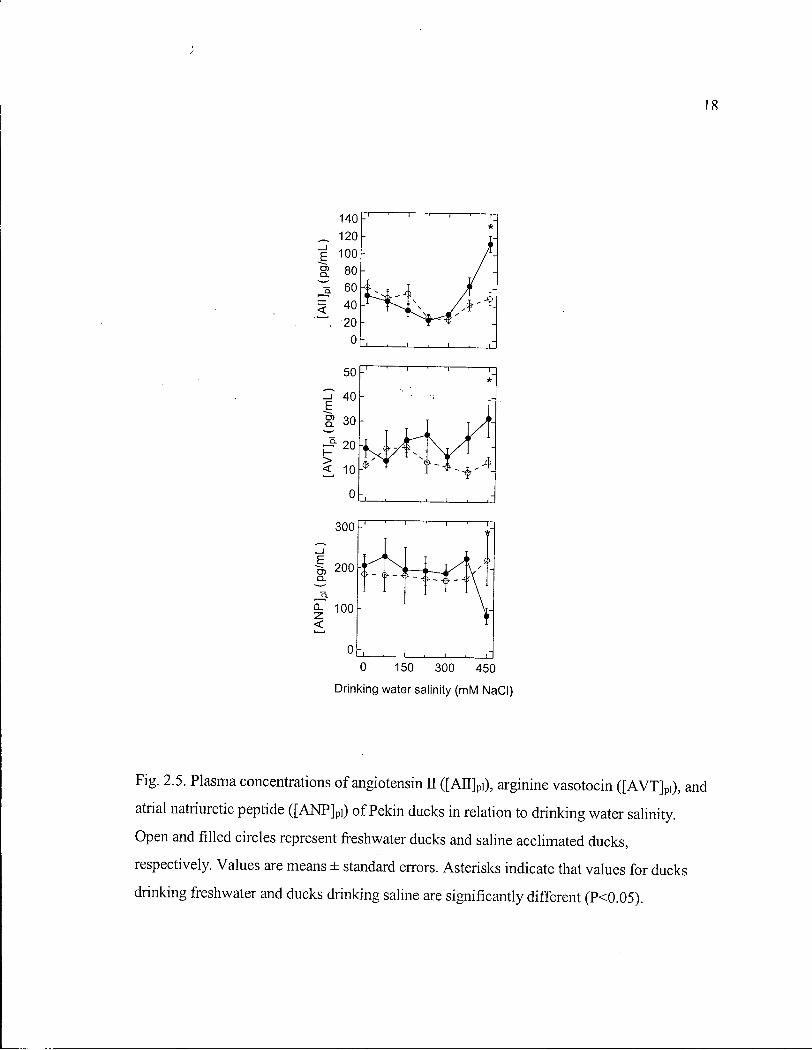
ducks drank 450 m M N a C l (Fig. 2.4). [ A V T ] p i was not affected by saline acclimation until
it tended (P=0.07) to increase in S W ducks after they drank 375 m M N a C l . The increase
was significant after S W ducks drank 450 m M N a C l (Fig. 2.5). [AJTJpi declined in both F W
and S W ducks during the first weeks and was significantly lower than initial values after
S W ducks drank 225 m M N a C l (P = 0.002) and 300 m M N a C l (P = 0.01). After that [AJTJpi
increased in S W ducks, until it became significantly higher (P=0.0004) than that of F W
ducks, after they drank 450 m M N a C l (Fig. 2.5). [ANP ] p i was unaffected by saline
acclimation until it decreased after S W ducks drank 450 m M N a C l (Fig. 2.5).
Continuous two-phase linear regression suggests S W ducks begin to increase Osm pi and
[AJTJpi, and to decrease [ANP] p i at drinking water salinities of 254 ± 17, 283 ± 20 and 330 ±
46 m M NaCl , respectively. Because both R P V (Fig. 2.3) and [ A V T ] p i (Fig. 2.5) varied so
much during saline acclimation, threshold salinities at which they deviate could not be
determined (Fig. 2.3, 2.5).
[ A V T ] p i and Osm p i were not significantly correlated among F W ducks or S W ducks
drinking less than 375 m M N a C l (Fig. 2.6). The correlation was significant only when
values for S W ducks drinking 375 and 450 m M N a C l were included (Fig. 2.6). [AJTJpi was
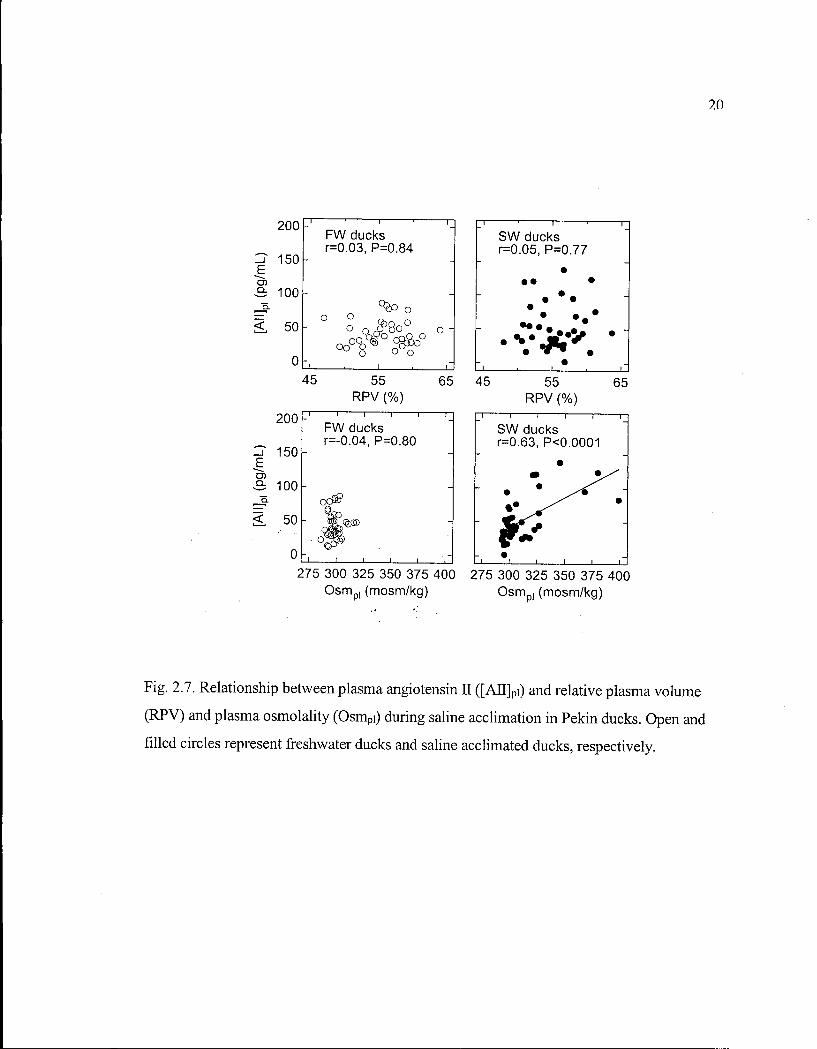
not significantly correlated with R P V in either F W or S W ducks (Fig. 2.7). [AJTJpi was
correlated with Osm pi in S W ducks, but not F W ducks (Fig. 2.7). [ A N P ] p i was positively
correlated with R P V , T B W and water influx in S W ducks, but was negatively correlated
with R P V and water influx in F W ducks (Fig. 2.8).
16
Fig. 2.3. Plasma osmolality (Osmpi) and relative plasma volume (RPV) of Pekin ducks in
relation to drinking water salinity. Open and filled circles represent freshwater ducks and
saline acclimated ducks, respectively. Values are means ± standard errors. Asterisks indicate
that values for ducks drinking freshwater and ducks drinking saline are significantly
different (PO.05).
17
Fig. 2.4. Plasma concentrations of N a + , K + , and CT of Pekin ducks in relation to drinking
water salinity. Open and filled circles represent freshwater ducks and saline acclimated
ducks, respectively. Values are means ± standard errors. Asterisks indicate that values for
ducks drinking freshwater and ducks drinking saline are significantly different (P<0.05).
18
0 150 300 450
Drinking water salinity (mM NaCl)
Fig. 2.5. Plasma concentrations of angiotensin II ([AU] pi), arginine vasotocin ([AVT] p i ) , and
atrial natriuretic peptide ([ANP] pi) of Pekin ducks in relation to drinking water salinity.
Open and filled circles represent freshwater ducks and saline acclimated ducks,
respectively. Values are means ± standard errors. Asterisks indicate that values for ducks
drinking freshwater and ducks drinking saline are significantly different (P<0.05).

19
co Q.
75
50
<
0
T 1 1 1 r F W ducks r=-0.05, P=0.75
o o o
T I I 1 1 S W ducks r=0.52, P=0.0005
275 300 325 350 375 400 275 300 325 350 375 400 O s m p | (mosm/kg) O s m p | (mosm/kg)
Fig. 2.6. Relationship between plasma arginine vasotocin ([AVT] p i ) and plasma osmolality
(Osmpi) during saline acclimation in Pekin ducks. Open and filled circles represent
freshwater ducks and saline acclimated ducks, respectively.
03 CL
05 CL
200
150
100
50
0
200
150
100
50
0
FW ducks r=0.03, P=0.84
o o
o O AT OO O
FW ducks r=-0.04, P=0.80
J — i i ' '
S W ducks r=0.05, P=0.77
• • • • ••
• • V
45 55 65 45 R P V (%)
T i i i 1 r
55 R P V (%)
65
i 1 1 1 r
S W ducks r=0.63, P<0.0001
275 300 325 350 375 400 275 300 325 350 375 400 O s m p l (mosm/kg) O s m p l (mosm/kg)
Fig. 2.7. Relationship between plasma angiotensin n ([AJTJpi) and relative plasma volume
(RPV) and plasma osmolality (Osmpi) during saline acclimation in Pekin ducks. Open and
filled circles represent freshwater ducks and saline acclimated ducks, respectively.

21
SW ducks r=0.33, P<0.03
45 ' 55 RPV (%)
65 45 55 65 RPV (%)
SW ducks r=0.39, P<0.0001
1000 2000 TBW (mL)
1000 2000 3000 TBW (mL)
>-• 1 ' 1 1 . L J
300 600 900 1200 Water Influx (mL/d)
300 600 900 1200 Water Influx (mL/d)
Fig. 2.8. Relationship between plasma atrial natriuretic peptide ([ANP] p i) and relative
plasma volume (RPV), total body water (TBW) and water influx during saline acclimation
in Pekin ducks. Open and filled circles represent freshwater ducks and saline acclimated
ducks, respectively.

22
DISCUSSION
Sex differences. Several previous studies found that some aspects of osmoregulation of
Pekin ducks are sexually disparate. Females have larger kidneys (Hughes et al. 1989, 1995)
and are more salt tolerant (Hughes et al. 1992); males have higher water flux (Hughes et al.
1991; Bennett et al. 2000) and lower glomerular filtration rate (Hughes et al. 1989). No
significant sex related differences were observed in the present study. This may simply
reflect the small number of ducks (three per sex-treatment group) used in this study
compared to those studies in which sexual disparity was found.
Response to saline acclimation. Most of the incurred N a C l load came from water
drunk, so each duck adjusted its own salt intake, given the concentration of drinking water
available. To maintain osmotic homeostasis, regulating variables changed in response to
the increasing osmotic stress. I sequenced the order in which regulated variables (TBW,
Osmpi, hematocrit, plasma ion concentrations) and regulating variables (water flux, plasma
hormone concentrations) deviated from homeostasis (threshold salinities) by using
continuous two-phase linear regression (Nickerson et al. 1989). I predicted that regulating
variables would deviate at lower salinities than regulated variables and body water increases
in concentration (Osm pi) before it decreases in volume (TBW, hematocrit). The first
variable for which I could calculate a deviation from its homeostatically controlled value
was Osm pi, a regulated variable. It increased at much lower drinking water salinity (254 ±
17 m M N a C l ; Fig. 2.3) than T B W decreased (335 ± 30 m M N a C l ; Fig. 2.2). These
salinities differ significantly (P = 0.028), supporting my hypothesis that body water
increases in concentration before it decreases in volume. Clearly, as the salinity of their
drinking water increases over this range, the difference in sodium concentration between
imbibed water and SGS decreases (Fig. 2.1) and their salt glands produce less water. The
ducks maintain body water volume (Fig. 2.2) at the expense of increased body water
osmolality (Fig. 2.3). At salinities greater than 300 m M N a C l , SGS is significantly less
concentrated than their drinking water (Hughes et al. 1992, submitted; Fig. 2.1) and
generates no free water. Ducks then decrease water flux (drinking), use body water to
excrete the excess salt renally, and lose body water (Fig. 2.2).
23
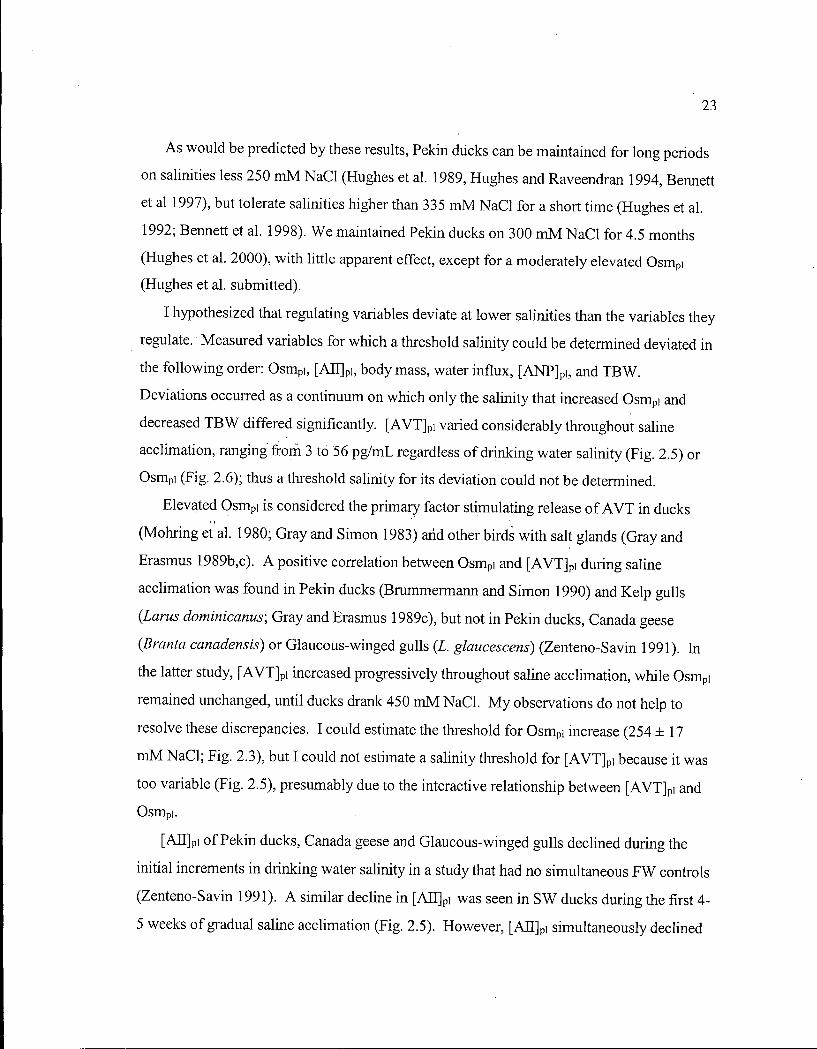
As would be predicted by these results, Pekin ducks can be maintained for long periods
on salinities less 250 m M N a C l (Hughes et al. 1989, Hughes and Raveendran 1994, Bennett
et al 1997), but tolerate salinities higher than 335 m M N a C l for a short time (Hughes et al.
1992; Bennett et al. 1998). We maintained Pekin ducks on 300 m M N a C l for 4.5 months
(Hughes et al. 2000), with little apparent effect, except for a moderately elevated Osm pi
(Hughes et al. submitted).
I hypothesized that regulating variables deviate at lower salinities than the variables they
regulate. Measured variables for which a threshold salinity could be determined deviated in
the following order: Osm p i , [ATJ]pi, body mass, water influx, [ANP] p i , and T B W .
Deviations occurred as a continuum on which only the salinity that increased Osm p i and
decreased T B W differed significantly. [AVT] p i varied considerably throughout saline
acclimation, ranging from 3 to 56 pg/mL regardless of drinking water salinity (Fig. 2.5) or
Osm p i (Fig. 2.6); thus a threshold salinity for its deviation could not be determined.
Elevated Osm p i is considered the primary factor stimulating release of A V T in ducks
(Mohring et al. 1980; Gray and Simon 1983) arid other birds with salt glands (Gray and
Erasmus 1989b,c). A positive correlation between Osm p i and [ A V T ] p i during saline
acclimation was found in Pekin ducks (Bnrmmermann and Simon 1990) and Kelp gulls
(Larus dominicanus; Gray and Erasmus 1989c), but not in Pekin ducks, Canada geese
(Branta canadensis) or Glaucous-winged gulls (L. glaucescens) (Zenteno-Savin 1991). In
the latter study, [ A V T ] p i increased progressively throughout saline acclimation, while Osm p i
remained unchanged, until ducks drank 450 m M N a C l . M y observations do not help to
resolve these discrepancies. I could estimate the threshold for Osm p i increase (254 ± 1 7
m M N a C l ; Fig. 2.3), but I could not estimate a salinity threshold for [ A V T ] p i because it was
too variable (Fig. 2.5), presumably due to the interactive relationship between [AVT] p i and
Osm pi.
[AJTJpi of Pekin ducks, Canada geese and Glaucous-winged gulls declined during the
initial increments in drinking water salinity in a study that had no simultaneous F W controls
(Zenteno-Savin 1991). A similar decline in [AJTJpi was seen in S W ducks during the first 4-
5 weeks of gradual saline acclimation (Fig. 2.5). However, [AJTJpi simultaneously declined
24
in F W ducks. A s stress elicits an increase in [AJJ]pi and both F W and S W ducks decreased
[AJTJpi during the first weeks, the initial decline in ATI may represent a gradual reduction in
the stress imposed by handling. We had repeatedly handled and bled ducks prior to the
experiment to accustom them to the experimental procedures and reduce stress levels during
the experiment, but had not done so with the same intensity and frequency they later faced.
The threshold for [ATJ]pi (283 ± 20 m M N a C l ; Fig. 2.5), is not different from the threshold
salinity for increase in Osm p i (251 ± 17 m M N a C l ; Fig. 2; P=0.71). [AJTJpi and Osm pi are
significantly related in SW, but not F W , ducks (Fig. 2.7). Gray and Simon (1985) also
found a significant positive relationship between [AJJJpi and Osm p i . They nevertheless
considered fluid volume (hematocrit) changes to be the dominant stimulus for the release of
ATI. I found no significant relationship between [ATfJp] and my measure of volume, R P V ,
probably because the portion of the extracellular fluid that decreases during saline
acclimation is the interstitial fluid, not the plasma (Gray et al. 1987; Bnimmermann and
Simon 1990; Chapter 3).
Angiotensin II stimulates drinking in many species of birds (reviewed by Skadhauge
1981; Takei et al. 1989). The [AHJ pi values of F W and S W ducks I found are similar to
values previously reported (Gray and Simon 1985; Gray et al. 1986; Bmmmermann and
Simon 1990) and are well below the diposogenic threshold for systemic A U (Simon and
Schmid 1996). Water flux and [AJJJpi are unrelated. In fact, the salinity at which [AU] p i
increased (283 ± 20 m M N a C l ; Fig. 2.5) preceded the salinity at which water influx
decreased (329 ± 15 m M N a C l ; Fig. 2.2).
A N P plays an important role in maintenance of blood volume through its actions on
fluid and sodium excretion. It stimulates natriuresis and diuresis in F W ducks (Gray et al.
1991) and, in S W ducks, enhances sodium and water excretion by the salt glands (Schutz
and Gerstberger 1990) and kidneys (Schutz et al. 1992). [ANPJ p i and blood volume are
positively correlated in ducks (Gray et al. 1991). I did not measure blood volume, but R P V ,
T B W and water influx were all positively correlated with [ANPJpi in S W ducks (Fig. 2.8).
This supports a role for A N P in sodium excretion in S W ducks (Schutz and Gerstberger
1990; Schutz et al. 1992). However, in F W ducks, R P V and water influx were negatively

25
related to [ANP] p i (Fig. 2.8), suggesting A N P plays a role in sodium conservation in F W
ducks. Water influx, [ A N P ] p ) , and T B W declined at similar salinities (329 ± 15, 330 ± 46
and 335 ± 30 m M N a C l , respectively).
Water flux. When freshwater Pekin ducks were saline acclimated, their water flux
increased from 233 to 401 mL- kg"1- d"1 (Hughes et al. 1991). I found that, except for a
possible increase when ducks drank isotonic saline, water flux of Pekin ducks was
unaffected by saline intake until they drank 329 ± 1 5 m M N a C l . Then it began to decline,
becoming significantly decreased when they drank 450 m M N a C l . Therefore, I reject my
hypothesis that Pekin ducks increase their water flux during saline acclimation. M y results
are consistent with studies of other species with salt glands that found water flux was either
unchanged (Snowy Plovers (Charadrius alexandrinus, Purdue and Haines 1977; Glaucous-
winged gulls, Larus glaucescens, Walters and Hughes 1978) or slightly decreased (Clapper
rails, Rallus longirostris, Hammons et al. 1988) by saline acclimation.
Typical water flux values for Pekin ducks range from 230 to 265 mL- kg"1 • d"1
(Thomas and Phillips 1975; Hughes et al. 1991; Bennett et al. 2000), but can be as high as
400 mL- kg"1- d"1 (Hughes et al. 1991). In my study water flux was approximately 245
mL- kg"1- d"1 (650 mL- d"1; Fig. 2.2, Table 2.1) or twice the water flux predicted for a bird
with salt glands o f their body mass (Hughes et al. 1987; Nagy and Peterson 1988). Similar
high water fluxes have been measured for Tufted ducks, Aythya fuligula (Bevan et al. 1995;
de Leeuw et al. 1999), Canvasbacks, A. valisineria, and Barrows Goldeneyes, Bucephala
islandica (Chapter 5). Pekin ducks continued to drink a large volume of saline (Fig. 2.2),
even when its concentration exceeded that of their SGS (Fig. 2.1). The unusually high
drinking rates of Pekin ducks may be a consequence of the way they eat by sieving their
food through water.
Using data obtained in this and other studies in this laboratory, I constructed a water
budget for Pekin ducks (Table 2.1). The combined water influx from drinking and
preformed water is the same for F W (223.3 mL- kg"1- d"l) and S W ducks (228.3 mL- kg"
1 • d"1) and these values agree with total water intake of F W ducks that were not allowed to
swim in water (221 ± 8 mL- kg"1- d"1; Fletcher and Holmes, 1968). A t least two previous
26
studies suggested the high water flux of ducks is due to a high rate of cutaneous water
exchange (Thomas and Phillips 1975; Bevan et al. 1995), but provided no experimental
evidence. M y water budget calculations show that the high water flux o f Pekin ducks can be
accounted for solely by water consumption and metabolic water production (Table 2.1).
I also estimate water loss (efflux) through various avenues (Table 2.1). I estimated
urinary water loss of F W ducks to be 86% of total water efflux. This was based on sodium
flux (Roberts and Hughes 1984) and sodium concentration of urine from ducks with free
access to water (Hughes et al. submitted; Fig. 2.1).
How saline intake affects evaporative and fecal water loss in any species of bird with or
without salt glands is unknown. In my water budget, I assumed these losses were unaffected
by saline intake. The portion of water efflux due to SGS and urine in S W ducks was
estimated to be 76% and 11% of total water efflux (Table 2.1). These values were
calculated by solving simultaneously equations that partition water and sodium effluxes
(Table 2.1). They indicate that 40% of sodium flux of S W ducks (Roberts and Hughes
1984) is due to salt gland secretion and 60% to renal excretion, despite the kidney's limited
capacity to concentrate sodium (Fig. 2.1; Hughes et al. submitted). This water budget
describes our current understanding of water and sodium balance in Pekin ducks and
provides a working hypothesis that can be tested experimentally. The glomerular filtration
rate of Pekin ducks is approximately 3 mL- kg"1- min"1 and is little affected by saline
acclimation or acute saline loading (Holmes et al. 1968; Gerstberger et al. 1985; Hughes et
al. 1989). Urine efflux (Table 2.1) predicts saline acclimation does not affect renal tubular
water reabsorption (95.2 % versus 95.6 %, for F W and S W ducks, respectively), but
decreases renal tubular sodium reabsorption (99.7 % versus 98.1 %, for F W and S W ducks,
respectively). Values predicted for renal tubular reabsorption are similar to values
measured in F W and S W Pekin ducks (Holmes et al. 1968; Hughes et al. 1989).
Ducks may modify their urine postrenally to conserve water and/or N a + . Ducks reflux
urine into the hindgut (Hughes and Raveendran 1994; Hughes et al. 1999), where N a +
uptake capacity is only slightly diminished by saline acclimation (Skadhauge et al. 1984).

27
Table 2.1. Calculated water budget for Pekin ducks (Anas platyrhynchos) maintained freshwater and saline'.
Freshwater Saline
Body mass (g)
Influx (mL- kg"1- d"1) Drinking Preformed3
Metabolic 4
Efflux (mL- kg' 1- d"1) Evaporative 5
Urine Feces SGS
! 3 0 0 m M N a C l . Drinking = Influx - (Preformed + Metabolic).
3 Pekin ducks eat 59.5 g pellets kg"1 d"1 containing 12.7 % preformed water and 17% protein (Bennett et al. 2000).
4Metabolic water production is calculated from the amount of water formed in the oxidation of foodstuffs (0.56 m L EbO/g starch and 0.5 m L FhO/g protein (Schmidt-Nielson 1975)).
5Evaporative water loss measured at 20°C (Bouverot et al. 1974). 6Urine water loss = N a + flux / [Na+]Urine, where N a + flux = 2.1 mmol- kg"1- d"1 (Hughes and
Roberts 1986) and [Na+]urine =10.1 m M (Fig. 1, Hughes et al. submitted). Feces = Efflux - (Evaporative + Urine).
g
Freshwater value assumed. Calculated by simultaneously solving the following equations:
(i) Urine + SGS = Efflux - (Evaporative + Feces), and (ii) N a + flux = (Urine [Na + ] u n ne) + (SGS ' [Na + ] S G S ) , where N a + flux = 21.4 mmol- kg"1 • d"1 (Hughes and Roberts 1984), [Na +] u rine = 67.0 m M (Fig. 2.1, Hughes et al. submitted) and [Na+]sos = 322.5 m M (Fig. 2.1, Hughes et al. 1992, Hughes et al. submitted).
2800
241.4 215.7
7.6 18.1
240.8 15.4
207.9 6
17.57
0
2500
246.9 221.1
7.6 18.1
249.7 15.48
189.99
17.5 s
26.9 9
28
Although ducks may reabsorb ions and water postrenally, how this hindgut reabsorption
might influence water and sodium balance is unclear. Cloacal fluid (Holmes et al. 1968)
and ureteral urine (Hughes et al. submitted) have similar sodium concentrations, but their
volumes and the influence of saline intake on these volumes remain to be quantified.
This and other studies in this laboratory (Hughes et al. 1992, submitted) show that,
despite the limited sodium concentrating abilities of their kidneys and salt glands (Fig. 2.1),
Pekin ducks tolerate drinking salinities up to 300 m M N a C l without change in total body
water (Hughes et al. 1991; Chapter 3; Fig. 2.2) or total exchangeable sodium pool (Chapter
3). They increased Osm p i at 254 ± 1 7 m M NaCl , but remained in water and sodium balance
when they drank 300 m M N a C l . They reduced drinking (Fig. 2.2) only when salinity of
their drinking water exceeded the maximum concentration of their salt gland secretion,
about 300 m M N a C l (Fig. 2.1). Their Osm pi and ion concentrations continued to rise (Figs.
2.3, 2.4) and they lost body water (Fig. 2.2). Nevertheless, the exchangeable sodium pool
did not change (Chapter 3).
hi summary, I monitored changes in T B W , water flux and plasma concentrations of
osmolytes and osmoregulatory hormones of Pekin ducks throughout their acclimation to
increasingly saline drinking water and used continuous two-phase linear regression to
estimate the salinity at which each variable deviated from its homeostatic set point. This
method appeared to reliably estimate thresholds of regulated variables, but was less
successful at approximating thresholds for regulating variables ( A V T ) . This presumably
reflects the interactive relationships between the stimuli and their effectors. Osm p i and
[AJTJpi, the first variables to respond to elevated drinking water salinity, increased at 254 and
283 m M N a C l , respectively, but were not significantly correlated. [AVTJ p i was highly
variable and not correlated with either Osm pi or body water volume ( T B W , R P V ) . Water
influx, [ANPJpi and T B W all began to decline when drinking water salinity was slightly
above 300 m M N a C l . [ANPJpi was positively correlated with body water volume (TBW,
R P V ) and water influx only in S W ducks. These results do not support my hypothesis that
Pekin ducks increase drinking as the salinity of their drinking water increases. They do
support my hypothesis that at tolerable drinking water salinities, total body water of Pekin
29
ducks is maintained, while Osmpi is increased. As drinking water salinity approached the
maximum concentrating ability of their salt glands, water flux started to decrease and body
water was used to excrete excess salt.
30 CHAPTER THREE. EFFECT OF SALINE ACCLIMATION ON BODY WATER
AND SODIUM COMPARTMENTALIZATION IN PEKIN DUCKS {ANAS
PLA TYRHYNCHOS).
PREFACE
This chapter is adapted from a paper submitted as Bennett D C , Kojwang D, Sullivan
T M , Gray D A , Hughes M R . Effect of saline acclimation on body water and sodium
compartmentalization in Pekin ducks {Anasplatyrhynchos). J Comp Physiol B . (submitted
January 2001). David Kojwang conducted some preliminary measurements of fluid spaces,
which are not included here. Terry Sullivan assisted with the measurements used in this
study. David Gray measured the hormones. I generated the research question examined in
this study, and was responsible for all aspects of data analysis and presentation.
INTRODUCTION
Pekin ducks have high water flux rates that are not affected by tolerable saline intakes
(Chapter 2). Each day drinking replaces half of the ducks' body water (Hughes et al. 1991;
Chapter 2) and, when they drink saline (300 m M NaCl) , half of their sodium pool (Roberts
and Hughes 1984). Because the concentration of salt gland secretion of Pekin ducks varies
with and only slightly exceeds that of the water they drink (Hughes et al. 1992, submitted),
free water production by the salt glands diminishes as the difference between drinking water
and secretion concentrations decreases. When their salt glands are unable to produce
sufficient free water to maintain T B W (Hughes et al. 1992), their water flux decreases and
they lose body water (Chapter 2). This water loss has been presumed to be from the
extracellular fluid.
Studies of the effects of saline intake on water and sodium distribution within body
spaces of Pekin ducks have yielded conflicting results. Relative to body mass, T B W
remained unchanged (Ruch and Hughes 1975; Chapter 2) or increased (Hughes et al. 1991),
and extracellular fluid volume (ECFV) remained unchanged (Ruch and Hughes 1975) or
decreased (Gray et al. 1987; Bmmmermann and Simon 1990). The exchangeable N a + pool

31 remained unchanged (Gray et al 1987; Hughes and Roberts 1988) or increased (Roberts and
Hughes 1984), while intracellular N a + increased (Gray et al. 1987; Erbe et al. 1988). These
observations (summarized in Table 3.1) might reflect differences in saline acclimation
regimes, methodology, or influences of age or sex on the capacity to respond to saline
challenge. They also suggest the saline acclimation may expand the intracellular fluid
volume (ICFV), possibly at the expense of the E C F V .
I hypothesized that 1) as ducks are acclimated to a tolerable drinking water salinity,
water and N a + are redistributed from the extracellular fluid to the intracellular fluid, and 2)
acclimation to a higher than tolerable salinity results in a loss of body water, specifically
from the extracellular fluid. To test these hypotheses I measured T B W , E C F V , plasma
volume (PV) and exchangeable N a + pool sequentially in the same bird before and after
acclimation to saline. Both sexes were included in this study, since male and female ducks
differ in E C F V (Hughes et al. 1989), kidney size (Hughes et al. 1995), glomerular filtration
rate (Hughes et al. 1989), postrenal urine modification (Hughes et al. 1999) and saline
tolerance (Hughes et al. 1992).
M A T E R I A L A N D M E T H O D S
Experimental animals. Three male and three female adult Pekin ducks (Anas
platyrhynchos) were maintained in an indoor climate-controlled room (temperature 20°C,
photoperiod 12L:12D) on ad libitum freshwater and duck pellets (Buckerfield's,
Abbottsford, B . C . ; 12.7 % water, 17 % protein, 2750 kcal/kg, and [Na + ] , [ K + ] , and [Cl"]
83, 153.5 and 99 mmol/kg, respectively; Bennett et al. 2000). Volumes of body water
compartments were measured while the birds were maintained on freshwater (0 NaCl) ,
and remeasured following their acclimation (in four equal weekly increments) to 300 m M
N a C l , and after a further week on 400 m M N a C l . Based on the results of Chapter 2,1
chose to acclimate ducks to 300 m M N a C l , a high but tolerable salinity, and 400 m M
N a C l , a drinking water salinity that decreased water flux and body water.
Experimental procedures. Each duck was fasted overnight and weighed. Venous
catheters, placed in the left leg and right wing (for injection of markers and blood
32
Table 3.1. Sumrnary of the reported effects of saline acclimation on the distribution of
body water and exchangeable sodium pool of Pekin ducks (Anas platyrhynchos).
/lass T B W E C F V P V Nae X Source
fe) ( % ) (%) (%) (mM/Kg) F W S W F W S W F W S W F W S W F W S W 3090 2355 68.5 64 24.9 26.4 5.8 4.2 1 3150 61.6 2 2165 1830 30.1 47.7 3 2620 2240 31.2 24.8 6.3 5.9 47.9 47.2 4 2020 1825 26.0 29.8 5 2220 2995 22.2 21.6 6 2790 2520 33.5 26.0 6.4 5.7 7 3150 3115
3057
64.4 73.9
68.4 28.4 8.3
8
9 2787 2497 65.2 66.6 10 3055 2932 62.1 65.3 32.0 23.6 4.5 5.5 66.7 69.1 11 2705 2537 64.1 67.9 28.1 25.2 5.8 6.5 42.7 47.0 Average
1 2 3
Source: Ruch and Hughes (1975); Thomas and Phillips (1975); Roberts and Hughes
(1984); 4 Gray et al. (1987), assuming [Na +] Pi of Simon and Gray (1989); 5Hughes and
Roberts (1988); 6Hughes et al. (1989); 7Brummerman and Simon (1990); 8Hughes et al.
(1991); 9Bennett et al. (2000); 1 0Bennett et al. submitted; n T h i s study.
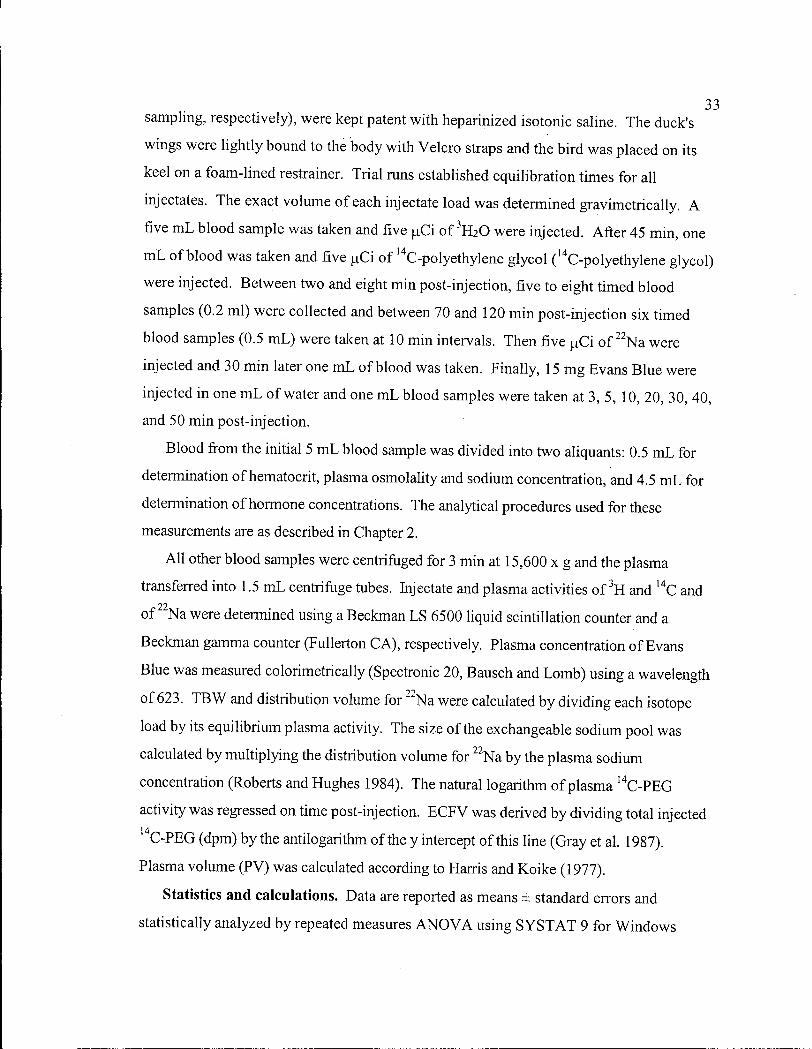
33 sampling, respectively), were kept patent with heparinized isotonic saline. The duck's
wings were lightly bound to the body with Velcro straps and the bird was placed on its
keel on a foam-lined restrainer. Trial runs established equilibration times for all
injectates. The exact volume of each injectate load was determined gravimetrically. A
five m L blood sample was taken and five p C i of 3 H 2 0 were injected. After 45 min, one
m L of blood was taken and five p C i of 1 4C-polyethylene glycol ( 1 4C-polyethylene glycol)
were injected. Between two and eight min post-injection, five to eight timed blood
samples (0.2 ml) were collected and between 70 and 120 min post-injection six timed
blood samples (0.5 mL) were taken at 10 min intervals. Then five u C i o f 2 2 N a were
injected and 30 min later one m L of blood was taken. Finally, 15 mg Evans Blue were
injected in one m L of water and one m L blood samples were taken at 3, 5, 10, 20, 30, 40,
and 50 min post-injection.
Blood from the initial 5 m L blood sample was divided into two aliquants: 0.5 m L for
determination of hematocrit, plasma osmolality and sodium concentration, and 4.5 m L for
determination of hormone concentrations. The analytical procedures used for these
measurements are as described in Chapter 2.
A l l other blood samples were centrifuged for 3 min at 15,600 x g and the plasma
transferred into 1.5 m L centrifuge tubes. Injectate and plasma activities of 3 H and 1 4 C and 22
of N a were determined using a Beckman L S 6500 liquid scintillation counter and a
Beckman gamma counter (Fullerton C A ) , respectively. Plasma concentration of Evans
Blue was measured colorimetrically (Spectronic 20, Bausch and Lomb) using a wavelength 22
of 623. T B W and distribution volume for Na were calculated by dividing each isotope
load by its equilibrium plasma activity. The size of the exchangeable sodium pool was 22
calculated by multiplying the distribution volume for N a by the plasma sodium
concentration (Roberts and Hughes 1984). The natural logarithm of plasma I 4 C - P E G
activity was regressed on time post-injection. E C F V was derived by dividing total injected
1 4 C - P E G (dpm) by the antilogarithm of the y intercept of this line (Gray et al. 1987).
Plasma volume (PV) was calculated according to Harris and Koike (1977).
Statistics and calculations. Data are reported as means ± standard errors and
statistically analyzed by repeated measures A N O V A using S Y S T A T 9 for Windows

(SPSS Science, Chicago, IL). For main effects (sex, drinking water salinity) significance
was claimed at P<0.05. The I C F V is the difference between T B W and E C F V ; interstitial
fluid volume (ISFV) is the difference between E C F V and P V .
R E S U L T S
One female died on 400 m M N a C l and is excluded from analyses (but see below).
Blood composition and hormone concentrations. Acclimation to 300 m M N a C l did
not affect any parameter and, when the ducks drank 400 m M N a C l , only Osm p i and [Na] pi
were significantly elevated (P<0.05 and P O . 0 3 , respectively; Table 3.2). There were no
sex differences except that Osm pi in females was higher than in males (P=0.005).
Water and sodium compartmentalization. Body mass and T B W did not differ
between males and females maintained on freshwater (P=0.91 and P=0.50, respectively),
but E C F V was significantly smaller in males (827 ± 66 mL) than in females (1149 ± 55
mL) (P=0.02). This was due to smaller ISFV (P=0.01), not P V (P=0.57).
During acclimation to 300 m M N a C l , ducks lost 123 ± 23 g of body mass or 4% of
initial mass (P=0.03, Fig. 3.1), but T B W was unaltered (P=0.99, Fig. 3.2). Distribution of
body water had, however, changed. Fluid had shifted from the extracellular to the
intracellular compartment (Fig. 3.2). E C F V decreased by 283 ± 113 m l (P=0.04), while
I C F V tended to increase by 301 ± 133 ml (P=0.09). The decrease in E C F V was due to a
decrease in I S F V (P=0.04), not to a decrease in P V (P=0.42; Fig . 3.3). The decrease in
E C F V was sexually disparate, being less in males (127 ± 90 mL) than in females (518 ±
111 mL; treatment-sex interaction P=0.08). When ducks drank 300 m M N a C l , E C F V
and P V did not differ between the sexes (P=0.98 and P=0.44, respectively).
Further elevation of drinking water salinity to 400 m M N a C l resulted in a further loss of
body mass (326 ± 97 g or 12% of initial mass; P=0.10; Fig. 3.1). T B W decreased by 293 ±
61 ml (P=0.05; Fig. 3.2), which was not significantly different from body mass loss
(P=0.72). E C F V did not changed (P=0.59), but I C F V decreased 361 ± 38 ml (P=0.009;
Fig. 3.2). The decrease in I C F V was not significantly-different from the T B W loss (P=0.59).
P V and ISFV did not changed (P=0.79; Fig. 3.3).
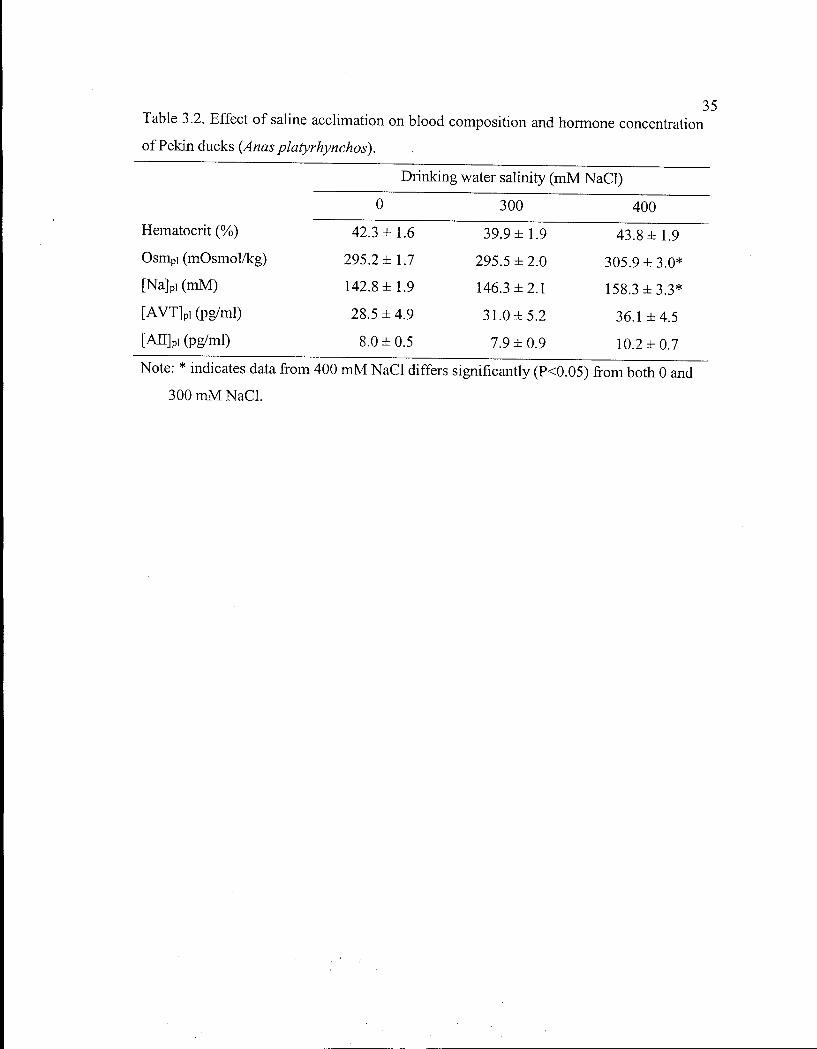
35 Table 3.2. Effect of saline acclimation on blood composition and hormone concentration
of Pekin ducks (Anas platyrhynchos).
Drinking water salinity ( m M NaCl)
0 300 400
Hematocrit (%) 42.3 ± 1.6 39.9 ± 1.9 43.8 ± 1.9
Osm pi (mOsmol/kg) 295.2 ± 1.7 295.5 ± 2.0 305.9 ± 3.0*
[Na] p i (mM) 142.8 ± 1 . 9 146.3 ± 2 . 1 158.3 ± 3 . 3 *
[AVT] p i (pg/ml) 28.5 ± 4 . 9 31.0 ± 5 . 2 36.1 ± 4 . 5
[AH]pi (pg/ml) 8.0 ± 0 . 5 7.9 ± 0 . 9 10.2 ± 0 . 7
Note: * indicates data from 400 m M N a C l differs significantly (PO.05) from both 0 and
300 m M NaCl .
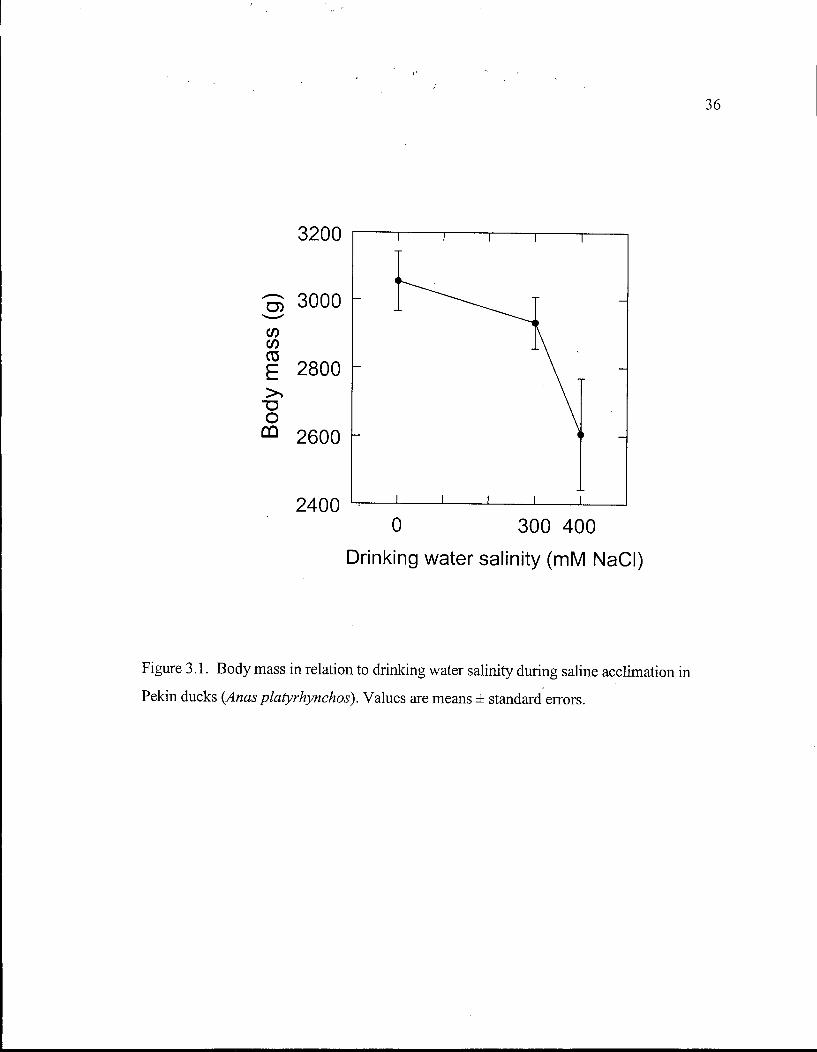
3200
2400 0 300 400
Drinking water salinity (mM NaCl)
Figure 3.1. Body mass in relation to drinking water salinity during saline acclimation
Pekin ducks (Anas platyrhynchos). Values are means ± standard errors.
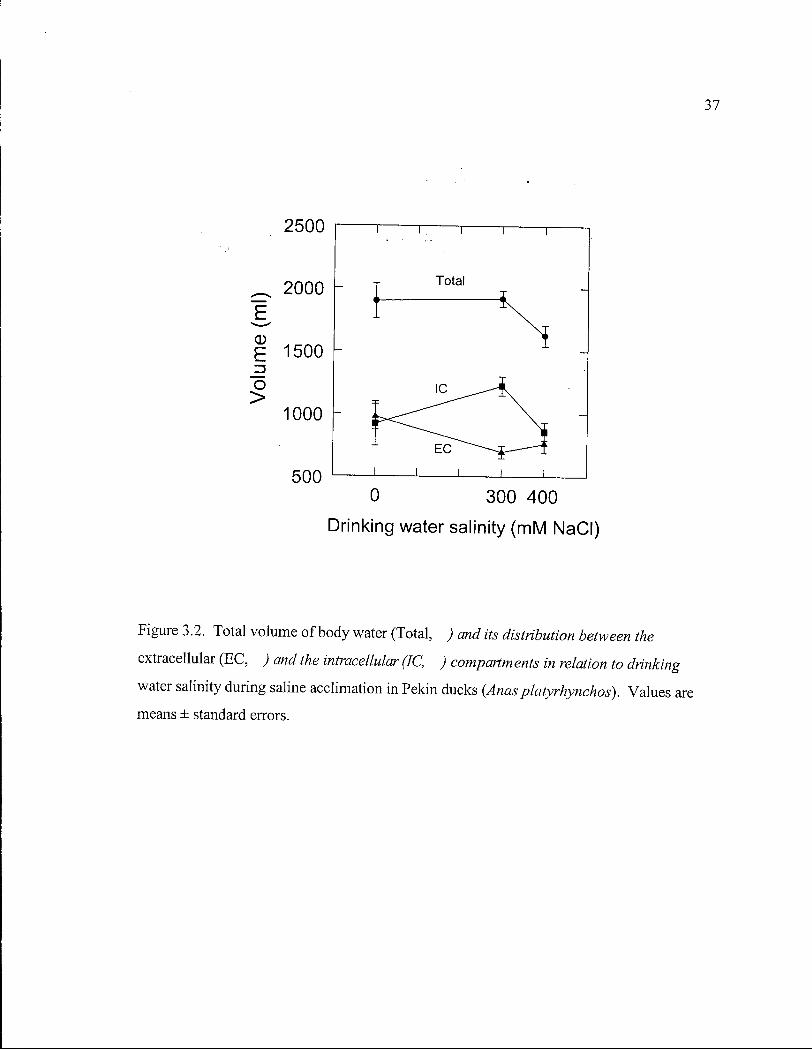
37
2500
2000
CD E 1500
O >
1000
500
T ~i 1 r
Total
0 300 400
Drinking water salinity (mM NaCl)
Figure 3.2. Total volume of body water (Total, ) and its distribution between the
extracellular (EC, ) and the intracellular (IC, ) compartments in relation to drinking
water salinity during saline acclimation in Pekin ducks (Anas platyrhynchos). Values a
means ± standard errors.

38
1000 -
^ 750 -I CD
E 500 -o
> 250 ~ Plasma
I ~
0 300 400
Drinking water salinity (mM NaCl)
Figure 3.3. Volume of interstitial fluid (ISF, ) and plasma in relation to drinking water
salinity during saline acclimation in Pekin ducks {Anasplatyrhynchos). Values are means ±
standard errors.

39 The total exchangeable N a pool was not affected by acclimation to 300 m M N a C l
(P=0.68; Fig. 3.2), but the extracellular portion decreased significantly (P=0.02; Fig. 3.4).
No further change in either total exchangeable N a + pool size or its distribution occurred
when ducks drank 400 m M N a C l (P=0.34).
Prior to saline acclimation, when the ducks drank freshwater, the female duck that
subsequently died when given 400 m M N a C l to drink, had a smaller E C F V (33.1 % body
mass) than the other two females (39.9 % body mass). This duck had expanded its E C F V
to 44.7 % body mass during saline acclimation, while the other females had decreased it to
23.4 % body mass.
D I S C U S S I O N
Pekin ducks acclimated to a tolerable salinity (300 m M N a C l ; Chapter 2) maintain
T B W and exchangeable N a + pool size (Ruch and Hughes 1975; Gray et al 1987; Hughes
and Roberts 1988; Chapter 2; Figs. 3.2, 3.4). They also decrease the interstitial component
of the E C F V in response to saline acclimation (Gray et al. 1987; Brummermann and Simon
1990; Fig. 3.2). I found that the decrease in E C F V is due to a redistribution of water and
N a + from the extracellular compartment to the intracellular compartment (Figs. 3.2, 3.4) and
not to a loss of body water, as previously suggested (Gray et al. 1987).
The significance of this redistribution is not presently known. That it may have
osmoregulatory importance is implied by the observation that only the female with the
smallest initial E C F V expanded its E C F V during saline acclimation and died when
presented with 400 m M N a C l . Redistribution of fluid may affect initiation of salt gland
secretion. We have shown that ducks that simultaneously ingested saline and cadmium
also had an expanded E C F V , but unchanged T B W (Bennett et al. 2000). These ducks
required a longer infusion of N a C l and larger increases in both volume and concentration
of the extracellular fluid to activate salt gland secretion
Salt gland secretion of Pekin ducks is initiated by two interactive stimuli: increased
E C F V and increased extracellular fluid concentration (Chapter 4). A s the ducks' drinking
water salinity gradually increased to 300 m M N a C l , their secretion was only slightly more

40
o o CL
+ CO -z. 0
_ Q CO CO C CO
J= o X
UJ
250
200
150
100
50
0
"i r i r
Total
J L
0 300 400
Drinking water salinity (mM NaCl )
Figure 3.4. Size of exchangeable N a + pool (Total, ) and its distribution between the
extracellular (EC, ) and m/racellular (IC, ) compartments in relation to drinking water
salinity (DWS) during saline acclimation in Pekin ducks (Anasplatyrhynchos). Values are
means ± standard errors.

41 concentrated than their drinking water (Hughes et al. 1992, submitted). Nevertheless, they
eliminated sufficient N a C l to maintain T B W (Fig. 3.2) and total exchangeable N a + pool size
(Fig. 3.4). However, at the same time, their ISFV decreased (Fig. 3.3) and I C F V increased
(Fig. 3.2). Receptors that stimulate salt gland secretion appear to be located in the
interstitial space (Hammel et al. 1983). It is tempting to speculate that shifting fluid into the
intracellular compartment permits a more rapid expansion of ISFV when osmolytes enter
the extracellular fluid. It might also explain the lower salt gland secretion concentration
induced by imbibed saline (322 ± 8 m M N a + ; Hughes et al. 1992, submitted) compared to
that induced by infused saline (500-600 m M N a + ; Hammel et al. 1983; Bennett et al. 2000;
Chapter 4). Clearly, drinking saline does not elicit the full concentrating capacity of the salt
glands. Infused saline would draw water out of the cell rapidly, expanding the ISFV. In
constrast, drinking saline would draw water into the gut, dampening E C F V expansion.
Total exchangeable N a + pool was not affected by acclimation to 300 m M NaCl , but N a +
entered cells as fluid shifted from extracellular to intracellular compartments (Fig. 3.4).
Gray et al. (1987) and Erbe et al. (1988) had previously speculated that saline acclimated
ducks have a larger intracellular N a + pool. Infusion of saline into saline acclimated ducks
produces a larger increase in plasma N a + than infusion of the same concentration of saline
into freshwater ducks (Ruch and Hughes 1975). This suggests that saline acclimated ducks
allow less N a + to enter the cells during saline loading, thus inducing greater movement of
water out of the cells to expand the extracellular fluid compartment (Ruch and Hughes
1975). M y results concur with these observations. The larger intracellular N a + pool
generated during saline acclimation should expedite the rapid increases in interstitial
volume and concentration that stimulate secretion in response to saline loading.
E C F V , but not T B W , differed between male and female ducks maintained on
freshwater (Hughes et al. 1989, 1991; this study). This sexual disparity in body water
distribution disappeared after acclimation to 300 m M N a C l (Hughes et al. 1989; this study),
since females shifted significantly more water from the extracellular fluid to the intracellular
fluid. Whether the larger E C F V of females drinking freshwater is due to other factors, such
as egg laying, I can't say. However, the larger shift of body water in females may be a
factor in their greater salt tolerance (Hughes et al. 1992).

42 I accept my hypothesis that Pekin ducks acclimated to a tolerable drinking water salinity
redistributed water and N a + from the extracellular fluid to the intracellular fluid
compartment. This shift in fluid may be important in the initiation of SGS. I do not accept
my hypothesis that ducks lose water from the extracellular fluid compartment when they
drink saline having a concentration beyond their osmoregulatory capacity, because ducks
that drank 400 m M N a C l lost water from the intracellular fluid compartment.

43
CHAPTER FOUR. INTERACTION OF OSMOTIC AND VOLEMIC
COMPONENTS IN INITIATING SALT GLAND SECRETION IN PEKIN DUCKS.
PREFACE
This chapter is adapted from a paper published as Bennett D C , Hughes M R , De Sobrino
C N , Gray D A . 1997. Interaction of osmotic and volemic components in initiating salt-gland
secretion in Pekin ducks. Auk 114:242-248. Cristina De Sobrino assisted with the
measurements used in this study. David Gray measured the hormones. I generated the
research question examined, and was responsible for all aspects of data analysis and
presentation. . . .
INTRODUCTION
Extrarenal salt secretion by the cephalic glands of marine birds was first observed by
Schmidt-Nielsen et al. (1958) when they gave saline to Double-crested Cormorants
(Phalacrocorax auritus). Subsequently, secretion from the salt glands has been elicited by
many other osmolytes and elevation of plasma osmolality (Osm pi) has become generally
accepted as the primary stimulus for salt gland secretion (SGS; Peaker and Linzell 1975).
Ruch and Hughes (1975) questioned whether elevated Osm p i was the sole effector for
secretion, when they noted that, in the absence of concomitant expansion of the
extracellular fluid volume (ECFV) , increases in plasma sodium concentration ([Na +] pi) as
great as 20% failed to elicit SGS in Pekin Ducks (Anas platyrhynchos). This was later
verified by Hughes (1989a). It was subsequently noted that at secretory threshold the Osm pi
of ducks was inversely related to E C F V , specifically the interstitial component (Kaul and
Hammel 1979; Hammel et al. 1980).
Simultaneous changes in Osm pi and E C F V in response to N a C l challenge and their
relative contributions to the initiation of SGS had not been clearly described until the
present study. Ducks were intravenously infused with hypertonic saline and the changes in
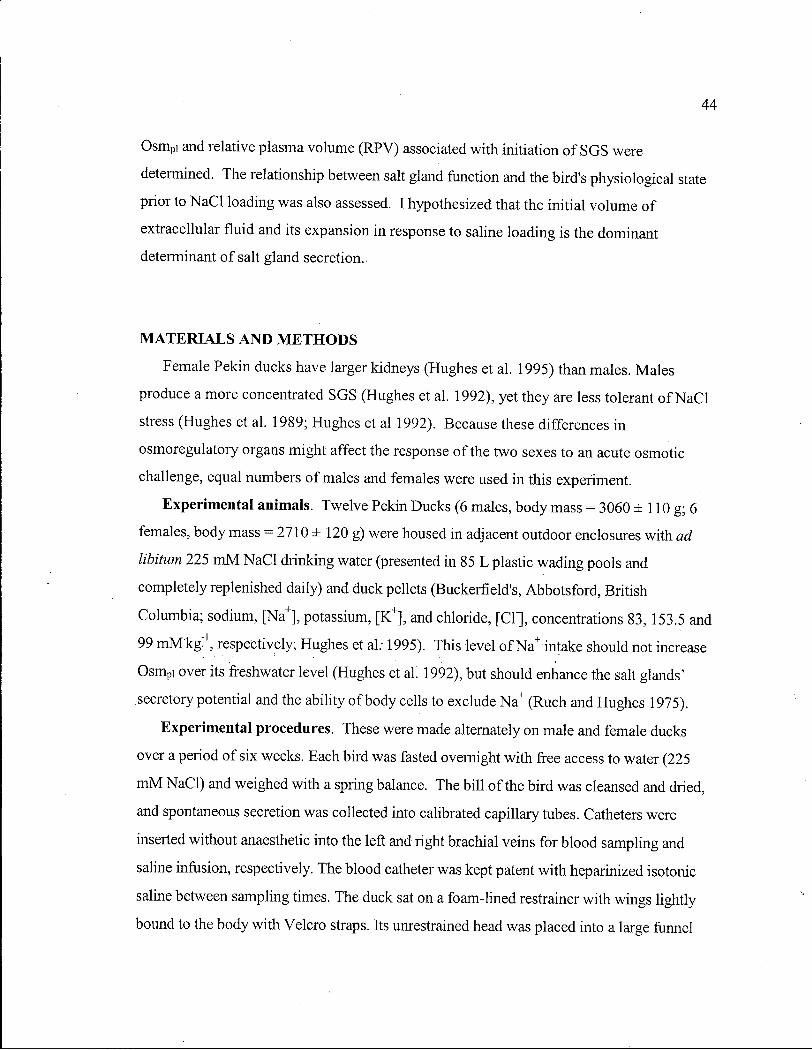
44
Osm pi and relative plasma volume (RPV) associated with initiation of SGS were
determined. The relationship between salt gland function and the bird's physiological state
prior to N a C l loading was also assessed. I hypothesized that the initial volume of
extracellular fluid and its expansion in response to saline loading is the dominant
determinant of salt gland secretion.
M A T E R I A L S A N D M E T H O D S
Female Pekin ducks have larger kidneys (Hughes et al. 1995) than males. Males
produce a more concentrated SGS (Hughes et al. 1992), yet they are less tolerant of N a C l
stress (Hughes et al. 1989; Hughes et al 1992). Because these differences in
osmoregulatory organs might affect the response of the two sexes to an acute osmotic
challenge, equal numbers of males and females were used in this experiment.
Experimental animals. Twelve Pekin Ducks (6 males, body mass = 3060 ± 110 g; 6
females, body mass = 2710 ± 120 g) were housed in adjacent outdoor enclosures with ad
libitum 225 m M N a C l drinking water (presented in 85 L plastic wading pools and
completely replenished daily) and duck pellets (Buckerfield's, Abbotsford, British
Columbia; sodium, [Na +], potassium, [ K + ] , and chloride, [CI"], concentrations 83,153.5 and
99 rnMkg" 1 , respectively; Hughes et al. 1995). This level of N a + intake should not increase
Osm pi over its freshwater level (Hughes et al. 1992), but should enhance the salt glands'
secretory potential and the ability of body cells to exclude N a + (Ruch and Hughes 1975).
Experimental procedures. These were made alternately on male and female ducks
over a period of six weeks. Each bird was fasted overnight with free access to water (225
m M NaCl) and weighed with a spring balance. The bi l l o f the bird was cleansed and dried,
and spontaneous secretion was collected into calibrated capillary tubes. Catheters were
inserted without anaesthetic into the left and right brachial veins for blood sampling and
saline infusion, respectively. The blood catheter was kept patent with heparinized isotonic
saline between sampling times. The duck sat on a foam-lined restrainer with wings lightly
bound to the body with Velcro straps. Its unrestrained head was placed into a large funnel

45
that directed SGS into a pre-weighed plastic cup. Total time from weighing to saline
infusion never exceeded 1 h.
A n initial 5 m L blood sample was taken. Then 1,000 m M N a C l was infused at 0.3
ml/min for 60 min. Small blood samples (0.5 mL) were taken at 5 min intervals until
secretion began. A 5 m L sample was taken at the start of secretion (as well as at 5 and 11 h
post-infusion). The 5 m L blood samples were divided into two aliquants: 0.5 m L for
determination of hematocrit, plasma osmolality and ionic concentrations, and 4.5 m L for
determination of hormone concentrations.
The SGS was collected at 30 min intervals for about 2 h and at longer intervals until
secretion stopped. The funnel was rinsed with distilled water and the ion content of the
wash was determined.
Analytical procedures. The analytical procedures used in this study are as described in
Chapter 2.
Calculations and statistics. Time to secretion was the interval between the start of
N a C l infusion and first appearance of SGS in the nares. The increase in each plasma
parameter at the start of secretion was the difference between the pre-infusion value and
value at initiation of SGS. Relative plasma volume (RPV, %) was 100 - Hct (%).
Statistical analyses were performed using S Y S T A T 5.1 (Wilkinson 1990). Sex
differences in body mass, time to secrete, volume of secretion and the total ionic output of
the salt glands were analyzed with independent sample f-tests (with pooled variances).
Blood values from sequential sampling times (pre-infusion, at the start of secretion, and 5
and 11 h post-infusion) were compared using the following statistical model:
Yijk = u + Ti + Sj + B(S) j k + (TS)ij + eyk,
for i of 1 through 4, j of 1 and 2, and k of 1 through 12, where Y p is R P V , Osm pi , or plasma
ion or hormone concentration of the blood sample, T is the effect of time of sample, Sj is
the effect of sex of bird, B(S)jk is the effect of a particular bird nested within each sex, (TS)ij
is the 2-way interaction between time and sex, and is the model error term. Tukey's
H S D test was used to evaluate differences among means. Relationships between variables
were assessed by simple correlation and linear regression. Data are reported as means ± SE.

46
R E S U L T S
Male-female comparisons. Male and female ducks did not significantly differ in body
mass (P = 0.07), plasma ionic concentrations (Table 4.1), Osm pi, R P V , [ A V T ] p i or [AJJJpi
(Table 4.2) at any sampling time. A t the start of secretion, [Cl"]pi had significantly increased
in both sexes, but [Na + ] p i and Osm pi had not (Table 4.1). Males and females did not differ
in the time required to initiate SGS (P = 0.84), the secretion volume (P = 0.68), or SGS
ionic concentrations ([Na +], P = 0.84; [ K + ] , P = 0.85).
The [ A V T ] p i and Osm pi were not correlated in male ducks (r = 0.06; P = 0.23) and only
weakly correlated in female ducks (r2 = 0.31; P = 0.06). [AJTJpi was not correlated with R P V
in either sex (r = 0.00; P = 0.93, both sexes).
Salt gland secretion. With one exception, all ducks secreted spontaneously during
preparation for infusion and ceased secreting before N a C l infusion began. The [Na + J of this
spontaneous SGS ([Na JSGS) varied from 94 to 510 m M and was highly predictive (r =
0.55; P = 0.015) o f the time (min) required to initiate secretion:
Time to secretion = 46.8 - 0.05- [Na+]sGS.
A l l ducks secreted in response to saline infusion with an average [Na + J o f 567 ± 9 m M
(males: 571 ± 10 m M ; females: 564 ± 17 mM) .
Plasma ion concentrations (Na + , K + and CI") at the start o f secretion had increased in
inverse proportion to their pre-infusion values (Fig. 4.1). Before saline was infused, there
was no relationship (P = 0.47) between Osm pi and R P V (Fig. 4.2), but at the start of
secretion Osm p i and R P V were inversely related (Fig. 4.2). A l l birds stopped secreting
two or three h after infusion ceased. At this time about 60% of the infused N a C l had been
excreted,yet R P V and Osm pi, the two stimuli of secretion, were still at their secretory
thresholds, where they remained 11 h post-infusion (Table 4.2).
Time to the beginning of secretion was inversely related to the initial R P V (RPVi ;
Fig. 4.3), but not to initial Osm p i (r = 0.012; P = 0.73). Total SGS volume (Volsos) was
strongly correlated by R P V i (Fig. 4.3), but was unrelated to initial Osm p i (r2 = 0.001; P =
0.91). Therefore, RPVj was also a large determinant of total N a + and K + secretion (Fig.
4.3).

47
Table 4.1. Plasma ionic concentrations (mM) in saline acclimated Pekin
ducks (n = 6 for each sex) before and after N a C l infusion 3. Values are
mean ± SE.
Parameter Male Female
Pre-infusion
N a 152.6 ± 3 . 1 A b 147.4 ± 3 . 5 A
K 2.7 ± 0 . 2 A 2.6 ± 0 . 1 A
C l 100.7 ± 4 . 2 A 107.0 ± 3 . 3 A
Secretion
N a 159.7 ± 3 . 4 A 153.3 ± 2 . 1 A B
K 3.2 ± 0 . 1 A B 2.9 ± 0 .0B
C l 122.2 ± 4.9 B 116.6 ± 2.6 A B
5 hours post-infusion
N a ' 164.8 ± 5 . 8 A 160.9 ± 3 . 1 B C
K 4.7 ± 0.8 B 3.5 ± 0 . 3 C
C l 1 1 9 . 6 ± 3 . 6 B 119.5 ± 6.1 B
11 hours post-infiision
N a 159.7 ± 3 . 5 A 164 ± 1.5 C
K 3.9 ± 0.2 A B 3.5 ± 0 . 1 C
C l 115.3 ± 4.1 B 1 2 1 . 6 ± 2 . 4 B
Ducks infused intravenously with 1000 m M N a C l at 0.3 mL/min for 1
h.
Within each sex, time periods with different letters differ significantly
(PO.05),
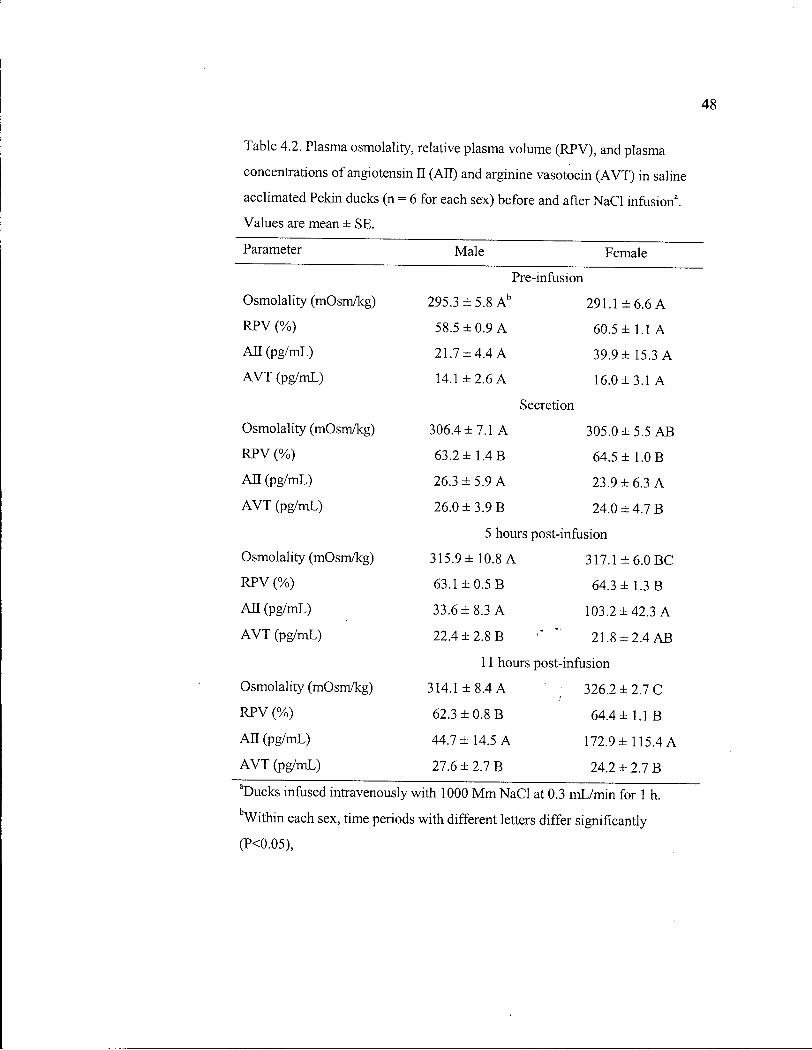
48
Table 4.2. Plasma osmolality, relative plasma volume (RPV), and plasma
concentrations of angiotensin II (AH) and arginine vasotocin (AVT) in saline
acclimated Pekin ducks (n = 6 for each sex) before and after NaCl infusion3.
Values are mean ± SE.
Parameter Male Female
Pre-infusion
Osmolality (mOsm/kg) 295.3 ± 5.8 A b 291.1 ±6.6 A RPV (%) 58.5 ± 0.9 A 60.5 ± 1.1 A A H (pg/mL) 21.7 ± 4.4 A 39.9 ± 15.3 A
A V T (pg/mL) 14.1 ±2 .6 A 16.0 ± 3.1 A
Secretion
Osmolality (mOsm/kg) 306.4 ±7.1 A 305.0 ± 5.5 A B
RPV (%) 63.2 ± 1.4 B 64.5 ± 1.0 B
A n (pg/mL) 26.3 ±5.9 A 23.9 ±6.3 A
A V T (pg/mL) 26.0 ± 3.9 B 24.0 ± 4.7 B
5 hours post-infusion
Osmolality (mOsm/kg) 315.9 ± 10.8 A 317.1 ±6.0 BC
RPV (%) 63.1 ± 0.5 B 64.3 ± 1.3 B
A l l (pg/mL) 33.6 ±8.3 A 103.2 ±42.3 A
A V T (pg/mL) 22.4 ± 2.8 B 21.8 ± 2.4 A B
11 hours post-infusion
Osmolality (mOsm/kg) 314.1 ±8 .4 A 326.2 ± 2.7 C
RPV (%) 62.3 ± 0.8 B 64.4 ± 1.1 B
A H (pg/mL) 44.7 ± 14.5 A 172.9 ± 115.4 A
A V T (pg/mL) 27.6 ± 2.7 B 24.2 ± 2.7 B
"Ducks infused intravenously with 1000 M m NaCl at 0.3 mL/min for 1 h. bWithin each sex, time periods with different letters differ significantly
(PO.05),
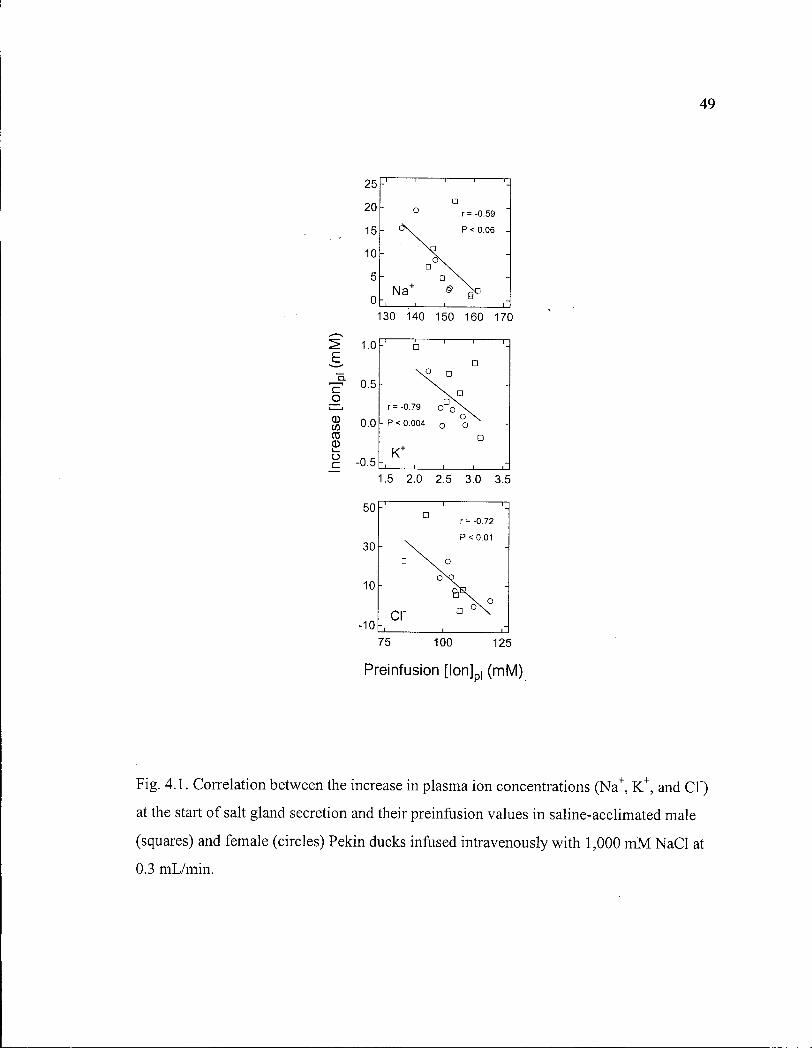
49
25 P
, v u i j 75 100 125
Pre in fus ion [ lon] p l (mM)
Fig. 4.1. Correlation between the increase in plasma ion concentrations (Na + , K + , and CI")
at the start of salt gland secretion and their preinfusion values in saline-acclimated male
(squares) and female (circles) Pekin ducks infused intravenously with 1,000 m M N a C l at
0.3 mL/min.
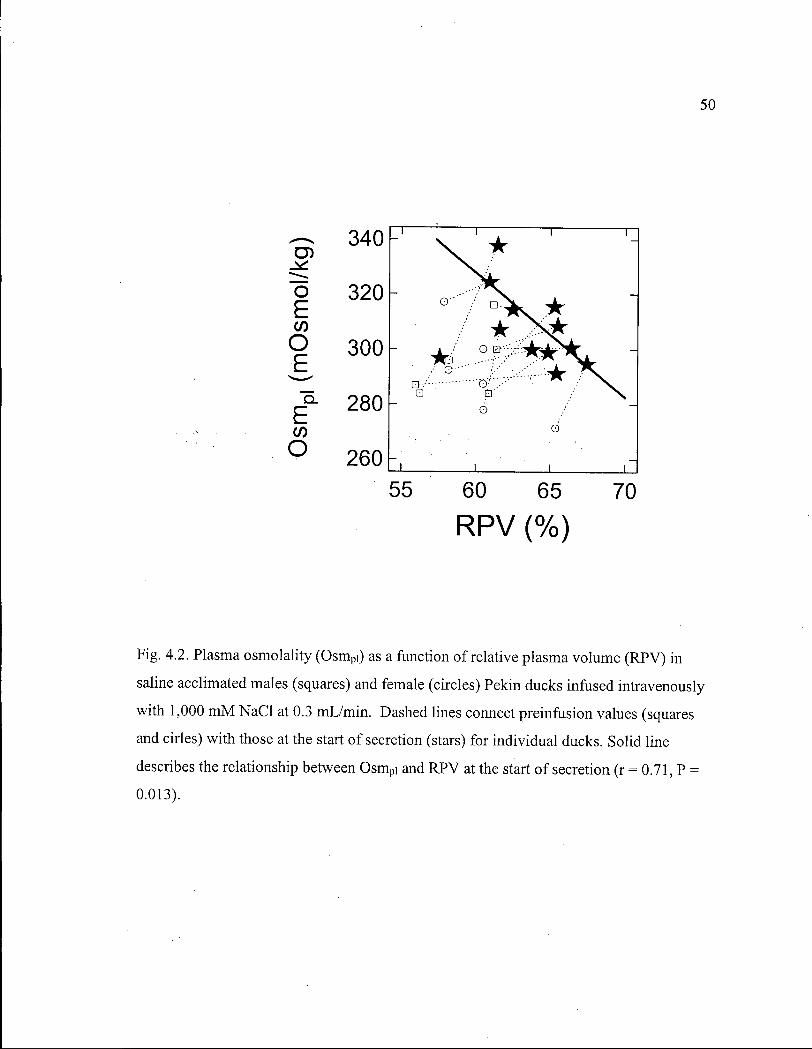
50
Fig. 4.2. Plasma osmolality (Osm pi) as a function of relative plasma volume (RPV) in
saline acclimated males (squares) and female (circles) Pekin ducks infused intravenously
with 1,000 m M N a C l at 0.3 mL/min. Dashed lines connect preinfusion values (squares
and cirles) with those at the start of secretion (stars) for individual ducks. Solid line
describes the relationship between Osm p i and R P V at the start of secretion (r = 0.71, P =
0.013).

51
P r e i n f u s i o n R P V . ( % )
Fig. 4.3. Relationship of time to secrete, volume of secretion, and total amount of N a + and
K + secreted to preinfusion relative plasma volume (RPV) in saline acclimated males
(squares) and female (circles) Pekin ducks infused intravenously with 1,000 m M N a C l at
0.3 mL/min.

52
D I S C U S S I O N
Male and female ducks did not differ in the duration of saline infusion required to
initiate secretion or the volume and concentration of SGS they produced. Ducks drank 225
m M NaCl , ad libitum, and should have turned over half of their body's N a + content daily
without altering Osm pi . In a previous study (Hughes et al. 1992), when ducks drank 375
m M NaCl , males had higher Osm p i and produced more concentrated SGS than did females,
and when they drank 450 m M NaCl , some males died (Hughes et al 1992). If sexual
disparity exists in either initiation of SGS or extrarenal N a C l excretion, the differences may
be demonstrable only at drinking water salinities greater than those used in this study.
Ducks sometimes secrete spontaneously when they are handled (Ash 1969; Hughes
1970), which Peaker and Linzell (1975) suggested was due to stress. With one exception the
birds in this study were secreting at a slow rate before they were handled, but stopped
secreting during the placement of the catheters. This suggests handling stress might inhibit
secretion. The mechanisms that induce spontaneous secretion are unclear, since it occurs at
lower Osm pi and R P V than predicted as requisite for secretion (Fig. 4.2).
The role of E C F V expansion in initiating SGS has been debated for a long time (Hughes
1989b). Holmes (1965) suggested volume or stretch receptors (rather than osmoreceptors)
triggered secretion, and it has been induced by expanding E C F V without increasing Osm pi
(Gilmore et al. 1977; Gray et al. 1986; Bokenes and Mercer 1995). However, some
infusates used in these studies were hyperchloretic, and elevated [Cl"] pi may have triggered
secretion. In contrast, ducks denied drinking water for a protracted period eventually
secreted despite reduced E C F V , which supports osmotic stimulation (Stewart 1972).
Several studies have suggested that total E C F V or the interstitial portion of it (Kaul and
Hammel 1979; Hammel et al. 1980), or change in these volumes (Ruch and Hughes 1975;
Hughes 1989a), affect the response of the salt glands to increased Osm p i . Here I give the
first description of the relative stimulatory contributions of Osm p i and R P V for initiating
SGS (Fig. 4.2).
Osm pi and R P V changed simultaneously during saline infusion. Eventually each
individual achieved a unique new relationship between Osm pi and R P V that triggered SGS.
53
This combination was positioned on a continuum describing all birds (Fig. 4.2). Some
ducks secreted when R P V was markedly increased, but their Osm p i changed little or not at
all, whereas others secreted when Osm pi increased with little discernible change in R P V
(Fig. 4.2). M y results provide strong evidence that changes in Osm pi and R P V initiate
secretion interactively and that increases in Osm pi and R P V appear to be equally effective
stimuli (Fig. 4.2). They also reconcile the disparate conclusions that both E C F V expansion
(Ruch and Hughes 1975, Hughes 1989a) and E C F V reduction (i.e. dehydration; Stewart
1972) can induce secretion. They are also consistent with the observation that volume input
drives about half the signal sustaining SGS in ducks previously primed by N a C l infusion
(Hammel and Simon, 1994; Bokenes and Mercer, 1995).
This study demonstrates, for the first time the influence of ducks' physiological state
prior to saline loading on the level of response by their salt glands (Figs. 4.1, 4.3). Ducks
with low pre-infusion plasma ionic concentrations required larger increases in their
plasma ion concentrations to initiate SGS (Fig. 4.1). Ducks with a small RPVj took longer
to secrete and secreted less of the load than ducks with a larger RPVj . Pre-infusion R P V
was therefore a strong determinant of the time it took to initiate SGS and the amount
secreted (Fig. 4.3). These relationships indicate the importance o f the volume and
concentration of the extracellular fluid on the ability to secrete an imposed saline load.
What underlies the high individual variation in the contributions of extracellular fluid
volume and concentration (Fig. 4.2) remains to be shown.
Sufficient saline (60 min infusion of 1,000 m M NaCl) was infused to increase the
body's N a + content about 20%. This induced secretion in all birds within 50 min (Fig. 4.3).
At the beginning of secretion, mean values of R P V and [ A V T ] p i were elevated, but those of
Osm pi and [AJJ]P! were not (Table 4.2). A l l birds ceased to secrete within two or three h
post-infusion when up to 40% of the infused N a C l remained unexcreted. At that time they
were dehydrated because body water had been used to form secretion, and they did not
drink during the experiment. Although R P V and Osm pi, the two stimuli of secretion, were
still at the secretory threshold, the increase in [AJJ]pi, while not statistically significant, may
have been great enough to inhibit secretion (Gray et al. 1986).

54
A positive relationship between [AVT] p i and Osm pi was described for ducks sampled
before and after saline acclimation (Mohring et al. 1980) and dehydration (Gray and Simon
1983). Based on these observations, elevation of Osm pi is considered the primary factor
regulating increase in [ A V T ] p i in ducks (Gray and Simon 1983) and other birds with salt
glands (Gray and Erasmus 1989b). In the present study there was a tendency for Osm p i to
increase over time (significant in females), but [ A V T ] p i did not change after secretion
started (Table 4.2). Zenteno-Savin (1991) found that ducks increased [ A V T ] p i in parallel
with increases in drinking water salinity, but did not increase Osm p i . Under a similar
protocol Gray and Erasmus (1989c) found Kelp Gulls (Larus dominicanus) gradually
increased Osm pi without altering [ A V T ] p i . The relationship between Osm pi and [ A V T ] p i in
birds with salt glands remains puzzling.
In summary, male and female ducks did not differ in secretory thresholds and/or
secretory-competence. These experiments (^.demonstrate the influence of the ducks'
osmotic state, especially the R P V , prior to saline loading on N a C l secretion by the salt
glands; (2) describe secretory threshold as a dynamic interaction of changes in both Osm pi
and E C F V (indexed as R P V ) ; and (3) suggest that Osm pi and R P V may be equally effective
stimulators of secretion.
55
CHAPTER FIVE. EFFECT OF SALINE INTAKE ON OSMOTIC
HOMEOSTASIS IN THREE SPECIES OF WILD DUCKS.
INTRODUCTION
A l l marine birds have salt glands that secrete hypertonic N a C l . Together with the
kidneys, these glands maintain body fluid homeostasis, despite the excess sodium
chloride (NaCl) these birds ingest. Much of our understanding of the fundamental
mechanisms of osmoregulation in birds with salt glands is derived from studies of
domestic Pekin ducks (Anas platyrhynchos). However, Pekin ducks maintain water and
osmotic balance only when they drink salinities less than 300 m M N a C l (Chapter 2).
Salinity may be an important barrier to habitat selection by ducks (Nystrom and
Pehrsson 1988), presumably because their salt glands cannot secrete the excess N a C l they
would ingest in higher salinity habitats. The capacity to secrete excess N a C l extra-renally
has been correlated with habitat choice of Charadriiform birds (Stalland 1967, 1968).
This suggests that the concentrating capacity of their salt glands may also limit
distribution of ducks, although this has not been demonstrated. In Chapter 2,1 showed
that concentrating capacity of the Pekin duck salt gland limits tolerable drinking water
salinity to 300 m M N a C l , but they can secrete nearly 600 m M N a + in response to
intravenous saline infusion (Chapter 4). There has been no detailed examination of
salinity tolerance and the function of the osmoregulatory organs that achieve this in adult
wild ducks that utilize saline habitats.
In this study, I compared the effect of saline intake on osmotic homeostasis among
three species of wi ld ducks: Mallards (tribe Anatini, Anas platyrhynchos), Canvasbacks
(tribe Aythyini, Aythya valisineria) and Barrow's Goldeneyes (tribe Mergini , Bucephala
islandica). These were selected to represent the range of salinities encountered in natural
habitats. Mallards occupy freshwater or terrestrial habitats, but may winter along the
coast in estuaries.. Canvasbacks winter along the coast, on brackish lagoons and estuaries,
while Barrow's Goldeneyes (hereafter Goldeneyes) winter mostly along coasts, on
estuaries and saltwater bays.
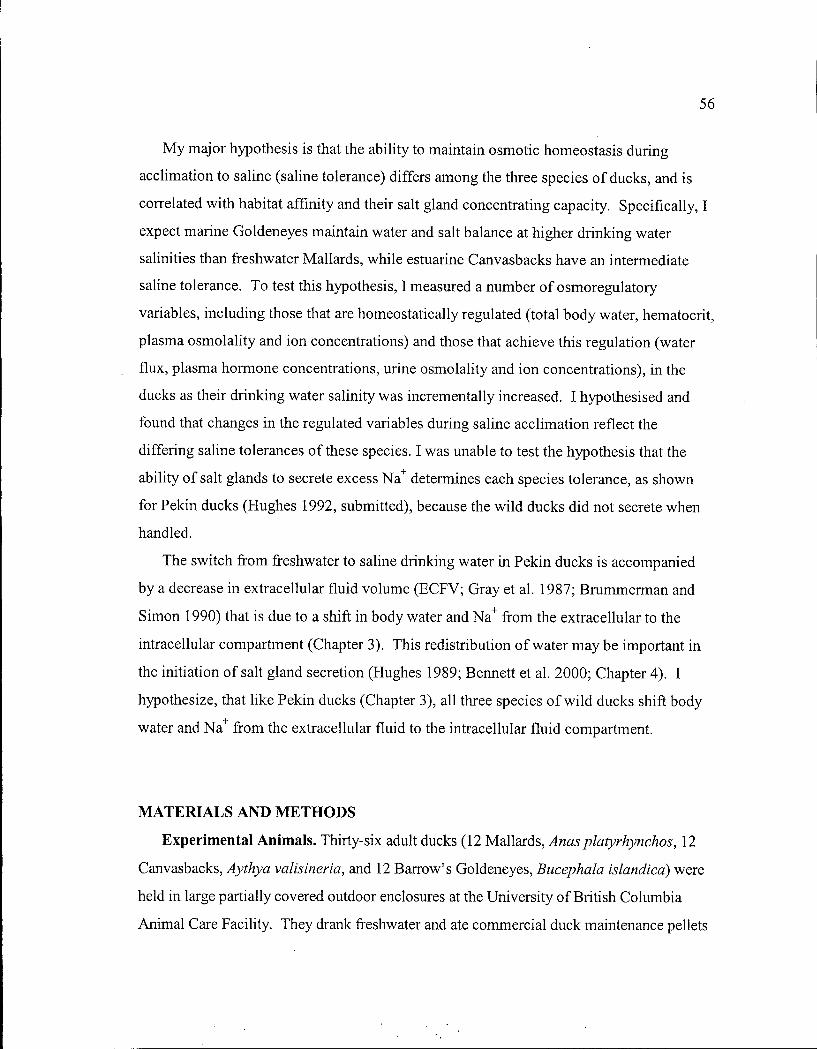
56
M y major hypothesis is that the ability to maintain osmotic homeostasis during
acclimation to saline (saline tolerance) differs among the three species of ducks, and is
correlated with habitat affinity and their salt gland concentrating capacity. Specifically, I
expect marine Goldeneyes maintain water and salt balance at higher drinking water
salinities than freshwater Mallards, while estuarine Canvasbacks have an intermediate
saline tolerance. To test this hypothesis, I measured a number of osmoregulatory
variables, including those that are homeostatically regulated (total body water, hematocrit,
plasma osmolality and ion concentrations) and those that achieve this regulation (water
flux, plasma hormone concentrations, urine osmolality and ion concentrations), in the
ducks as their drinking water salinity was incrementally increased. I hypothesised and
found that changes in the regulated variables during saline acclimation reflect the
differing saline tolerances of these species. I was unable to test the hypothesis that the
ability of salt glands to secrete excess N a + determines each species tolerance, as shown
for Pekin ducks (Hughes 1992, submitted), because the wi ld ducks did not secrete when
handled.
The switch from freshwater to saline drinking water in Pekin ducks is accompanied
by a decrease in extracellular fluid volume ( E C F V ; Gray et al. 1987; Brummerman and
Simon 1990) that is due to a shift in body water and N a + from the extracellular to the
intracellular compartment (Chapter 3). This redistribution of water may be important in
the initiation of salt gland secretion (Hughes 1989; Bennett et al. 2000; Chapter 4). I
hypothesize, that like Pekin ducks (Chapter 3), all three species of wi ld ducks shift body
water and N a + from the extracellular fluid to the intracellular fluid compartment.
M A T E R I A L S A N D M E T H O D S
Experimental Animals . Thirty-six adult ducks (12 Mallards, Anas platyrhynchos, 12
Canvasbacks, Aythya valisineria, and 12 Barrow's Goldeneyes, Bucephala islandica) were
held in large partially covered outdoor enclosures at the University of British Columbia
Animal Care Facility. They drank freshwater and ate commercial duck maintenance pellets

57
(Buckerfield's, Abbottsford, B . C . ; 12.7% water, 17% protein, 2750 kcal/kg, and [Na +], [ K + ] ,
and [CL] 83, 153.5 and 99 mmol/kg, respectively) ad libitum. Drinking water, presented in
70 L wading pools, was replenished twice daily. For four weeks prior to the experiments,
ducks were repeatedly caught, weighed, and bled to accustom them to the experimental
procedures.
Experimental procedures.
Experiment 1. Response to saline acclimation. The procedures used in this study to
examine the response of the ducks to saline acclimation are as described for Pekin ducks
in Chapter 2. The following modifications to the protocol were made. On day 5, ureteral
urine was collected into a modified 1.5 ml lubricated plastic centrifuge tube inserted
through the vent. Plasma for hormone analysis was extracted using acetone (Gray and
Simon 1983, 1985) instead of Sep-Pak C-18.
Experiment 2. Body water and sodium compartmentalization. Thirty-four adult
ducks (twelve Mallards, ten Canvasbacks and twelve Barrow's Goldeneyes) were used in
this experiment and maintained as described in Chapter 2. Ha l f the individuals of each
species drank freshwater, while the other half drank 300 m M N a C l for at least one year
prior to this experiment.
Procedures used in this experiment to determine the fluid compartments of the ducks
in this experiment are as described in Chapter 3. The following modifications to the
protocol were made. I used 1 4 C- inu l in instead of 1 4 C - P E G as a marker of extracellular
fluid. After an initial blood sample (Mallards: 1 mL, Canvasbacks and Goldeneyes: 3
mL) was taken, then 7.4 u,Ci of 3H20 and 3.1 p C i of 1 4 C- inu l in were injected. Four to six
blood samples (0.3 mL) were collected between two and eight min post-injection, and
five blood samples (0.5 mL) were taken at 15 min intervals between 60 and 120 min post-22
injection. Then 2 p C i of N a were injected and 60 min later 1 m L of blood was taken. 22
Mallards were not injected with Na. A l l calculations are as described in Chapter 3.
Statistics. Data are reported as means ± standard errors and statistically analyzed using
S Y S T A T 9 for Windows (SPSS Science, Chicago, IL). Relative plasma volume (RPV) is
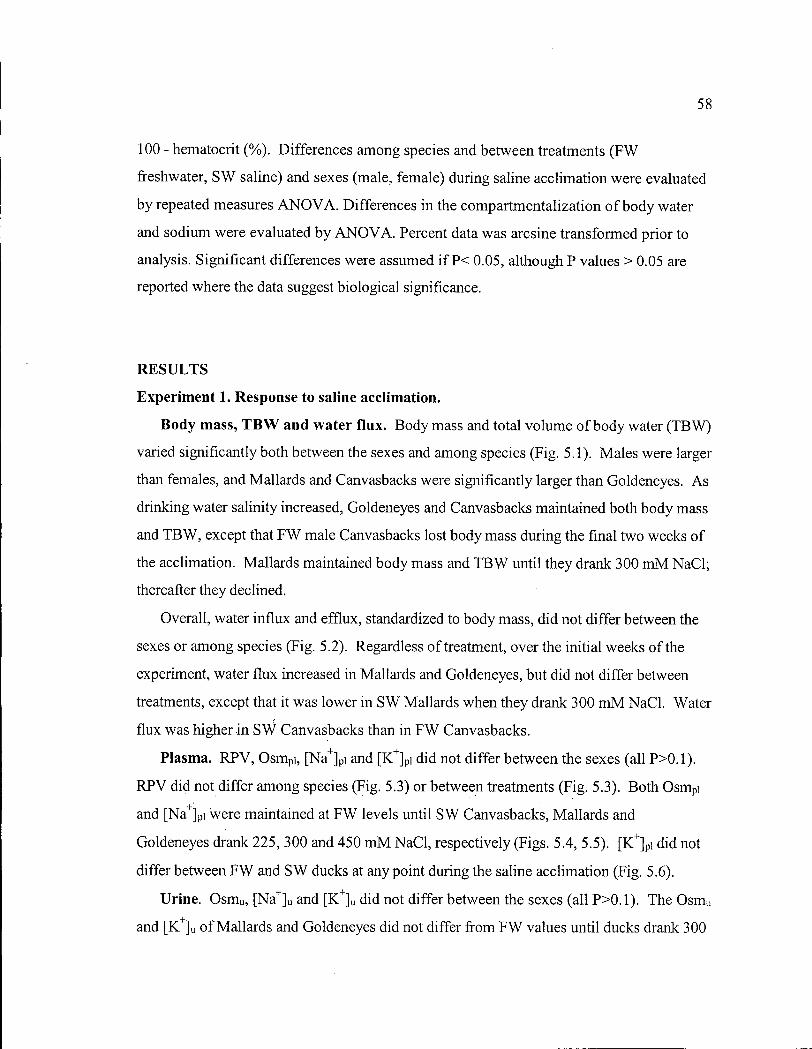
58
100 - hematocrit (%). Differences among species and between treatments (FW
freshwater, S W saline) and sexes (male, female) during saline acclimation were evaluated
by repeated measures A N O V A . Differences in the compartmentalization of body water
and sodium were evaluated by A N O V A . Percent data was arcsine transformed prior to
analysis. Significant differences were assumed i f P< 0.05, although P values > 0.05 are
reported where the data suggest biological significance.
R E S U L T S
Experiment 1. Response to saline acclimation.
Body mass, T B W and water flux. Body mass and total volume of body water (TBW)
varied significantly both between the sexes and among species (Fig. 5.1). Males were larger
than females, and Mallards and Canvasbacks were significantly larger than Goldeneyes. As
drinking water salinity increased, Goldeneyes and Canvasbacks maintained both body mass
and T B W , except that F W male Canvasbacks lost body mass during the final two weeks of
the acclimation. Mallards maintained body mass and T B W until they drank 300 m M N a C l ;
thereafter they declined.
Overall, water influx and efflux, standardized to body mass, did not differ between the
sexes or among species (Fig. 5.2). Regardless of treatment, over the initial weeks of the
experiment, water flux increased in Mallards and Goldeneyes, but did not differ between
treatments, except that it was lower in S W Mallards when they drank 300 m M NaCl . Water
flux was higher in S W Canvasbacks than in F W Canvasbacks.
Plasma. R P V , Osm p i , [Na +] pi and [ K + ] p i did not differ between the sexes (all P>0.1).
R P V did not differ among species (Fig. 5.3) or between treatments (Fig. 5.3). Both Osm pi
and [Na +] pi were maintained at F W levels until S W Canvasbacks, Mallards and
Goldeneyes drank 225, 300 and 450 m M NaCl , respectively (Figs. 5.4, 5.5). [ K + ] p i did not
differ between F W and S W ducks at any point during the saline acclimation (Fig. 5.6).
Urine. Osm u , [Na + ] u and [ K + ] u did not differ between the sexes (all P>0.1). The Osm u
and [ K + ] u of Mallards and Goldeneyes did not differ from F W values until ducks drank 300

59
and 550 m M N a C l , respectively, when they became significantly elevated; they were
unchanged in Canvasbacks, except for a transient elevation in Osm u when S W Canvasbacks
drank 150 m M N a C l (Fig. 5.4). [Na + ] u increased in all three species when they drank 75
m M NaCl . [Na + ] u was maintained thereafter in Goldeneyes, but decreased in Canvasbacks
and Mallards when they drank 225 and 300 m M N a C l , respectively (Fig. 5.5).
Salt gland secretion. The ducks did not secrete spontaneously when handled, so I was
not able to collect salt gland secretions from ducks during saline acclimation.
Osmoregulatory hormones. [ A V T ] p i and [AJTJpi did not differ between the sexes nor
were they affected by saline acclimation (Fig. 5.7).
Experiment 2 . Body water and sodium compartmentalization.
T B W , standardized to body mass, did not differ between the sexes (P=0.8) nor among
species (P=0.1) and was unaffected by saline acclimation (P=0.4; Fig . 5.8). Total
exchangeable sodium pool was not measured in Mallards. It was larger in Goldeneyes
than in Canvasbacks (P=0.006; Fig. 5.9). Among ducks drinking freshwater, E C F V (Fig.
5.8) and extracellular N a + pool (Fig. 5.9) were significantly larger in Goldeneyes than
either Canvasbacks or Mallards. Both volume and sodium content of the extracellular
fluid were decreased following saline acclimation in Goldeneyes (P=0.009, P=0.02,
respectively), but not in Mallards or Canvasbacks (all P>0.1), and were therefore, not
different among species following saline acclimation (Figs. 5.8, 5.9).
DISCUSSION
Response to saline acclimation. Maintenance of the volume and concentration of
body fluids within narrow limits is a fundamental physiological requirement of birds. In
this study I examined the effect of saline intake on osmotic homeostasis among three
species of wi ld ducks that differ in their habitat affinity and diet: freshwater Mallards,
estuarine Canvasbacks and marine Goldeneyes. I hypothesized that osmotic balance is
maintained at higher drinking water salinities in Goldeneyes than Mallards, and that

60
M a l l a r d C a n v a s b a c k G o l d e n e y e
1300F
—'—i—i—•—i—.—i—i—u u — , — i — , i , i , a n . i . i . i . ,-| 0 150 300 450 600 0 150 300 450 600 0 150 300 450 600
Dr ink ing wa te r sal in i ty ( m M N a C l )
Fig 5.1. Body mass and total body water (TBW) of male (squares) and female (circles) Mallards (Anasplatyrhynchos), Canvasbacks (Aythya valisineria) and Barrow's Goldeneyes (Bucephala islandica) in relation to drinking water salinity. Open and filled circles represent freshwater ducks and saline acclimated ducks, respectively. Values are means ± standard errors.
61
Ma l la rd C a n v a s b a c k G o l d e n e y e
400 K u • ; i j L
- i — . — i — . — i — . — i — • — , i . i , i , a u , i . i . . . .1 0 150 300 450 600 0 150 300 450 600 0 150 300 450 600
Drink ing water sal ini ty ( m M N a C l )
Fig. 5.2. Water flux (influx and efflux) standardized to body mass of male (squares) and female (circles) Mallards (Anas platyrhynchos), Canvasbacks (Aythya valisineria) and Barrow's Goldeneyes (Bucephala islandica) in.relation to drinking water salinity. Open and filled circles represent freshwater ducks and saline acclimated ducks, respectively. Values are means ± standard errors.

62
M a l l a r d C a n v a s b a c k G o l d e n e y e
J — . — i — i — i — , — i — , • CJ , i ._j , i r I i i i 1 0 150 300 450 600 0 150 300 450 600 0 150 300 450 600
Dr ink i ng w a t e r sa l in i ty ( m M N a C l )
Fig. 5.3 Relative plasma volume (100 - hematocrit) of Mallards (Anas platyrhynchos), Canvasbacks (Aythya valisineria) and Barrow's Goldeneyes (Bucephala islandica) in relation to drinking water salinity. Open and filled symbols represent freshwater ducks and saline acclimated ducks, respectively. Values are means ± standard errors.
63
Mal la rd C a n v a s b a c k G o l d e n e y e
4ior
—'—.—i—.—i—.—i—.—o •—,—i . i , i , a r -t 0 150 300 450 600 0 150 300 450 600 0 150 300 450 600
Drinking water salinity ( m M N a C l )
Fig. 5.4. Plasma and urine osmolality and their ratio (Urine .-Plasma) of Mallards (Anas platyrhynchos), Canvasbacks (Aythya valisineria) and Barrow's Goldeneyes (Bucephala islandica) in relation to drinking water salinity. Open and filled symbols represent freshwater ducks and saline acclimated ducks, respectively. Values are means ± standard errors.

64
Ma l la rd C a n v a s b a c k G o l d e n e y e
200 r
- i — . — i — . — i — . — i — . • • ._ j , i , • • I~I r i i i i i i i • i ~i
0 150 300 450 600 0 150 300 450 600 0 150 300 450 600
Drink ing water sal ini ty ( m M N a C l )
Fig. 5.5. Plasma and urine sodium concentration and their ratio (Urine:Plasma) of Mallards (Anasplatyrhynchos), Canvasbacks (Aythya valisineria) and Barrow's Goldeneyes (Bucephala islandica) in relation to drinking water salinity. Open and filled symbols represent freshwater ducks and saline acclimated ducks, respectively. Values are means ± standard errors.
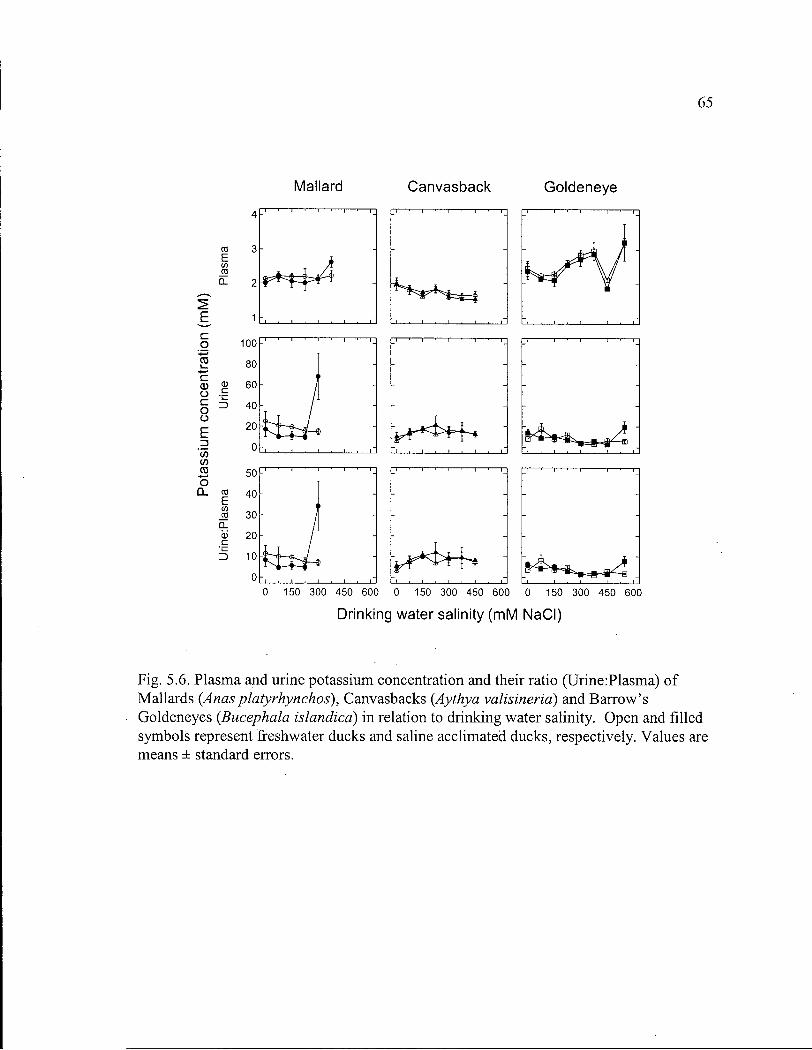
65
Mal la rd C a n v a s b a c k G o l d e n e y e
Dr ink ing water sal ini ty ( m M N a C l )
Fig. 5.6. Plasma and urine potassium concentration and their ratio (Urine:Plasma) of Mallards (Anasplatyrhynchos), Canvasbacks (Aythya valisineria) and Barrow's Goldeneyes (Bucephala islandica) in relation to drinking water salinity. Open and filled symbols represent freshwater ducks and saline acclimated ducks, respectively. Values are means ± standard errors.
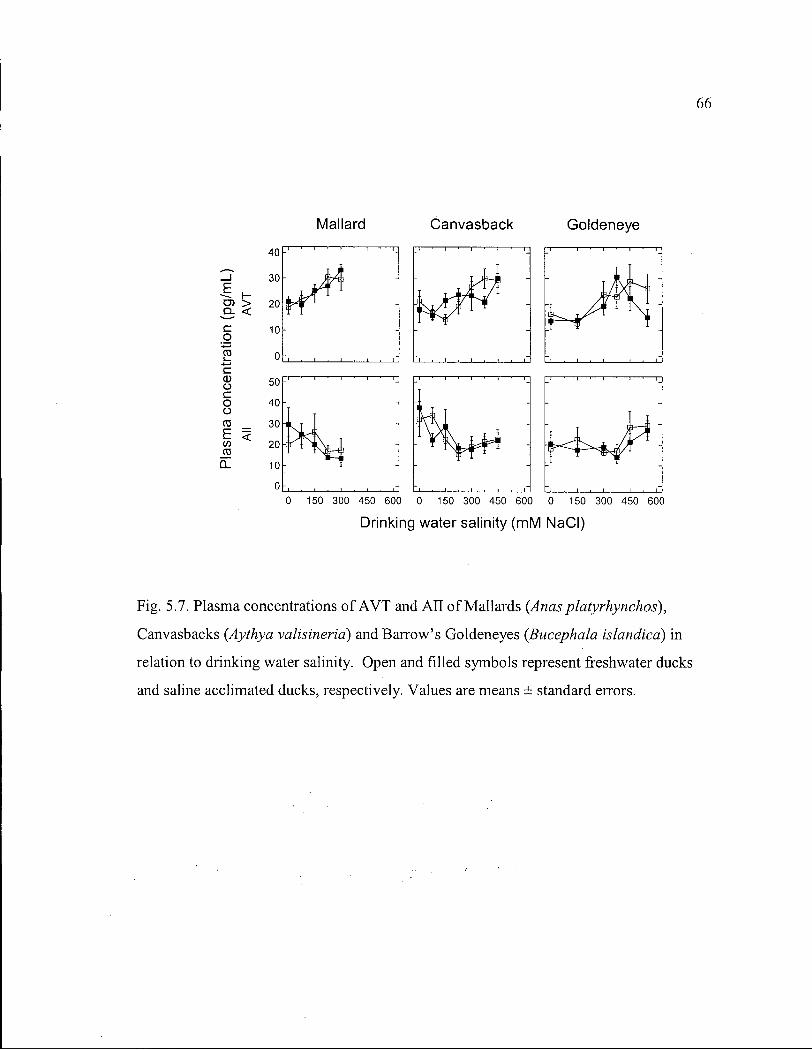
66
Ma l la rd C a n v a s b a c k G o l d e n e y e
-j , i . i . i , • • , i , i , i • n r i 0 150 300 450 600 0 150 300 450 600 0 150 300 450 600
Drink ing water sal ini ty ( m M N a C l )
Fig. 5.7. Plasma concentrations of A V T and A l l of Mallards (Anas platyrhynchos),
Canvasbacks (Aythya valisineria) and Barrow's Goldeneyes (Bucephala islandica) in
relation to drinking water salinity. Open and filled symbols represent freshwater ducks
and saline acclimated ducks, respectively. Values are means ± standard errors.
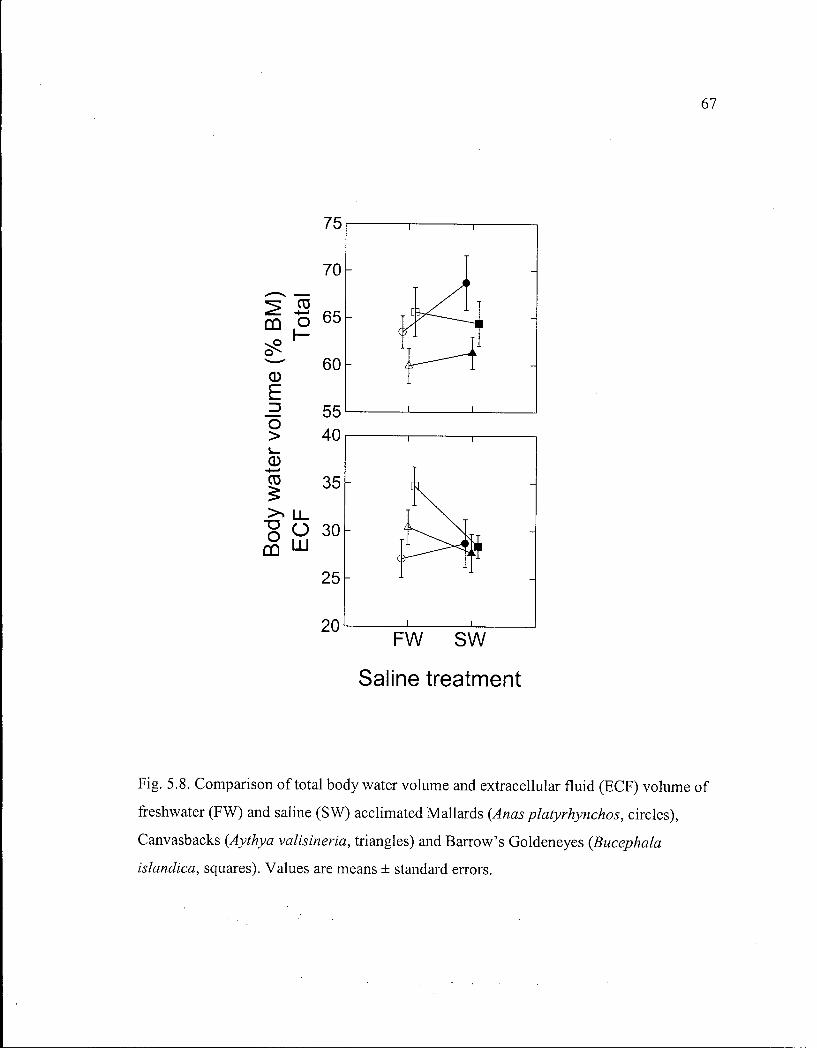
67
75
7 0 -
S a l i n e t r e a t m e n t
Fig. 5.8. Comparison of total body water volume and extracellular fluid (ECF) volume of
freshwater (FW) and saline (SW) acclimated Mallards (Anas platyrhynchos, circles),
Canvasbacks (Aythya valisineria, triangles) and Barrow's Goldeneyes (Bucephala
islandica, squares). Values are means ± standard errors.
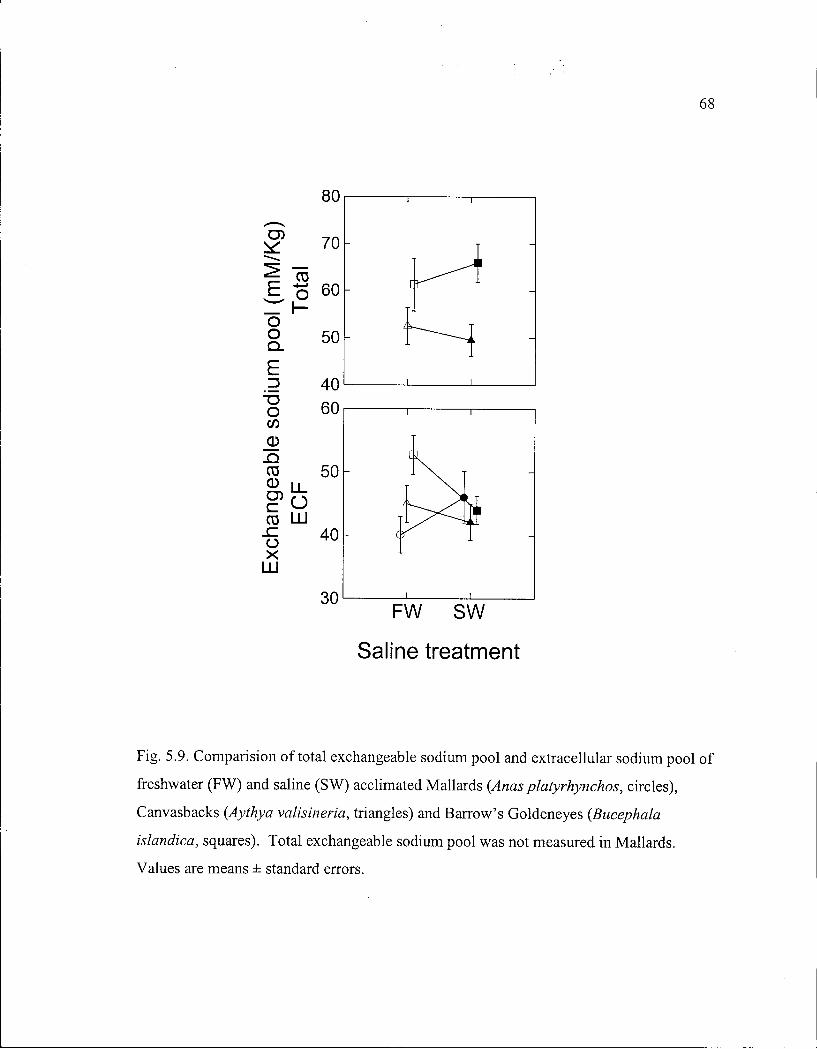
68
Fig. 5.9. Comparision of total exchangeable sodium pool and extracellular sodium pool of
freshwater (FW) and saline (SW) acclimated Mallards (Anas platyrhynchos, circles),
Canvasbacks (Aythya valisineria, triangles) and Barrow's Goldeneyes (Bucephala
islandica, squares). Total exchangeable sodium pool was not measured in Mallards.
Values are means ± standard errors.
69
Canvasbacks have an intermediate saline tolerance (Goldeneyes>Canvasback>Mallards).
In general, the results support this hypothesis, but the mechanisms by which they do so
are not altogether clear.
Mallards maintained T B W (Fig. 5.1), Osm p i (Fig. 5.4) and [Na] pi (Fig. 5.5) until
drinking salinity exceeded 225 m M N a C l . Then they decreased water flux (Fig. 5.2) and
lost body water (Fig. 5.1). Both Canvasbacks and Goldeneyes maintained T B W (Fig.
5.1) and water flux (Fig. 5.2) even when drinking 450 m M N a C l , the saline equivalent of
full strength seawater. However, Canvasbacks, but not Goldeneyes, increased Osm p i and
[Na] pi when drinking water N a + concentration exceeded that of plasma (Fig. 5.4,5.5).
These findings are consistent with those seen in Pekin ducks (Chapter 2). I found that as
Pekin ducks approached their maximum tolerable drinking water salinity, their body
water increased in concentration at a lower drinking water salinity (254 m M NaCl) than it
decreased in volume (335 m M N a C l ; Chapter 2).
The ability of ducks to maintain osmotic balance seems unrelated to [ A V T ] p i and
[AJT]pi, hormones that regulate renal water uptake and plasma distribution (Gray 1998). The
concentration of neither hormone differed between ducks drinking freshwater and ducks
drinking saline (Fig. 5.7). As in previous studies of Pekin ducks (Zenteno-Savin 1991;
Hughes et al. submitted; Chapter 2), [AJTJpi declined during the early stages of this
experiment in both Mallards and Canvasbacks. If this decline is due to gradual reduction of
handling stress (Chapter 2), it is puzzling that it was not observed in Goldeneyes.
Based on my observation of Pekin ducks, I predicted that the concentration of
spontaneous salt gland secretion produced by each species would determine the maximum
salinity it could tolerate. However, none of the ducks secreted when handled, so I could not
determine salt gland secretion concentration. The tolerable drinking water salinities of the
three species of ducks suggest Mallards, like Pekin ducks, should produce a salt gland
secretion slightly more concentrated than 300 m M N a + , and that Canvasbacks and
Goldeneyes produce a secretion at least as concentrated as 450 and 550 m M N a + . When I
subsequently obtained salt gland secretions from ducks infused with 500 m M N a C l , I
found all three species made secretion with a concentration greater than 600 m M N a + and
70
that the concentration did not differ among the species (Chapter 6, Table 6.2). Salt gland
secretion rate did differ among the three species and was highest in Goldeneyes (Chapter
6, Table 6.2). When infused with 500 m M N a C l , only Goldeneyes secreted all the
infused N a + via their salt glands. Mallards excreted all the infused N a + by the combined
outputs of their kidney and salt glands, but Canvasbacks did not excrete all infused N a + .
It is puzzling that Canvasbacks can drink more concentrated saline than Mallards can, but
are less efficient at eliminating N a + when infused with saline.
Canvasbacks, like other species of ducks (Bevan et a l l 995; de Leeuw et al.1999;
Chapter 2; Fig. 5.2), have high water flux rates and should incur a substantial N a + load
when they drink saline. Yet my saline infusion study (Chapter 6) indicated that they are
unable to excrete this amount of N a + . This paradox could be satisfied i f the gut did not
absorb all the ingested N a + . There is some evidence that this may be so. Pekin ducks
drink approximately 225 mL- kg"1- d"1 (Fletcher and Holmes 1968; Chapter 2). If they
drink 300 m M N a C l , their estimated N a + flux would be 67.5 m M - kg"1- d"1, but N a + flux 22 1 1
measured by N a turnover was only 21.4 m M - kg" - d" (Roberts and Hughes 1984). I
did not measure drinking rate or N a + turnover as part of this study, but recently did so in
Goldeneyes (Bennett and Hughes, unpublished data). They drank 180 mL- kg"1- d"1 of
300 m M N a C l , indicating a N a + flux of 54 m M - kg"1- d"1, yet had a measured N a + flux of
only 30
m M - kg"1- d"1. I plan to examine this discrepancy in Mallards and Canvasbacks.
Body water compartmentalization. Concentrations and volumes of body water
determined during saline acclimation reflect water and sodium intake and excretion, but
not their distribution within the birds' bodies. Therefore, in the next experiment, I
measure the effect of saline acclimation on the distribution of body water and sodium
between the extracellular and intracellular compartments. I hypothesize that, like Pekin
ducks (Chapter 3), all three species of ducks shift body water and N a + from the
extracellular fluid to the intracellular fluid compartment, when they drink saline.
When ducks drank freshwater, all three species had a similar T B W , relative to body
mass, but E C F V was larger in Goldeneyes than in Canvasbacks or Mallards (Fig. 5.8).
71
During saline acclimation water and N a + moved out of the extracellular and into the
intracellular compartment only in Goldeneyes (Figs. 5.8, 5.9). Salt gland secretion is
initiated by two interactive stimuli: increased extracellular volume and increased
extracellular concentration (Hammel et al. 1980; Chapter 4): Redistribution of fluid and
sodium into the intracellular compartment may be important in stimulation of secretion. A
larger intracellular sodium pool in saline acclimated ducks (Gray et al. 1987; Erbe et al.
1988; Chapter 3) may prevent more of the ingested sodium from entering the cells (Ruch
and Hughes 1975). This would raise the osmotic concentration of the extracellular fluid and
help to trigger salt gland secretion. A n increased extracellular concentration would also
draw water out of the cell and rapidly expand the E C F V , the second stimulus for salt gland
secretion. Expansion of the E C F V may be the more important of the two stimuli, as
increased plasma sodium concentration without concomitant expansion of the E C F V failed
to elicit salt gland secretion in Pekin ducks (Ruch and Hughes 1975; Hughes 1989).
Assuming that redistribution of fluid and N a + contributes to saline tolerance, it is not
surprising that Mallards do not redistribute fluid. Mallards usually occupy freshwater
habitats, but may winter in estuaries along the coast. They are not very tolerant of saline
(Schmidt-Nielson and K i m 1963; Experiment 1), although individuals previously
acclimated to saline can be maintained on 300 m M N a C l for long periods of time (Hughes
et al. 1999). However, Pekin ducks shift water and N a + into the cells in response to saline
acclimation (Chapter 3) and are more saline tolerant than Mallards (Schmidt-Nielson and
K i m 1963) from which they were derived. This mechanism may explain the difference in
saline tolerance between Mallards and Pekin ducks. It is surprising that Canvasbacks did
not redistribute fluid from the extracellular to the intracellular compartment, yet appear very
tolerant of saline (Experiment 1).
In summary, I acclimated three species of ducks to increasingly saline drinking water.
I hypothesized that Goldeneyes maintain water and salt balance at higher drinking water
salinities than Mallards, and that estuarine Canvasbacks have an intermediate saline
tolerance. Canvasbacks and Goldeneyes both maintained water balance at all drinking
water salinities tested, but Mallards lost homeostatic control of body water volume and
72
concentration when they drank 225 m M N a C l . These results support my hypothesis that
Goldeneyes maintain osmotic balance at higher drinking water salinities than freshwater
Mallards, but not that Canvasbacks have an intermediate saline tolerance.
I was unable to test my hypothesis that the maximum drinking water salinity that each
duck species tolerates is determined by the maximum concentrating capacity of their salt
glands because ducks did not secrete spontaneously when handled. When ducks drank
freshwater, Goldeneyes, the most marine species, had a similar T B W , but larger E C F V ,
than Canvasbacks or Mallards, and when they drank saline, only Goldeneyes shifted
extracellular water and N a + into the intracellular compartment. Redistribution of body
water and N a + is an important component in saline tolerance of marine duck.
73
CHAPTER SIX. COMPARISON OF RENAL AND SALT GLAND FUNCTION IN
THREE SPECIES OF WILD DUCKS.
INTRODUCTION
Three processes central to osmoregulation in marine birds are: filtration of sodium (Na +)
and water from the plasma by the kidneys, reabsorption of filtered water and N a + by cells
along the renal tubules, and secretion of N a + by the salt glands. These processes must have
simultaneously evolved to adapt to the osmoregulatory requirements of birds that use
habitats of widely disparate salinities ranging from freshwater to full strength seawater.
Renal filtration of marine birds is unaffected by either acclimation to saline or acute saline
loading and these birds reabsorb almost all the filtered N a + (and water) along the renal
tubules regardless of [Na +] pi (Hughes 1995). The reabsorbed N a + can be secreted by the salt
glands in less water than was imbibed with it. The concentration and rate of salt gland
secretion determines the amount of osmotically free water it can generate for the birds'
other physiological processes (Schmidt-Nielsen et al. 1960).
Many species of ducks switch seasonally between freshwater and saline habitats. When
the drinking water of Pekin ducks is changed from freshwater to saline, their salt glands
hypertrophy, enhancing their capacity to excrete salt (Schmidt-Nielson and K i m 1964).
Saline intake also appears to have little effect on glomerular filtration rate (GFR) in Pekin
ducks (Holmes et ai. 1968), but reduces the fractional reabsorption of N a + (Holmes et al.
1969; Hughes et al. 1989). Studies of renal function in wi ld ducks exposed to normal
habitat salinities have not been done.
In this study, I compared simultaneously kidney and salt gland function of freshwater
Mallards (tribe Anatini, Anas platyrhynchos), estuarine Canvasbacks (tribe Aythyini, Aythya
valisineria) and marine Barrow's Goldeneyes (tribe Mergini, Bucephala islandica).
Goldeneyes, the most saline tolerant, have larger extracellular fluid volume (Chapter 5) and
kidney mass (Kalisinska et al. 1999; Bennett and Hughes unpublished data) than Mallards,
the least saline tolerant species. Canvasbacks have large kidneys like the Goldeneyes, but a
smaller extracellular fluid volume, like the Mallards. A l l three species have high water flux

74
rates (Chapter 5) that are roughly twice the rate predicted allometrically for seabirds
(Hughes et al. 1987; Nagy and Peterson 1988). I hypothesize that neither saline acclimation
nor saline loading affect G F R in any of the three species, but that the ability to tolerate
saline is determined by the capacity of their kidneys to maintain high rates of renal tubular
water and N a + reabsorption and N a + secretion from their salt glands.
MATERIALS AND METHODS
Single injection technique
G F R of ducks was measured by applying the two-compartment method outlined in
Hal l et al. (1977) to the plasma decay curves of l 4 C - i n u l i n (Chapter 5). Details of animal
care and experimental procedures are given in Chapter 5. Differences among species
(Mallard, Canvasback, Goldeneye), and between treatment (freshwater, saline) and sex
(male, female) are assessed by A N O V A , with Scheffe's post hoc test.
Constant infusion technique
Experimental animals. Twenty four adult ducks (eight Mallards, Anas
platyrhynchos, eight Canvasbacks, Aythya valisineria, and eight Barrow's Goldeneyes,
Bucephala islandica) were maintained as described in Chapter 2. Ha l f the ducks of each
species drank freshwater, while the other half drank 300 m M N a C l for at least one year
prior to this experiment. Groups included equal numbers of males and females.
Experimental procedures. Each duck was fasted overnight and weighed. Venous
catheters, placed in the left and right tibiotarsal vein (for infusion of saline and markers,
and blood sampling, respectively), were kept patent with heparinized isotonic saline. The
duck's wings were lightly bound to the body with Velcro straps and the bird was placed
on a foam-lined restrainer. The duck's head was placed into a large funnel that directed
SGS into preweighed glass vials. The SGS of poor secretors was collected by capillary
tube. A canula inserted into the cloaca diverted ureteral urine into a preweighed plastic
75
tube.
A n initial 1 m L blood sample was taken and the duck was given a priming injection
of 1 p C i of 1 4 C-Inul in (marker for GFR) and 10 p C i of 3 H - P A H (marker for renal plasma
flow). A n infusion of 75 m M N a C l , containing 0.03 u C i of 3 H - P A H and 0.004 uCi of
1 4 C-Inulin, was begun. After a 1 h equilibration period, four 10-15 minute urine samples
were collected. The infusate concentration was increased to 500 m M N a C l , and urine
was collected at 10-20 min intervals until the duck began to secrete. Four simultaneous
10-20 min collections of urine and SGS were made. Finally, infusate concentration was
reduced to 75 m M N a C l , and three simultaneous 10-20 min collections of urine and SGS
were made. A l l urine and SGS volumes were determined by weighing their tubes before
and after the collection period. A blood sample (0.4 mL) was taken at the mid-point of
each urine-SGS collection period.
Analytical procedures used to measure [Na + ], [K + ] and osmolality (Osm) are as
described in Chapter 2, and to measure 3 H and 1 4 C as described in Chapter 5. Subscripts
pi, u, and sgs designate plasma, urine, and salt gland secretion, respectively.
Calculations and statistics. A l l calculations are as described in Pitts (1968) and
Goldstein (1993). G F R and effective renal plasma flow (ERPF) were calculated as:
G F R = ([Inulinju • U F R ) / [Inulin]pi, and
E R P F = ( [ P A H ] U • U F R ) / [ P A H ] p i
where [marker]u and [marker]pi are the marker (inulin or P A H ) concentrations in the urine
and plasma, respectively, and U F R is the urine flow rate. Fractional reabsorption of
water ( F R H 2 O ) was calculated as:
F R H 2 0 = (1- [inulin] pi/[inulin] u) • 100
and fractional reabsorption of N a + and K + ( F R N A and F R K , respectively) was calculated
as:
F R i o n = ( (GFR • [ion]pi) - (UFR • [ion]u)) / (GFR • [ion]pi)
where [ion]pi and [ion] u represent the N a + or K + concentrations of the plasma and urine,
respectively.
A l l analysis and calculations were made on each sample collected and were, within
76
individuals, averaged for each infusate, so that each infusate for an individual duck was
represented by a single value. The period in which ducks received 500 m M N a C l is
divided into two parts: the period prior to secretion and the period of active secretion.
Data are reported as means ± standard errors and statistically analyzed using S Y S T A T 9
for Windows (SPSS Science, Chicago, IL). Differences among species and infusate
periods, and between treatments and sexes were assessed by repeated measures A N O V A .
Significance is claimed at P<0.05, although higher P values suggesting trends are also
reported. Relationships among variables were examined using correlation and step-wise
linear regression.
RESULTS
Single injection technique
G F R varied significantly among the three species (Table 6.1) and was significantly
greater in Goldeneyes than either Mallards or Canvasbacks (P<0.00003). The G F R of
Mallards and Canvasbacks did not differ between the sexes or between the treatments and
averaged 3.35 ± 0 . 1 5 mLkg" 1 min" 1 (n=22) (Table 6.1). Saline acclimation reduced G F R
of male Goldeneyes (PO.05) , but not females (P<0.3; Table 6.1).
Constant infusion technique
Plasma composition. Overall, Osm pi, [Na]pi and [K] p i varied significantly among
species and infusion periods, but not between the treatments or sexes. Mallards had a lower
Osm p , (PO.06; Fig 6.1) and [Na] pi (PO.002; Fig 6.2) and a higher [K] p , (PO.002; Fig. 6.3)
than both Canvasbacks and Goldeneyes. Infusion of hypertonic saline significantly
increased Osm pi, [Na] pi and [K] p i in all three species and these remained high during active
salt secretion. Osm p i and [Na] pi, but not [K] p i , decreased after the infusion of hypotonic 75
m M N a C l was reinstated.
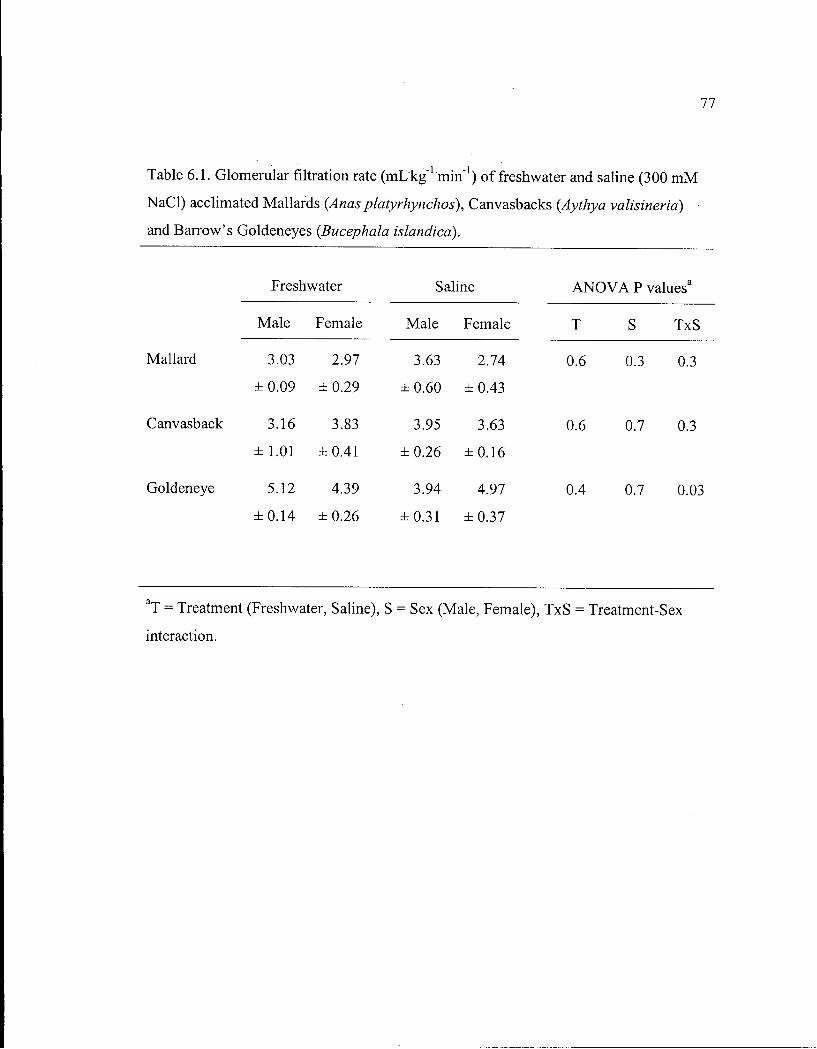
77
Table 6.1. Glomerular filtration rate (mLkg" 1 min"1) of freshwater and saline (300 m M
NaCl) acclimated Mallards (Anas platyrhynchos), Canvasbacks (Aythya valisineria)
and Barrow's Goldeneyes (Bucephala islandica).
Freshwater Saline A N O V A P values 3
Male Female Male Female T S TxS
Mallard 3.03 2.97 3.63 2.74 0.6 0.3 0.3
± 0 . 0 9 ± 0 . 2 9 ± 0 . 6 0 ± 0 . 4 3
Canvasback 3.16 3.83 3.95 3.63 0.6 0.7 0.3
± 1.01 ± 0 . 4 1 ± 0 . 2 6 ± 0 . 1 6
Goldeneye 5.12 4.39 3.94 4.97 0.4 0.7 0.03
± 0 . 1 4 ± 0 . 2 6 ± 0 . 3 1 ± 0 . 3 7
T = Treatment (Freshwater, Saline), S = Sex (Male, Female), TxS = Treatment-Sex
interaction.
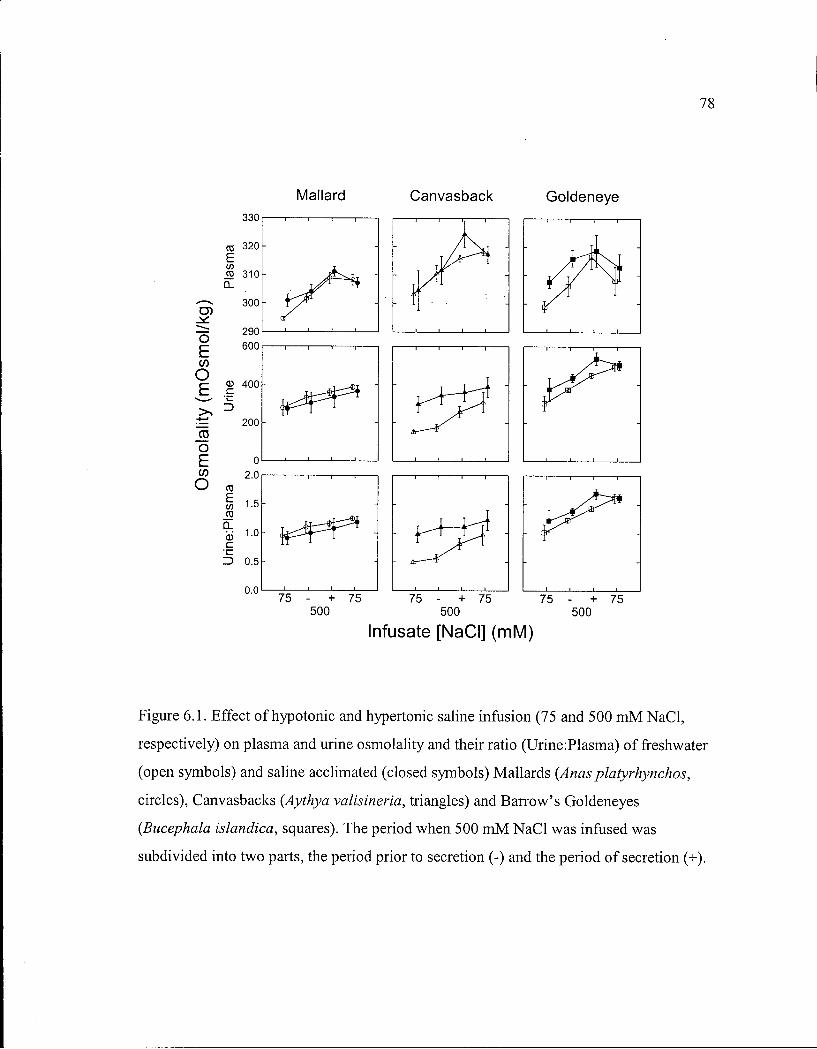
78
Mal la rd C a n v a s b a c k G o l d e n e y e
Infusate [NaCl] (mM)
Figure 6.1. Effect of hypotonic and hypertonic saline infusion (75 and 500 m M N a C l ,
respectively) on plasma and urine osmolality and their ratio (Urine:Plasma) of freshwater
(open symbols) and saline acclimated (closed symbols) Mallards (Anas platyrhynchos,
circles), Canvasbacks (Aythya valisineria, triangles) and Barrow's Goldeneyes
(Bucephala islandica, squares). The period when 500 m M N a C l was infused was
subdivided into two parts, the period prior to secretion (-) and the period of secretion (+).
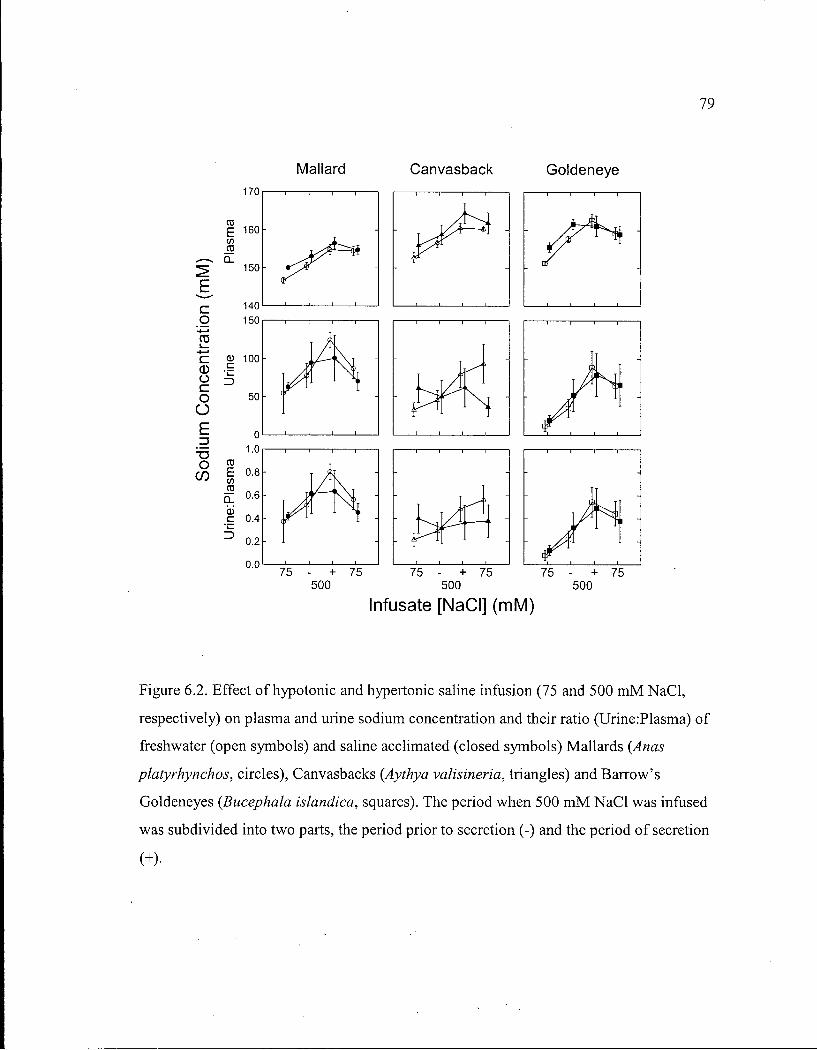
79
Mal la rd C a n v a s b a c k G o l d e n e y e
c g -4—» CO
-4—'
CD O cz o
O
"O o
CO
170
500 500 500
Infusate [NaCl] (mM)
Figure 6.2. Effect of hypotonic and hypertonic saline infusion (75 and 500 m M N a C l ,
respectively) on plasma and urine sodium concentration and their ratio (Urine:Plasma) of
freshwater (open symbols) and saline acclimated (closed symbols) Mallards (Anas
platyrhynchos, circles), Canvasbacks (Aythya valisineria, triangles) and Barrow's
Goldeneyes (Bucephala islandica, squares). The period when 500 m M N a C l was infused
was subdivided into two parts, the period prior to secretion (-) and the period of secretion
(+)•
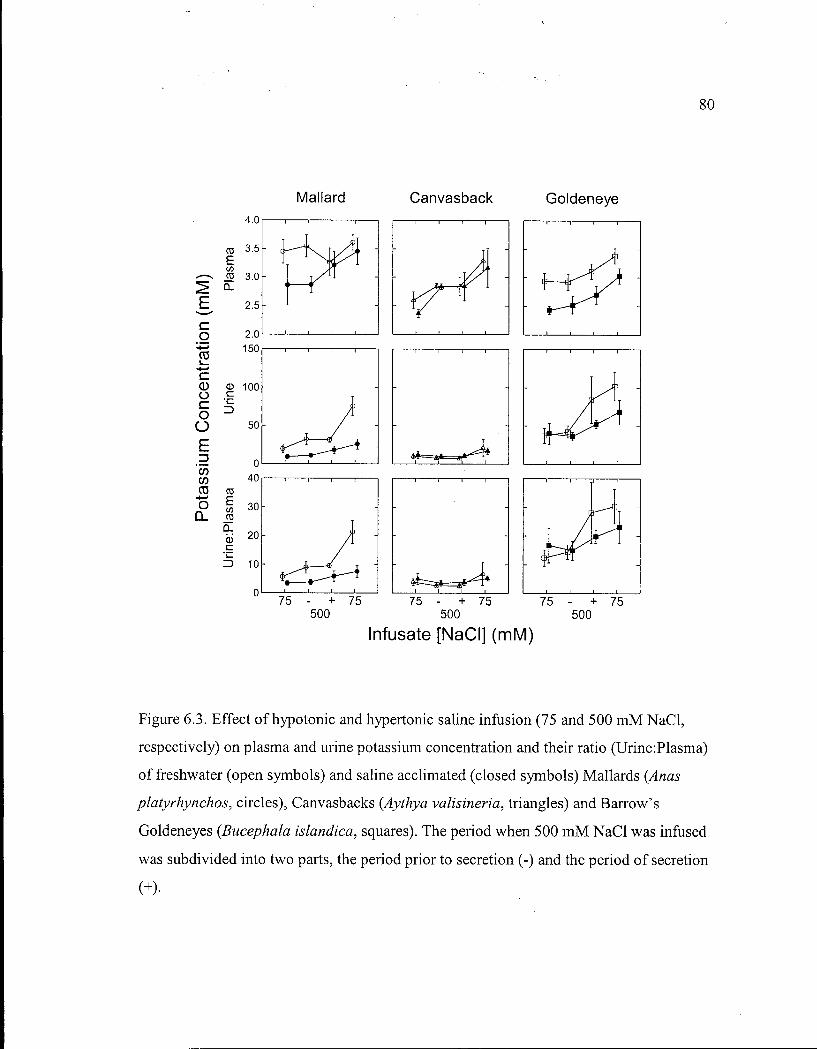
80
Mal la rd C a n v a s b a c k G o l d e n e y e
40 I i 1 1 1 1 | 1 1 1 1 1 i 1 1 1 r
_i u i i I I i i j i I
75 - + 75 75 - + 75 75 - + 75 500 500 500
Infusate [NaCl] (mM)
Figure 6.3. Effect of hypotonic and hypertonic saline infusion (75 and 500 m M N a C l ,
respectively) on plasma and urine potassium concentration and their ratio (Urine:Plasma)
of freshwater (open symbols) and saline acclimated (closed symbols) Mallards (Anas
platyrhynchos, circles), Canvasbacks (Aythya valisineria, triangles) and Barrow's
Goldeneyes (Bucephala islandica, squares). The period when 500 m M N a C l was infused
was subdivided into two parts, the period prior to secretion (-) and the period of secretion
(+)•

81
Kidney function. G F R was significantly greater in Goldeneyes than in either
Mallards or Canvasbacks (PO.005) and differed between freshwater and saline
acclimated ducks only in Canvasbacks, due mainly to lower G F R in freshwater females
(Fig 6.4). G F R did not vary among the infusion periods (P>0.5). Wi th the exception of
female freshwater Canvasbacks, G F R of infused ducks and noninfused ducks did not
differ (P>0.1). E R P F was significantly lower in Canvasbacks than in either Mallards or
Goldeneyes (P<0.008). When ducks were infused with hypertonic saline, E R P F
increased only in Mallards (P<0.03Fig. 6.4). Neither saline acclimation nor sex affected
E R P F .
Fractional reabsorption of water and N a + varied significantly among the three species
(P<0.02 and P<0.0004, respectively; Fig . 6.5). They were highest in Goldeneyes, lowest
in Canvasbacks and intermediate in Mallards (Fig. 6.5). Fractional reabsorption of water
and N a + were not affected by saline acclimation, sex or infusate concentration in
Mallards, but tended to be higher (PO.08 and P<0.01, respectively) in saline acclimated
Canvasbacks, due almost exclusively to low values of one freshwater female. In
Goldeneyes, fractional reabsorption of water increased (P<0.005) and reabsorption of N a +
decreased (P<0.002) with infusion period (Fig. 6.5). Fractional reabsorption of K + did
not vary among or within species, except that it was significantly lower only in freshwater
Mallards during the final infusion of 75 m M N a C l (Fig 6.5). U F R of Goldeneyes was
lower than that of either Mallards or Canvasbacks (P<0.01). U F R was lower in saline
acclimated Canvasbacks than in freshwater Canvasbacks (P=0.04); saline infusion
reduced U F R only in freshwater Canvasbacks ( P O . 0 1 ; Fig . 6.4).
Overall, Osm u (Fig. 6.1) and [ K ] u (Fig. 6.3), but not [Na] u (Fig. 6.2), varied among
species (P=0.0007, P=0.0005, and P=0.14, respectively). Goldeneyes had the highest
Osm u and [ K ] u and, along with Canvasbacks, the lowest [Na] u . Canvasback also have the
lowest Osm u and [ K ] u . Osm u , [Na] u and [ K ] u varied significantly among infusion periods
(all PO.00001 ; Figs. 6.1-3), but only Osm u varied between treatments (P=0.04), due
primarily to lower Osm u of freshwater Canvasbacks (Fig. 6.1). During hypertonic saline
infusion, all three species significantly increased Osm u and it remained high during active
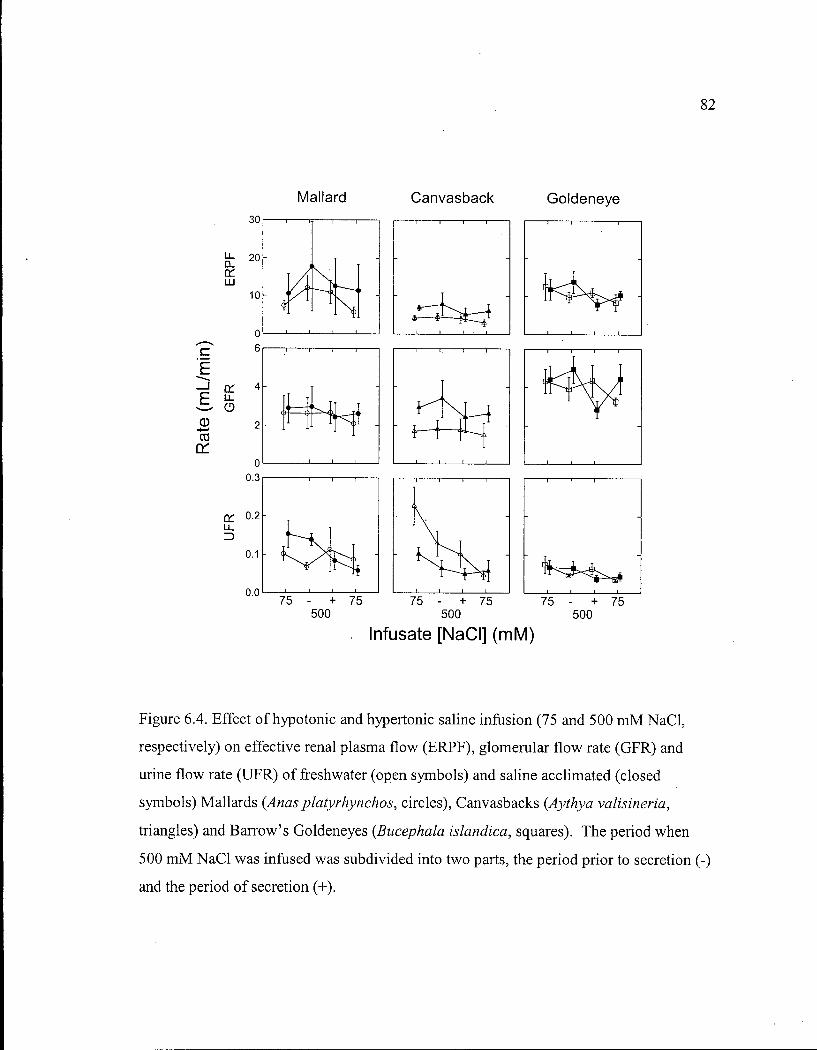
82
Mal la rd C a n v a s b a c k G o l d e n e y e
30 I I IT I I | | I I I | 1 | | 1 1 r
500 500 500 , Infusate [NaCl] (mM)
Figure 6.4. Effect of hypotonic and hypertonic saline infusion (75 and 500 m M N a C l ,
respectively) on effective renal plasma flow (ERPF), glomerular flow rate (GFR) and
urine flow rate (UFR) of freshwater (open symbols) and saline acclimated (closed
symbols) Mallards (Anas platyrhynchos, circles), Canvasbacks (Aythya valisineria,
triangles) and Barrow's Goldeneyes (Bucephala islandica, squares). The period when
500 m M N a C l was infused was subdivided into two parts, the period prior to secretion (-)
and the period of secretion (+).
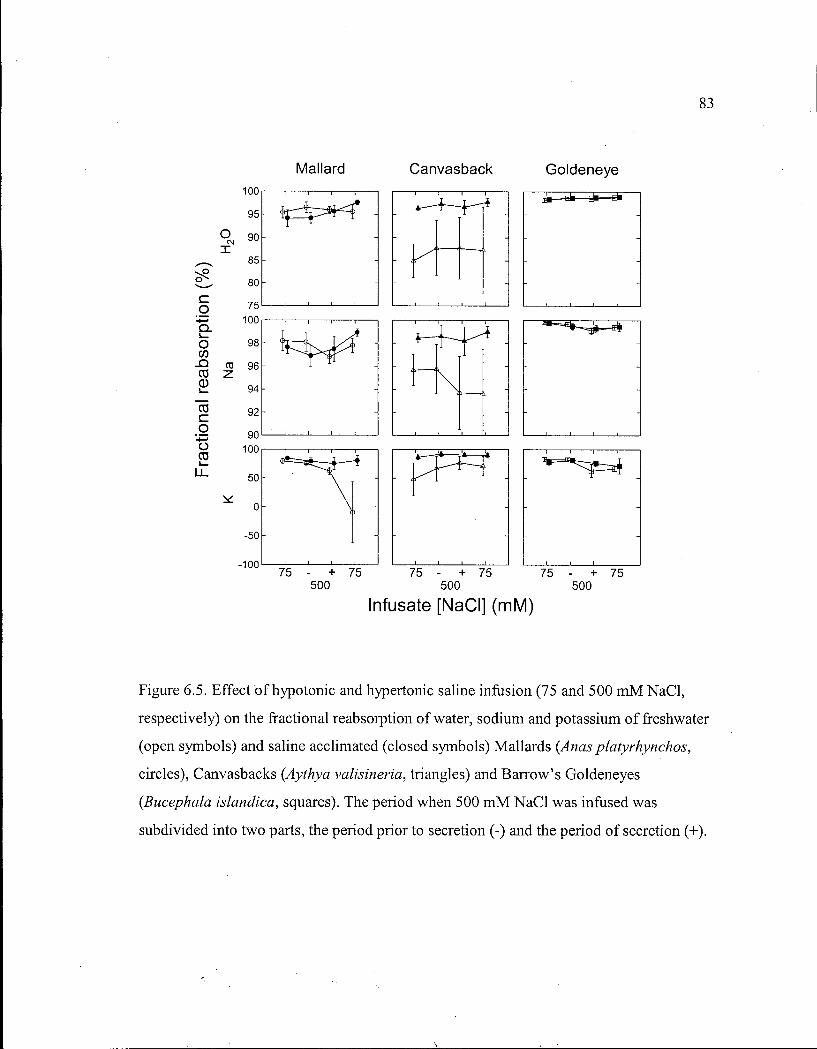
83
Mal la rd C a n v a s b a c k G o l d e n e y e
_J i i i i I i i i i i 75 - + 75 75 - + 75 75 - + 75
500 500 500 Infusate [NaCl] (mM)
Figure 6.5. Effect of hypotonic and hypertonic saline infusion (75 and 500 m M N a C l ,
respectively) on the fractional reabsorption of water, sodium and potassium of freshwater
(open symbols) and saline acclimated (closed symbols) Mallards (Anas platyrhynchos,
circles), Canvasbacks (Aythya valisineria, triangles) and Barrow's Goldeneyes
(Bucephala islandica, squares). The period when 500 m M N a C l was infused was
subdivided into two parts, the period prior to secretion (-) and the period of secretion (+).

84
salt secretion. [Na] u and [ K ] u increased in Mallards and Goldeneyes regardless of
treatment. In Canvasbacks, only freshwater ducks increased [Na] u , and none increased
[ K ] u (Fig. 6.2).
Urine flow rate is related to both G F R and fractional reabsorption of water ( F R H 2 O ) in
all three species (Fig 6.6). U F R was positively correlated with G F R among Mallards and
Goldeneyes, but not in Canvasbacks (Fig. 6.6). Stepwise linear regression indicated that
U F R of Mallards and Goldeneyes was predicted by a combination of both G F R and
F R H 2 o :
Mallards U F R = 2.0 + (0.039- G F R ) - ( 0 . 0 2 1 - F R H 2 o ) , r = 0.83, PO .0001 ,
Goldeneyes U F R = 3.6+ (0.012- G F R ) - ( 0 . 0 3 6 - F R H 2 o ) , r = 0.95, PO .0001 .
and could be similarly predicted in Canvasbacks i f one freshwater female were excluded:
Canvasbacks U F R = 1.6+ (0.021- G F R ) - ( 0 . 0 1 6 - F R H 2 o ) , r = 0.81, PO .0001 ,
otherwise U F R of Canvasbacks was predicted solely by F R H 2 0 -
Salt gland function. The time required to initiate secretion did not vary among the
species (P=0.12), nor was it affected by treatment (P=0.89) or sex (P=0.35). It required
59.3 ± 3.8 min (N=24 ducks) of infusion (500 m M N a C l at 0.175 mL/min) to initiate
secretion. Freshwater Mallards and one freshwater female Canvasback produced only a
trace of SGS. [ N a + ] s g s did not vary among the species (P=0.56) or between the sexes
(P=0.23). Saline acclimation increased [ N a + ] s g s of Mallards and Goldeneyes (P=0.04 and
P=0.01, respectively), but not of Canvasbacks (Table 6.2). Salt gland secretion flow rate
varied among species (P=0.0003; Goldeneyes>Canvasbacks> Mallards) and was
increased by saline acclimation only in Mallards (Table 6.2).
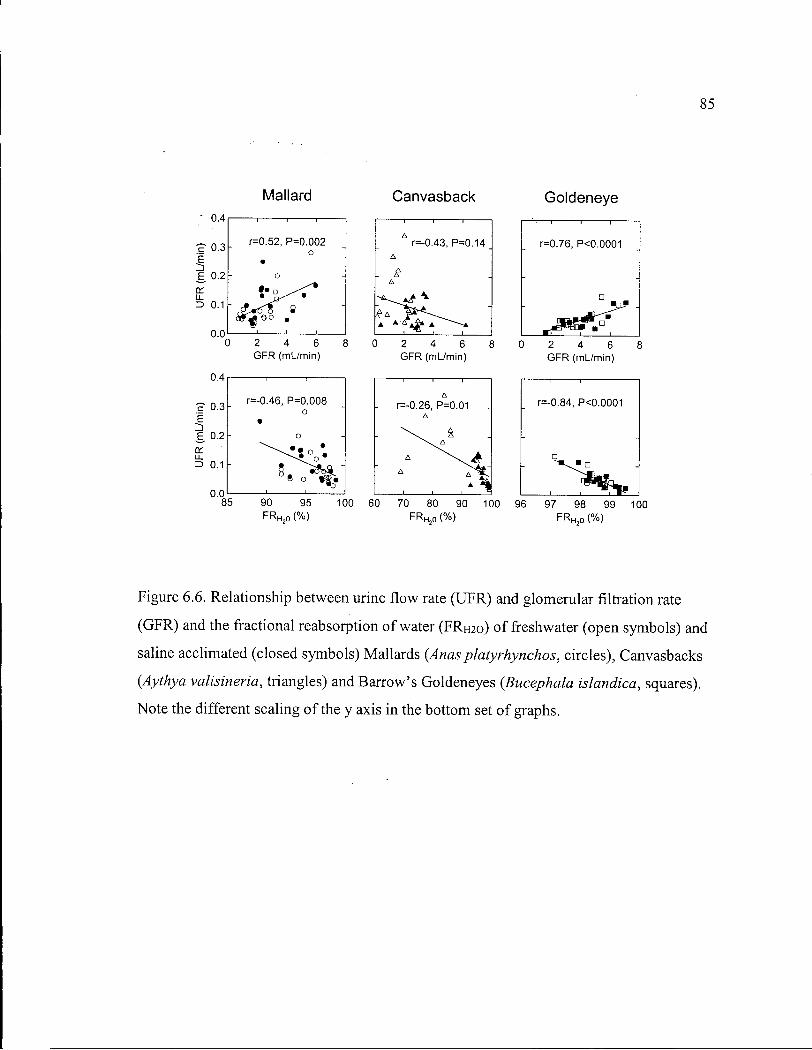
8 5
Mal la rd C a n v a s b a c k G o l d e n e y e
FRH2O (%) FRH2Q (%) FRH2Q (%)
Figure 6.6. Relationship between urine flow rate (UFR) and glomerular filtration rate
(GFR) and the fractional reabsorption of water ( FRH2O ) of freshwater (open symbols) and
saline acclimated (closed symbols) Mallards (Anas platyrhynchos, circles), Canvasbacks
(Aythya valisineria, triangles) and Barrow's Goldeneyes (Bucephala islandica, squares).
Note the different scaling of the y axis in the bottom set of graphs.

86
Table 6.2. Salt gland secretion sodium concentration and flow rate of freshwater and saline acclimated Mallards (Anas platyrhynchos), Canvasbacks (Aythya valisineria) and Barrow's Goldeneyes (Bucephala islandica) infused intravenously with 500 m M N a C l at 0.175 mL/min.
Freshwater Saline P values
Sodium concentration (mM)
Mallard 516.3 a 637.6 0.04
± 3 1 . 3 ± 4 2 . 1
Canvasback 532.1 606.1 0.25
± 4 0 . 4 ± 2 0 . 1
Goldeneye 522.2 682.2 0.01
± 3 4 . 6 ± 2 0 . 6
Flow rate (mL/min)
Mallard 0.000 0.103
± 0 . 0 1 0
Canvasback 0.072 0.080 0.29
± 0.006 ± 0.004
Goldeneye 0.135 0.134 0.98
± 0.030 ± 0.008
drop collected by a capillary tube
87
DISCUSSION
Kidneys and salt glands of marine birds act interactively to maintain the volume and
composition of body fluids within some homeostatically controlled range. The salt
glands secrete excess N a C l as a hypertonic fluid, while the kidneys rid the body of excess
water, nitrogenous wastes and other electrolytes. Since the kidneys must maintain a high
G F R to rid the body of nitrogenous wastes and the salt glands are the primary site of N a +
excretion (Schmidt-Nielson 1960), kidneys of marine birds should maintain high tubular
reabsorption of N a + and water. In this chapter, I compared simultaneously three
processes central to osmoregulation in three species of ducks: filtration of N a + and water
from the plasma by the kidneys, reabsorption of filtered N a + by cells along the renal
tubules, and secretion of N a + by the salt glands.
Kidney function. Saline acclimation and acute saline loading have little effect on
G F R of Pekin ducks (Holmes et al. 1968, Hughes 1980, Hughes et al. 1989, 1999; Table
6.1, Fig. 6.4) or other species with salt glands (penguin, Douglas 1966; gull, Hughes
1995). Mallards, Canvasbacks and Pekin ducks all have similar G F R (Table 6.3). G F R
of Goldeneyes is roughly twice that of the other duck species (Tables 6.1, 6.3, Fig. 6.4),
but is similar to G F R of marine birds in other orders (Douglas 1966; Hughes 1980, 1995;
Hughes et al. 1993). The Canada goose {Branta canadensis), the most terrestrial of the
anseriforms, has the lowest G F R . This suggests that among anseriforms and possibly all
birds with salt glands, G F R varies among habitat types (terrestrial< freshwater<marine).
The high G F R of marine birds is consistent with their larger kidneys (Hughes 1970b,
Kalisinska et al 1999), higher water flux rates (Hughes et al. 1987; Nagy and Peterson
1988, Chapter 5) and larger extracellular fluid volumes (Chapter 5). Marine birds are
also carnivorous. Whether these patterns reflect adaptations to a marine environment
and/or to a carnivorous diet has not yet been examined.

88
Table 6.3. Glomerular filtration rate (GFR) and effective renal plasma flow (ERPF) of birds with and
without salt gland in relation to habitat type (T, terrestrial; FW, freshwater; M , marine).
Species Body mass GFR ERPF Habitat Source
(g) (mL- kg" (mL- kg"
'• min"1) '• min"1)
Without salt glands:
Order Struithioniformes
Dromaius 40700
novaehollandiae
Order Galliformes
Alectoris chukar 512
Gallus gallus f. dom. 1982
Coturnix chinensis 51
Coturnixjaponica 122
Coturnix pectoralis 107
Callipepla gambelii 160
Order Psittaciformes
Cacatua roseicapilla 336
Order Columbiformes
Columbia livia 570
Order Falconiformes
Falco sparverius 126
Order Passeriformes
Anthochaera 99
carunculata
Sturnus vulgarus 74
Passer domesticus 23
Melospiza melodia 18
0.4 T 1
1.1 T 2
2.1 18.0 T 3-26
10.7 29.2 T 27
12.6 T 28
6.3 37.9 T 27
1.4 T 29-33
2.35 11.2 T 35
7.1 T 36
2.2 T 37
3.5 T 38
6.2 T 39-44
5.6 T 45
7.1 T 46
Table continued on next page.
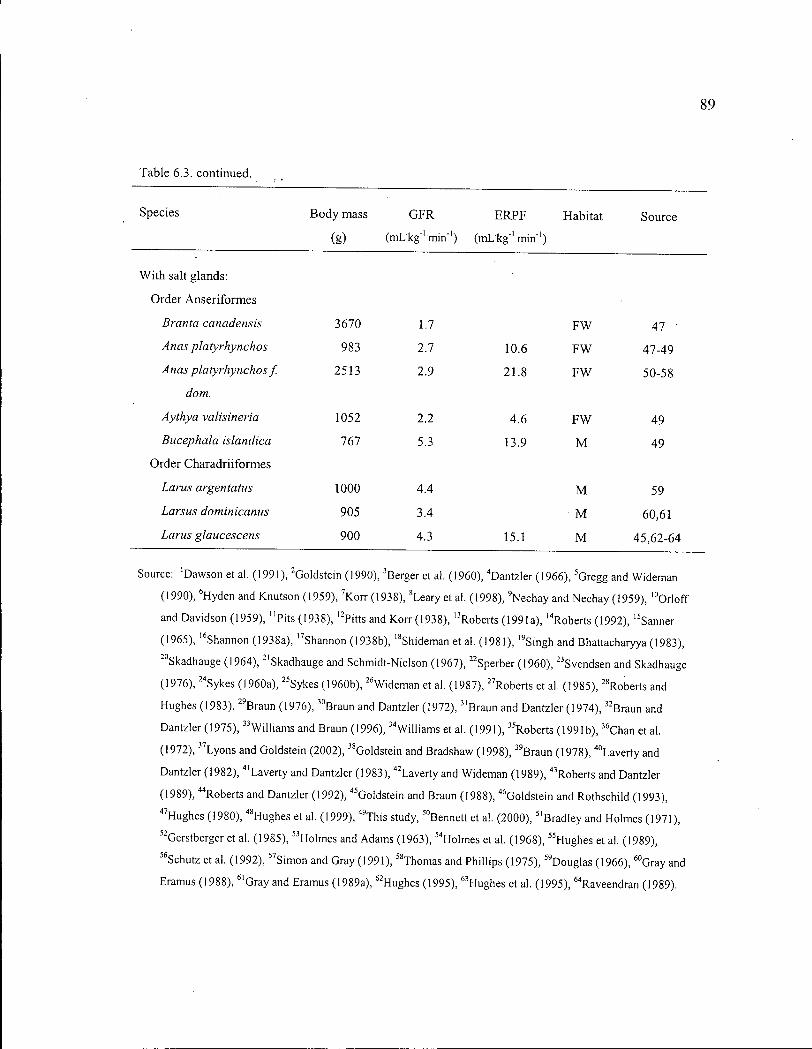
89
Table 6.3. continued.
Species Body mass GFR ERPF Habitat
(g) (mLkg"'min"') (mLkg'1 min"1)
Source
With salt glands:
Order Anseriformes
Branta canadensis 3670 1.7
Anas platyrhynchos 983 2.7
Anas platyrhynchos f. 2513 2.9
dom.
Aythya valisineria 1052 2.2
Bucephala islandica 161 5.3
Order Charadriiformes
Larus argentatus 1000 4.4
Larsus dominicanus 905 3.4
Larus glaucescens 900 4.3
10.6
21.8
4.6
13.9
15.1
FW
FW
FW
FW
M
M
M
M
47 •
47-49
50-58
49
49
59
60,61
45,62-64
Source: 'Dawson et al. (1991), 2Goldstein (1990), 3Berger et al. (1960), "Dantzler (1966), 3Gregg and Wideman
(1990), 6Hyden and Knutson (1959), 7Korr (1938), sLeary et al. (1998), 9Nechay and Nechay (1959), ] 0OrIoff
and Davidson (1959), "Pits (1938), l 2Pittsand Korr(1938), 13Roberts (1991a), '"Roberts (1992), 15Sanner
(1965), ''Shannon (1938a), "Shannon (1938b), 18Shideman et al. (1981), , 9Singh and Bhattacharyya (1983), 20Skadhauge (1964), 2 lSkadhauge and Schmidt-Nielson (1967), 2 2Sperber (1960), 2 3Svendsen and Skadhauge
(1976), 2 4Sykes (1960a), 2 5Sykes (1960b), 2 6Wideman et al. (1987), "Roberts et al. (19 8 5), 2 8Roberts and
Hughes (1983), 2 9Braun (19 76), 3 0Braun and Dantzler (1972), 3 1Braun and Dantzler (1974), 3 2Braun and
Dantzler (1975), "Wi l l iams and Braun (199 6), 3 4Williams et al. (1991), "Roberts (1991b), 3 6Chan et al.
(1972), "Lyons and Goldstein (2002), 3 8Goldstein and Bradshaw (199 8), 3 9Braun (1978), 4 0Laverty and
Dantzler (1982), 4 1Laverty and Dantzler (19 8 3), 4 2Laverty and Wideman (1989), 4 3Roberts and Dantzler
(1989), ""Roberts and Dantzler (1992), "5Goldstein and Braun (19 8 8), 4 6Goldstein and Rothschild (1993), 4 7Hughes (19 8 0), 4 8Hughes et al. (1999), 4 9This study, 50Bennett et al. (2000), 5 lBradley and Holmes (1971),
"Gerstberger et al. (1985), "Holmes and Adams (1963), 5 4Holmes et al. (19 6 8), 5 5Hughes et al. (1989),
"Schutz et al. (1992), "Simon and Gray (1991), 5 8Thomas and Phillips (1975), 5 9Douglas (1966), 6 0Gray and
Eramus (1988), 6 1Gray and Eramus (1989a), "Hughes (1995), 6 3Hughes et al. (1995), 64Raveendran (1989).
90
Among birds without salt glands, no dominant pattern emerges. However, with the
exception of Coturnix quail and passerines, G F R is generally low in these species (Table
6.3), and is typically decreased in response to a saline challenge (summarized in Roberts
et al. 1985). Despite the limited concentrating ability o f the avian kidney (Braun 1997), it
is the sole route by which these species rid themselves of excess N a + .
Goldeneyes, the most marine of the three species examined in this study, have the
highest fractional reabsorption of water and N a + (Fig. 6.5), thus the lowest U F R (Fig. 6.4)
and [Na + ] u (Fig. 6.2). Goldeneyes significantly increased the fractional reabsorption o f
water and decreased the fractional reabsorption of N a + when infused with hypertonic
saline (Fig. 6.5), as did Gulls (Hughes 1995).^ In contrast, Mallards had a lower fractional
reabsorption of water and N a + (Fig. 6.5), and produced greater volume (Fig. 6.4) of more
concentrated urine (Fig. 6.2). Canvasbacks produced a large volume o f urine like
Mallards (Fig. 6.4), but with a low [Na + ] u like Goldeneyes (Fig. 6.2). Saline infusion did
not affect fractional reabsorption of water and N a + in Mallards and Canvasbacks (Fig.
6.5).
Birds can adjust U F R by two mechanisms: they may vary G F R (determines the rate at
which fluid is delivered to the renal tubules) and/or tubular water reabsorption. Neither
G F R nor fractional water reabsorption were much affected by saline acclimation or by
acute saline loading (Figs. 6.4, 6.5). With the exception of female freshwater
Canvasbacks, both mechanisms regulated urine flow o f ducks equally wel l (Fig. 6.6).
Chickens (Wideman 1998), Red Wattlebirds (Anthochaera carunculata; Goldstein and
Bradshaw 1998) and kestrels (Lyons and Goldstein 2002) also use both mechanisms to
adjust urine flow. Fractional reabsorption of water is considered the more important in
regulation o f urine flow in wattlebirds (Goldstein and Bradshaw 1998) and probably
Chukars (Alectoris chukar; Goldstein 1990).
E R P F of Mallards and Goldeneyes (Fig. 6.4) is similar to E R P F of gulls (Raveendran
1987) and galahs (Roberts 1991), but lower than that of Pekin ducks, chickens and quail
(Table 6.3). Canvasbacks (Fig. 6.4) have the lowest E R P F of any avian species studied,
while domesticated varieties of birds (chicken and Pekin duck) have the highest E R P F
91
(Table 6.3). Species differences in E R P F do not suggest any significant pattern, as other
attributes of avian osmoregulation, such as water flux, extracellular fluid volume and
kidney size, appear to do.
Salt gland function. [ N a + ] s g s did not differ among the three species, and, following
saline acclimation, increased only in Mallards and Goldeneyes (Table 6.2). Salt gland
secretion rate did differ among the three species and was highest in Goldeneyes (Table
6.2). Only Goldeneyes secreted all the infused N a + via their salt glands. They were able
to drink 550 m M N a C l without changing water intake (Chapter 5). Despite their high
N a + intake, I never observed salt gland secretion in Goldeneyes during saline acclimation
(Chapter 5). Goldeneyes secreted all the infused N a + via their salt glands, but Mallards
and Canvasbacks did not. Saline acclimated Mallards did excrete all infused N a + , but
incorporated renal excretion to do so. Canvasbacks were unable to excrete all the infused
N a + .
A t salinities above 225 m M N a C l , Mallards decreased water flux (drinking);
Canvasbacks tolerate 450 m M N a C l with no change in water flux (Chapter 5). I never
observed the Mallards or the Canvasbacks to secrete during saline acclimation (Chapter
5). Although, saline infused Canvasbacks make a SGS more concentrated than their
drinking water, they do so at a low rate (Table 6.2) that, together with their low renal N a +
excretion (Fig. 6.2), suggests that they should not be able to eliminate all the N a + they
ingested (Chapter 5). Nevertheless, they tolerated 450 mm N a C l (Chapter 5). How this
was done, despite their apparently limited ability to excrete N a + , remains unresolved, but
may involve postrenal modification of urine.
Many species of birds modify their urine postrenally to conserve water and/or N a + .
For example, water and sodium excretion rates of chickens (Skadhauge 1968) and quail
(Anderson and Braun 1985) are higher in ureteral urine than in voided urine (cloacal
fluid). Schmidt-Nielson et al. (1963) suggested that birds with salt glands might reabsorb
N a + and water from the urine in the lower intestinal tract (hindgut). B y secreting the
reabsorbed N a + extrarenally in less water than was absorbed with it, they could generate
osmotically free water. Postrenal modification of urine has the potential to play an
92
important osmoregulatory role in ducks. Pekin ducks (Hughes and Raveendran 1994) and
Mallards (Hughes et al. 1999) reflux urine into their hindgut. Mallards reflux about 20%
of their urine regardless of drinking water salinity (Hughes et al. 1999). The capacity for
N a + uptake in the hindgut of Pekin ducks is only slightly diminished by saline acclimation
(Skadhauge et al. 1984), and the cloacal fluid of Pekin ducks (Hughes et al. 1992) is more
concentrated than their urine (Hughes et al. submitted; see Fig . 1.1). Postrenal
modification o f urine may help explain the inconsistencies in osmoregulatory responses
of Canvasback ducks.
I hypothesized that neither saline acclimation nor saline loading affect G F R in any of
the three species, but that the ability to tolerate saline was determined by the capacity of
their kidneys to maintain high rates of renal tubular water and N a + reabsorption and N a +
secretion from their salt glands. The results support this. Goldeneyes, the most marine
species, had the highest rates of filtration (GFR), fractional reabsorption of water and
N a + , and salt gland N a + excretion and were the only species that secreted all the infused
N a + via the salt glands. Rates of these processes are all lower in Mallards, the most
freshwater species. However, the high volume and N a + concentration of urine of saline
acclimated Mallards, coupled with extrarenal N a + secretion, eliminated all the infused
N a + . Canvasbacks tolerated higher drinking water salinities than Mallards (Chapter 5),
even though their renal and extrarenal N a + excretion rates during acute saline loading
indicate they should not be able to do so. This suggests osmoregulation of Canvasbacks
involves levels of N a + and water regulation other than by the kidneys and the salt glands.
It may be that postrenal modification of urine plays an important role in conservation of
water in Canvasbacks.
C H A P T E R S E V E N . G E N E R A L D I S C U S S I O N
93
Salinity may be an important barrier to habitat selection in ducks (Nystrom and Pehrsson
1988). The capacity to secrete excess N a C l extra-renally has been correlated with habitat
choice in Charadriiformes birds (Stalland 1967; 1968). Whether saline tolerance is
determined by the concentrating capacity of their salt glands or is constrained by the uptake
of N a C l in the gut and/or kidneys is not known. In this thesis I described the functions of
organs contributing to maintenance of osmotic homeostasis in ducks during acclimation to
saline (saline tolerance) and attempted to identify the osmoregulatory adaptations that allow
ducks to live in saline habitats. The major finding of this thesis was, the dynamic shift of
water and N a + in and out of the extracellular fluid compartment in response to saline intake
(Chapters 3,4). These shifts appear to be important in the stimulation of salt gland secretion
(Chapter 4) and in conferring tolerance to saline (Chapters 3, 5).
Studies of Pekin ducks. I first examined the osmoregulatory response of Pekin ducks
to saline intake, as much of our understanding of these mechanisms in birds with salt glands
derives from studies o f them (for reviews see Peaker and Linzel l 1975; Skadhauge 1981;
Hughes and Chadwick 1989; Gerstberger and Gray 1993; Gray 1998). I found that Pekin
ducks could not maintain water balance when the salinity of their drinking water was greater
than 300 m M N a C l (Chapter 2, Fig. 2.2). This agrees with the observation that the
concentration of their salt gland secretion is only slightly greater than 300 m M N a + (Hughes
et al. 1992, submitted; see Fig. 1.1). I calculated, based on the results of this and other
studies in this laboratory, that salt gland secretion and urine account for 11% and 76% of
total water efflux, respectively (Table 2.1). Given the concentrations of the two excretions,
this would indicate that 40% of their sodium flux (Roberts and Hughes 1984) is due to salt
gland secretion and 60% to renal excretion. However, when Pekin ducks are infused
intravenously with hypertonic saline, their salt gland secretion concentration is higher (500-
600 m M N a C l ; Ruch and Hughes 1975; Deutsch et al. 1979; Simon and Gray 1989; Chapter
4) and their salt gland secretion accounts for 86% of the total osmolal excretion (Deutsch et
al. 1979). Clearly the concentrating ability of their salt glands does not reach its full
potential when saline is drunk.
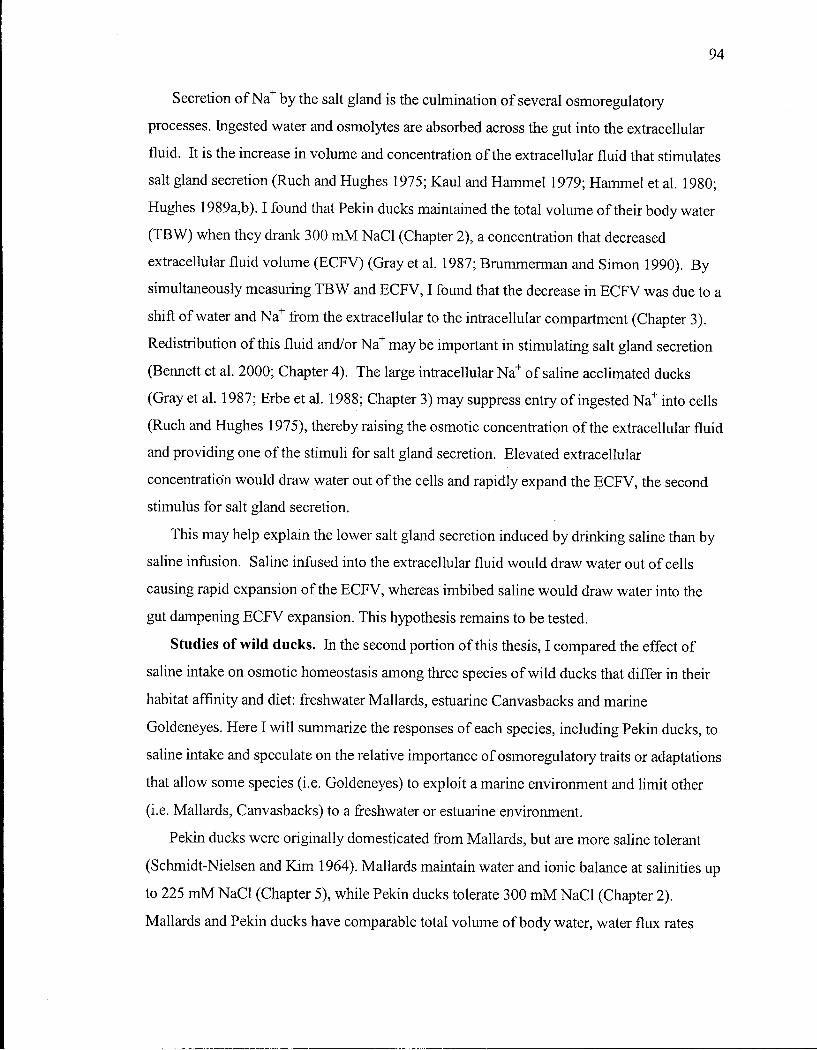
94
Secretion of N a + by the salt gland is the culmination of several osmoregulatory
processes. Ingested water and osmolytes are absorbed across the gut into the extracellular
fluid. It is the increase in volume and concentration of the extracellular fluid that stimulates
salt gland secretion (Ruch and Hughes 1975; Kaul and Hammel 1979; Hammel et al. 1980;
Hughes 1989a,b). I found that Pekin ducks maintained the total volume of their body water
(TBW) when they drank 300 m M N a C l (Chapter 2), a concentration that decreased
extracellular fluid volume (ECFV) (Gray et al. 1987; Brummerman and Simon 1990). B y
simultaneously measuring T B W and E C F V , I found that the decrease in E C F V was due to a
shift of water and N a + from the extracellular to the intracellular compartment (Chapter 3).
Redistribution of this fluid and/or N a + maybe important in stimulating salt gland secretion
(Bennett et al. 2000; Chapter 4). The large intracellular N a + of saline acclimated ducks
(Gray et al. 1987; Erbe et al. 1988; Chapter 3) may suppress entry of ingested N a + into cells
(Ruch and Hughes 1975), thereby raising the osmotic concentration of the extracellular fluid
and providing one of the stimuli for salt gland secretion. Elevated extracellular
concentration would draw water out of the cells and rapidly expand the E C F V , the second
stimulus for salt gland secretion.
This may help explain the lower salt gland secretion induced by drinking saline than by
saline infusion. Saline infused into the extracellular fluid would draw water out of cells
causing rapid expansion of the E C F V , whereas imbibed saline would draw water into the
gut dampening E C F V expansion. This hypothesis remains to be tested.
Studies of wild ducks. In the second portion of this thesis, I compared the effect of
saline intake on osmotic homeostasis among three species of wild ducks that differ in their
habitat affinity and diet: freshwater Mallards, estuarine Canvasbacks and marine
Goldeneyes. Here I w i l l summarize the responses of each species, including Pekin ducks, to
saline intake and speculate on the relative importance of osmoregulatory traits or adaptations
that allow some species (i.e. Goldeneyes) to exploit a marine environment and limit other
(i.e. Mallards, Canvasbacks) to a freshwater or estuarine environment.
Pekin ducks were originally domesticated from Mallards, but are more saline tolerant
(Schmidt-Nielsen and K i m 1964). Mallards maintain water and ionic balance at salinities up
to 225 m M N a C l (Chapter 5), while Pekin ducks tolerate 300 m M N a C l (Chapter 2).
Mallards and Pekin ducks have comparable total volume of body water, water flux rates

95
(Fig 5.2, Table 2.1), glomerular filtration rates (Table 6.3), and salt gland secretion
concentrations (Table 6.2, Chapter 4). However, they differ in the distribution of body
water (Fig. 7.1). When drinking freshwater, Mallards had a proportionately smaller E C F V
than Pekin ducks. When they drank saline, Pekin ducks shifted water from the extracellular
to the intracellular compartment, but Mallards did not (Fig. 7.1).
Goldeneyes, the most marine duck studied, maintained water and ionic balance even
when drinking saline equivalent to full strength seawater (Chapter 5). Their water flux rates
(Fig. 5.2) and salt gland secretion concentrations (Table 6.2) were comparable to those of
Mallards and Pekin ducks. Like Pekin ducks, Goldeneyes have a large E C F V when drinking
freshwater, and shift fluid from the extracellular to the intracellular compartment with saline
acclimation (Fig. 7.1). Goldeneyes had the highest glomerular filtration rate (Fig. 6.4; Table
6.3) and highest fractional reabsorption of water and N a + in the renal tubules (Fig. 6.5) of
the three species o f wi ld ducks examined. Presumably, Goldeneyes also produced a highly
concentrated salt gland secretion in response to saline ingestion.
Canvasbacks were somewhat of an enigma. They, like Goldeneyes, maintained water
balance when drinking saline equivalent to full strength seawater (Fig. 5.1). But, like
Mallards, they had a small E C F V and did not shift fluid from the extracellular to the
intracellular compartment with saline acclimation (Fig. 7.1). Canvasbacks were the only
species to increase water flux rates when they drank saline (Fig. 5.2). They should have
incurred a substantial N a + load, yet the saline infusion study (Chapter 6) indicated that their
kidneys and salt glands would not be able to excrete this amount of N a + . This paradox
suggests that they do not absorb all the ingested sodium across the gut into the body or that
they reabsorb urinary N a + in the hindgut. In Chapter 6,1 provided some preliminary
evidence from Pekin ducks and Goldeneyes to support this hypothesis. The ability to
exclude imbibed N a + from extracellular fluid could be an important adaptation in conferring
saline tolerance. Work is currently underway to test this hypothesis in Mallards and
Canvasbacks.
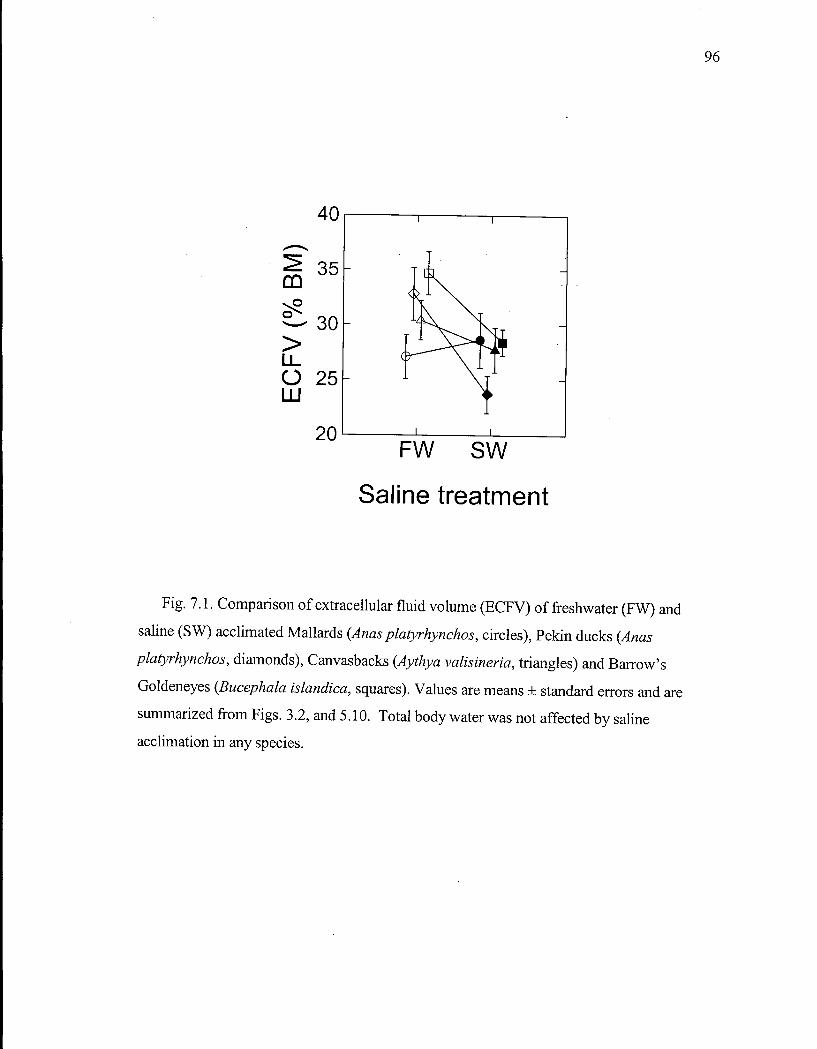
96
4 0
FW SW
Saline treatment
Fig. 7.1. Comparison of extracellular fluid volume ( E C F V ) of freshwater (FW) and
saline (SW) acclimated Mallards (Anas platyrhynchos, circles), Pekin ducks (Anas
platyrhynchos, diamonds), Canvasbacks (Aythya valisineria, triangles) and Barrow's
Goldeneyes (Bucephala islandica, squares). Values are means ± standard errors and are
summarized from Figs. 3.2, and 5.10. Total body water was not affected by saline
acclimation in any species.
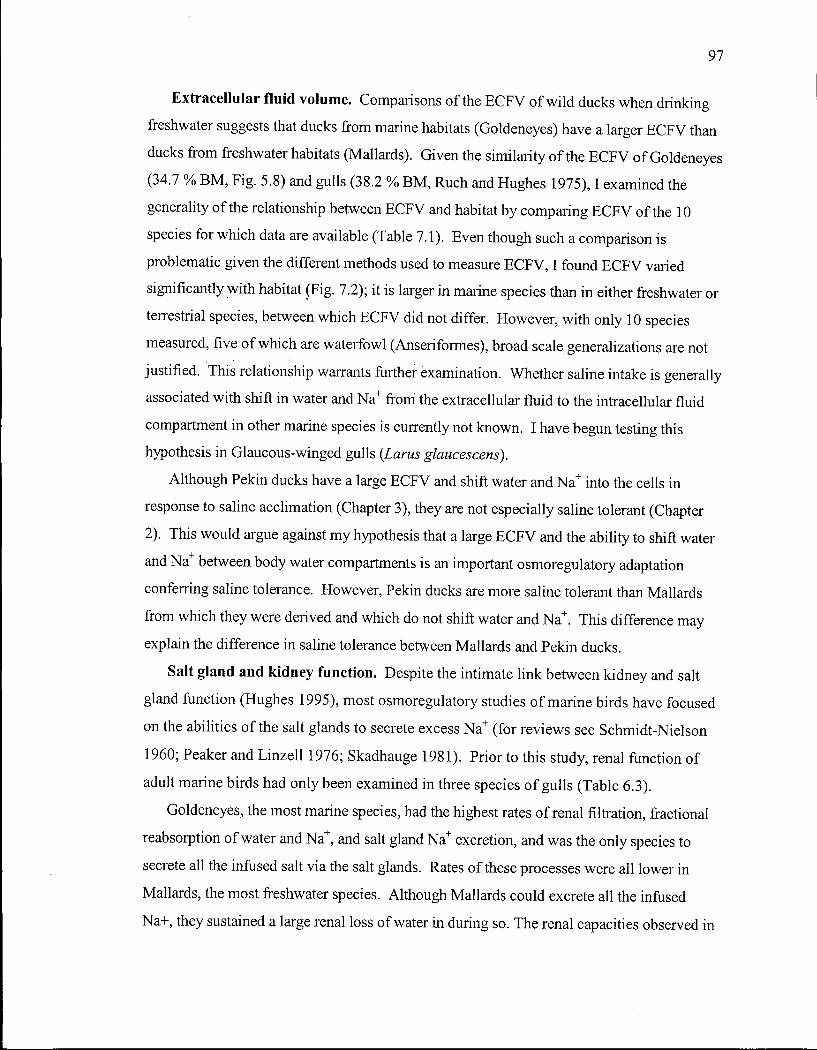
97
Extracellular fluid volume. Comparisons of the E C F V of wi ld ducks when drinking
freshwater suggests that ducks from marine habitats (Goldeneyes) have a larger E C F V than
ducks from freshwater habitats (Mallards). Given the similarity of the E C F V of Goldeneyes
(34.7 % B M , Fig. 5.8) and gulls (38.2 % B M , Ruch and Hughes 1975), I examined the
generality of the relationship between E C F V and habitat by comparing E C F V of the 10
species for which data are available (Table 7.1). Even though such a comparison is
problematic given the different methods used to measure E C F V , I found E C F V varied
significantly with habitat (Fig. 7.2); it is larger in marine species than in either freshwater or
terrestrial species, between which E C F V did not differ. However, with only 10 species
measured, five of which are waterfowl (Anseriformes), broad scale generalizations are not
justified. This relationship warrants further examination. Whether saline intake is generally
associated with shift in water and N a + from the extracellular fluid to the intracellular fluid
compartment in other marine species is currently not known. I have begun testing this
hypothesis in Glaucous-winged gulls (Larus glaucescens).
Although Pekin ducks have a large E C F V and shift water and N a + into the cells in
response to saline acclimation (Chapter 3), they are not especially saline tolerant (Chapter
2). This would argue against my hypothesis that a large E C F V and the ability to shift water
and N a + between body water compartments is an important osmoregulatory adaptation
conferring saline tolerance. However, Pekin ducks are more saline tolerant than Mallards
from which they were derived and which do not shift water and N a + . This difference may
explain the difference in saline tolerance between Mallards and Pekin ducks.
Salt gland and kidney function. Despite the intimate link between kidney and salt
gland function (Hughes 1995), most osmoregulatory studies of marine birds have focused
on the abilities of the salt glands to secrete excess N a + (for reviews see Schmidt-Nielson
1960; Peaker and Linze l l 1976; Skadhauge 1981). Prior to this study, renal function of
adult marine birds had only been examined in three species of gulls (Table 6.3).
Goldeneyes, the most marine species, had the highest rates of renal filtration, fractional
reabsorption of water and N a + , and salt gland N a + excretion, and was the only species to
secrete all the infused salt via the salt glands. Rates of these processes were all lower in
Mallards, the most freshwater species. Although Mallards could excrete all the infused
Na+, they sustained a large renal loss of water in during so. The renal capacities observed in

98
Table 7.1. Total body water (TBW) and extracellular fluid volume ( E C F V ) of various species of birds in relation to habitat type (T, terrestrial; F W , freshwater; M , marine).
Species Mass (g)
T B W (%)
E C F V (%)
Emu (Dromaius 399000 60.7 22.1
novaehollandiae)
Chicken (Gallus domesticus) 1795 61.8 24.7
Pigeon (Columba livia) 241 65.2 19.9
Canada Goose (Branta 3670 23.3
canadensis)
Mallard (Anas 1090 63.5 27.1
platyrhynchos) b
Pekin duck (Anas 2706 64.3 28.8
platyrhynchos) 0
Canvasback (Aythya 945 59.9 30.4
valisineridf
Barrow's Goldeneye 720 65.6 34.7
(Bucephala islandica) b
Adelie penguin (Pygoscelis 3979 63.2 31.0
adeliae)
Glaucous-winged gull (Larus 835 87.9 38.2
glaucescens)
Habitat Source 3
T
T
T
F W
F W
F W
F W
M
M
M
2,3,4,5
6
7
10,11,12
"Source: 'Dawson et al. (1983), 2 Medway and Kare (1959), 3 R u c h and Hughes (1975), 4Harris and Koike (1977), 5 Zhou et al. (1999), 6 A r a d et al. (1989), 7Hughes, unpublished data, 8 F i g . 5.8 (Chapter 5), 9Table 3.1 (Chapter 3), 1 0Douglas (1968), "Nagy and Obst (1992), 1 2 Chappel et al. (1993).
b Only freshwater values summarized from Fig . 5.8 are presented here. °Only freshwater values summarized from Table 3.1 are presented here.

99
GO
> LL O LU
T FW M
Habitat
Fig. 7.2. Comparison of extracellular fluid volume ( E C F V ) of birds in relation to
habitat (T terrestrial, F W freshwater, M marine). Values are means ± standard errors
and are summarized from Table 7.1 and Fig. 5.8.

100
Goldeneyes and Mallards are consistent with other avian species with salt glands from
marine and freshwater habitats, respectively (Chapter 6, Table 6.3).
Among birds with salt glands, glomerular filtration rate is greater in marine species than
in freshwater species (Table 6.3, Fig. 7.3). The high glomerular filtration rate of marine
birds is consistent with their larger kidneys (Hughes 1970b; Kalisinska et al 1999), higher
water flux rates (Hughes et al. 1987; Nagy and Peterson 1988; Chapter 5) and larger
extracellular fluid volumes (Fig. 7.2). However, marine birds are also carnivorous. These
patterns might also reflect adaptations to a carnivorous diet, although this possibility has not
yet been examined. The only terrestrial avian carnivore studied to date is the American
kestrel (Falco sparverius), that has a low glomerular filtration rate (Lyons and Goldstein
2002) and small kidneys like other birds that lack salt glands (Hughes 1972). This suggests
that greater renal mass and body fluid filtration are adaptations to the saline environment.
More studies on terrestrial avian carnivores, including Falconiform birds that have salt
glands (Cade and Greenwald 1966), might clarify these relationships.
The ability of the salt glands to secreted N a + may limit the distribution of Charadiiform
birds among saline habitats (Staaland 1967). This latter study found that the concentrating
capacity of the salt glands was correlated with the length of the secretory tubules, and the
volume of secretion with the size of the gland. Whether similar anatomical and
physiological adaptations of the salt glands solely account for the distribution of ducks
remains to be demonstrated, hi this study, the N a + concentration of the salt gland secretions
did not differ among the three species of ducks (Table 6.2), which argues against differences
in salt gland tubule length, however N a + secretion rate did differ. It was highest in
Goldeneyes (Table 6.2), and only Goldeneyes were able to secrete all the infused N a + via
their salt glands. Secretion flow rate is proportional to blood flow to the salt glands in Pekin
ducks (Kaul et al. 1983). Species differences in secretion flow rate may reflect hormonal
modulation of blood flow to the secretory cells or of the transport of N a + .
Schmidt-Nielson et al. (1963) suggested that marine birds might reabsorb N a + and water
from the urine in the lower intestinal tract (hindgut) and secrete the N a + via the salt glands in
less water than was absorbed with it to generate osmotically free water. This hypothesis has
received little attention (Skadhauge et al. 1984; Goldstein et al. 1986; Hughes et al. 1999).
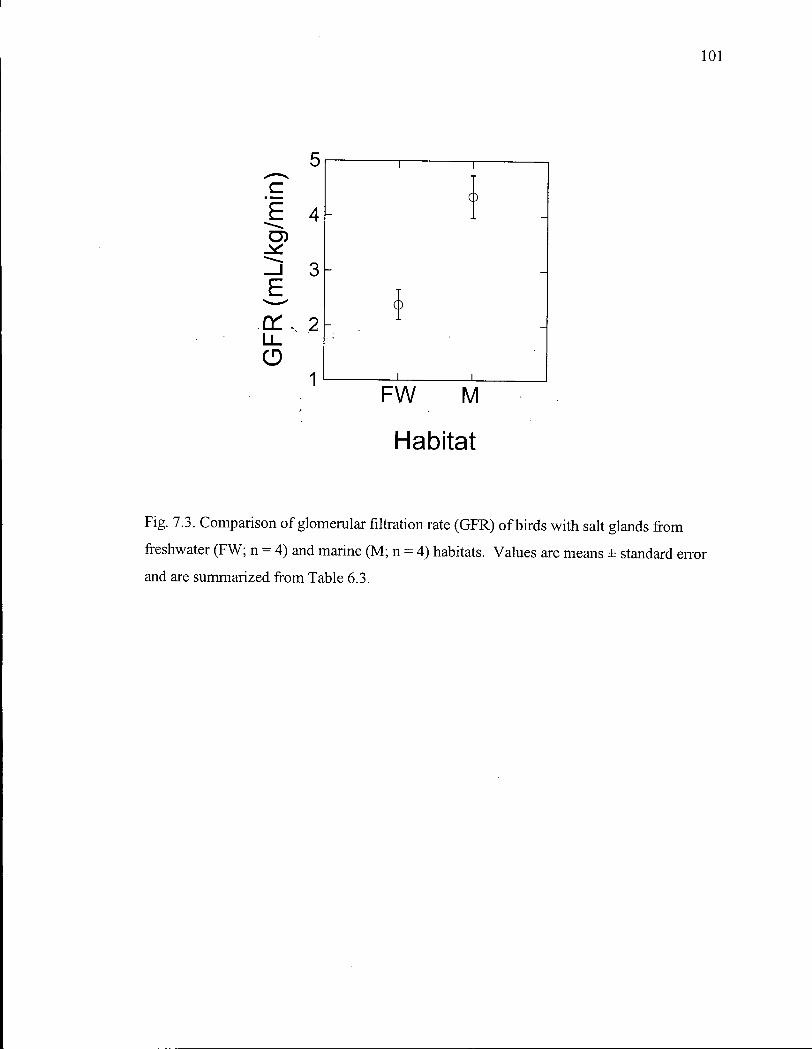
101
£
L L
O
FW M
Habitat
Fig. 7.3. Comparison of glomerular filtration rate (GFR) of birds with salt glands from
freshwater (FW; n = 4) and marine ( M ; n = 4 ) habitats. Values are means ± standard error
and are summarized from Table 6.3.

102
This mechanism appears to be relatively unimportant in gulls (Goldstein et al.1986), whose
kidneys reabsorb over 99% of the N a + in the renal tubules (Hughes 1995). However, it may
play an important role in ducks. Both Pekin ducks and Mallards reflux urine into the
hindgut (Hughes and Raveendran 1994; Hughes et al. 1999), where N a + uptake capacity is
only slightly diminished by saline acclimation (Skadhauge et al. 1984). I found that
Canvasbacks tolerated higher drinking water salinities than Mallards (Chapter 5), although
their renal and extrarenal N a + excretion during acute saline loading (Chapter 6) predicts they
could not excrete all the ingested N a + . This suggests that postrenal modification of urine
may play an important role in conservation of water in Canvasbacks.
In this thesis, I used traditional statistical procedures to examine the relationship
between some osmoregulatory traits (i.e. E C F V , GFR) and habitat in birds. However, these
methods do not take into account the potential confounding influences of phylogenetic
relatedness of species (Felsenstein 1985; Garland et al. 1992, 1993). A phylogenetic
analysis has been used to compare water flux (Tieleman and Williams 2000) and
evaporative water loss (Williams 1996) of desert birds to mesic species. Given the limited
number of species and the limited number of avian orders examined, similar analysis of the
traits identified in this thesis would be premature.
In conclusion, my findings show that water and N a + shifts in and out of the extracellular
fluid compartment of ducks (Chapters 3,4) contribute to stimulating salt gland secretion
(Chapter 4) and tolerance of saline (Chapters 3, 5). Future work might examine this
mechanism in other marine species. Salt gland secretion concentration of Pekin ducks is
lower when saline is drunk than when it is intravenously infused (Chapters 2,4). Suppressed
N a + absorption across the gut may modulate the imposed N a + load and, thereby, salt gland
function.

103
LITERATURE CITED
Ash R W (1969) Plasma osmolality and salt gland secretion in the duck. Q J Experiment Physiol 54:68-79.
Bennett D C Gray D A Hughes M R . Water flux and osmotic homeostasis in Pekin ducks (Anas platyrhynchos) during saline acclimation. J Comp Physiol B (submitted).
Bennett D C Hughes M R De Sobrino C N Gray D A (1997) Interaction of osmotic and volemic components in initiating salt-gland secretion in Pekin ducks. Auk 114:242-248.
Bennett D C Hughes M R Elliott JE Scheuhammer A M Smits JE (2000) Effect of cadmium on Pekin duck total body water, water flux, renal filtration, and salt gland function. J Toxicol Environment Health, Part A 59:43-56.
Bennett D C Kojwang D Sullivan T M Gray D A Hughes M R . Effect of saline acclimation on body water compartmentalisation in Pekin ducks. J Comp Physiol B (submitted).
Berger L Y u T F Gutman AB'(1960) Effects of drugs that alter uric acid excretion in man on uric acid clearance in the chicken. A m J Physiol 198:575-580.
Bevan R M Speakman JR Butler PJ (1995) Dai ly energy expenditure of Tufted ducks: a comparison between indirect calorimetry,.doubly labelled water and heart rate. Funct Ecol 9:40-47.
Bokenes L Mercer JB (1995) Salt gland function in the common eider duck (Somateria mollissima). J Comp Physiol B 165:255-267.
Bouverot P Hildwein G Le Goff D (1974) Evaporative water loss, respiratory pattern, gas exchange and acid-base balance during thermal panting in Pekin ducks exposed to moderate heat. Resp Physiol 21:255-269.
Bradley E L Holmes E L (1971) The effects of hypophysectomy on adrenocortical function in the duck (Anas platyrhynchos). J Endocrinol 49:437-457.
Braun E J (1976) Intrarenal blood flow distribution in the desert quail following salt loading. A m J Physiol 231:1111-1118.
Braun EJ (1978) Renal resonse of the starling. A m J Physiol 234:F270-F278.
Braun E J (1997) A n overview of avian renal function. In: Perspectives in avian endocrinology (Eds. S Harvey and R J Etches). Journal of Endocrinology Ltd, Bristol.
Braun E J Dantzler W H (1972) Function of mammalian-type and reptilian-type nephrons in kidney of desert quail. A m J Physiol 222:617-629.
104
Braun E J Dantzler W H (1974) Effects of A D H on single-nephron glomerular filtration rates in the avian kidney. A m J Physiol 226:1-8.
Braun E J Dantzler W H (1975) Effects of water load on renal glomerular and tubular function in desert quail. A m J Physiol 229:222-228.
Brummermann M , Simon E (1990) Arterial hypotension in ducks adapted to high salt intake. J Comp Physiol B 160:127-136.
Cade T J Greenwald L (1966) Nasal salt gland in falconiform birds. Condor 68:338-350.
Chan M Y Bradley E L Holmes W N (1972) The effects of hypophysectomy on the metabolism of adrenal steroids in the pigeon (Columba livid). J Endocrinol 52:435-450.
Dantzler W H (1966) Renal response of chickens to infusion of hypertonic sodium chloride solution. A m J Physiol 210:640-646.
Dawson TJ Maloney S K Skadhauge E (1991) The role of the kidney in electrolyte and nitrogen excretion in a large flightless bird, the emu, during different osmotic regimes, including dehydration and nesting. J Comp Physiol B 161:165-171.
de Leeuw JJ van Eerden M R Visser G H (1999) Wintering Tufted ducks Aythya fuligula diving for zebra mussels Dreissena polymorpha balance feeding costs within narrow margins of their energy budget. J Avian B i o l 30:182-192.
Deutsch H , Hammel H T , Simon E , Simon-Oppermann C (1979) Osmolality and volume factors in salt gland control of Pekin ducks after adaptation to chronic salt loading. J Comp Physiol 29:301-308.
Douglas DS (1966) L o w urine salt concentrations in salt loaded gulls. Physiologist 9:171.
Douglas D S (1968) Salt and water metabolism o f the Adelie penguin. Antarctic Research Series 12:167-190.
Douglas DS (1970) Electrolyte excretion in seawater-loaded herring gulls. A m J Physiol 219:534-539.
Dusterdieck G , McElwee G (1971) Estimation of angiotensin II concentration in human plasma by radioimmunoassay. Some applications to physiological and clinical states. Euro J C l i n Invest 2: 32-38.
Ensor D M Phillips J G (1972) The effect of dehydration on salt and water balance in gulls (Larus argentatus and L. fuscus). J Zool (London) 168:127-137.

105
Eramus T (1978) The relative importance of the various electrolyte excretory pathways in osmotically stressed penguins. Comp Biochem Physiol 59A:379-384.
Erbe K - H Gerstberger R Gray D A Simon E (1988) Electrolyte handling and osmoregulatory hormones in ducks during Na +-free or Cl"-free hypertonic salt gland stimulation. J Comp Physiol B 158:9-17.
Fletcher G L Holmes W N (1968) Observations on the intake of water and electrolytes by the duck (Anas platyrhynchos) maintained on freshwater and on hypertonic saline. J Exp B i o l 49:325-329.
Felsenstein J (1985) Phylogenies and the comparative method. A m Nat 125:1-15.
Garland T, Jr, Dickerman A W Janis C M Jones J A (1993) Phylogenetic analysis of covariance by computer simulations. Sys B i o l 42:265-292.
Garland T, Jr, Harvey P H Ives A R (1992) Procedures for the analysis of comparative data using phylogenetically independent contrasts. Syst B i o l 41 -.18-32.
Gerstberger R Gray D A (1993) Fine structure, innervation, and functional control of avian salt glands. Int Rev Cytol 144:129-215.
Gerstberger R K a u l R Gray D A Simon E (1985) Arginine vasotocin and glomerular filtration rate in salt-acclimated ducks. A m J Phsiol 248:F663-F667.
Gilmore JP Dietz J Gilmore C Zucker TH (1977) Evidence for a chloride pump in the salt gland of the goose. Comp Biochem Physiol 56A: 121-126.
Goldstein D L (1990) Effects of different sodium intakes on renal and cloacal sodium excretion in chukars (Aves: Phasianidae). Physiol Zool 63:408-419.
Goldstein D L (1993) Renal response to saline infusion in chicks of Leach's storm petrels (Oceanodroma leucorhoa). J Comp Physiol B 163:167-173.
Goldstein D L (1997) Osmoregulation by free-living birds: the need for field osmoregulatory endocrinology. In: Harvey, S & Etches, R J (eds) Perspectives in avian endocrinology: 305-314. Journal of Endocrinology Ltd, Bristol, U K .
Goldstein D L (1999) Patterns of variation in avian osmoregulatory physiology and their application to questions in ecology. In: Adams, N . J . & Slotow, R . H . (eds) Proc. 22 Int. Ornithol. Congr., Durban: 1417-1426. Johannesburg: BirdLife South Africa.
Goldstein D L Bradshaw SD (1998) Regulation of water and sodium balance in the field by Australian Honeyeaters (Aves: Meliphagidae). Physiol Zoo l 71:214-225.

106
Goldstein D L Bradshaw SD (1998) Renal function in red wattlebirds in response to varying fluid intake. J Comp Physiol 168:265-272.
Goldstein D L Braun E J (1988) Contributions of the kidneys and intestines to water conservation, and plasma levels of antidiuretic hormone, during dehydration in house sparrows (Passer domesticus). J Comp Physiol B 158:353-361.
Goldstein D L Rothschild E L (1993) Daily rhythms in rates of glomerular filtration and cloacal excretion in captive and wi ld song sparrows (Melospiza melodia). Physiol Zool 66:708-719.
Goldstein D L Skadhauge E (2000) Renal and extrarenal regulation of body fluid composition. Pages 265-297 in Sturkie's Avian Physiology (G. Whittow, Ed.) Academic Press San Diego.
Gray D A (1998) Circulating osmoregulatory peptide hormones o f birds. Trends in Comp Biochem Physiol 5:67-84.
Gray D A Eramus T (1988) Glomerular filtration changes during vasotocin-induced antidiuresis in kelp gull. A m J Phsiol 255:R936-R939.
Gray D A Eramus T (1989a) Control of renal and extrarenal salt and water excretion by plasma angiotensin II in the kelp gull (Larus dominicanus). J Comp Physiol B 158:651-660.
Gray D A , Erasmus T (1989b) Control of plasma arginine vasotocin in Kelp gulls (Larus dominicanus): Roles of osmolality, volume, and plasma angiotensin II. Gen Comp Endocrinol 74:110-119.
Gray D A Erasmus T (1989c) Plasma arginine vasotocin, angiotensin II, and salt gland function in freshwater- and seawater-adapted Kelp gulls (Larus dominicanus). J Exp Zool 249:138-143.
Gray D A Hammel H T Simon E (1986) Osmoregulatory effects of angiotensin II in a bird with salt glands (Anasplatyrhynchos). J Comp Physiol B 156:315-321.
Gray D A Kaul R Brummermann M Simon E (1987) Dissociation between apparent volumes of distribution for inulin and sodium by salt adaptation in ducks. Pflugers Arch 409:422-426.
Gray D A Schutz H Gerstberger R (1991) Plasma atrial natriuretic factor responses to blood volume changes in the Pekin duck. Endocrinol 128:1655-1660.
Gray D A Simon E (1983) Mammalian and avian antidiuretic hormone: studies related to possible species variation in osmoregulatory systems. J Comp Physiol B 151:241-246.
107
Gray D A Simon E (1985) Control of plasma angiotensin II in a bird with salt glands (Anasplatyrhynchos). Gen Comp Endocrinol 60:1-13.
Gregg C M Wideman F R , Jr (1990) Morphological and functional comparisons of normal and hypertrophied kidneys of adult domestic fowl (Gallus gallus). A m J Physiol 258:F403-F413.
Ha l l JE Guyton A C Farr B M (1977) A single-injection method for measuring glomerular filtration rate. A m J Physiol 23:F72-F76.
Hammel H T Simon E (1994) Salt gland excretion enhanced during cross circulation of the blood between two Pekin Ducks: evidence for positive feedback. Pages 497-508 in Integrative and cellular aspects of autonomic functions: temperature and osmoregulation (K. Pleschka and R. Gerstberger, Eds.). John Libbey Eurotext, Paris.
Hammel H T Simon-Oppermann C Simon E (1980) Properties o f body fluids influencing salt gland secretion in Pekin Ducks. A m J Physiol 239:R489-R496.
Hammel H T Simon-Oppermann C Simon E (1983) Tonicity of carotid blood influences salt gland secretion. J Comp Physiol B 149:451-456.
Hamrhons R L Hughes M R Moldenhauer R R (1988) Body water and water flux in fresh water and sea-water acclimated Clapper Rails, Rallus longirostris. Comp Biochem Physiol A 91:539-541.
Harriman A E (1967) Laughing gulls offered saline in preference and survival tests. Physiol Zool 49:273-278.
Harris K M Koike T l (1977) The effects of dietary sodium restriction on fluid and electrolyte metabolism in the chicken (Gallus domesticus) Conp Biochem Physiol 58A:331-317.
Hartter E (1986) Radioimmunological determination of arginine vasopressin and human atrial natriuretic peptide after simultaneous extraction from plasma. J C l i n Chem C l i n Biochem 24:559-563.
Holmes W N (1965) Some aspects of osmoregulation in reptiles and birds. Arch Anat Microscop Morphol Exp 54:491-514.
Holmes W N Adams B M (1963) Effects of adrenocortical and neurohypophysiol hormones on the renal excretory pattern in the water-loaded duck (Anas platyrhynchos). Endocrinol 73:5-10.
Holmes W N Fletcher G L Stewart D J (1968) The patterns of renal electrolyte excretion in the duck (Anas platyrhynchos) maintained on freshwater and on hypertonic saline. J Exp B i o l 45:487-508.
108
Holmes W N Phill ips J G Butler D G (1961) The effect o f adrenocortical steroids on the renal and extra-renal responses of the domestic duck (Anas platyrhynchos) after hypertonic saline loading. Endocrinol 69:483-495.
Hughes M R (1970a) Cloacal and salt-gland ion excretion in the seagull, Larus glaucescens, acclimated to increasing concentrations o f sea water. Comp Biochem Physiol 32:315-325.
Hughes M R (1970b) Relative kidney size in nonpasserine birds with salt glands. Condor 72:164-168.
Hughes M R (1980) Glomerular filtration rate in saline acclimated ducks, gulls and geese. Comp Biochem Physiol A 65: 211-213.
Hughes M R (1989a) Extracellular fluid volume and the initiation of salt gland secretion in ducks and gulls. Can J Zool 67:194-197.
Hughes M R (1989b) Stimulus for avian salt gland secretion. Pages 143-161 In: Progress in avian osmoregulation ( M . R. Hughes and A . Chadwick, Eds.). Special Publication. Leeds Philosophical and Literary Society, Leeds, United Kingdom.
Hughes M R (1995) Responses of gull kidneys and salt glands to NaCl-loading. Can J Physiol Pharmacol 73:1727-1732.
Hughes M R Bennett D C , Gray D A , Sharp PJ, Elliott JE. Effects of cadmium ingestion on plasma and osmoregulatory hormone concentrations in male and female Pekin ducks. J Toxicol Environment Health Part A . (submitted).
Hughes M R Bennett D C Sullivan T M Hwang H (1999) Retrograde movement of urine into the gut of salt water acclimated Mallards (Anas platyrhynchos). Can J Zool 77:342-346.
Hughes M R Braun E J Bennett D C (1995) Intersexual comparison of plasma osmolytes, kidney size, and glomerular number and size in pekin ducks (Anas platyrhynchos). Auk 112:782-785.
Hughes M R Chadwick A (1989) Progress in avian osmoregulation. Special Publication. Leeds Philosophical and Literary Society, Leeds, United Kingdom.
Hughes M R Goldstein D L Raveendran L (1993) Osmoregulatory responses of Glaucous-winged gulls (Larus glaucescens) to dehydration and hemorrhage. J Comp Physiol B 163:524-531.
Hughes M R Kojwang D Zenteno-Savin T (1992) Effects o f caecal ligation and saline acclimation on plasma concentration and organ mass in male and female Pekin ducks, Anas platyrhynchos. J Comp Physiol B 162:625-631.
109
Hughes M R Raveendran L (1994) Ion and luminal marker concentrations in the gut of saline-acclimated ducks. Condor 96:295-299.
Hughes M R Roberts JR (1988) Sodium uptake from the gut o f freshwater - and seawater-acclimated ducks and gulls. Can. J. Zool . 66:1365-1370.
Hughes M R Roberts JR Thomas B R (1987) Total body water and its turnover in free-living nestling Glaucous-winged gulls with a comparison of body water and water flux in avian species with and without salt glands. Physiol Zool 60:481-491.
Hughes M R Roberts JR Thomas B R (1989) Renal function in freshwater and chronically saline-stressed male and female Pekin ducks. Poult Sci 68:408-416.
Hughes M R Smits JE Elliott JE Bennett D C (2000) Morphological and pathological effects o f cadmium ingestion on Pekin ducks exposed to saline. J Toxicol Environment Health Part A 61:591-608.
Hughes M R Zenteno-Savin T Kojwang D (1991) Effects of saline acclimation and cecal ligation on body water and water flux in male and female Pekin ducks. Can J Zool 69:771-775
Hyden S Knutson P - G (1959) Renal clearance and distribution volume of polyethylene glycol and inulin in the chicken. Kungl Lantbrukshogskolans Annaler 25:253-25
KalisihskaEDahczak A Pierko M Wysocki D. (1999) Relationships between kidney mass and body size in some Anseriformes. Anat Histol Embryol 28:55-59
Kau l R Hammel H T (1979) Dehydration elevates osmotic threshold for salt gland secretion in the duck. A m J Physiol 237:R355-R359.
Korr J M (1939) The osmotic function of the chicken kidney. J Ce l l Comp Physiol 13:175-193.
Lavery G Dantzler W H (1982) Micropuncture of superficial nephrons in avian (Sturnus vulgaris) kidney. A m J Physiol 243:F561-F569.
Lavery G Dantzler W H (1983) Micropuncture study of urate transport by superficial nephrons in avian (Sturnus vulgaris) kidney. Pfliigers Arch 397:232-236.
Lavery G Wideman R F Jr (1982) Sodium excretion rates and renal responses to acute salt loading in the European starling. J Comp Physiol B 259:401-408.
Leary A M Roberts JR Sharp PJ (1998) The effect of infusion of hypertonic saline on glomerular filtration rate and arginine vasotocin, prolactin and aldosterone in the domestic chicken. J Comp Physiol B 168:313-321.
110
Lyons M E Goldstein D L (2002) Osmoregulation by nestling and adult American Kestrels (Falco sparverius) Auk. in press
Mohring J Schoun J Simon-Oppermann C Simon E (1980) Radioimmunoassay for arginine-vasotocin ( A V T ) in serum of Pekin ducks: A V T concentrations after adaptation to fresh water and salt water. Pflugers Arch 387:91-97.
Nagy K A Costa D P (1980) Water flux in animals: analysis o f potential errors in the tritiated water method. A m J Physiol 238:R454-R465
Nagy K A Peterson C C (1988) Scaling of water flux rate in animals. Un iv Ca l i f Publ Zool
Nechay B R Nechay L (1959) Effects of probenicid, sodium salicylate, 2,4-dinitrophenol and pyrazinamide on renal secretion of uric acid in chickens. J Pharmacol. Exp Ther 126:291-295.
Nickerson D M Facey D E Grossman G D (1989) Estimating physiological thresholds with continuous two-phase regression. Physiol Zool 62:866-887.
Nystrom K G Pehrsson 1988 Salinity as a constraint affecting food and habitat choice of mussel-feeding diving ducks. Ibis 130:94-110.
Orloff J Davidson D G (1959) The mechanism of potassium secretion in the chicken. J C l i n Invest 38:21-30.
Peaker M Linzel l J L (1975) Salt glands in birds and reptiles. Cambridge University Press, Cambridge.
Pitts R F (1938) The excretion of phenol red by chickens. J Ce l l Comp Physiol 11:99-l 15.
Pitts R F (1968) Physiology of the kidney and body fluids. 2 n d Edition. Year Book Medical Publishers Inc. Chicago, 111.
Pitts R F Korr I M (1938) The excretion of urea by the bird. J Ce l l Comp Phyiol 11:117-122.
Purdue JR Haines H (1977) Salt water tolerance and water turnover in the Snowy plover. A u k 94:248-255.
Raveendran L (1987) The effect of intravenous salt loading on osmoregulation of hydrated Glaucous-winged gulls, Larus glaucescens. M . S c . thesis, University of British Columbia, Vancouver.
Roberts JR (1991a) Effects of water deprivation on renal function and plasma arginine vasotocin in the feral chicken, Gallus gallus (Phasianidae). Aust J Zool 39:439-446.
I l l
Roberts JR (1991b) Renal function and plasma arginine vasotocin during water deprivation in an Australian parrot, the galah (Cacatua roseicapilla). J Comp Physiol 161:620-625.
Roberts JR (1992) Renal function and plasma arginine vasotocin during an acute salt load in feral chickens. J Comp Physiol B 162:54-58.
Roberts JR Baudinette R V Wheldrake JF (1985) Renal clearance studies in Stubble Quail coturnix pectoralis and K i n g Quail Coturnix chinensis under conditions of hydration, dehydration, and salt loading. Physiol Zool 58:340-34
Roberts JR Dantzler W H (1989) Glomerular filtration rate in conscious unrestrained starlings under dehydration. A m J Physiol 256:R836-R839
Roberts JR Dantzler W H (1992) Micropuncture study of avian kidney effect o f prolactin. A m J Physiol 262:R933-R937.
Roberts JR Hughes M R (1983) Glomerular filtration rate and drinking rate in Japanese Quail, Coturnix coturnix japonica, in response to acclimation to saline water. Can J Zool 61:2394-2398.
Roberts JR Hughes M R (1984) Exchangeable sodium pool size, and sodium turnover in freshwater- and saltwater-acclimated ducks and gulls. Can J Zool 62:2142-2145.
Ruch F E , Jr, Hughes M R (1975) The effects of hypertonic sodium chloride injection on body water distribution in ducks (Anas platyrhynchos), gulls (Larus glaucescens), and roosters (Gallus domesticus). Comp Biochem Physiol 52A: 21-28.
Sanner E (1965) Studies on biogenic amines and reserpihe induced block o f the diuretic action of hydrochlorothiazide and theophylline in the chicken. Acta Pharmacol Toxicol 22(Suppl 1):386
Schmidt-Nielsen K (1960) The salt-secreting gland of marine birds. Circulation 21: 955-967.
Schmidt-Nielsen K (1975) Animal Physiology. Adaptation and environment. Cambridge Unversity Press, London.
Schmidt-Nielsen K Borut A Lee P Crawford E Jr (1963) Nasal salt excretion and the possible function of the cloaca in water conservation. Science 142:1300-1301.
Schmidt-Nielsen K K i m Y - T (1964) The effect o f salt intake on the size and function of the salt glands in ducks. Auk 81:160-172.
Schmidt-Nielsen K Jorgensen C B Osaki H (1958) Extrarenal salt excretion in birds. A m J Physiol 193:101-107.
112
Schiitz H Gray D A Gerstberger R (1992) Modulation of kidney function in conscious Pekin ducks by atrial natriuretic factor. Endocrinol 130:678-684.
Schutz H Gerstberger R (1990) Atrial natriuretic factor ( A N F ) stimulates salt gland secretion through interaction with high affinity receptors in the Pekin duck (Anas platyrhynchos). Endocrinol 127:1718-1726.
Schutz H , Gray D A , Gerstberger R (1992) Modulation of kidney function in conscious Pekin ducks by atrial natriuretic factor. Endocrinol 130:678-684.
Shannon J A (1938a) The excretion o f exogenous creatinine by the chicken. J Cel l Comp Physiol 11:123-134.
Shannon J A (1938b) The excretion of uric acid by the chicken. J Ce l l Comp Physiol 11:135-148.
Shideman JR Evans R L Bierer D W Quebbemann A J (1981) Renal venous portal contribution to P A H and uric acid clearance in the chicken. A m J Physiol 240:F46-F53
Simon E Gray D A (1991) Control of renal handling of potassium loads in ducks with active salt glands. A m J Physiol 261:R231-R238.
Simon E Schmid H A (1996) Effects of angiotensin II and its blockers Sar'-Ile 8-angiotension II and DuP 753 on drinking in ducklings in relation to properties of subfornical organ neurons. J Comp Physiol B 165:607-614.
Singh D S , Bhattacharyya N K (1983) renal function in Hy-line layers fed sal-meal diets. Indian J A n i m Sci 53:349-350.
Skadhauge E (1964) The effect of unilateral infusion of arginine vasotocin into the portal circulation of the avian kidney. Acta Endocrinol 47:321-330.
Skadhauge E (1981) Osmoregulation in birds. Springer-Verlag, Berlin.
Skadhauge E Schmidt-Nielson B (1967) Renal function in domestic fowl. A m J Physiol 212:793-798.
Skadhauge E Munck B G Rice G E (1984) Regulation of N a C l and water reabsorption in duck intestine. In: Lecture notes on coastal and estuarine studies. V o l . 9. Osmoregulation in estuarine and marine animals. Pp. 131-142.Springer-Verlag, New York.
Sperber I (1960) Excretion. In: Biology and physiology o f birds. V o l . 1. ( A J Marshall, ed). Pages:469-492. Academic Press, London.
113
Stewart D J (1972) Secretion by salt gland during water deprivation in the duck. A m J Physiol 223: 384-386.
Svendsen C Skadhauge E (1976) Renal function in hens fed graded levels o f ochratoxin A . Acta Pharmacol Toxicaol 38:186-194
Sykes A H (1960a) The renal clearance of uric acid and p-amino hippurate in the fowl. Res Vet Sci 1:308-314
Sykes A H (1960b) The excretion of inulin, creatine and ferrocyanide by the fowl Res Vet Sci 1:315-320
Takei Y Okawara Y Kobayashi H (1989) Control of drinking in birds. In: Progress in Avian Osmoregulation ( M R Hughes, A Chadwick, eds). pg 1-12
Thomas D H Phillips J G (1975) Studies in avian adrenal steroid function III: Adrenalectomy and the renal-cloacal response in water-loaded domestic ducks (Anas platyrhynchos L . ) . Gen Comp Endocrinol 26:412-419.
Thomas D H Phillips J G (1975) Studies in avian adrenal steroid function. II. Chronic adrenalectomy and the turnover of tritiated water in domestic ducks, Anas platyrhnchos. Gen Comp Endocrinol 26:404-411.
Tielman B I Wil l iams JB (2000) The adjustment of avian metabolic rates and water fluxes to desert environments. Physiol Biochem Zool 73:461-479.
Walter A Hughes M R (1978) Total body water volume and turnover rate in fresh water and sea water adapted Glaucous-winged gulls, Larus glaucescens. Comp Biochem Physiol A 61:233-237.
Wideman R P Jr (1988) Avian kidney anatomy and physiology. C R C Critical Reviews i Poult B i o l 1:133-176.
Wideman R F Jr Satnick J L Mitsos W J Bennett K R Smith S R (1987) Effect of saline adaptation and renal portal sodium infusion on glomerular size distributions and kidney function in domestic fowl. Poult Sci 66:348-356.
Wilkinson I (1990) S Y S T A T : The system for statistics. S Y S T A T , Inc., Evanston, Illinois.
Williams JB (1996) A phylogenetic perspective of evaporative water loss in birds Auk 113:457-472.
Williams JB Braun E J (1996). Renal compensation for cecal loss in Gambel's quail (Callipepla gambelii). Comp Biochem Physiol 113:333-341.

114
Williams JB Pacelli M M Braun E J (1991) The effect o f water deprivation on renal function in conscious unrestrained gambel's quail (Callipepla gambelii). Physiol Zool 64:1200-1216.
Zenteno-Savin T (1991) Plasma arginine vasotocin and angiotensin concentrations during saline acclimation in birds with salt glands. M.Sc . thesis, University of British Columbia, Vancouver.