Effect of Remittance on Intensity of Agricultural
18
1 Effect of Remittance on Intensity of Agricultural Technology Adoption in Nepal Mahesh Pandit, Economist Department of Health and Hospital Baton Rouge, LA 70802 Email: [email protected] Krishna P. Paudel, Associate Professor Department of Agricultural Economics and Agribusiness 225 Martin D. Woodin Hall Louisiana State University and LSU AgCenter Baton Rouge, LA 70803 Office: (225) 578-7363 Fax: (225) 578-2716 Email: [email protected] Deborah Williams, Graduate Student Department of Agricultural Economics and Agribusiness 101 Martin D. Woodin Hall Louisiana State University and LSU AgCenter Baton Rouge, LA 70803 [email protected] Selected Paper prepared for presentation at the Southern Agricultural Economics Association 2014 Annual Meeting, Dallas, Texas, February 1-4, 2014. Copyright 2014 by Pandit, Paudel and Williams. All rights reserved. Readers may make verbatim copies of this document for non‐commercial purposes by any means, provided that this copyright notice appears on all such copies.
Transcript of Effect of Remittance on Intensity of Agricultural

1
Effect of Remittance on Intensity of Agricultural Technology Adoption in Nepal
Mahesh Pandit, Economist
Department of Health and Hospital
Baton Rouge, LA 70802
Email: [email protected]
Krishna P. Paudel, Associate Professor
Department of Agricultural Economics and Agribusiness
225 Martin D. Woodin Hall
Louisiana State University and LSU AgCenter
Baton Rouge, LA 70803
Office: (225) 578-7363
Fax: (225) 578-2716
Email: [email protected]
Deborah Williams, Graduate Student
Department of Agricultural Economics and Agribusiness
101 Martin D. Woodin Hall
Louisiana State University and LSU AgCenter
Baton Rouge, LA 70803
Selected Paper prepared for presentation at the Southern Agricultural Economics
Association 2014 Annual Meeting, Dallas, Texas, February 1-4, 2014.
Copyright 2014 by Pandit, Paudel and Williams. All rights reserved. Readers may make
verbatim copies of this document for non‐commercial purposes by any means, provided
that this copyright notice appears on all such copies.

2
Effect of Remittance on Intensity of Agricultural Technology Adoption in Nepal
Abstract
We analyzed data collected from face to face interviews of farmers in East Chitwan,
Nepal to understand the factors affecting the intensity of improved agriculture
technologies adoption. We used parametric and nonparametric instrument variable count
data models. Results from the Poisson Quasi Likelihood model indicated the positive
role of remittance payment on agricultural technology adoption, consistent with the
results from the nonparametric model. Additionally, the following variables have a
positive impact on technology adoption in the nonparametric model: landholding size and
number of animals.
Key words: agricultural technologies, Nepal, nonparametric instrument variable model,
Poisson quasi likelihood model, technology adoption
JEL Classifications: Q16, O13

3
Effect of Remittance on Intensity of Agricultural Technology Adoption in Nepal
Nepal is a small landlocked country in south Asia with a substantially underdeveloped
agricultural economy. Every year, a significant percentage of the young workforce
migrates to foreign countries for education and employment opportunities. The
Government of Nepal (GON) started encouraging migration with the objective of
reducing poverty. Remittance already accounts for 23 percent of GDP in the country, and
it is expected to grow (Agrawal et al. 2005, Thieme et al. 2005, Yang 2011). The
potential impact of remittance on technology adoption in a country where mass migration
is common and more than 80 percent of households still depend on home production
makes Nepal a perfect case study to explore the role of migration in agricultural
technology adoption.
The problem is that migration may lead to a growing dependence on remittance
income, and could result in unfavorable outcomes in the long run, including the lack of
labor force in the home country. One solution to the labor shortage is to switch labor
intensive agriculture to a more mechanized form of agricultural operations. Remittance
has the potential to fund agricultural development in rural economies by financing
technologies (Firdaus et al. 2010). If a farmer/household uses remittance income to adopt
improved agricultural technology, that should help increase his/her profitability and
reduce food imports in this country.
Our objective is to identify the impact of pertinent explanatory variables on the
intensity of agriculture technology adoption using parametric and nonparametric Poisson
models. Variables affecting the intensity of technology adoption and possible policy
solutions are outlined.

4
Method
Traditionally, econometric models in the intensity analysis literature have used Poisson
(or Zero Inflated Poisson) and negative binomial (NB) models. The explanatory variables
in these models have always been entered in a parametric fashion. There are many
variables that impact technology adoption intensity yet we do not know whether those
should be entered in a parametric or a nonparametric fashion. An ad hoc model
specification is thus troubling and points a need to look at alternative specification.
Additionally, some variables in the regression model are potentially endogenous. If this
occurs, it is necessary to estimate the regression using a nonparametric endogenous
variable model.
Within the intensity literature focusing on parametric models, Zhou et al. (2012)
proposed using a log-normal based NB distribution. However, Staub and Winkelmann
(2013) claimed that estimates obtained from the zero-inflated maximum likelihood
estimates have both consistency and efficiency concerns if the model is misspecified.
They proposed a Poisson quasi-likelihood estimator (PQL) because of its robustness to
misspecification, when compared to the ML estimation of fully parametric zero-inflated
count models. The Poisson quasi-likelihood can be presented as
(1) ( ) ∑ ̃( ) ̃( )
Here, ̃( ) ( ) ( ( )), is a vector of variables, represents
parameters corresponding to the variables, and represents variables entered in the zero-
inflated part with corresponding parameters .
Using a nonparametric approach to study technology adoption intensity is
relatively new. Sharma et al. (2011) used nonparametric (NP) count data models to study
5
the number of technologies and pest control strategies adopted by UK cereal farmers.
They found that a nonparametric model specification was preferred over a parametric
model. We found that the conservation practices adopted in a technology adoption model
is an endogenous variable, so we use a nonparametric instrumental variable approach of
estimation. Given an already well developed literature on the count data models, we
provide a brief introduction to the nonparametric instrumental variable model relevant to
this study.
The nonparametric regression model is given by:
(2) ( ) ∑ ( )
where P is the number of agricultural technology adopted, ( ) is an unknown smooth
function for endogenous variable , and ( ) is the unknown function for other factors
.
When there are ordinal explanatory variables, we need an estimation procedure
that can address the ordinal nature of the variables. For simplicity, let us consider
( ) ( ) ∑ ( ) . Then, equation (2) can be written as:
(3) ( ) ( | )
for all instruments and exogenous covariates , which is equivalent to:
(4) ( )| .
In this model, y denotes endogenous variable, X denotes exogenous explanatory
variables, and W denotes our instrument. To address ordinal and categorical variables in
a nonparametric model, we use a method suggested by Ma and Racine (2013), Nie and

6
Racine (2012), and Ma et al. (2011) to estimate the nonparametric instrumental variable
model1 given in equation (4).
Data
In order to test the hypothesis that migration and remittance have an overall positive
effect on the number of agricultural technology adoption, we collected data from face to
face interviews using a stratified random sample of households from Chitwan, Nepal,
between February and April of 2013. Before conducting the survey, we used the feedback
from the focus group survey that was conducted in two locations within the survey area
to modify the questionnaire and make it relevant to our study. The study location was
chosen based on the sample of the population participating in migration, and dominance
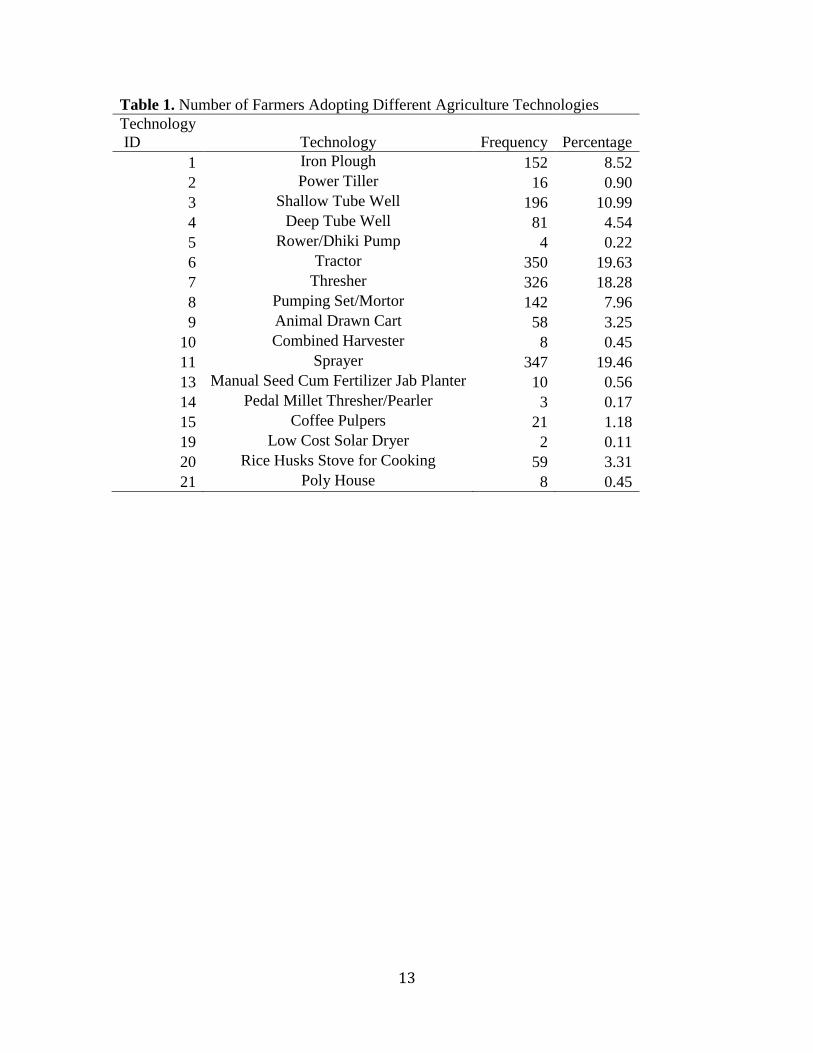
of the agricultural sector in the economy. There were a total of 21 technologies
considered in the study; however, four technologies were not adopted by any farmers
surveyed in the study area. The technologies considered are Iron Plough, Power Tiller,
Shallow Tube Well, Deep Tube Well, Rower/Dhiki Pump, Tractor, Thresher, Pumping
Set, Animal Drawn Cart, Combined Harvester, Sprayer, Biomass Gasifiers, Manual
Seed-cum-Fertilizer Jab Planter, Pedal Millet Thresher, Coffee Pulpers, Minimum Till
Drill, Zero Till Drill, Mini SRR (Simple, small, low-cost dryers), Low-Cost Solar Dryer,
Rice Husks Stove for Cooking, and Poly-house. The number of farmers adopting each
technology is given in Table 1. Intensity of technologies and the number of technologies
adopted by farmers are given in Figure 1.
1 The ‘crs’ R package is available to estimate the nonparametric model which contains
both categorical and continuous variables. See Racine et al. (2012) for the ‘crs’ package
manual.
7
Results
We estimated the impact of remittance on the intensity of agriculture technology adoption
by Nepali farmers. The dependent variable used was the number of agricultural
technologies adopted by farmers as shown in Figure 1. It is evident from the figure that
most farmers have adopted about five different agricultural technologies. The analysis
was performed by using a Poisson quasi-likelihood (PQL) model. The results indicated
that an increase in the household's income from remittances increased the number of
agricultural technologies adopted. Farmers getting remittance money are able to afford
better technologies. The farmers who know their soil quality is either good or bad adopt
less agriculture technologies than those who do not know their soil quality at all. On the
other hand, the farmers who use more conservation technologies are also using more
improved agriculture technologies. The farmers who lack information on soil quality
may be adopting haphazardly (therefore quantity does not reflect appropriateness); or
they may be adopting more of the cheaper technologies, subsided technologies, or the
ones that do not require knowledge of soil quality. The farmers who practice conservation
(mitigating poor soil/water quality or improving good soil/water quality) are more likely
to be using the technologies that are most appropriate for improving productivity. The
negative impact of age on the number of agricultural technologies adopted may reflect
the predominance of cultural subsistence practices among older farmers.
We also estimated the model using a nonparametric instrument variable model.
As identified in the PQL model, the number of conservation practices adopted by farmers
is an endogenous variable. Therefore, in the nonparametric instrument variable model,

8
the number of conservation practices used is an endogenous variable, and we used total
number of infrastructure used in the farm the previous year as the instrument variable.
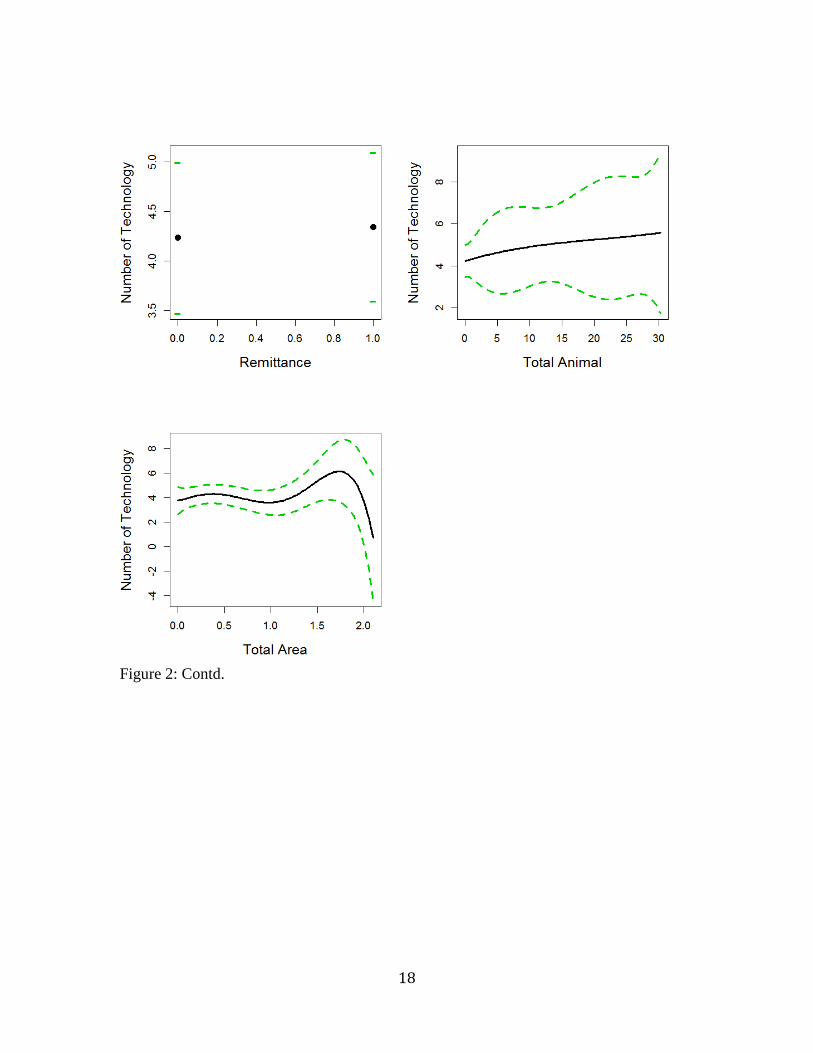
Results from a nonparametric instrument variable model are shown in Figure 2.
The number of conservation technology used does not impact technology adoption
beyond the level at which farmers use five conservation technologies. Age has a positive
impact on up to a total of four technologies adopted. In general, existing literature in
technology adoption states that the age has negative effect on technology adoption. Our
finding is different. This may be because farmers are older and they are forced to farm in
the absence of their young able children due to short or long term migration. Therefore,
to take advantage of what is going on and to take advantage of modern labor saving
farming technologies, they adopt higher number of improved technologies. They may
have more experience with some of the farming technologies we tested (they were
disseminated in their youth), so they may have more confidence in using them, for
example the iron plow, shallow tube wells, and pumping set. We found education to
have a cubic relationship with technology adoption although the relationship is not as
distinct as one would have expected. As the level of schooling increases the number of
technologies adopted decreases, and then at around [certain education level] years of
schooling, the households begin to adopt a greater number of agricultural technologies.
The highest number of technology adoption (4.5) occurs when a respondent has 13 years
of schooling. Increasing educations levels could be leading to off-farm employment
initially, but at some point, in corroboration with previous literature, the education levels
increase adoption rates. We find that remittance receiving households have adopted
slightly higher numbers of technologies than the households who did not receive

9
remittances. The non-remittances receiving households could have used income or
agricultural loans to purchase the technology. Chitwan is also one of the more
agriculturally developed districts in Nepal; there are cooperatives (farmers are able to use
technology if they belong to the cooperative) and a renting market for technologies like
tractors. Households with more animals are likely to adopt more technologies. In
Chitwan, farmers are commercially producing dairy, poultry, vegetables and fisheries.
The commercial production of animals/vegetables requires that they adopt more
improved technologies. We also found that farmers with larger landholdings adopting
more technology, but the trend declines after the landholding size reaches 1.8 bighas
(1.5 bigha =1 hectare). Large landholders may be renting out their land in the
sharecropping market, and sharecropping has been associated with lower adoption rates
in other countries.
Conclusions
We estimated parametric Poisson Quasi-Likelihood and nonparametric endogenous
Poisson models to understand the agriculture technology adoption behavior of farmers in
Chitwan, Nepal. Our results indicated that remittance has positive impact on the number
of technologies adopted. Other variables impacting technology adoption are animal
number and age of the household.
Widespread availabilities of technologies may help to improve adoption pattern.
Farmers do not have easy access and availability of technologies in the study region.
Additionally, government and policy makers can focus on providing loan to farmers to

10
increase the adoption. Targeting older farmers and those who operate commercial
agriculture may be helpful in this aspect.
Acknowledgement
This work was partially funded by the USAID.

11
References
Agrawal, A. and K. Gupta. 2005. Decentralization and Participation. World
Development 33(7): 1101–1114.
FAO, 2008. What is Conservation Agriculture. in: Conservation Agriculture website
of FAO, http://www.fao.org/ag/ca/1a.html
Firdaus, G. and A. Ahmad. 2010. Exploring Diversity Among Farmers
in Adoption of Agricultural Innovation and Options for Smallholder Farming
System-A Case Study of Ambedkarnager District of UP. International Research
Journal of Applied and Basic Sciences 1 (1), 25-36.
Frost, P., B. Campbell, M. Luckert, M. Mutamba, A. Mandondo and W. Kozanayi. 2007.
In Search of Improved Rural Livelihoods in Semi-Arid Regions through Local
Management of Natural Resources: Lessons from Case Studies in Zimbabwe.
World Development Vol. 35 (11):1961–1974.
Kolawole, A.; O. I. Oladele; C.I. Alarima; and T. Wakatsuki. 2012. Farmers’ Perception
of Sawah Rice Production Technology in Nigeria. Journal of Human Ecology
37(1): 13-17.
Lez-Vega, C.G. and J. Rodriguez-Meza, D Southgate; and J.H. Maldonado. 2004.
Poverty, Structural Transformation, and Land Use in El Salvador: Learning From
Household Panel Data. American Journal of Agricultural Economics 86 (5):
1367–1374.
Ma, S., and J.S. Racine. 2013. "Additive Regression Splines with Irrelevant Categorical
and Continuous Regressors." Statistica Sinica 23:515-541.

12
Ma, S., J.S. Racine, and L. Yang. 2011. "Spline Regression in the Presence of Categorical
Predictors." Working paper, McMaster University and Michigan State University.
Maphosa, F. 2007. Remittances and Development: the Impact of Migration to
South Africa on Rural Livelihoods in Southern Zimbabwe. Development Southern
Africa 24 (1): 125-135.
Nie, Z., and J.S. Racine. 2012. The CRS Package: Nonparametric Regression Splines for
Continous and Categorical Predictors. The R Journal 4:48-56.
Sharma, A., A. Bailey, and I. Fraser. Technology Adoption and Pest Control Strategies
among UK Cereal Farmers: Evidence from Parametric and Nonparametric Count
Data Models. Journal of Agricultural Economics 62(2011):73-92.
Staub, K.E., and R. Winkelmann. Consistent Estimation of Zero-Inflated Count Models.
Health Economics 22(2013):673-686.
Thieme, S. and S. Wyss. 2005. Migration Patterns and Remittance Transfer in Nepal: A
Case Study of Sainik Basti in Western Nepal. International Migration 43 (5): 59-
98.
Yang, D. 2011. Migrant Remittances. Journal of Economic Perspectives 25
(Summer): 129-152.
Zhou, M., L. Li, D. Dunson, and L. Carin "Lognormal and Gamma Mixed Negative
Binomial Regression",
http://people.ee.duke.edu/~lcarin/Mingyuan_ICML_2012.pdf (accessed June 2,
2012).
13
Table 1. Number of Farmers Adopting Different Agriculture Technologies
Technology
ID
Technology Frequency Percentage
1 Iron Plough 152 8.52
2 Power Tiller 16 0.90
3 Shallow Tube Well 196 10.99
4 Deep Tube Well 81 4.54
5 Rower/Dhiki Pump 4 0.22
6 Tractor 350 19.63
7 Thresher 326 18.28
8 Pumping Set/Mortor 142 7.96
9 Animal Drawn Cart 58 3.25
10 Combined Harvester 8 0.45
11 Sprayer 347 19.46
13 Manual Seed Cum Fertilizer Jab Planter 10 0.56
14 Pedal Millet Thresher/Pearler 3 0.17
15 Coffee Pulpers 21 1.18
19 Low Cost Solar Dryer 2 0.11
20 Rice Husks Stove for Cooking 59 3.31
21 Poly House 8 0.45

14
Table 2. Summary Statistics
Variable Variable Definition Obs Mean Std. Dev. Min Max
Age Age of household operator (year) 385 52.756 13.738 22 92
Gender =1 if female 394 0.046 0.209 0 1
Education
Number of schooling years of household
operator 396 5.369 5.039 0 22
squality1 =1 if good soil quality-yes 388 0.936 0.246 0 1
squality2 =1 if good soil quality-no 388 0.041 0.199 0 1
tot_inc Total income (Rs. 1000) 396 23.715 48.419 0 887
Remittance =1 if remittance received 384 0.102 0.302 0 1
total_animal Total animals in farm 396 0.676 3.636 0 32
tot_area Total area cultivated 365 0.349 0.298 0 2.1
tot_machinary Number of machinery and equipment used 388 4.595 1.848 0 14
tot_tech Number of conservation technology used 396 5.316 3.055 0 19
tot_inf_available Number of agricultural infrastructure used
last year
389 7.442 2.738 0 22

15
Table 3. Estimated Parameter and Marginal Effects from the PQL Model
Variables Coef. P-value Marg. Eff. P-value
Age -0.007 0.574 0.021 0.025
Gender 0.135 0.122 0.636 0.122
Education 0.005 0.321 0.023 0.320
squality1 -0.196 0.034 -0.922 0.033
squality2 -0.339 0.027 -1.590 0.026
tot_inc 0.009 0.371 0.013 0.060
Remittance 0.157 0.007 0.737 0.007
total_animal -0.006 0.450 -0.026 0.450
tot_area 0.010 0.870 0.046 0.870
tot_tech 0.122 0.000 0.573 0.000
Note: Vung test for zero inflated = 1.6 with P-value=0.039.
Number of conservation technology is found to be endogenous and total infrastructure
used last year is used as instrument variable.

16
Figure 1. Number of technologies used by farmers.

17
Figure 2: Nonparametric instrumental variable estimation.
18
Figure 2: Contd.