EFFECT OF PVC STAY-IN-PLACE FORMWORK ON THE HYDRATION OF · PDF fileEFFECT OF PVC...
88
EFFECT OF PVC STAY-IN-PLACE FORMWORK ON THE HYDRATION OF CONCRETE PROJECT REPORT TO OCTAFORM SYSTEMS INC. August 23, 2007 CEE Group 07.3 College of Science and Engineering Seattle University
-
Upload
trinhtuyen -
Category
Documents
-
view
225 -
download
3
Transcript of EFFECT OF PVC STAY-IN-PLACE FORMWORK ON THE HYDRATION OF · PDF fileEFFECT OF PVC...
EFFECT OF PVC STAY-IN-PLACE FORMWORK
ON THE HYDRATION OF CONCRETE
PROJECT REPORT TO
OCTAFORM SYSTEMS INC.
August 23, 2007
CEE Group 07.3 College of Science and Engineering
Seattle University
Rishi Gupta Octaform Systems Inc. Suite 520 885 Dunsmuir Street Vancouver, BC Canada V6C 1N5 August 23, 2007 RE: Project Report Dear Mr. Gupta:
We are pleased to submit to you the final report detailing our study of the effects of the Octaform stay-in-place formwork system on the hydration of concrete. This report contains a summary of the thermal and compression test procedures as well as an in depth analysis of the results of each of these tests.
The testing program consisted of the following variables: formwork material, wall thickness, concrete composition, and insulation inclusion. By monitoring the temperature of all specimens during testing, the extent of the hydration process was determined. Some specimens were used in compressive testing, and this data was evaluated to investigate the relationship between temperature development and strength development.
The average difference in temperature development between the normal concrete and fly ash mixes for Octaform is only 31%, whereas the average difference between the normal concrete and fly ash mixes for the wood is 49%. These results suggest that Octaform may enhance the hydration process when supplementary cementitious materials are used, which is cost effective and environmentally advantageous. Also, when Octaform is used with insulation, there is an increase in temperature development, which may prove to be beneficial when used in colder climates.
The lab conditions associated with this experimental program did not incorporate size and temperature effects present in the field. Differences in the size may alter the hydration process, and stripping the formwork exposes the concrete to ambient temperature. Future testing should incorporate these aspects which could not be accounted for in the testing program designed.
We appreciate your hard work and dedication to our project. If you have any questions, please do no hesitate to contact us. Sincerely, Seattle University Design Team CEE 07.3 Kristian Lowrie David Sommer Nikki Wheeler cc: Dr. Katherine Kuder, Seattle University Faculty Advisor
Design Team CEE 07.3 900 Broadway Avenue
Seattle, WA 98122
i
EFFECT OF PVC STAY-IN-PLACE FORMWORK ON THE HYDRATION OF
CONCRETE
Project Sponsor Octaform Systems Inc.
Project Liaison
Rishi Gupta
Engineering Design Group CEE 07.3
Seattle University Project Engineers
Kristian Lowrie David Sommer Nikki Wheeler
Project Faculty Advisor Dr. Katherine Kuder
Civil Engineering Senior Design Coordinator Dr. Nirmala Gnanapragasam, P.E.
Science and Engineering Project Center Director Jeff Gilles
August 23, 2007
ii
Abstract
Seattle University civil engineering design team 07.3 has worked closely with Octaform representatives to evaluate the effect of their concrete encasement technology on the hydration process of concrete. Temperature and compression tests were performed on walls formed by the Octaform system and the results were compared to data obtained from walls formed by wood formwork, which is the material typically used in the field. The testing showed that with an increase in wall thickness, the peak temperature and the temperature development index (TDI) increased proportionally. When insulation pieces were included with the Octaform system, the peak temperature and TDI increased when compared to walls without insulation. Under the testing conditions associated with this work, the results indicate that Octaform achieves a lower TDI in comparison to wood formed specimens. When insulation is used with the normal concrete mix, peak temperature and temperature development increase by 10% and 53% respectively for the Octaform system, and 15% and 19%, respectively for the wood system. In comparison to the wood system, the inclusion of insulation with the Octaform system appears to have a greater effect on temperature development and peak temperature. Results also show that the insulated Octaform system used with the fly ash mix achieved greater temperature development compared to the non-insulated wood formed system used with the normal concrete mix. This indicates that the Octaform system used under these conditions more positively contributes to the hydration process in comparison to the non-insulated wood system used with normal concrete. The effects of fly ash on the two forming systems were also analyzed. In comparison to normal concrete specimens, specimens containing fly ash achieved lower peak temperatures and TDI, while reaching peak temperature at a later time. These results indicate that when fly ash is used there is a delay in the hydration reaction. The average difference between the normal concrete and fly ash mixes for Octaform was 31%, whereas the average difference between the normal concrete and fly ash mixes for the wood was 49%. This indicates that the Octaform system may enhance the hydration process when fly ash is used as a replacement for cement. The data showed that the TDI is a good indicator of the extent of the hydration reaction, and that temperature development is proportional to strength gain of concrete. Further testing is needed to better approximate field conditions, particularly conditions associated with the stripping of the wood formwork material and colder ambient temperatures.
iii
Acknowledgements
We would like to thank Rishi Gupta with Octaform, Inc, and Dr. Katherine Kuder with Seattle University for assistance, advice, and guidance throughout the project. Thank you to Rob Shoegrun at LaFarge for his donation of cement, Centralia for their donation of fly ash, Glacier Northwest for their donation of all of our course and fine aggregate, Lowe’s Home Improvement- Rainier Valley for their donation of the plywood and sawn lumber needed for our formwork systems, and the Seattle University Carpentry Department for the donation of material for our bracing system. Thank you to Mark Gallo with the Seattle University Carpentry Department, who spent many hours building and modifying the bracing system for our formwork configurations. Thank you to Jeff Wilhite of the Seattle University Machine Shop and Fred Jienke, Lab Manager to the Civil Engineering Department, in assisting our team with our experimental setup. Thank you to Dr. Nirmala Gnanapragasam for her assistance in coordinating all aspects of the Senior Design project. Thank you to our senior design classmates for their hard work in transporting aggregate materials into our laboratory and offering valuable feedback and constructive criticism of our presentations.
iv
Table of Contents
List of Figures .................................................................................................. v
List of Tables................................................................................................... vi I. Introduction ............................................................................................. 1
A. Background.................................................................................................................1 B. Research and Design Objectives.................................................................................3
II. Literature Review.................................................................................... 5 A. Concrete: Cement and Supplementary Cementitious Materials .................................5 B. Hydration ....................................................................................................................6 C. Methods to evaluate hydration....................................................................................9
III. Experimental Program ......................................................................... 11 A. Materials and Equipment ..........................................................................................11 B. Mixing Procedure .....................................................................................................13 C. Preliminary Work .....................................................................................................13 D. Simulated field casting..............................................................................................16
IV. Results and Analysis.............................................................................. 24 A. Preliminary Testing...................................................................................................24 B. Primary testing..........................................................................................................27 C. Strength Testing........................................................................................................35
V. Conclusions and Recommendations .................................................... 37 A. Summary of Findings................................................................................................37 B. Size Effect.................................................................................................................37 C. Temperature Effect ...................................................................................................37 D. Recommendations for Further Research...................................................................37 E. Suggestions ...............................................................................................................38
VI. References............................................................................................... 39 Appendix A – Data .......................................................................................... 1 Appendix B – Sample Calculations ............................................................... 1 Appendix C – Request For Proposal ............................................................. 2 Appendix D – Resumes ................................................................................... 1
v
List of Figures
Figure 1: Octaform applications; (a) Agricultural storage; (b) Aquaculture tank; and (c) Car wash wall surrounded by Octaform (Octaform 2006) ....................................................... 2
Figure 2: Components of Octaform cell (a) Cell containing all components, (b) Schematic of Octaform cell with insulation and without T-connector (Octaform 2006).................... 3
Figure 3: Octaform systems: (a) Retaining wall; and (b) Octaform wall during construction (Octaform 2006) ................................................................................................................ 3
Figure 4: Temperature versus time comparison for different cement mixes (Mindess and Young 1981) ...................................................................................................................... 6
Figure 5: Compressive strength of concrete in various curing conditions (Price 1951)........ 7 Figure 6: Heat of hydration at various temperatures (Neville 1981)..................................... 8 Figure 7: Measured temperature variation in concrete slabs under various curing
conditions; (a) Air-dried slab, (b) Moist-cured slab, (c) Insulated slab (Khan, Cook et al. 1998) .................................................................................................................................. 9
Figure 8: Temperature versus time for various curing temperatures (Wang, Ge et al. 2006)9 Figure 9: Rate of heat evolution versus Time...................................................................... 10 Figure 10: Coffee cup method for measuring semi-adiabatic calorimetry .......................... 14 Figure 11: Temperature versus time for calorimetry testing in ambient lab conditions...... 15 Figure 12: Temperature versus time for calorimetry testing of mortar specimens with 0, 20,
40, and 60% of fly ash replacing cement......................................................................... 15 Figure 13: Modified Octaform wall configuration .............................................................. 16 Figure 14: Formwork bracing system designed by team CEE 07.3 .................................... 17 Figure 15: Thermocouple positioning.................................................................................. 18 Figure 16: Temperature measurement analysis critical points ............................................ 20 Figure 17: Temperature versus time for 8 inch wood fly ash specimens, depicting the effect
of starting time on ambient and peak temperatures ......................................................... 21 Figure 18: Effect of start time on ambient temperature during test..................................... 22 Figure 19: Coring of test walls ............................................................................................ 23 Figure 20: Temperature versus time for calorimetry test one.............................................. 24 Figure 21: Average temperature versus time curves for repeatability tests......................... 26 Figure 22: Repeatability test; thermocouple placement investigation................................. 27 Figure 23: Average temperature versus time curves for Octaform walls ............................ 28 Figure 24: Average temperature development versus wall thickness for Octaform
specimens......................................................................................................................... 29 Figure 25: Average temperature versus time for Octaform walls with and without insulation
......................................................................................................................................... 30 Figure 26: Average temperature versus time curves for wood formed walls...................... 31 Figure 27: Average temperature development versus wall thickness for wood specimens 32 Figure 28: Average temperature versus time for wood walls with and without insulation . 33 Figure 32: Average temperature development for wood and Octaform specimens ............ 34
vi
List of Tables
Table 1: Chemical composition of fly ash, Class F from Centralia, WA............................ 12 Table 2: Mortar mix design ................................................................................................. 12 Table 3: Concrete mix design .............................................................................................. 13 Table 4: 8 inch wood with fly ash mix data for specimens with different start times......... 21 Table 5: Cored 8 inch walls ................................................................................................. 23 Table 6: Calorimetry data for tests 1, 2 and 3...................................................................... 25 Table 7: Repeatability data for tests 1, 2 and 3.................................................................... 26 Table 8: Octaform wall thickness and composition test results summary........................... 28 Table 9: Wood wall thickness and composition test results summary ................................ 31 Table 10: Average compressive strength of concrete cylinders with varying fly ash content
......................................................................................................................................... 35 Table 11: Average compressive strength of cores from 8 inch wall specimens.................. 36
1
I. Introduction Octaform Systems Incorporated has requested that Seattle University Senior Design team CEE-07.3 evaluate the influence of their poly-vinyl chloride (PVC) formwork on the hydration of concrete. An experimental program has been designed and implemented to evaluate the effects of the PVC formwork on hydration and strength development. Testing methods have been developed to simulate field casting conditions in the lab. Experimental variables including formwork material, wall thickness, and insulation were introduced to compare the PVC formwork to typical wood forms.
A. Background Concrete is the most commonly used building material in the world. One of the reasons for this extensive use is the ease with which it can be formed. Concrete can be poured into forms, or a system of formwork, to produce structural elements, such as beams, columns and walls, and nonstructural members, such as roads, sheathing and tunnel linings. Reinforcing bar, or rebar, is placed within the formwork and the concrete is poured around it. Standard formwork is then removed (stripped) at a later time. Ideally, the formwork is stripped after the concrete has achieved sufficient strength so that it is capable of sustaining its own weight, as well as other applied loads. Typically, wood formwork is used to form concrete. However, due to concerns about increasing costs of wood, the amount of wood that is harvested has been reduced, increasing the cost and reducing the availability of wood. In addition, it is environmentally advantageous to decrease the amount of wood needed in construction. New concrete forming technologies designed to reduce wood consumption include reusable and stay-in-place formwork. After being used, reusable metal and wood forms must be removed, cleaned, transported and then stored. These systems limit design versatility since they generally come in large, flat panels. Unlike traditional formwork, stay-in-place plastic formwork is not stripped after the concrete is poured. These plastic forming systems are also more versatile than wood and metal because various shapes can be easily manufactured. Octaform Systems Incorporated is a Vancouver, B.C.-based company that designs stay-in-place PVC formwork technology used for constructing vertical wall structures. PVC formwork is known to improve the durability, constructability, and mechanical properties (Harris-Jones, Hawksworth et al. 2006) of the concrete that it encases. Common applications include barns, agricultural storage, tank walls, and carwashes, as well as commercial and residential buildings. Figure 1 presents examples of systems using Octaform technology.
2
(a)
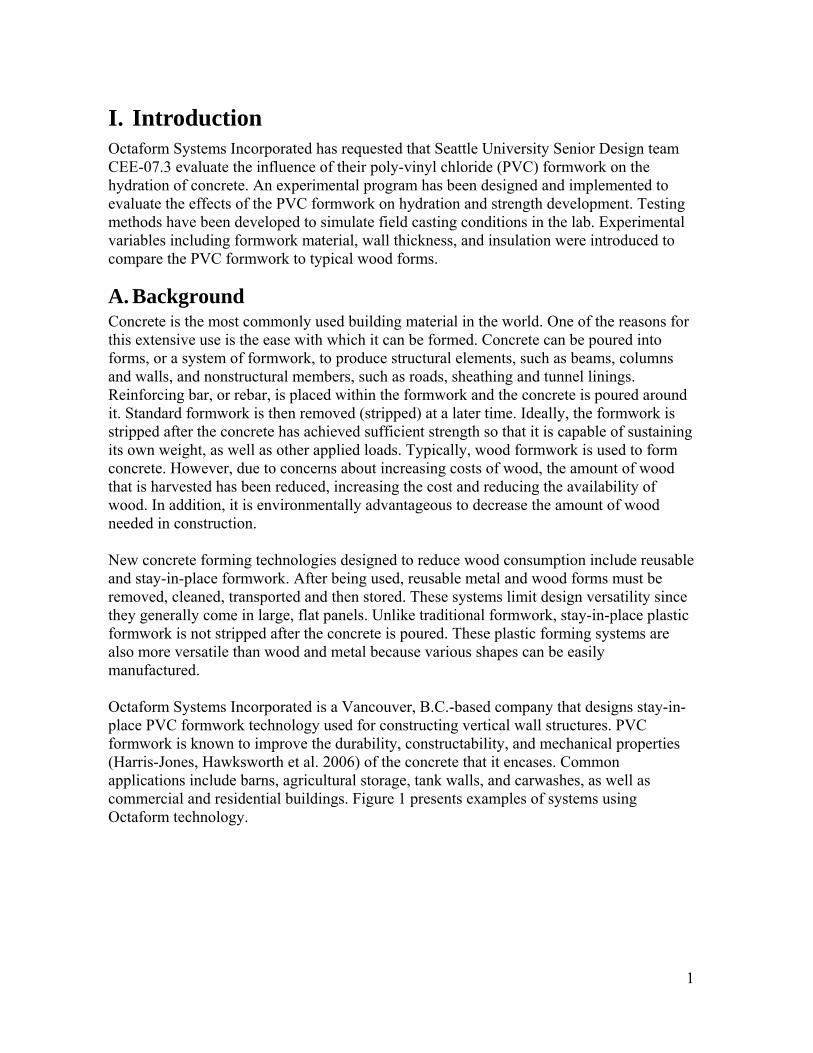
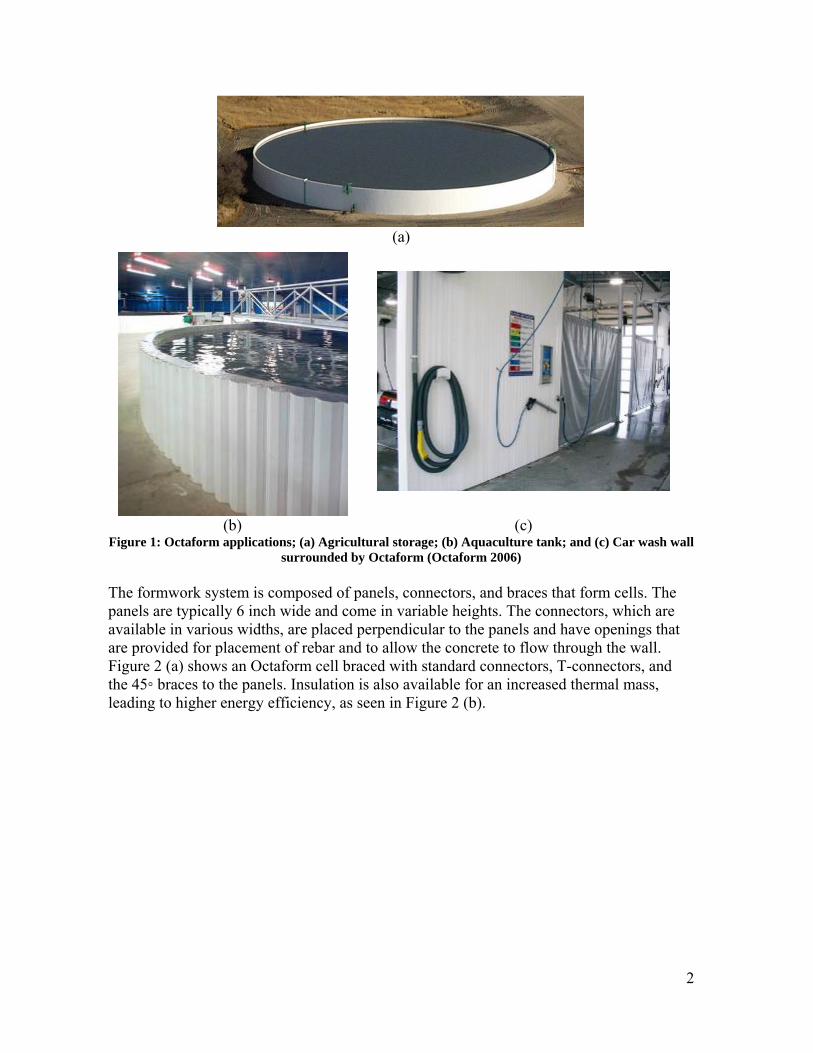
(b) (c) Figure 1: Octaform applications; (a) Agricultural storage; (b) Aquaculture tank; and (c) Car wash wall
surrounded by Octaform (Octaform 2006) The formwork system is composed of panels, connectors, and braces that form cells. The panels are typically 6 inch wide and come in variable heights. The connectors, which are available in various widths, are placed perpendicular to the panels and have openings that are provided for placement of rebar and to allow the concrete to flow through the wall. Figure 2 (a) shows an Octaform cell braced with standard connectors, T-connectors, and the 45◦ braces to the panels. Insulation is also available for an increased thermal mass, leading to higher energy efficiency, as seen in Figure 2 (b).

3
(a) (b)
Figure 2: Components of Octaform cell (a) Cell containing all components, (b) Schematic of Octaform cell with insulation and without T-connector (Octaform 2006)
The panels make up the exterior of the formwork and can be curved to conform to the shape needed for the specific application, such as the retaining wall shown in Figure 3 (a). Once the vertical structure has been assembled and raised, wood bracing is used, as shown in Figure 3 (b). This bracing is similar to the bracing required when the wood formwork is used and is removed once the concrete has set.
(a) (b) Figure 3: Octaform systems: (a) Retaining wall; and (b) Octaform wall during construction (Octaform
2006)
B. Research and Design Objectives The known advantages of using PVC stay-in-place formwork include improved durability and constructability. Its influence on the hydration process though is not well understood. From various literature review the hydration of cement is known to be influenced by a number of factors, including ambient moisture and temperature; with greater moisture and higher temperatures causing the hydration reaction to occur more quickly. Strength development is also related to the extent of hydration, with greater strength indicating a more thorough hydration has taken place. Based on these facts, it was hypothesized that the
Panel 45 degree connector
Standard Connector
T-connector

4
PVC formwork would act as an insulator containing the moisture and leading to improved hydration and increased strength, when compared with other formwork materials. The objective of the proposed work was to evaluate the influence of the PVC formwork on the hydration of concrete and consequently, strength development. The effect of the PVC formwork was determined by comparing it with wood, a commonly used forming material. An experimental program was developed and carried out to simulate the field casting process. Experimental variables included wall thickness, insulation inclusion, and concrete composition. Heat of hydration was evaluated by monitoring the temperature of concrete as it hydrated. The strength was then determined by measuring the compressive strength of cored samples. Section II describes in more detail the literature review that was performed and the conclusions that were drawn to form the experimental program. The experimental program used for testing is presented in Section III. The experimental data is analyzed and results are presented in Section IV. Additional recommendations are given for further research and analysis in Section V.
5
II. Literature Review This section will provide an introduction to concrete and the hydration process. Concrete and its constituent materials will be discussed, followed by an overview of the hydration of concrete, and methods for observing and quantifying the hydration process. This project will rely on the following background for predicting which variables will have an effect on the hydration of concrete, and the test method will follow the discussion on methods to evaluate hydration. Much of the background discussed in this section is common knowledge within the concrete field, and can be found in introductory texts on concrete. For the discussion below, two main sources, A. Neville’s Properties of Concrete, and S. Mindess’ Concrete, were used throughout.
A. Concrete: Cement and Supplementary Cementitious Materials
Concrete is composed of cement, coarse aggregate, fine aggregate, and water. Additionally, admixtures and waste materials can be used. Cement reacts with water to form the paste component that binds the various constituent materials. Economic and environmental concerns surrounding the use of cement have increased efforts to develop effective concrete mixes that utilize recycled materials that can act as supplementary cementitious materials (SCM). The production of cement is a large source of carbon dioxide (CO2) emissions, resulting in one ton of CO2 emitted for one ton of cement produced (Malhotra 2006). In addition, cement is an expensive component compared to most SCM. Researchers have been exploring SCM materials as an option for reducing the amount of cement used, thereby decreasing the amount of CO2 emissions and reducing cost. Several resources have been discovered, including fly ash (a by-product of the coal industry), silica fume (by-product of producing ferrosilicon alloys), and slag (by-product of steel and iron). These waste materials, which would otherwise be disposed of at a landfill, are inexpensive and offer significant cost reductions. In this work, a mix of fly ash and cement was used and its effect on the hydration and strength of a concrete mix were examined. Fly ash is a commonly used SCM which enhances the strength development of concrete and provides increased workability (the ability to move fresh concrete without losing a desired consistency) (Mindess and Young 1981). However, fly ash causes the rate of the hydration reaction to be much slower than that of mixes containing only cement. The use of fly ash was investigated in this work to determine the influence of the PVC on the hydration of a mix that occurs more slowly as compared with systems formed using other materials. High volume fly ash concrete is being used increasingly in the field and is of interest to Octaform since it would reduce overall costs while increasing sustainability.
6
B. Hydration
1. Hydration Process To gain an understanding of the hydration process of concrete, it is important to understand the chemistry involved. The mixture of aggregates and cement is initially inert until water is added, which triggers an exothermic chemical reaction between the water and cement. The water surrounds the cement particles and reacts to form a paste that holds the aggregate together, strengthening the concrete mixture. This reaction is known as the hydration process. During the reaction, heat is generated and released to the surroundings; the rate of the reaction is proportional to the heat generated. Once the water has evaporated or reacted with most of the cement particles, the hydration process will stop and strength development will end. The rate of the reaction is dependant on moisture content, temperature, constituent materials, and other factors, each of which affects the final properties of the concrete (Mindess and Young 1981).
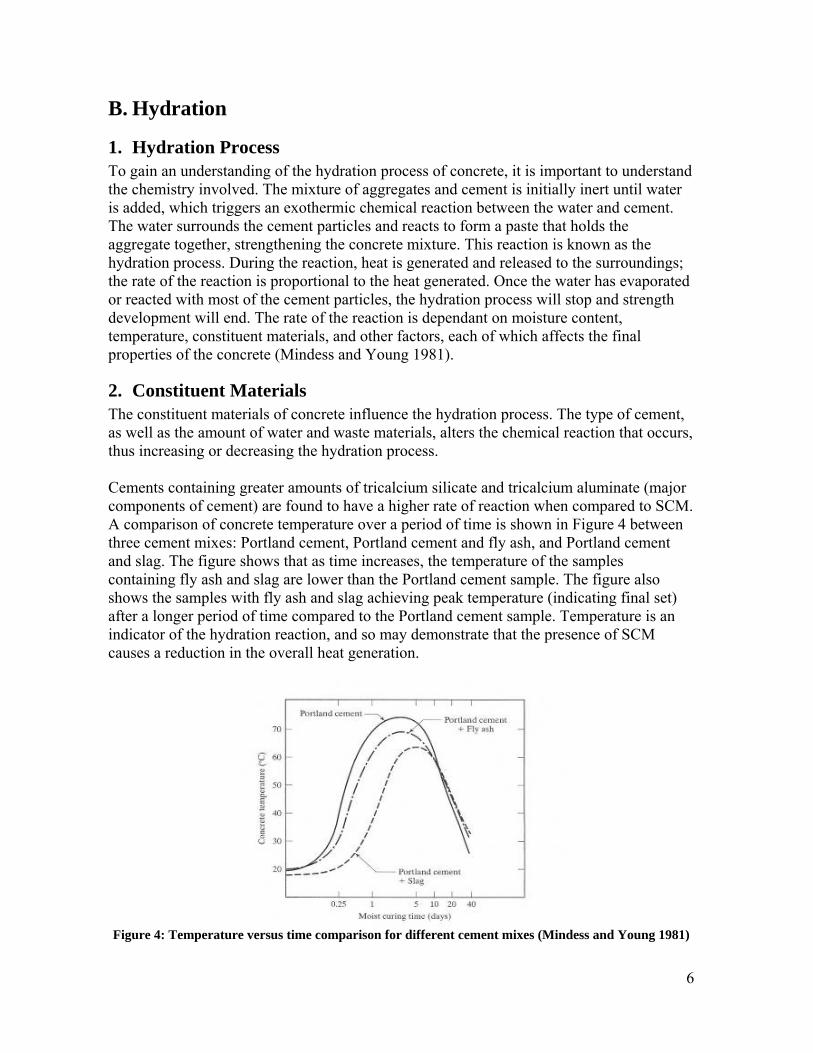
2. Constituent Materials The constituent materials of concrete influence the hydration process. The type of cement, as well as the amount of water and waste materials, alters the chemical reaction that occurs, thus increasing or decreasing the hydration process. Cements containing greater amounts of tricalcium silicate and tricalcium aluminate (major components of cement) are found to have a higher rate of reaction when compared to SCM. A comparison of concrete temperature over a period of time is shown in Figure 4 between three cement mixes: Portland cement, Portland cement and fly ash, and Portland cement and slag. The figure shows that as time increases, the temperature of the samples containing fly ash and slag are lower than the Portland cement sample. The figure also shows the samples with fly ash and slag achieving peak temperature (indicating final set) after a longer period of time compared to the Portland cement sample. Temperature is an indicator of the hydration reaction, and so may demonstrate that the presence of SCM causes a reduction in the overall heat generation.
Figure 4: Temperature versus time comparison for different cement mixes (Mindess and Young 1981)
7
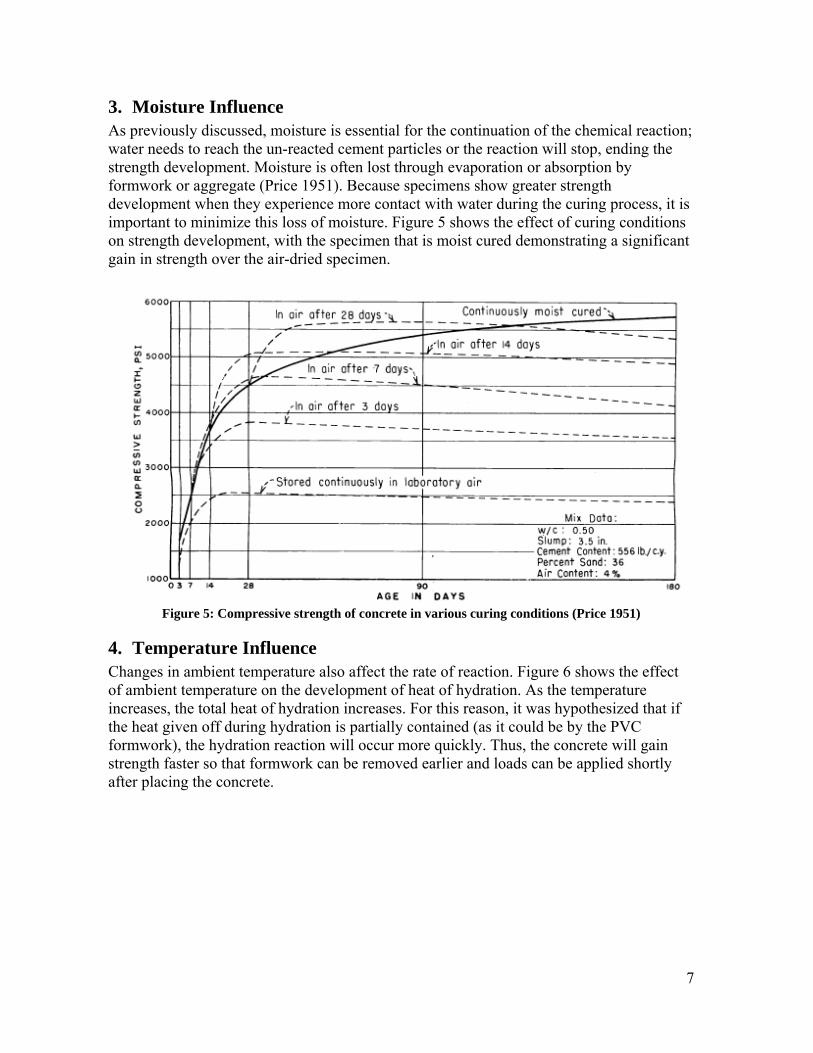
3. Moisture Influence As previously discussed, moisture is essential for the continuation of the chemical reaction; water needs to reach the un-reacted cement particles or the reaction will stop, ending the strength development. Moisture is often lost through evaporation or absorption by formwork or aggregate (Price 1951). Because specimens show greater strength development when they experience more contact with water during the curing process, it is important to minimize this loss of moisture. Figure 5 shows the effect of curing conditions on strength development, with the specimen that is moist cured demonstrating a significant gain in strength over the air-dried specimen.
Figure 5: Compressive strength of concrete in various curing conditions (Price 1951)
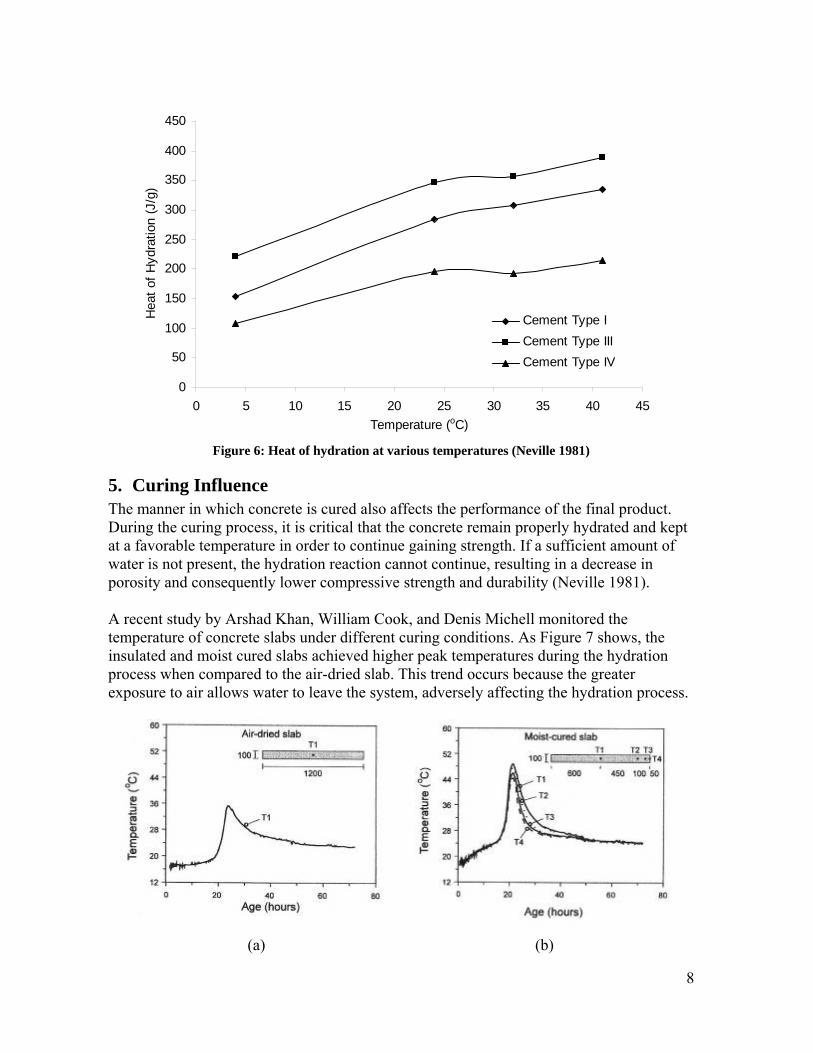
4. Temperature Influence Changes in ambient temperature also affect the rate of reaction. Figure 6 shows the effect of ambient temperature on the development of heat of hydration. As the temperature increases, the total heat of hydration increases. For this reason, it was hypothesized that if the heat given off during hydration is partially contained (as it could be by the PVC formwork), the hydration reaction will occur more quickly. Thus, the concrete will gain strength faster so that formwork can be removed earlier and loads can be applied shortly after placing the concrete.
8
0
50
100
150
200
250
300
350
400
450
0 5 10 15 20 25 30 35 40 45Temperature (oC)
Hea
t of H
ydra
tion
(J/g
)
Cement Type ICement Type IIICement Type IV
Figure 6: Heat of hydration at various temperatures (Neville 1981)
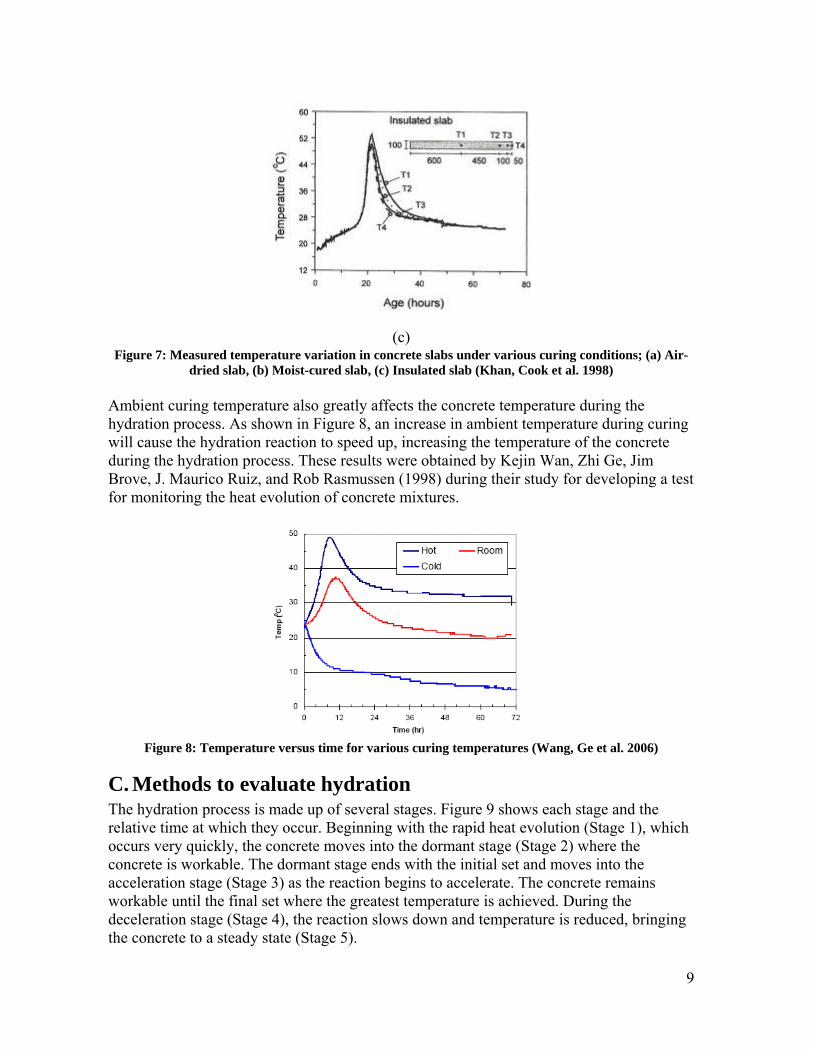
5. Curing Influence The manner in which concrete is cured also affects the performance of the final product. During the curing process, it is critical that the concrete remain properly hydrated and kept at a favorable temperature in order to continue gaining strength. If a sufficient amount of water is not present, the hydration reaction cannot continue, resulting in a decrease in porosity and consequently lower compressive strength and durability (Neville 1981). A recent study by Arshad Khan, William Cook, and Denis Michell monitored the temperature of concrete slabs under different curing conditions. As Figure 7 shows, the insulated and moist cured slabs achieved higher peak temperatures during the hydration process when compared to the air-dried slab. This trend occurs because the greater exposure to air allows water to leave the system, adversely affecting the hydration process.
(a) (b)
9
(c)
Figure 7: Measured temperature variation in concrete slabs under various curing conditions; (a) Air-dried slab, (b) Moist-cured slab, (c) Insulated slab (Khan, Cook et al. 1998)
Ambient curing temperature also greatly affects the concrete temperature during the hydration process. As shown in Figure 8, an increase in ambient temperature during curing will cause the hydration reaction to speed up, increasing the temperature of the concrete during the hydration process. These results were obtained by Kejin Wan, Zhi Ge, Jim Brove, J. Maurico Ruiz, and Rob Rasmussen (1998) during their study for developing a test for monitoring the heat evolution of concrete mixtures.
Figure 8: Temperature versus time for various curing temperatures (Wang, Ge et al. 2006)
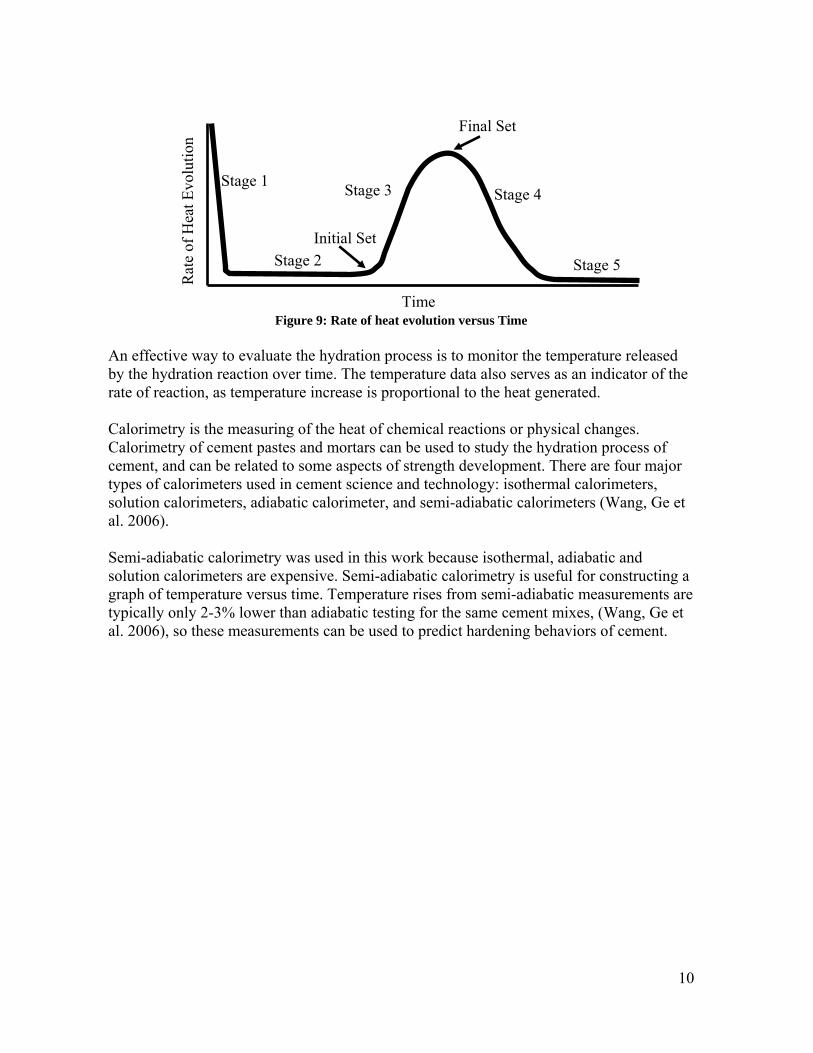
C. Methods to evaluate hydration The hydration process is made up of several stages. Figure 9 shows each stage and the relative time at which they occur. Beginning with the rapid heat evolution (Stage 1), which occurs very quickly, the concrete moves into the dormant stage (Stage 2) where the concrete is workable. The dormant stage ends with the initial set and moves into the acceleration stage (Stage 3) as the reaction begins to accelerate. The concrete remains workable until the final set where the greatest temperature is achieved. During the deceleration stage (Stage 4), the reaction slows down and temperature is reduced, bringing the concrete to a steady state (Stage 5).
10
Figure 9: Rate of heat evolution versus Time
An effective way to evaluate the hydration process is to monitor the temperature released by the hydration reaction over time. The temperature data also serves as an indicator of the rate of reaction, as temperature increase is proportional to the heat generated. Calorimetry is the measuring of the heat of chemical reactions or physical changes. Calorimetry of cement pastes and mortars can be used to study the hydration process of cement, and can be related to some aspects of strength development. There are four major types of calorimeters used in cement science and technology: isothermal calorimeters, solution calorimeters, adiabatic calorimeter, and semi-adiabatic calorimeters (Wang, Ge et al. 2006). Semi-adiabatic calorimetry was used in this work because isothermal, adiabatic and solution calorimeters are expensive. Semi-adiabatic calorimetry is useful for constructing a graph of temperature versus time. Temperature rises from semi-adiabatic measurements are typically only 2-3% lower than adiabatic testing for the same cement mixes, (Wang, Ge et al. 2006), so these measurements can be used to predict hardening behaviors of cement.
Stage 1
Stage 2
Stage 3 Stage 4
Stage 5
Final Set
Initial Set
Time
Rat
e of
Hea
t Evo
lutio
n
11
III. Experimental Program The following section details the experimental program that was developed for determining the effects of the PVC formwork on the hydration and strength development of concrete. Before testing began, a trial run was conducted to ensure the equipment was functional and the data collection procedure was precise and accurate. During testing the concrete was mixed according to ASTM standards and poured into small wall-shaped formwork supported by a bracing system. Temperature gauges (thermocouples) were inserted into the fresh concrete at prescribed locations and the temperature was recorded for a specific duration. Once the concrete had cured for a set amount of time, the samples were cored with a drilling machine and the cores were subjected to compression testing to determine the compressive strength of the concrete. Variables (wall thickness, constituent materials, and insulation) were introduced in this testing procedure to determine the effect of each on the hydration process of the concrete and on the final compressive strength of the concrete. In this chapter, the materials and equipment that were used are discussed. Next, the mixing procedure is explained. Testing consisted of two phases: preliminary testing and simulated field casting tests, which will be discussed in detail. Preliminary testing included semi-adiabatic calorimetry tests to evaluate the hydration of the different base compositions which aided in the concrete mix design. In addition, repeatability testing was conducted to establish the number of repetitions required. Finally, the simulated field casting tests were performed.
A. Materials and Equipment The following lists contain the materials and equipment used during the testing program.
1. Materials Cement – LaFarge Type I Fine aggregate (river sand) Course aggregate (maximum size 10 mm) Fly ash: Class F from Centralia, WA (See Table 1 below for the chemical composition) Master Builders Glenium 3000 NS Superplasticizer Master Builders MB-VR Standard Air Entrainer Lumber: 23/32 inch DF-DF plywood, 48/24 span rated Form oil (WD40) Thermocouples (Type K) Styrofoam cups and lids
2. Equipment Riehle hydraulic testing machine with 300 kip frame Goldblatt rotary drum mixer Titan planetary mixer GP620B 300 kip Honeywell load cell
12
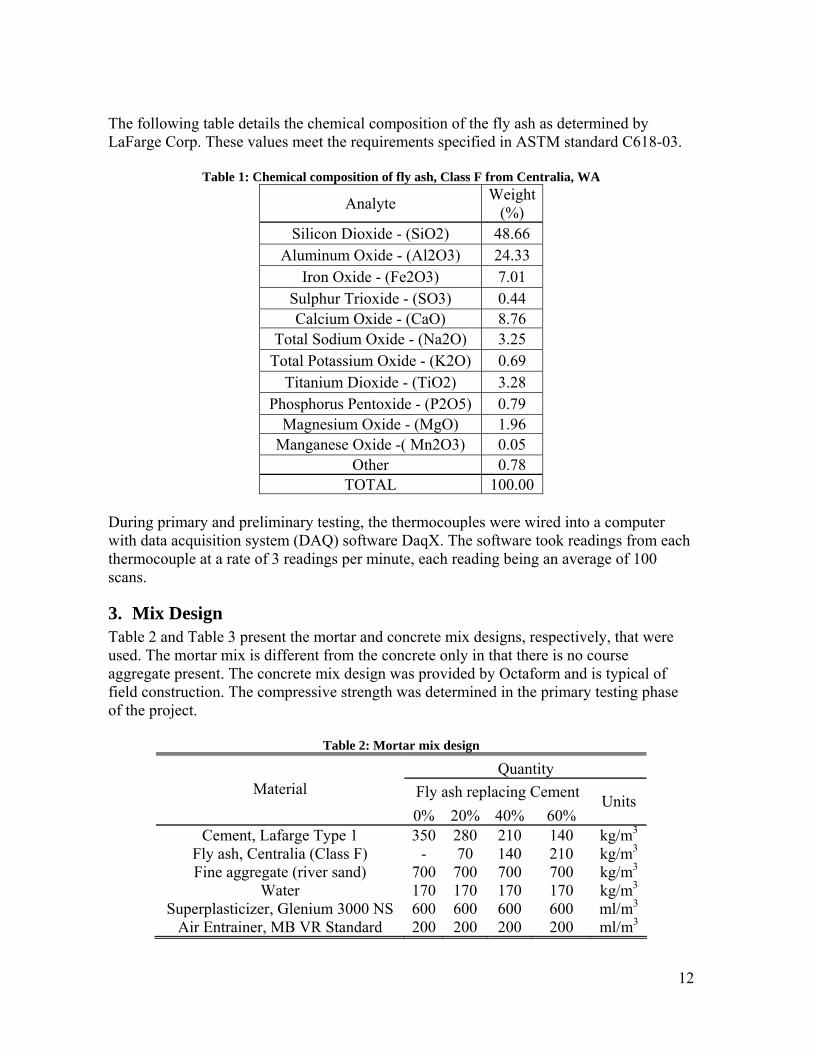
The following table details the chemical composition of the fly ash as determined by LaFarge Corp. These values meet the requirements specified in ASTM standard C618-03.
Table 1: Chemical composition of fly ash, Class F from Centralia, WA
Analyte Weight (%)
Silicon Dioxide - (SiO2) 48.66 Aluminum Oxide - (Al2O3) 24.33
Iron Oxide - (Fe2O3) 7.01 Sulphur Trioxide - (SO3) 0.44 Calcium Oxide - (CaO) 8.76
Total Sodium Oxide - (Na2O) 3.25 Total Potassium Oxide - (K2O) 0.69
Titanium Dioxide - (TiO2) 3.28 Phosphorus Pentoxide - (P2O5) 0.79
Magnesium Oxide - (MgO) 1.96 Manganese Oxide -( Mn2O3) 0.05
Other 0.78 TOTAL 100.00
During primary and preliminary testing, the thermocouples were wired into a computer with data acquisition system (DAQ) software DaqX. The software took readings from each thermocouple at a rate of 3 readings per minute, each reading being an average of 100 scans.
3. Mix Design Table 2 and Table 3 present the mortar and concrete mix designs, respectively, that were used. The mortar mix is different from the concrete only in that there is no course aggregate present. The concrete mix design was provided by Octaform and is typical of field construction. The compressive strength was determined in the primary testing phase of the project.
Table 2: Mortar mix design
Quantity Fly ash replacing Cement Material
0% 20% 40% 60% Units
Cement, Lafarge Type 1 350 280 210 140 kg/m3 Fly ash, Centralia (Class F) - 70 140 210 kg/m3 Fine aggregate (river sand) 700 700 700 700 kg/m3
Water 170 170 170 170 kg/m3 Superplasticizer, Glenium 3000 NS 600 600 600 600 ml/m3
Air Entrainer, MB VR Standard 200 200 200 200 ml/m3
13
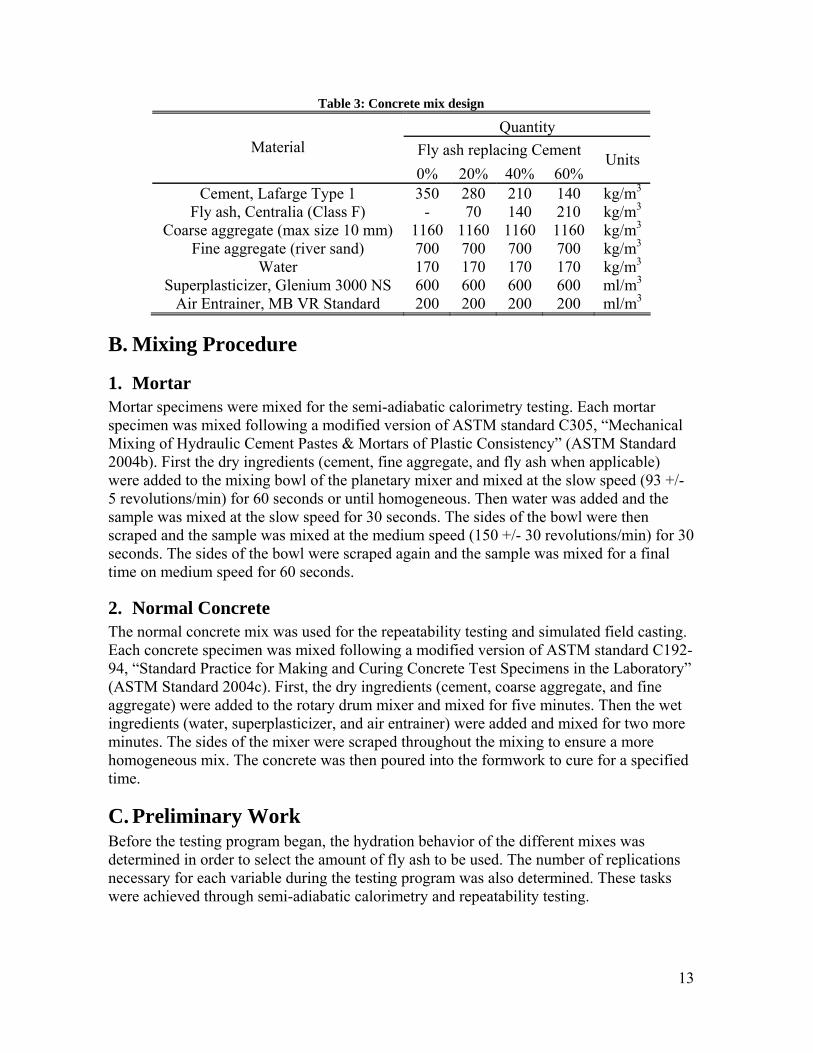
Table 3: Concrete mix design
Quantity Fly ash replacing Cement Material
0% 20% 40% 60% Units
Cement, Lafarge Type 1 350 280 210 140 kg/m3 Fly ash, Centralia (Class F) - 70 140 210 kg/m3
Coarse aggregate (max size 10 mm) 1160 1160 1160 1160 kg/m3 Fine aggregate (river sand) 700 700 700 700 kg/m3
Water 170 170 170 170 kg/m3 Superplasticizer, Glenium 3000 NS 600 600 600 600 ml/m3
Air Entrainer, MB VR Standard 200 200 200 200 ml/m3
B. Mixing Procedure
1. Mortar Mortar specimens were mixed for the semi-adiabatic calorimetry testing. Each mortar specimen was mixed following a modified version of ASTM standard C305, “Mechanical Mixing of Hydraulic Cement Pastes & Mortars of Plastic Consistency” (ASTM Standard 2004b). First the dry ingredients (cement, fine aggregate, and fly ash when applicable) were added to the mixing bowl of the planetary mixer and mixed at the slow speed (93 +/- 5 revolutions/min) for 60 seconds or until homogeneous. Then water was added and the sample was mixed at the slow speed for 30 seconds. The sides of the bowl were then scraped and the sample was mixed at the medium speed (150 +/- 30 revolutions/min) for 30 seconds. The sides of the bowl were scraped again and the sample was mixed for a final time on medium speed for 60 seconds.
2. Normal Concrete The normal concrete mix was used for the repeatability testing and simulated field casting. Each concrete specimen was mixed following a modified version of ASTM standard C192-94, “Standard Practice for Making and Curing Concrete Test Specimens in the Laboratory” (ASTM Standard 2004c). First, the dry ingredients (cement, coarse aggregate, and fine aggregate) were added to the rotary drum mixer and mixed for five minutes. Then the wet ingredients (water, superplasticizer, and air entrainer) were added and mixed for two more minutes. The sides of the mixer were scraped throughout the mixing to ensure a more homogeneous mix. The concrete was then poured into the formwork to cure for a specified time.
C. Preliminary Work Before the testing program began, the hydration behavior of the different mixes was determined in order to select the amount of fly ash to be used. The number of replications necessary for each variable during the testing program was also determined. These tasks were achieved through semi-adiabatic calorimetry and repeatability testing.
14
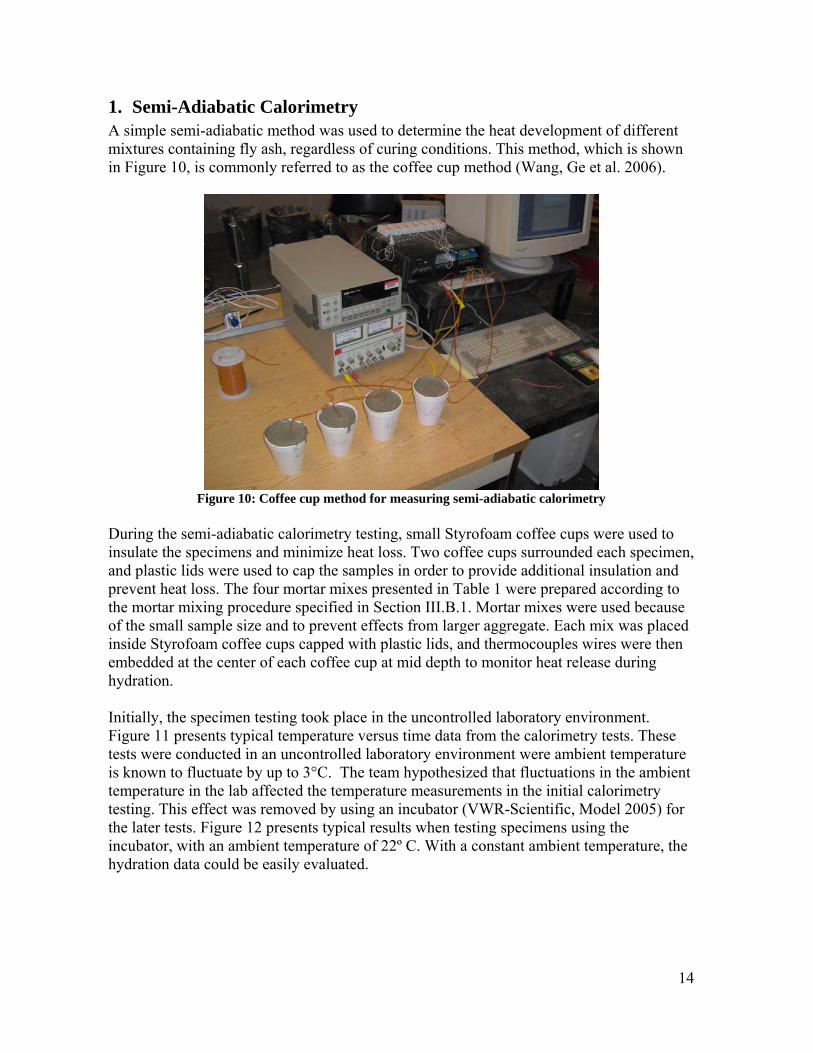
1. Semi-Adiabatic Calorimetry A simple semi-adiabatic method was used to determine the heat development of different mixtures containing fly ash, regardless of curing conditions. This method, which is shown in Figure 10, is commonly referred to as the coffee cup method (Wang, Ge et al. 2006).
Figure 10: Coffee cup method for measuring semi-adiabatic calorimetry
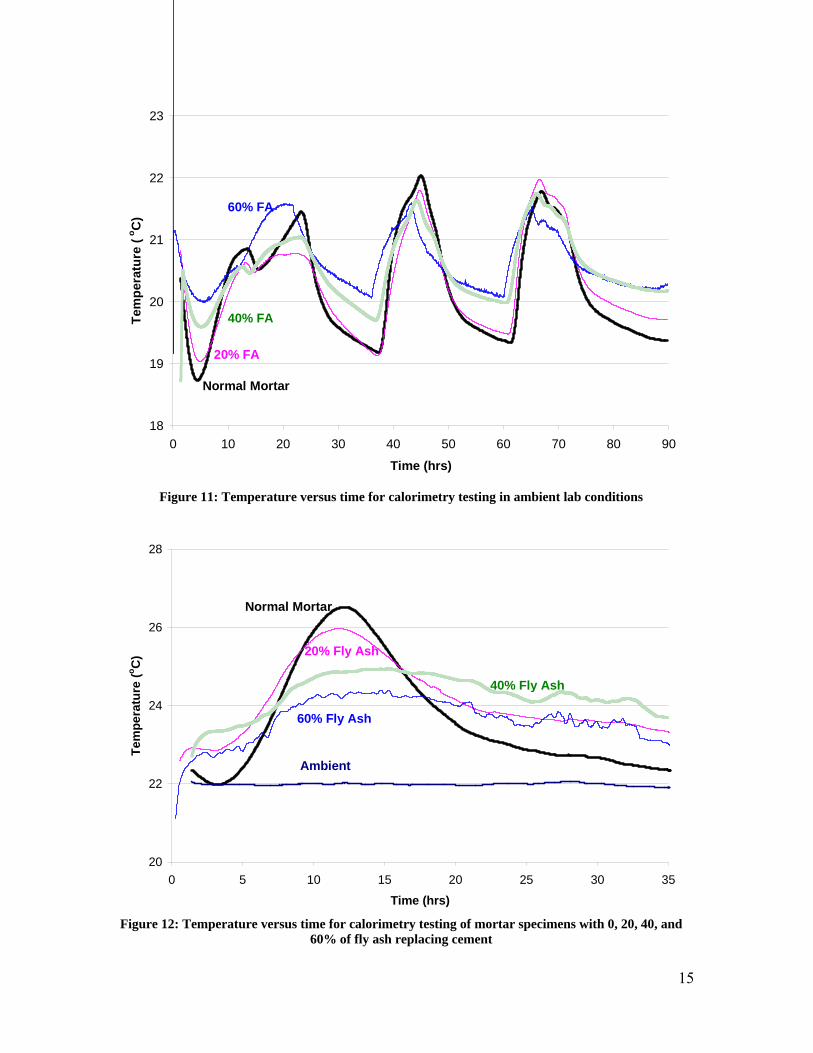
During the semi-adiabatic calorimetry testing, small Styrofoam coffee cups were used to insulate the specimens and minimize heat loss. Two coffee cups surrounded each specimen, and plastic lids were used to cap the samples in order to provide additional insulation and prevent heat loss. The four mortar mixes presented in Table 1 were prepared according to the mortar mixing procedure specified in Section III.B.1. Mortar mixes were used because of the small sample size and to prevent effects from larger aggregate. Each mix was placed inside Styrofoam coffee cups capped with plastic lids, and thermocouples wires were then embedded at the center of each coffee cup at mid depth to monitor heat release during hydration. Initially, the specimen testing took place in the uncontrolled laboratory environment. Figure 11 presents typical temperature versus time data from the calorimetry tests. These tests were conducted in an uncontrolled laboratory environment were ambient temperature is known to fluctuate by up to 3°C. The team hypothesized that fluctuations in the ambient temperature in the lab affected the temperature measurements in the initial calorimetry testing. This effect was removed by using an incubator (VWR-Scientific, Model 2005) for the later tests. Figure 12 presents typical results when testing specimens using the incubator, with an ambient temperature of 22º C. With a constant ambient temperature, the hydration data could be easily evaluated.
15
18
19
20
21
22
23
0 10 20 30 40 50 60 70 80 90
Time (hrs)
Tem
pera
ture
( o C
)
Normal Mortar
20% FA
60% FA
40% FA
Figure 11: Temperature versus time for calorimetry testing in ambient lab conditions
20
22
24
26
28
0 5 10 15 20 25 30 35
Time (hrs)
Tem
pera
ture
(o C)
Normal Mortar
20% Fly Ash
40% Fly Ash
60% Fly Ash
Ambient
Figure 12: Temperature versus time for calorimetry testing of mortar specimens with 0, 20, 40, and
60% of fly ash replacing cement
16
2. Repeatability The repeatability of the simulated field casting experiment was evaluated next to ensure that the temperature development measurements were repeatable. To do this, three identical 8 inch Octaform wall specimens with the normal concrete mix were tested. Specimens were prepared using the procedure discussed below in Section III.D.2. The effect of ambient temperature and thermocouple location on temperature development was determined. Based on the results, a replicable testing and analysis procedure was developed.
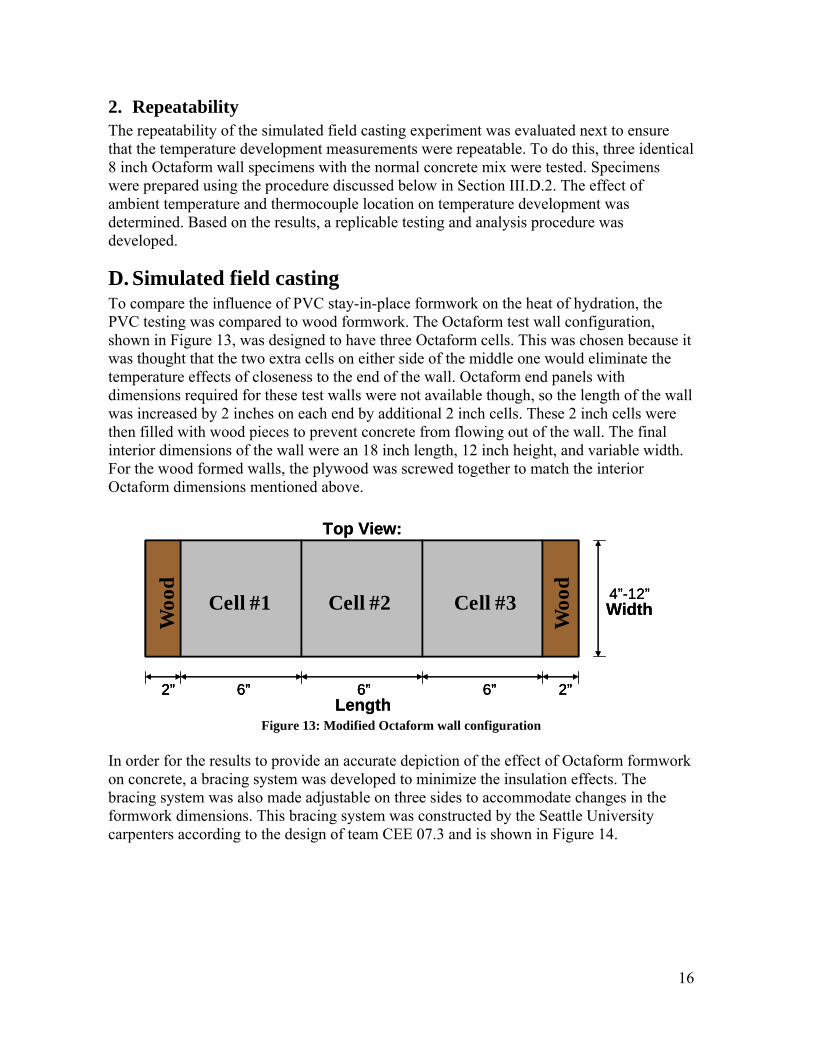
D. Simulated field casting To compare the influence of PVC stay-in-place formwork on the heat of hydration, the PVC testing was compared to wood formwork. The Octaform test wall configuration, shown in Figure 13, was designed to have three Octaform cells. This was chosen because it was thought that the two extra cells on either side of the middle one would eliminate the temperature effects of closeness to the end of the wall. Octaform end panels with dimensions required for these test walls were not available though, so the length of the wall was increased by 2 inches on each end by additional 2 inch cells. These 2 inch cells were then filled with wood pieces to prevent concrete from flowing out of the wall. The final interior dimensions of the wall were an 18 inch length, 12 inch height, and variable width. For the wood formed walls, the plywood was screwed together to match the interior Octaform dimensions mentioned above.
2” 2”6” 6” 6”
4”-12”
Top View:
Length
Width
2” 2”6” 6” 6”2” 2”6” 6” 6”
4”-12”
Top View:
Length
Width
Woo
d
Woo
d
Cell #1 Cell #2 Cell #3
Figure 13: Modified Octaform wall configuration
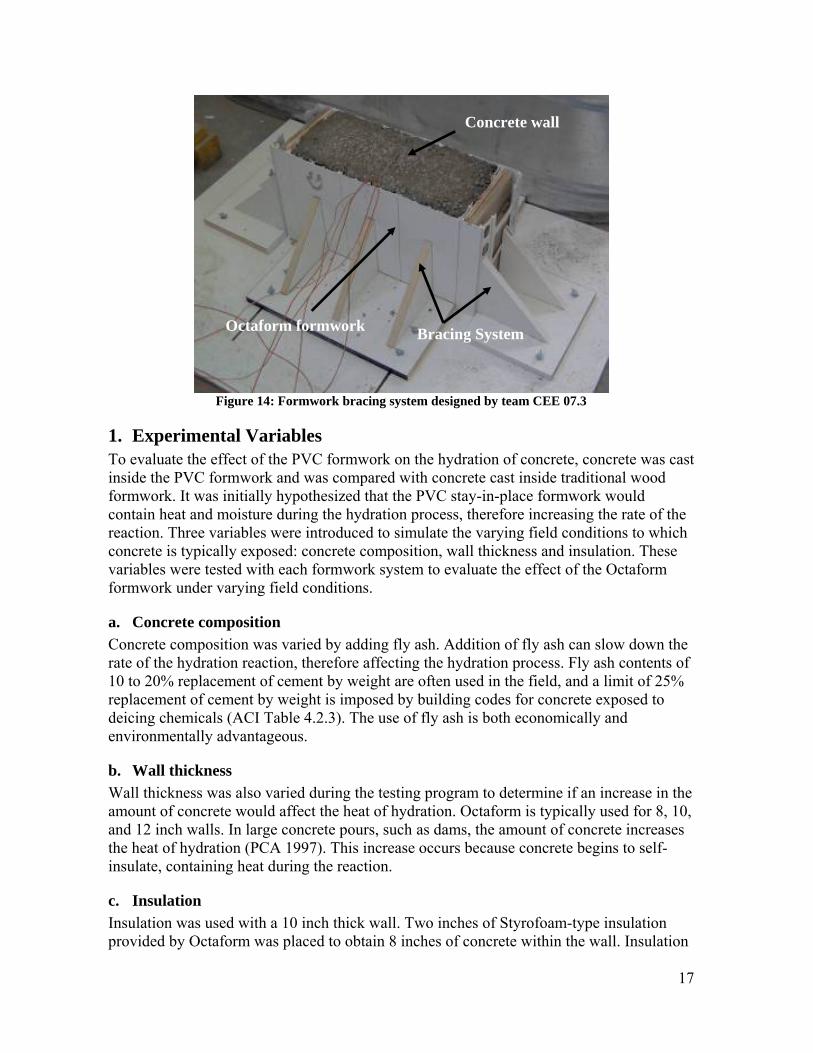
In order for the results to provide an accurate depiction of the effect of Octaform formwork on concrete, a bracing system was developed to minimize the insulation effects. The bracing system was also made adjustable on three sides to accommodate changes in the formwork dimensions. This bracing system was constructed by the Seattle University carpenters according to the design of team CEE 07.3 and is shown in Figure 14.
17
Figure 14: Formwork bracing system designed by team CEE 07.3
1. Experimental Variables To evaluate the effect of the PVC formwork on the hydration of concrete, concrete was cast inside the PVC formwork and was compared with concrete cast inside traditional wood formwork. It was initially hypothesized that the PVC stay-in-place formwork would contain heat and moisture during the hydration process, therefore increasing the rate of the reaction. Three variables were introduced to simulate the varying field conditions to which concrete is typically exposed: concrete composition, wall thickness and insulation. These variables were tested with each formwork system to evaluate the effect of the Octaform formwork under varying field conditions.
a. Concrete composition Concrete composition was varied by adding fly ash. Addition of fly ash can slow down the rate of the hydration reaction, therefore affecting the hydration process. Fly ash contents of 10 to 20% replacement of cement by weight are often used in the field, and a limit of 25% replacement of cement by weight is imposed by building codes for concrete exposed to deicing chemicals (ACI Table 4.2.3). The use of fly ash is both economically and environmentally advantageous.
b. Wall thickness Wall thickness was also varied during the testing program to determine if an increase in the amount of concrete would affect the heat of hydration. Octaform is typically used for 8, 10, and 12 inch walls. In large concrete pours, such as dams, the amount of concrete increases the heat of hydration (PCA 1997). This increase occurs because concrete begins to self-insulate, containing heat during the reaction.
c. Insulation Insulation was used with a 10 inch thick wall. Two inches of Styrofoam-type insulation provided by Octaform was placed to obtain 8 inches of concrete within the wall. Insulation
Bracing System Octaform formwork
Concrete wall
18
was expected to contain heat during the hydration process, and therefore, was predicted to further increase the rate of the reaction. Stripping time was not tested because the tests were stopped after the hydration cycle was complete. In the field, formwork is often stripped before the hydration process is finished.
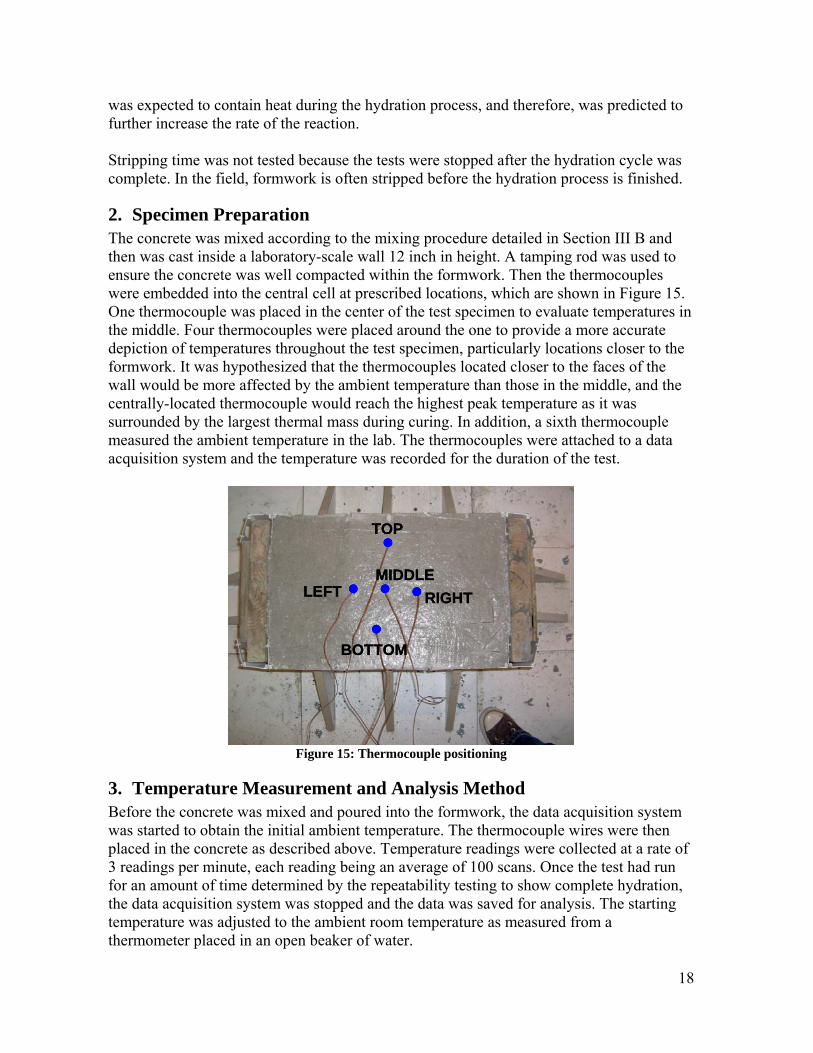
2. Specimen Preparation The concrete was mixed according to the mixing procedure detailed in Section III B and then was cast inside a laboratory-scale wall 12 inch in height. A tamping rod was used to ensure the concrete was well compacted within the formwork. Then the thermocouples were embedded into the central cell at prescribed locations, which are shown in Figure 15. One thermocouple was placed in the center of the test specimen to evaluate temperatures in the middle. Four thermocouples were placed around the one to provide a more accurate depiction of temperatures throughout the test specimen, particularly locations closer to the formwork. It was hypothesized that the thermocouples located closer to the faces of the wall would be more affected by the ambient temperature than those in the middle, and the centrally-located thermocouple would reach the highest peak temperature as it was surrounded by the largest thermal mass during curing. In addition, a sixth thermocouple measured the ambient temperature in the lab. The thermocouples were attached to a data acquisition system and the temperature was recorded for the duration of the test.
TOP
BOTTOM
MIDDLERIGHTLEFT
TOP
BOTTOM
MIDDLERIGHTLEFT
TOP
BOTTOM
MIDDLERIGHTLEFT
Figure 15: Thermocouple positioning
3. Temperature Measurement and Analysis Method Before the concrete was mixed and poured into the formwork, the data acquisition system was started to obtain the initial ambient temperature. The thermocouple wires were then placed in the concrete as described above. Temperature readings were collected at a rate of 3 readings per minute, each reading being an average of 100 scans. Once the test had run for an amount of time determined by the repeatability testing to show complete hydration, the data acquisition system was stopped and the data was saved for analysis. The starting temperature was adjusted to the ambient room temperature as measured from a thermometer placed in an open beaker of water.
19
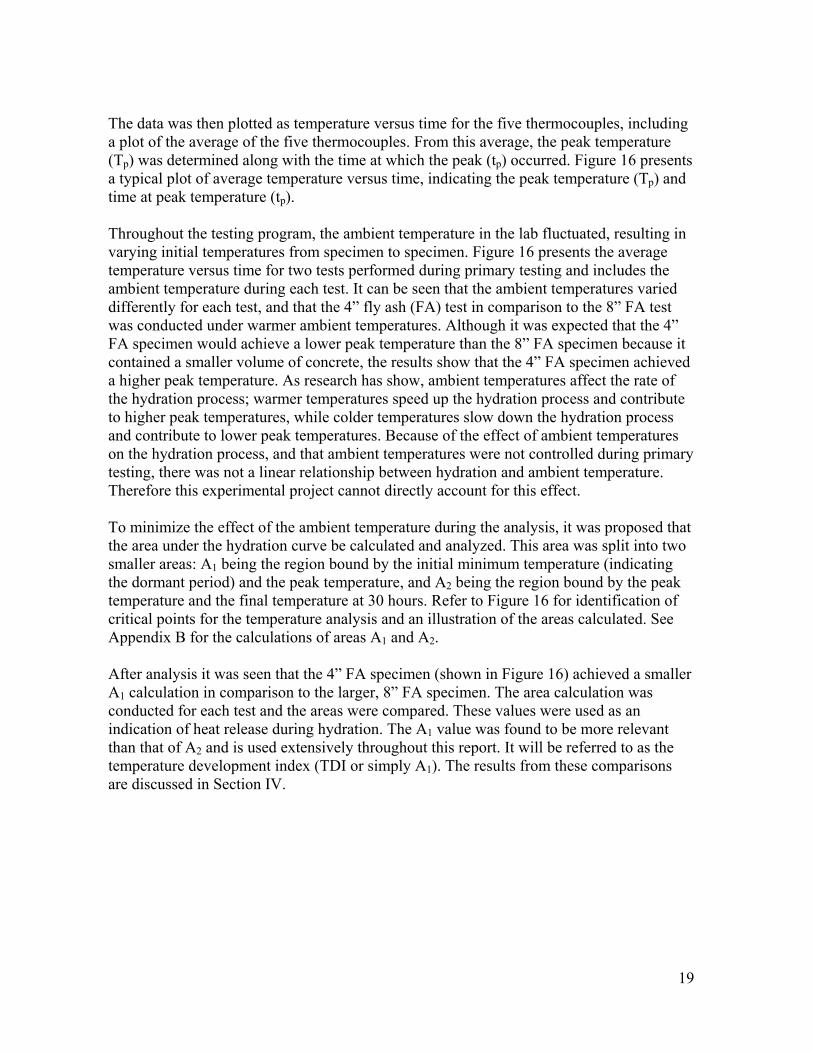
The data was then plotted as temperature versus time for the five thermocouples, including a plot of the average of the five thermocouples. From this average, the peak temperature (Tp) was determined along with the time at which the peak (tp) occurred. Figure 16 presents a typical plot of average temperature versus time, indicating the peak temperature (Tp) and time at peak temperature (tp). Throughout the testing program, the ambient temperature in the lab fluctuated, resulting in varying initial temperatures from specimen to specimen. Figure 16 presents the average temperature versus time for two tests performed during primary testing and includes the ambient temperature during each test. It can be seen that the ambient temperatures varied differently for each test, and that the 4” fly ash (FA) test in comparison to the 8” FA test was conducted under warmer ambient temperatures. Although it was expected that the 4” FA specimen would achieve a lower peak temperature than the 8” FA specimen because it contained a smaller volume of concrete, the results show that the 4” FA specimen achieved a higher peak temperature. As research has show, ambient temperatures affect the rate of the hydration process; warmer temperatures speed up the hydration process and contribute to higher peak temperatures, while colder temperatures slow down the hydration process and contribute to lower peak temperatures. Because of the effect of ambient temperatures on the hydration process, and that ambient temperatures were not controlled during primary testing, there was not a linear relationship between hydration and ambient temperature. Therefore this experimental project cannot directly account for this effect. To minimize the effect of the ambient temperature during the analysis, it was proposed that the area under the hydration curve be calculated and analyzed. This area was split into two smaller areas: A1 being the region bound by the initial minimum temperature (indicating the dormant period) and the peak temperature, and A2 being the region bound by the peak temperature and the final temperature at 30 hours. Refer to Figure 16 for identification of critical points for the temperature analysis and an illustration of the areas calculated. See Appendix B for the calculations of areas A1 and A2. After analysis it was seen that the 4” FA specimen (shown in Figure 16) achieved a smaller A1 calculation in comparison to the larger, 8” FA specimen. The area calculation was conducted for each test and the areas were compared. These values were used as an indication of heat release during hydration. The A1 value was found to be more relevant than that of A2 and is used extensively throughout this report. It will be referred to as the temperature development index (TDI or simply A1). The results from these comparisons are discussed in Section IV.
20
Wood
16
18
20
22
24
26
0 5 10 15 20 25 30 35
Time (hr)
Aver
age
Tem
pera
ture
(o C)
4" FA
Wood
16
18
20
22
24
26
0 5 10 15 20 25 30 35
Time (hr)
Aver
age
Tem
pera
ture
(o C)
4" FA8" FA
20oC 24.1oC 12.1hr 8.44 3.99
20oC 24.0oC 16.7hr 22.65 29.67
Tlab Tpeak tpeak A1 A2Wood
16
18
20
22
24
26
0 5 10 15 20 25 30 35
Time (hr)
Aver
age
Tem
pera
ture
(o C)
4" FA8" FA
20oC 24.1oC 12.1hr 8.44 3.99
20oC 24.0oC 16.7hr 22.65 29.67
Tlab Tpeak tpeak A1 A2
4" FA - Ambient
8" FA - Ambient
Dormant Temperature
Peak Temperature
A1
A1
Tp, tp1 Tp, tp2
A = Temperature Development IndexA8” = 22.65 A4” = 8.44
Figure 16: Temperature measurement analysis critical points
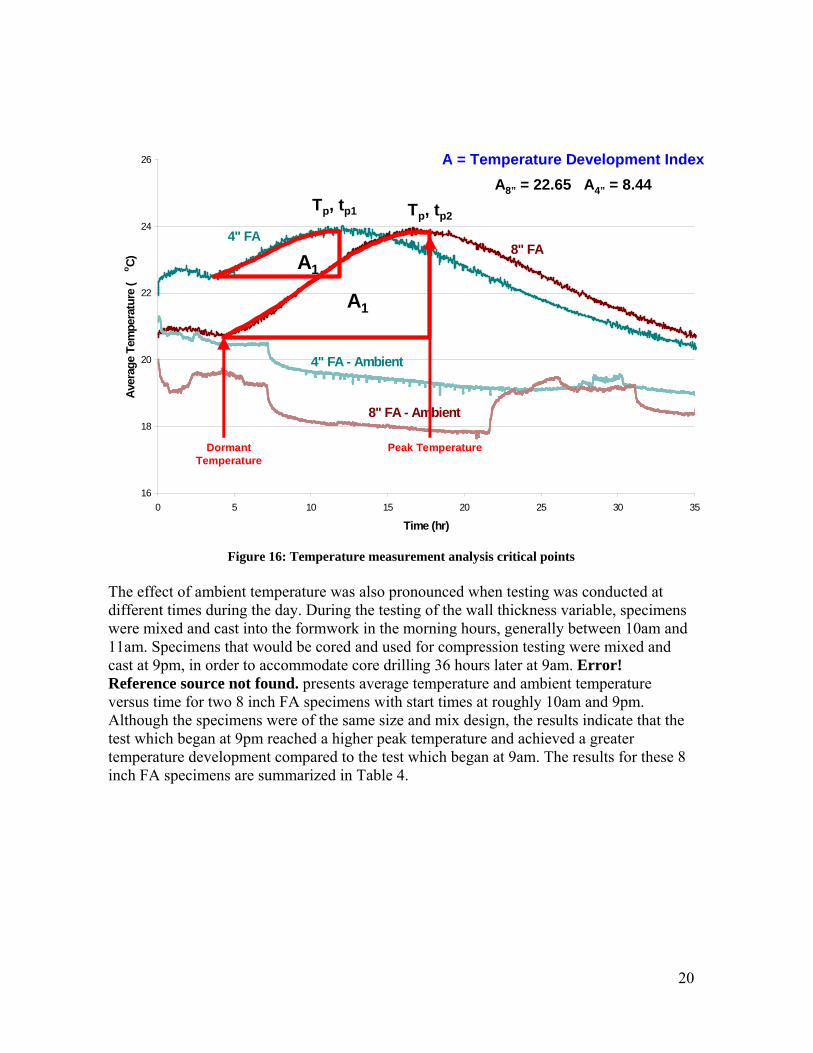
The effect of ambient temperature was also pronounced when testing was conducted at different times during the day. During the testing of the wall thickness variable, specimens were mixed and cast into the formwork in the morning hours, generally between 10am and 11am. Specimens that would be cored and used for compression testing were mixed and cast at 9pm, in order to accommodate core drilling 36 hours later at 9am. Error! Reference source not found. presents average temperature and ambient temperature versus time for two 8 inch FA specimens with start times at roughly 10am and 9pm. Although the specimens were of the same size and mix design, the results indicate that the test which began at 9pm reached a higher peak temperature and achieved a greater temperature development compared to the test which began at 9am. The results for these 8 inch FA specimens are summarized in Table 4.
21
16
21
26
31
0 5 10 15 20 25 30 35
Time (hr)
Ave
rage
Tem
pera
ture
(o C)
8" Wood FA
8" Wood FA
Ambient
Ambient
Start Time 9:59AM
Start Time 9:11PM
Figure 17: Temperature versus time for 8 inch wood fly ash specimens, depicting the effect of starting
time on ambient and peak temperatures
Table 4: 8 inch wood with fly ash mix data for specimens with different start times Peak Temp
Time at Peak A1 A2
Start Time (°C) (hrs) (°C-hr) (°C-hr) 9:59AM 24.0 16.7 22.65 29.67 9:11PM 26.6 17.9 34.53 35.57
Similar results were found when walls tested for the compression testing were compared with walls previously tested during the wall thickness variable. In analyzing the ambient temperature, peak temperature and time at peak temperature for each specimen, it is seen that specimens cast in the late evening (around 9pm) reach peak temperature when ambient temperatures are increasing. For example, for the specimen started at 9:11pm presented in Error! Reference source not found., peak temperature occurs at approximately 3pm. Specimens for which testing began in the early morning hours (around 10am) reach peak when ambient temperatures are decreasing. For example, for the specimen started at 9:59am presented in Error! Reference source not found., peak temperature occurs at approximately 3am. As discussed earlier, colder temperatures slow down the hydration process and contribute to lower peak temperatures, while warmer temperatures speed up hydration and contribute to higher peak temperatures. This effect of ambient temperature on the hydration process explains the differences in temperature development and peak temperature when
22
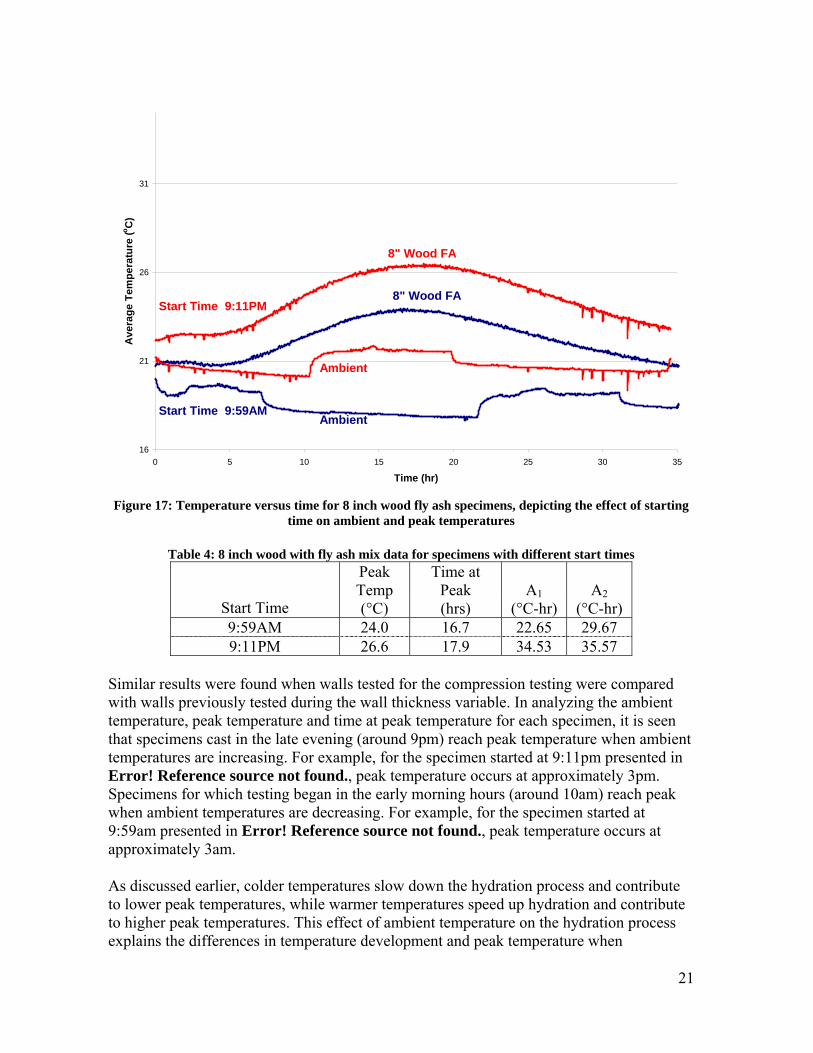
comparing specimens tested during the wall thickness variable (with start times around 10am) and specimens that were used in compression testing (with start times around 9pm). Figure 18 presents a comparison of ambient temperature versus time for specimens tested at different times of the day. At the time of peak temperature, the results show similar ambient temperatures for those tests starting at a similar time of day, but varying ambient temperatures when comparing tests started at different times of day. For this reason, comparisons between test specimens will only be made between specimens that were cast at roughly the same time of day.
16
18
20
22
24
0 5 10 15 20 25 30 35
Time (hrs)
Tem
pera
ture
(o C)
9:40PM
9:04PM 9:11PM
11:07AM10:23AM
9:55AM
Figure 18: Effect of start time on ambient temperature during test
4. Strength Measurement and Analysis Method Along with temperature measurement, another important method of determining the effect of the Octaform system on the hydration of concrete was to measure the compressive strength of the concrete encased by the formwork system. To perform this analysis and determine if there was any correlation between temperature and strength development, cores were taken from various 8 inch walls and subjected to compressive testing equipment. These 8 inch walls were cored at the same age of 36 hours and are shown in Table 5 below.
23
Table 5: Cored 8 inch walls
Insulation Normal Concrete No Insulation Insulation Octaform
Fly Ash No Insulation Insulation Normal Concrete No Insulation Insulation Wood
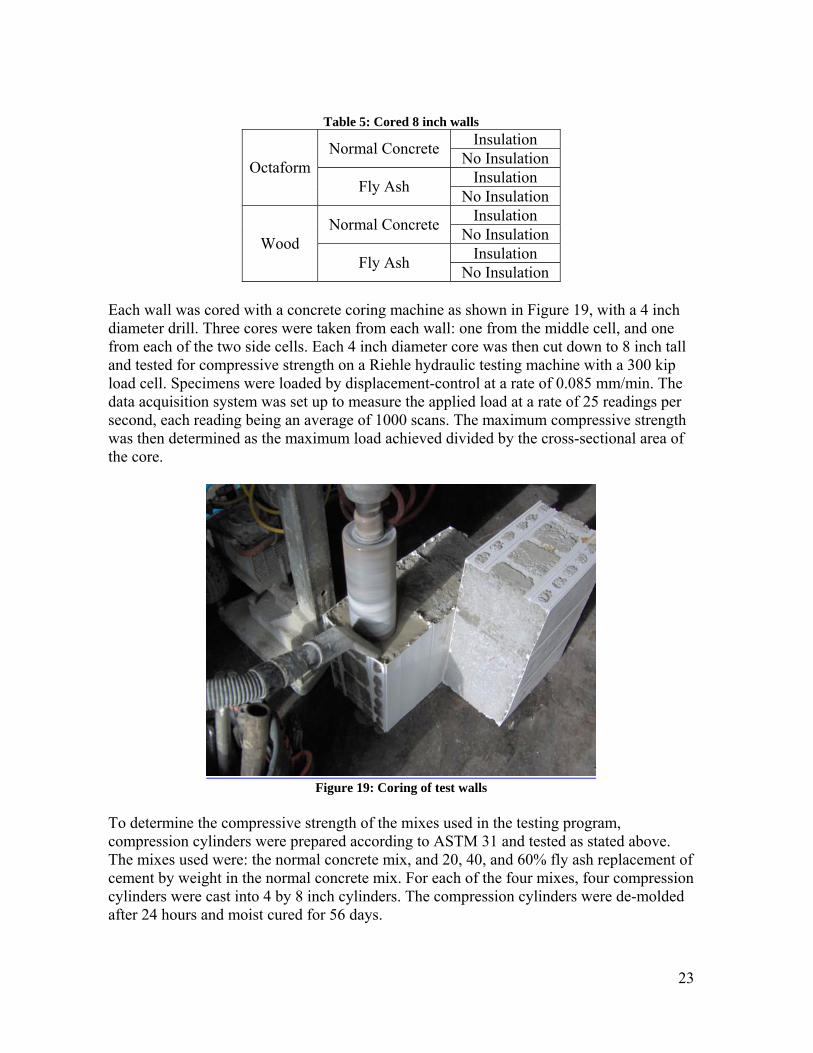
Fly Ash No Insulation Each wall was cored with a concrete coring machine as shown in Figure 19, with a 4 inch diameter drill. Three cores were taken from each wall: one from the middle cell, and one from each of the two side cells. Each 4 inch diameter core was then cut down to 8 inch tall and tested for compressive strength on a Riehle hydraulic testing machine with a 300 kip load cell. Specimens were loaded by displacement-control at a rate of 0.085 mm/min. The data acquisition system was set up to measure the applied load at a rate of 25 readings per second, each reading being an average of 1000 scans. The maximum compressive strength was then determined as the maximum load achieved divided by the cross-sectional area of the core.
Figure 19: Coring of test walls
To determine the compressive strength of the mixes used in the testing program, compression cylinders were prepared according to ASTM 31 and tested as stated above. The mixes used were: the normal concrete mix, and 20, 40, and 60% fly ash replacement of cement by weight in the normal concrete mix. For each of the four mixes, four compression cylinders were cast into 4 by 8 inch cylinders. The compression cylinders were de-molded after 24 hours and moist cured for 56 days.
24
IV. Results and Analysis
A. Preliminary Testing The preliminary testing results include calorimetry and repeatability results.
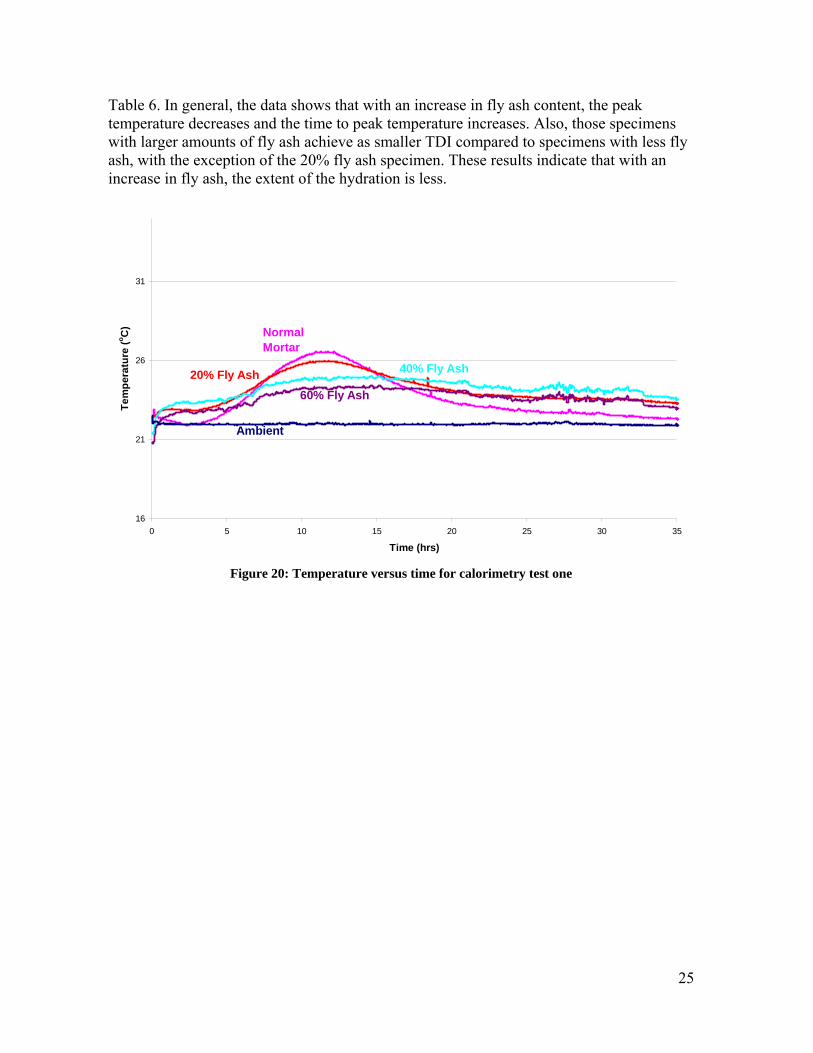
1. Calorimetry Three calorimetry tests were performed and graphs of temperature versus time were constructed for each. Figure 20 presents the temperature versus time for four mixes used in calorimetry test one: normal mortar, 20, 40, and 60% fly ash mortars. The graphs for the three calorimetry test are presented in Appendix A. The summarized data is shown below in
25
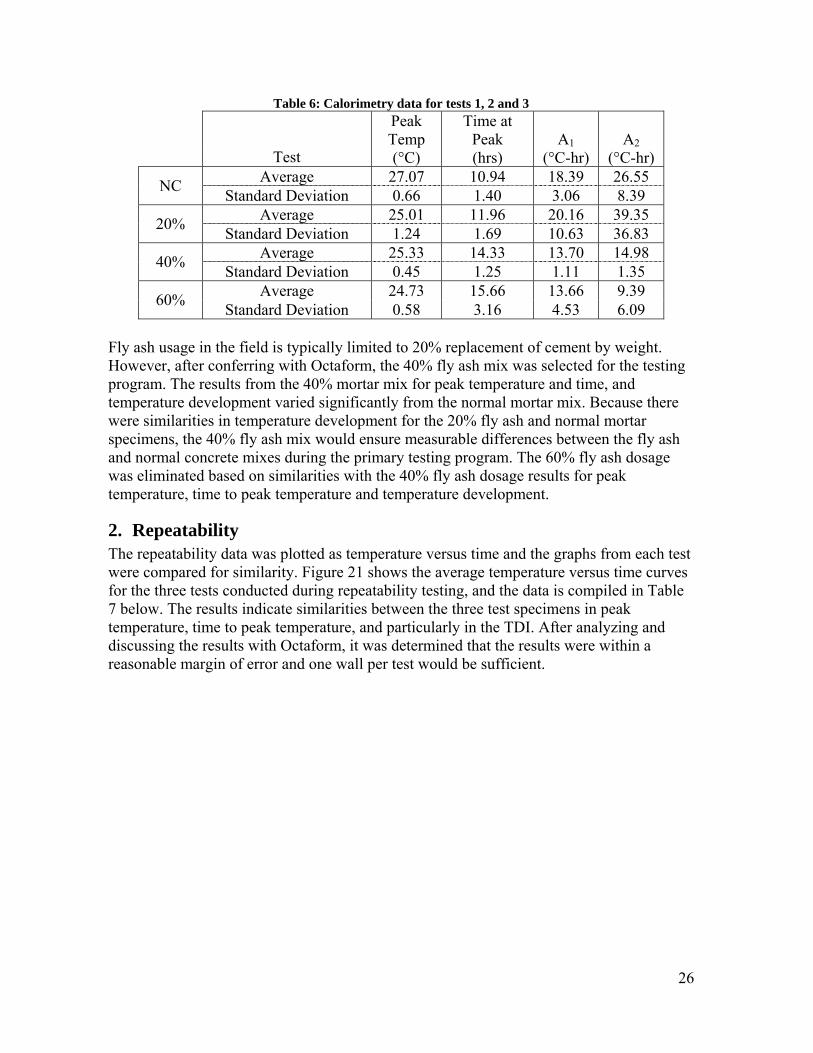
Table 6. In general, the data shows that with an increase in fly ash content, the peak temperature decreases and the time to peak temperature increases. Also, those specimens with larger amounts of fly ash achieve as smaller TDI compared to specimens with less fly ash, with the exception of the 20% fly ash specimen. These results indicate that with an increase in fly ash, the extent of the hydration is less.
16
21
26
31
0 5 10 15 20 25 30 35
Time (hrs)
Tem
pera
ture
(o C) Normal
Mortar
20% Fly Ash 40% Fly Ash
60% Fly Ash
Ambient
Figure 20: Temperature versus time for calorimetry test one
26
Table 6: Calorimetry data for tests 1, 2 and 3
Peak Temp
Time at Peak A1 A2
Test (°C) (hrs) (°C-hr) (°C-hr) Average 27.07 10.94 18.39 26.55 NC Standard Deviation 0.66 1.40 3.06 8.39 Average 25.01 11.96 20.16 39.35 20% Standard Deviation 1.24 1.69 10.63 36.83 Average 25.33 14.33 13.70 14.98 40% Standard Deviation 0.45 1.25 1.11 1.35 Average 24.73 15.66 13.66 9.39 60% Standard Deviation 0.58 3.16 4.53 6.09
Fly ash usage in the field is typically limited to 20% replacement of cement by weight. However, after conferring with Octaform, the 40% fly ash mix was selected for the testing program. The results from the 40% mortar mix for peak temperature and time, and temperature development varied significantly from the normal mortar mix. Because there were similarities in temperature development for the 20% fly ash and normal mortar specimens, the 40% fly ash mix would ensure measurable differences between the fly ash and normal concrete mixes during the primary testing program. The 60% fly ash dosage was eliminated based on similarities with the 40% fly ash dosage results for peak temperature, time to peak temperature and temperature development.
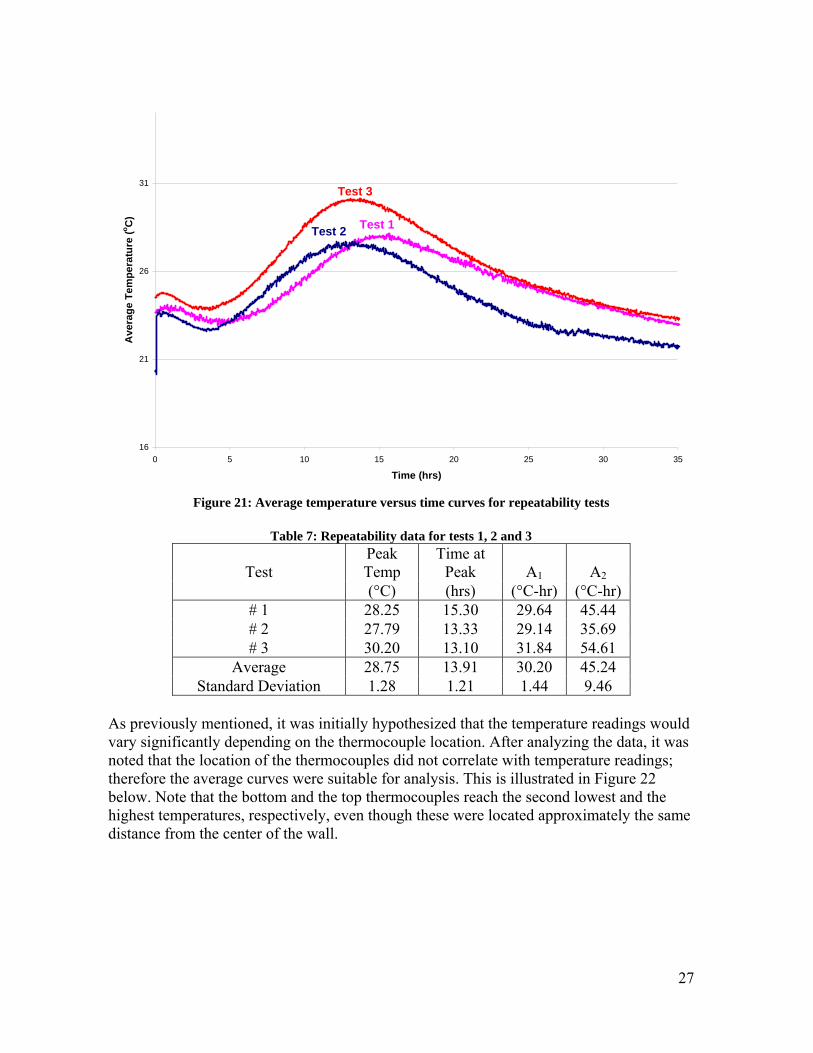
2. Repeatability The repeatability data was plotted as temperature versus time and the graphs from each test were compared for similarity. Figure 21 shows the average temperature versus time curves for the three tests conducted during repeatability testing, and the data is compiled in Table 7 below. The results indicate similarities between the three test specimens in peak temperature, time to peak temperature, and particularly in the TDI. After analyzing and discussing the results with Octaform, it was determined that the results were within a reasonable margin of error and one wall per test would be sufficient.
27
16
21
26
31
0 5 10 15 20 25 30 35
Time (hrs)
Ave
rage
Tem
pera
ture
(o C)
Test 1Test 2
Test 3
Figure 21: Average temperature versus time curves for repeatability tests
Table 7: Repeatability data for tests 1, 2 and 3
Peak Temp
Time at Peak A1 A2 Test
(°C) (hrs) (°C-hr) (°C-hr) # 1 28.25 15.30 29.64 45.44 # 2 27.79 13.33 29.14 35.69 # 3 30.20 13.10 31.84 54.61
Average 28.75 13.91 30.20 45.24 Standard Deviation 1.28 1.21 1.44 9.46
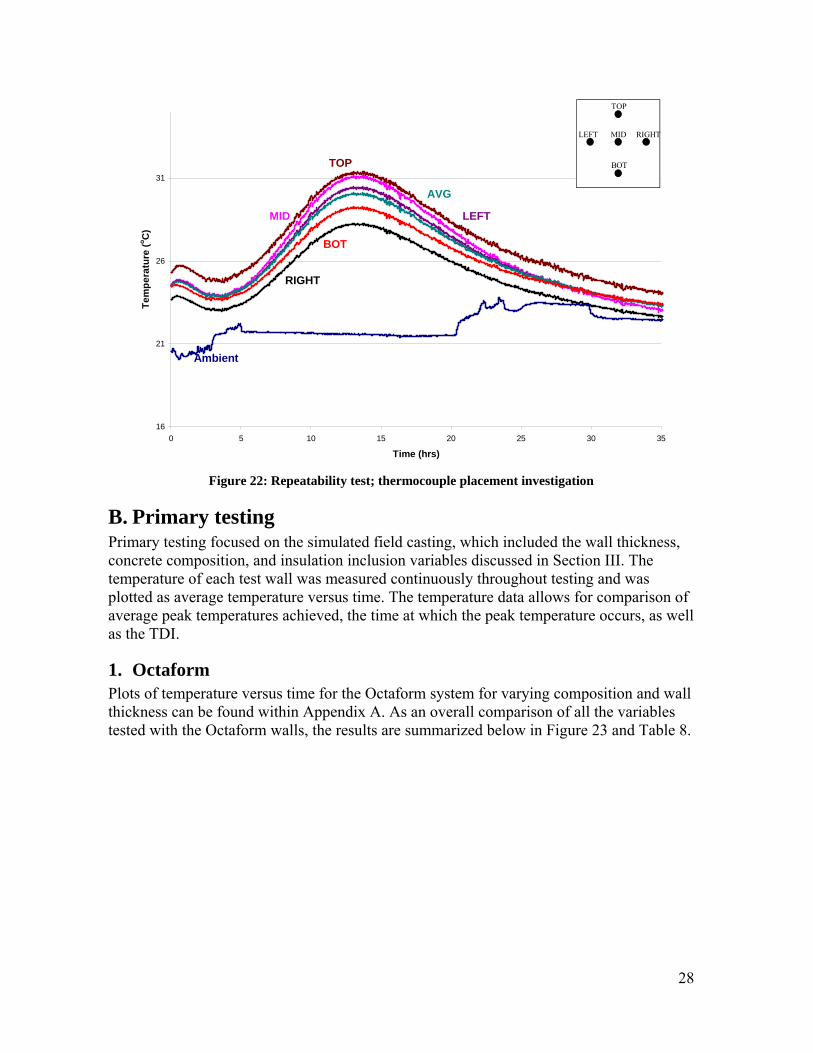
As previously mentioned, it was initially hypothesized that the temperature readings would vary significantly depending on the thermocouple location. After analyzing the data, it was noted that the location of the thermocouples did not correlate with temperature readings; therefore the average curves were suitable for analysis. This is illustrated in Figure 22 below. Note that the bottom and the top thermocouples reach the second lowest and the highest temperatures, respectively, even though these were located approximately the same distance from the center of the wall.
28
16
21
26
31
0 5 10 15 20 25 30 35
Time (hrs)
Tem
pera
ture
(o C)
TOP
BOT
LEFT RIGHTMID
Ambient
MID
RIGHT
BOT
LEFT
TOP
AVG
Figure 22: Repeatability test; thermocouple placement investigation
B. Primary testing Primary testing focused on the simulated field casting, which included the wall thickness, concrete composition, and insulation inclusion variables discussed in Section III. The temperature of each test wall was measured continuously throughout testing and was plotted as average temperature versus time. The temperature data allows for comparison of average peak temperatures achieved, the time at which the peak temperature occurs, as well as the TDI.
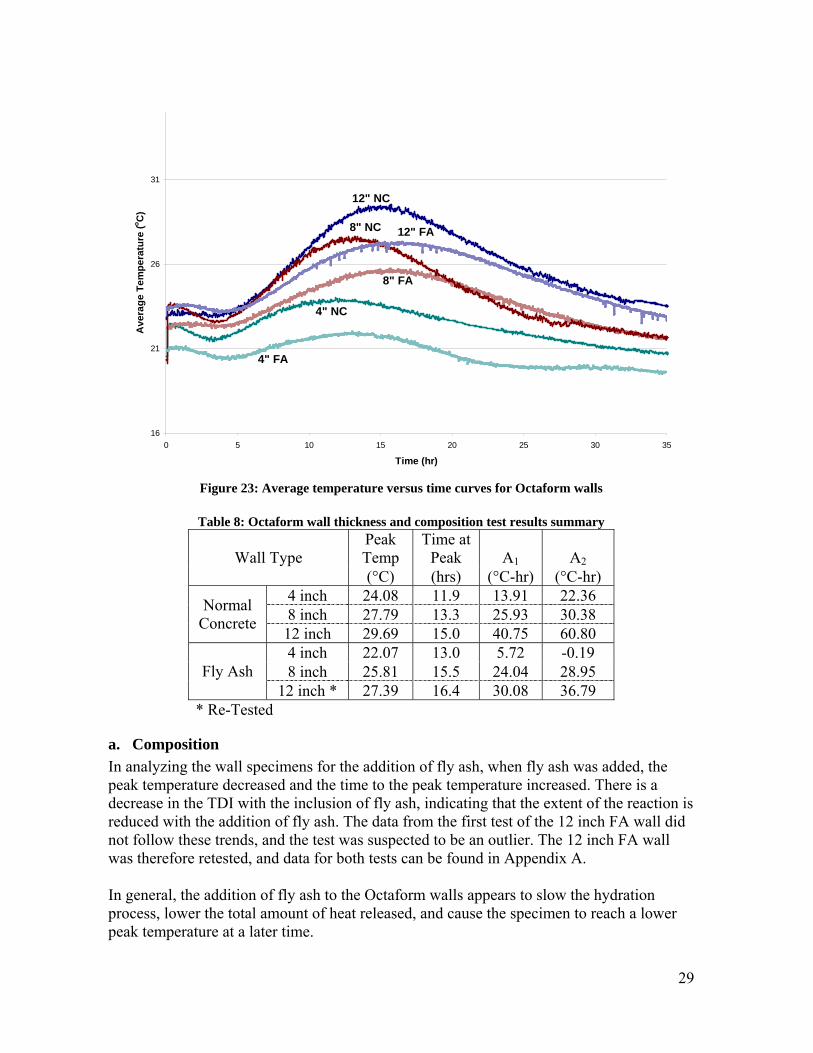
1. Octaform Plots of temperature versus time for the Octaform system for varying composition and wall thickness can be found within Appendix A. As an overall comparison of all the variables tested with the Octaform walls, the results are summarized below in Figure 23 and Table 8.
29
16
21
26
31
0 5 10 15 20 25 30 35
Time (hr)
Ave
rage
Tem
pera
ture
(o C)
12" NC
4" NC
8" FA
8" NC
4" FA
12" FA
Figure 23: Average temperature versus time curves for Octaform walls
Table 8: Octaform wall thickness and composition test results summary
Peak Temp
Time at Peak A1 A2 Wall Type
(°C) (hrs) (°C-hr) (°C-hr) 4 inch 24.08 11.9 13.91 22.36 8 inch 27.79 13.3 25.93 30.38 Normal
Concrete 12 inch 29.69 15.0 40.75 60.80 4 inch 22.07 13.0 5.72 -0.19 8 inch 25.81 15.5 24.04 28.95 Fly Ash
12 inch * 27.39 16.4 30.08 36.79 * Re-Tested
a. Composition In analyzing the wall specimens for the addition of fly ash, when fly ash was added, the peak temperature decreased and the time to the peak temperature increased. There is a decrease in the TDI with the inclusion of fly ash, indicating that the extent of the reaction is reduced with the addition of fly ash. The data from the first test of the 12 inch FA wall did not follow these trends, and the test was suspected to be an outlier. The 12 inch FA wall was therefore retested, and data for both tests can be found in Appendix A. In general, the addition of fly ash to the Octaform walls appears to slow the hydration process, lower the total amount of heat released, and cause the specimen to reach a lower peak temperature at a later time.
30
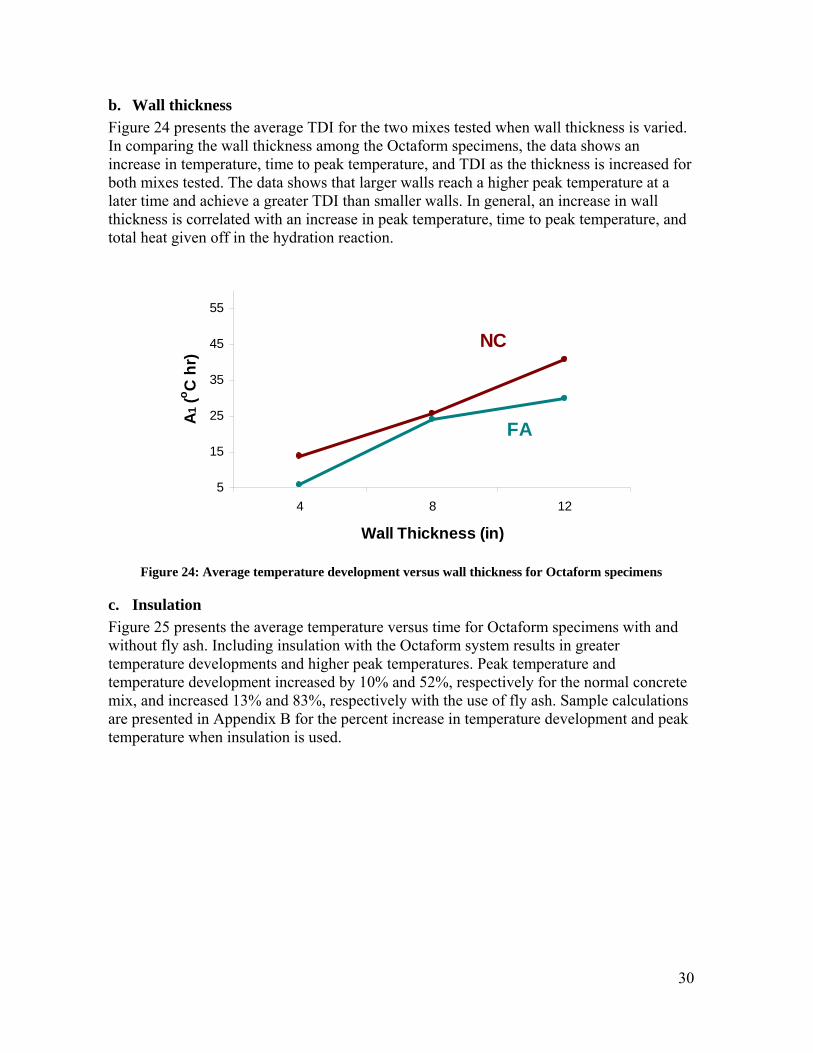
b. Wall thickness Figure 24 presents the average TDI for the two mixes tested when wall thickness is varied. In comparing the wall thickness among the Octaform specimens, the data shows an increase in temperature, time to peak temperature, and TDI as the thickness is increased for both mixes tested. The data shows that larger walls reach a higher peak temperature at a later time and achieve a greater TDI than smaller walls. In general, an increase in wall thickness is correlated with an increase in peak temperature, time to peak temperature, and total heat given off in the hydration reaction.
5
15
25
35
45
55
4 8 12
Wall Thickness (in)
A1 (o C
hr)
NC
FA
Figure 24: Average temperature development versus wall thickness for Octaform specimens
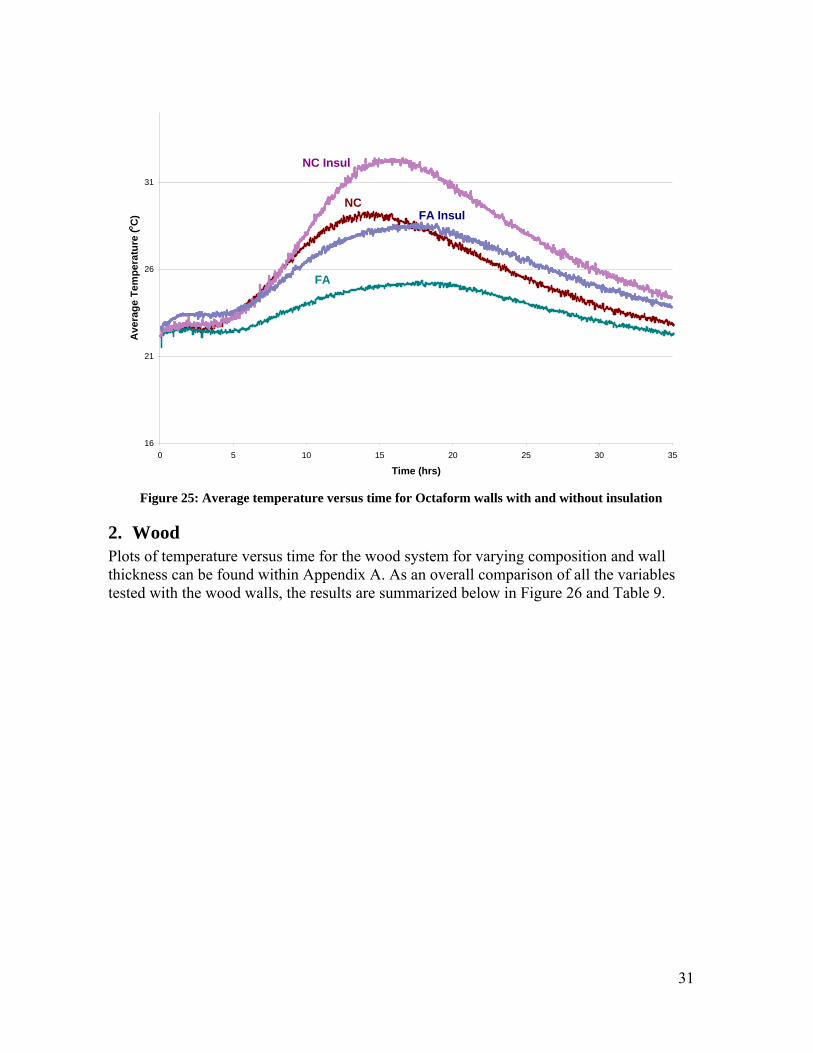
c. Insulation Figure 25 presents the average temperature versus time for Octaform specimens with and without fly ash. Including insulation with the Octaform system results in greater temperature developments and higher peak temperatures. Peak temperature and temperature development increased by 10% and 52%, respectively for the normal concrete mix, and increased 13% and 83%, respectively with the use of fly ash. Sample calculations are presented in Appendix B for the percent increase in temperature development and peak temperature when insulation is used.
31
16
21
26
31
0 5 10 15 20 25 30 35
Time (hrs)
Ave
rage
Tem
pera
ture
(o C)
NC
FA
NC Insul
FA Insul
Figure 25: Average temperature versus time for Octaform walls with and without insulation
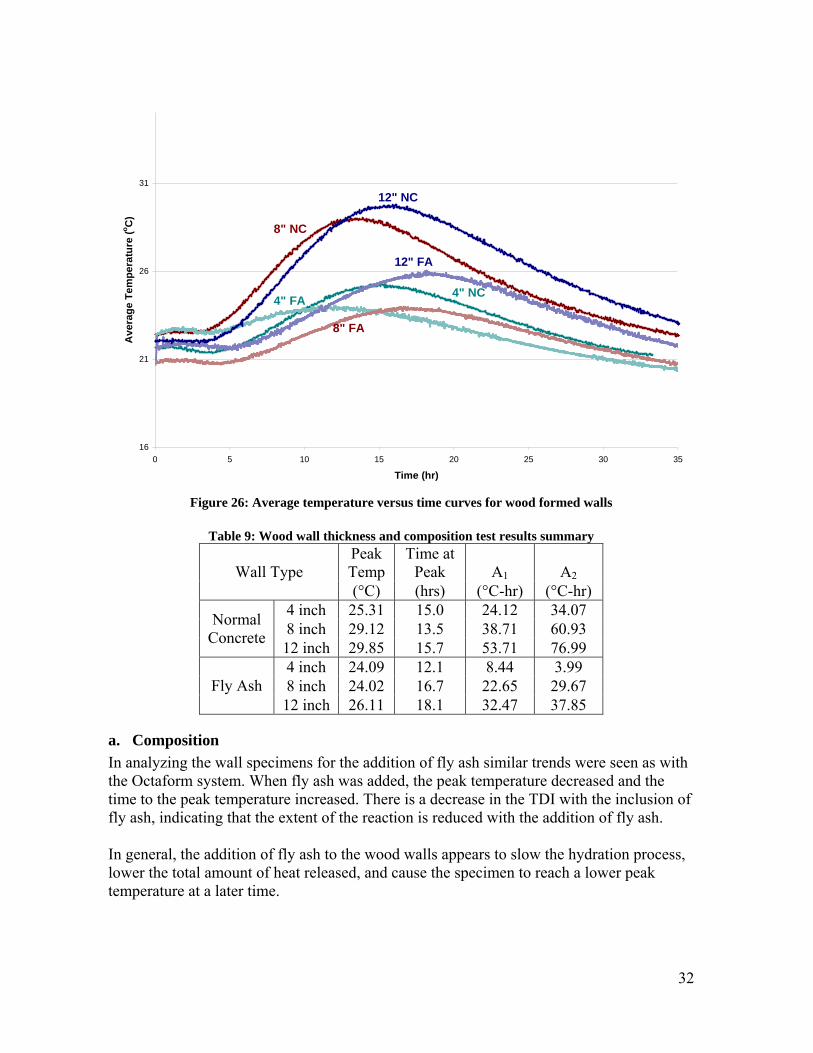
2. Wood Plots of temperature versus time for the wood system for varying composition and wall thickness can be found within Appendix A. As an overall comparison of all the variables tested with the wood walls, the results are summarized below in Figure 26 and Table 9.
32
16
21
26
31
0 5 10 15 20 25 30 35
Time (hr)
Ave
rage
Tem
pera
ture
(o C)
8" NC
4" NC4" FA
8" FA
12" FA
12" NC
Figure 26: Average temperature versus time curves for wood formed walls
Table 9: Wood wall thickness and composition test results summary
Peak Temp
Time at Peak A1 A2 Wall Type
(°C) (hrs) (°C-hr) (°C-hr) 4 inch 25.31 15.0 24.12 34.07 8 inch 29.12 13.5 38.71 60.93 Normal
Concrete 12 inch 29.85 15.7 53.71 76.99 4 inch 24.09 12.1 8.44 3.99 8 inch 24.02 16.7 22.65 29.67 Fly Ash 12 inch 26.11 18.1 32.47 37.85
a. Composition In analyzing the wall specimens for the addition of fly ash similar trends were seen as with the Octaform system. When fly ash was added, the peak temperature decreased and the time to the peak temperature increased. There is a decrease in the TDI with the inclusion of fly ash, indicating that the extent of the reaction is reduced with the addition of fly ash. In general, the addition of fly ash to the wood walls appears to slow the hydration process, lower the total amount of heat released, and cause the specimen to reach a lower peak temperature at a later time.
33
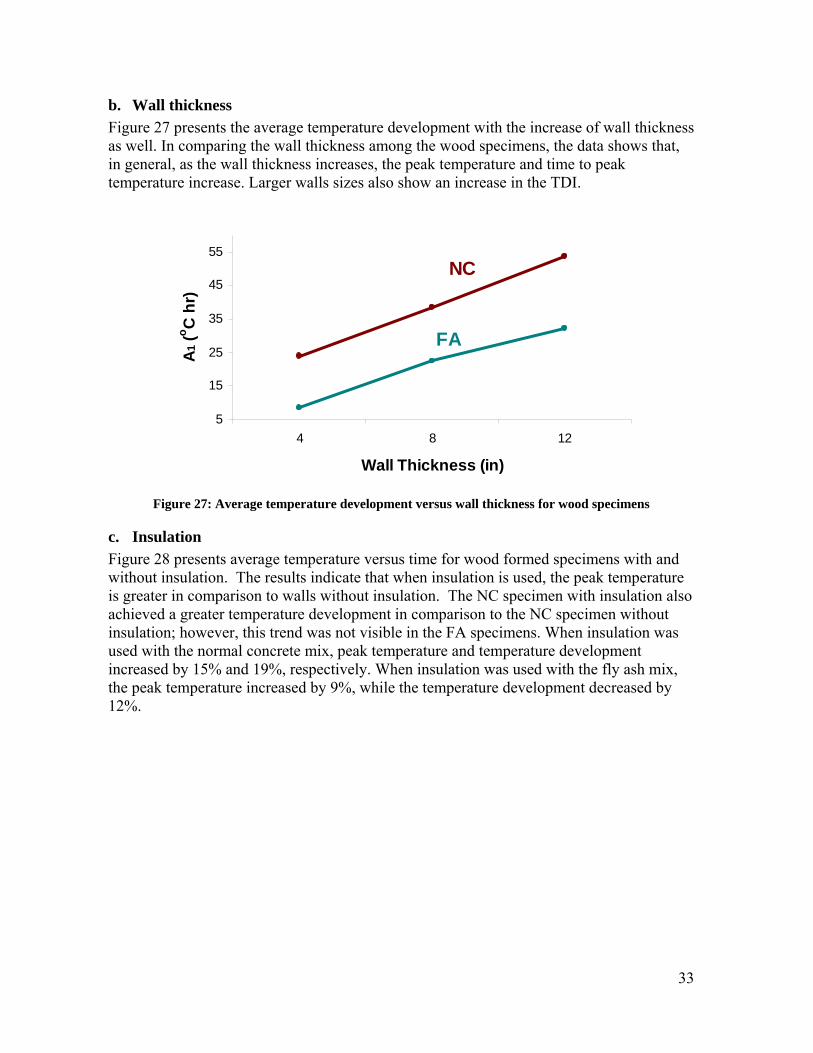
b. Wall thickness Figure 27 presents the average temperature development with the increase of wall thickness as well. In comparing the wall thickness among the wood specimens, the data shows that, in general, as the wall thickness increases, the peak temperature and time to peak temperature increase. Larger walls sizes also show an increase in the TDI.
5
15
25
35
45
55
4 8 12
Wall Thickness (in)
A1 (o C
hr)
NC
FA
Figure 27: Average temperature development versus wall thickness for wood specimens
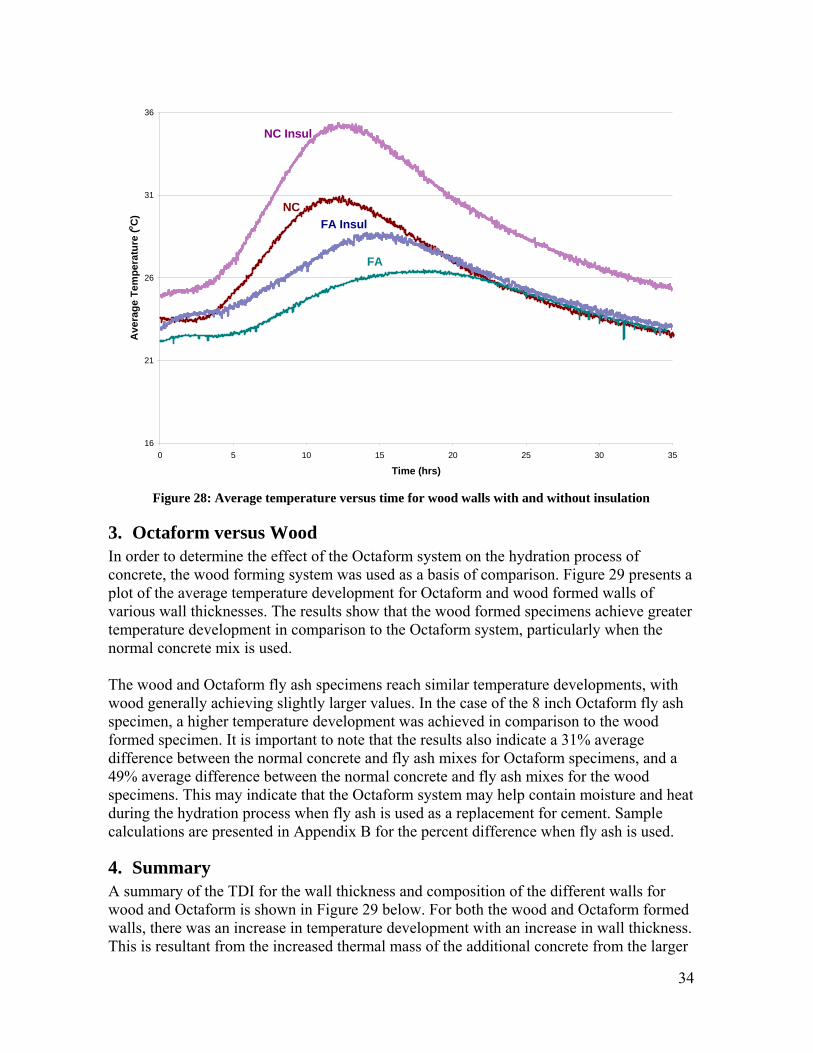
c. Insulation Figure 28 presents average temperature versus time for wood formed specimens with and without insulation. The results indicate that when insulation is used, the peak temperature is greater in comparison to walls without insulation. The NC specimen with insulation also achieved a greater temperature development in comparison to the NC specimen without insulation; however, this trend was not visible in the FA specimens. When insulation was used with the normal concrete mix, peak temperature and temperature development increased by 15% and 19%, respectively. When insulation was used with the fly ash mix, the peak temperature increased by 9%, while the temperature development decreased by 12%.
34
16
21
26
31
36
0 5 10 15 20 25 30 35
Time (hrs)
Ave
rage
Tem
pera
ture
(o C)
NC
FA
NC Insul
FA Insul
Figure 28: Average temperature versus time for wood walls with and without insulation
3. Octaform versus Wood In order to determine the effect of the Octaform system on the hydration process of concrete, the wood forming system was used as a basis of comparison. Figure 29 presents a plot of the average temperature development for Octaform and wood formed walls of various wall thicknesses. The results show that the wood formed specimens achieve greater temperature development in comparison to the Octaform system, particularly when the normal concrete mix is used. The wood and Octaform fly ash specimens reach similar temperature developments, with wood generally achieving slightly larger values. In the case of the 8 inch Octaform fly ash specimen, a higher temperature development was achieved in comparison to the wood formed specimen. It is important to note that the results also indicate a 31% average difference between the normal concrete and fly ash mixes for Octaform specimens, and a 49% average difference between the normal concrete and fly ash mixes for the wood specimens. This may indicate that the Octaform system may help contain moisture and heat during the hydration process when fly ash is used as a replacement for cement. Sample calculations are presented in Appendix B for the percent difference when fly ash is used.
4. Summary A summary of the TDI for the wall thickness and composition of the different walls for wood and Octaform is shown in Figure 29 below. For both the wood and Octaform formed walls, there was an increase in temperature development with an increase in wall thickness. This is resultant from the increased thermal mass of the additional concrete from the larger
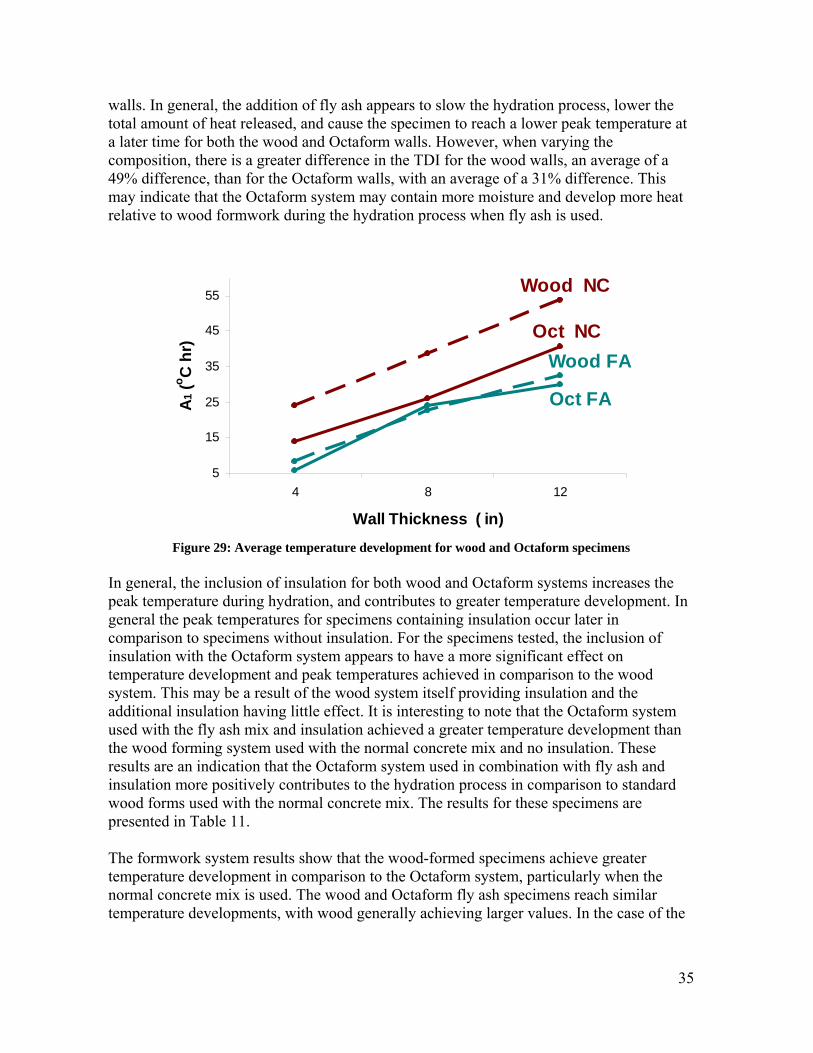
35
walls. In general, the addition of fly ash appears to slow the hydration process, lower the total amount of heat released, and cause the specimen to reach a lower peak temperature at a later time for both the wood and Octaform walls. However, when varying the composition, there is a greater difference in the TDI for the wood walls, an average of a 49% difference, than for the Octaform walls, with an average of a 31% difference. This may indicate that the Octaform system may contain more moisture and develop more heat relative to wood formwork during the hydration process when fly ash is used.
5
15
25
35
45
55
4 8 12
Wall Thickness ( in)
A1 (o C
hr)
Wood NC
Wood FA
Oct FA
Oct NC
Figure 29: Average temperature development for wood and Octaform specimens
In general, the inclusion of insulation for both wood and Octaform systems increases the peak temperature during hydration, and contributes to greater temperature development. In general the peak temperatures for specimens containing insulation occur later in comparison to specimens without insulation. For the specimens tested, the inclusion of insulation with the Octaform system appears to have a more significant effect on temperature development and peak temperatures achieved in comparison to the wood system. This may be a result of the wood system itself providing insulation and the additional insulation having little effect. It is interesting to note that the Octaform system used with the fly ash mix and insulation achieved a greater temperature development than the wood forming system used with the normal concrete mix and no insulation. These results are an indication that the Octaform system used in combination with fly ash and insulation more positively contributes to the hydration process in comparison to standard wood forms used with the normal concrete mix. The results for these specimens are presented in Table 11. The formwork system results show that the wood-formed specimens achieve greater temperature development in comparison to the Octaform system, particularly when the normal concrete mix is used. The wood and Octaform fly ash specimens reach similar temperature developments, with wood generally achieving larger values. In the case of the
36
8 inch Octaform fly ash specimen, a slightly higher temperature development was achieved in comparison to the wood formed specimen. In comparing the wood and Octaform formed walls, the wood formed walls generally achieved a higher temperature development than the Octaform formed walls for all size walls. This trend prompted research into the R-Value of each formwork material, which is a measure of the materials resistance to thermal change. The R-Value for Octaform is 0.60 (Octaform website) while that for 3/4 inch plywood is 0.90 (TECO). The lower R-Value of the Octaform indicates that it is less resistant to thermal change than the wood, and hence may explain why it achieved lower temperature development overall.
C. Strength Testing
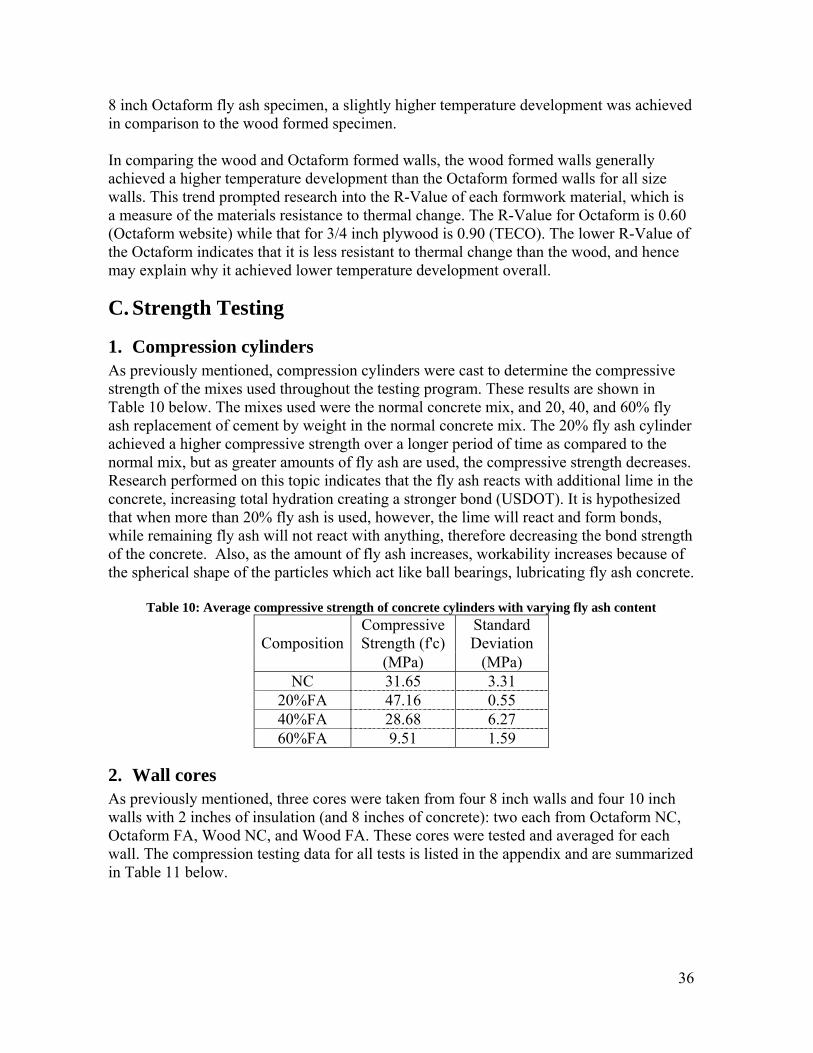
1. Compression cylinders As previously mentioned, compression cylinders were cast to determine the compressive strength of the mixes used throughout the testing program. These results are shown in Table 10 below. The mixes used were the normal concrete mix, and 20, 40, and 60% fly ash replacement of cement by weight in the normal concrete mix. The 20% fly ash cylinder achieved a higher compressive strength over a longer period of time as compared to the normal mix, but as greater amounts of fly ash are used, the compressive strength decreases. Research performed on this topic indicates that the fly ash reacts with additional lime in the concrete, increasing total hydration creating a stronger bond (USDOT). It is hypothesized that when more than 20% fly ash is used, however, the lime will react and form bonds, while remaining fly ash will not react with anything, therefore decreasing the bond strength of the concrete. Also, as the amount of fly ash increases, workability increases because of the spherical shape of the particles which act like ball bearings, lubricating fly ash concrete.
Table 10: Average compressive strength of concrete cylinders with varying fly ash content Compressive Strength (f'c)
Standard Deviation Composition
(MPa) (MPa) NC 31.65 3.31
20%FA 47.16 0.55 40%FA 28.68 6.27 60%FA 9.51 1.59
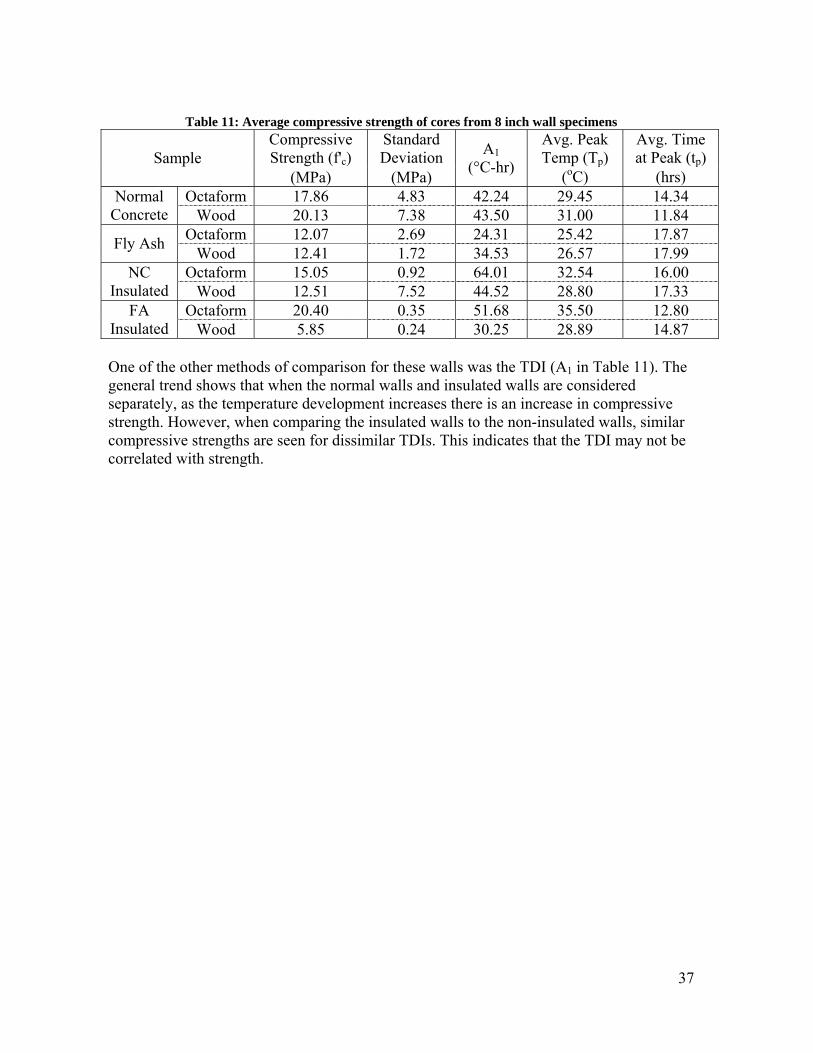
2. Wall cores As previously mentioned, three cores were taken from four 8 inch walls and four 10 inch walls with 2 inches of insulation (and 8 inches of concrete): two each from Octaform NC, Octaform FA, Wood NC, and Wood FA. These cores were tested and averaged for each wall. The compression testing data for all tests is listed in the appendix and are summarized in Table 11 below.
37
Table 11: Average compressive strength of cores from 8 inch wall specimens
Compressive Strength (f'c)
Standard Deviation
Avg. Peak Temp (Tp)
Avg. Time at Peak (tp) Sample
(MPa) (MPa)
A1 (°C-hr) (oC) (hrs)
Octaform 17.86 4.83 42.24 29.45 14.34 Normal Concrete Wood 20.13 7.38 43.50 31.00 11.84
Octaform 12.07 2.69 24.31 25.42 17.87 Fly Ash Wood 12.41 1.72 34.53 26.57 17.99 Octaform 15.05 0.92 64.01 32.54 16.00 NC
Insulated Wood 12.51 7.52 44.52 28.80 17.33 Octaform 20.40 0.35 51.68 35.50 12.80 FA
Insulated Wood 5.85 0.24 30.25 28.89 14.87 One of the other methods of comparison for these walls was the TDI (A1 in Table 11). The general trend shows that when the normal walls and insulated walls are considered separately, as the temperature development increases there is an increase in compressive strength. However, when comparing the insulated walls to the non-insulated walls, similar compressive strengths are seen for dissimilar TDIs. This indicates that the TDI may not be correlated with strength.
38
V. Conclusions and Recommendations
A. Summary of Findings The following conclusions can be drawn from the experiments conducted in this project:
• The wood forming system contributes to higher peak temperatures, which occur at a later time in comparison to Octaform forming systems. The extent of hydration process does appear to be greater in the wood system for the normal concrete mix.
• There is a greater difference in temperature development between the wood and Octaform walls for the normal concrete mix compared to the fly ash mix. This may indicate that when fly ash is used as a replacement for cement, the Octaform system may contain moisture and heat during the hydration process.
• The inclusion of insulation with the Octaform system has shown to increase peak temperature and temperature development during hydration. In comparison to the wood system, the inclusion of insulation with the Octaform system appears to have a greater effect on temperature development and peak temperature.
• The Octaform system used in combination with the fly ash mix and insulation achieved greater temperature development in comparison to the non-insulated wood forming system used with the normal concrete. These results indicate that the insulated Octaform system used with fly ash more positively contributes to the hydration process in comparison to the non-insulated wood formed system used with the normal concrete mix.
B. Size Effect The conditions of the laboratory used in this experiment limited the size of specimens that could be used. Larger specimens found in the field would show increases in peak temperature, temperature development and curing time.
C. Temperature Effect Research has shown that ambient temperature greatly affects the hydration process; colder temperatures slow down the hydration process while warmer temperatures accelerate the hydration process. Under the lab conditions associated with this work, ambient temperatures could not be controlled during repeatability and primary testing. Because wood forms are typically stripped from concrete early in the hydration process, the concrete is left exposed, while Octaform remains. The stripping of wood forms may result in evaporation of water from the concrete during hydration, and the loss of the forms as insulation from ambient temperature effects. The effect of stripping time on hydration was not investigated in this work.
D. Recommendations for Further Research Further research should be done on the comparison of wood and Octaform forming systems. In particular, larger wall sizes should be tested to better approximate the conditions seen in the field. Stripping time variability should be incorporated into this testing, with increased curing times for the compression testing. Lab conditions available
39
could not accommodate temperature controlled environments for repeatability and primary testing, as was possible for calorimetry testing. Further testing should incorporate the effect of temperature on hydration by providing consistent ambient temperatures during testing. Testing should also be performed under extreme ambient conditions to simulate colder winter climates and warmer summer climates.
E. Suggestions Because of the effects on hydration when insulation is used, the Octaform system may provide benefits in colder climates by helping to control temperatures during the hydration process. The inclusion of insulation with the Octaform system may also be beneficial when greater control in temperature development is desired. The Octaform system with insulation can be easily and quickly constructed, while insulation is used less often with typical formwork as a result of constructability issues. Because of the constructability benefits of the Octaform system over typical formwork, the application of Octaform with insulation may improve construction practices. Octaform may also contribute to the hydration process when fly ash is used as a replacement for cement. It is evident that Octaform used in combination with insulation and fly ash more positively contributes to the hydration process in comparison to the typical field application of non-insulated wood forms used with the normal concrete mix. The application of Octaform with fly ash mixes is both economically and environmentally advantageous as it reduces the amount of cement and carbon emissions.
40
VI. References American Society for Testing and Materials, (2004a) “Standard Test Method for
Compressive Strength of Cylindrical Concrete Specimens,” (ASTM C 39/C 39M-03), ASTM Standard, V 04.02, 21-25.
American Society for Testing and Materials, (2004b) “Mechanical Mixing of Hydraulic
Cement Pastes and Mortars of Plastic Consistency,” (ASTM C 305/C 305M-03), ASTM Standard, V 04.01, 227-229.
American Society for Testing and Materials, (2004c) “Standard Practice for Making and
Curing Concrete Test Specimens in the Laboratory,” (ASTM C 39/C 39M-03), ASTM Standard, V 04.02, 21-25.
American Society for Testing and Materials, (2004d) “Standard Test Method for Obtaining
and Testing Drilled Cores and Sawed Beams of Concrete,” (ASTM C 42/C 42M-03), ASTM Standard, V 04.02, 28-32.
American Society for Testing and Materials, (2004e) “Standard Specification for Coal Fly
Ash and Raw or Calcined Natural Possolan for Use in Concrete,” (ASTM C 618-03), ASTM Standard, V 04.02, 319-321.
Harris-Jones, C., R. Hawksworth, S. Henderson, J. Whitney. (2006). Effects of PVC Stay-
in-place Formwork on the Mechanical Properties of Concrete. Senior Design Report submitted to Seattle University Science and Engineering Project Center, Seattle, Seattle University.
Khan, A. A., W. D. Cook, D. Mitchell. (1998). “Thermal Properties and Transient Thermal
Analysis of Structural Members during Hydration.” ACI Materials Journal (May-June).
Malhotra, V. M. (2006). Reducing CO2 Emissions. Concrete International: 42-45. Mindess, S. and J. F. Young (1981). Concrete. Englewood Cliffs, N.J., Prentice Hall. Neville, A. (1981). Properties of Concrete, John Wiley and Sons Inc. Octaform Systems Incorporated (personal communication, October 2006). Price, W. H. (1951). “Factors Influencing Concrete Strength.” Journal of the American
Concrete Institute. Wang, K., Z. Ge, J. Grove, J. M. Ruiz, R. Rasmussen. (2006). “Developing a Simple and
Rapid Test of Monitoring the Heat Evolution of Concrete Mixtures for Both Laboratory and Field Applications”, Iowa State University: 17-19.
41
U.S. Department of Transportation – Federal Highway Administration. (06-29-06). Fly Ash Facts for Highway Engineers. In chapter 3. Retrieved May 23rd, 2007, from http://www.fhwa.dot.gov/pavement/recycling/fach03.cfm
Octaform Systems, Inc. Technical Info – R-Table Values. (2005). Insulation Values for
Various Wall Sizes: Uninsulated. Retrieved May 23rd, 2007, from http://www.octaform.com/tech_rvalues.html
Timberco, Inc. dba (TECO). Technical Information – Plywood – Plywood Faqs. (2004).
What are the insulation R-values of plywood panels?. Retrieved May 23rd, 2007, from http://www.tecotested.com/plywood_tech_faqs.htm
ACI Reference for Table 4.2.5

A-1
Appendix A – Data
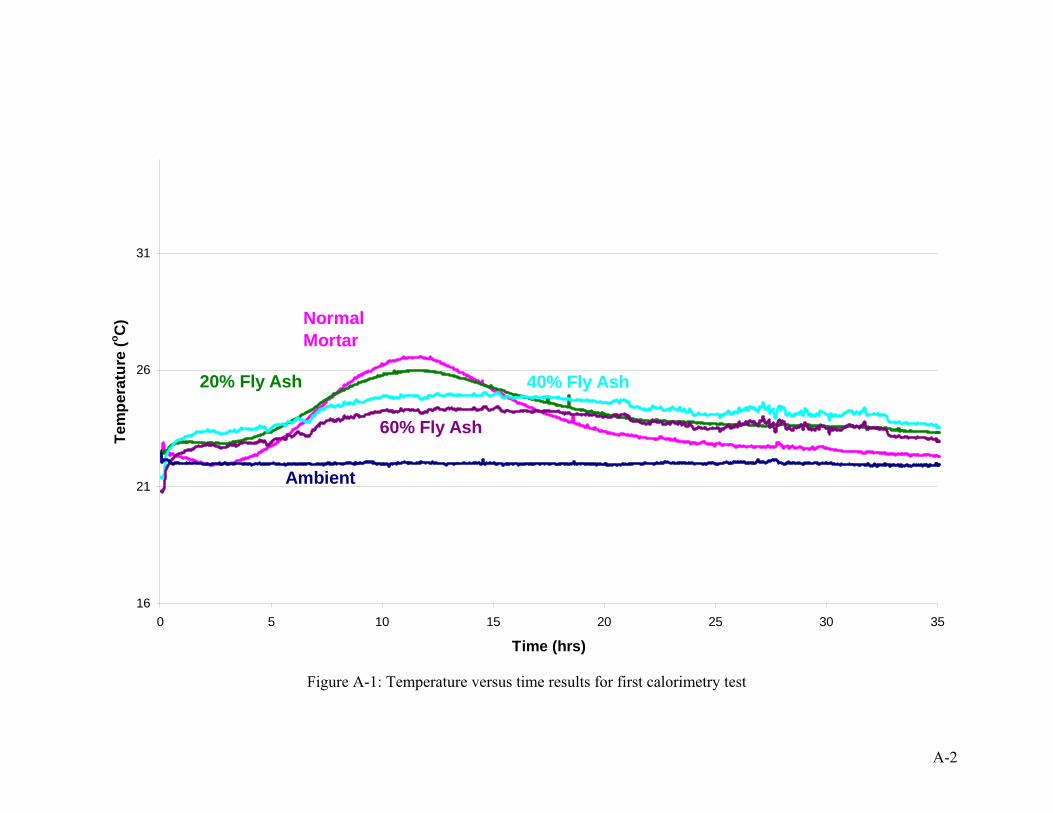
A-2
16
21
26
31
0 5 10 15 20 25 30 35
Time (hrs)
Tem
pera
ture
(o C) Normal
Mortar
20% Fly Ash 40% Fly Ash
60% Fly Ash
Ambient
Figure A-1: Temperature versus time results for first calorimetry test
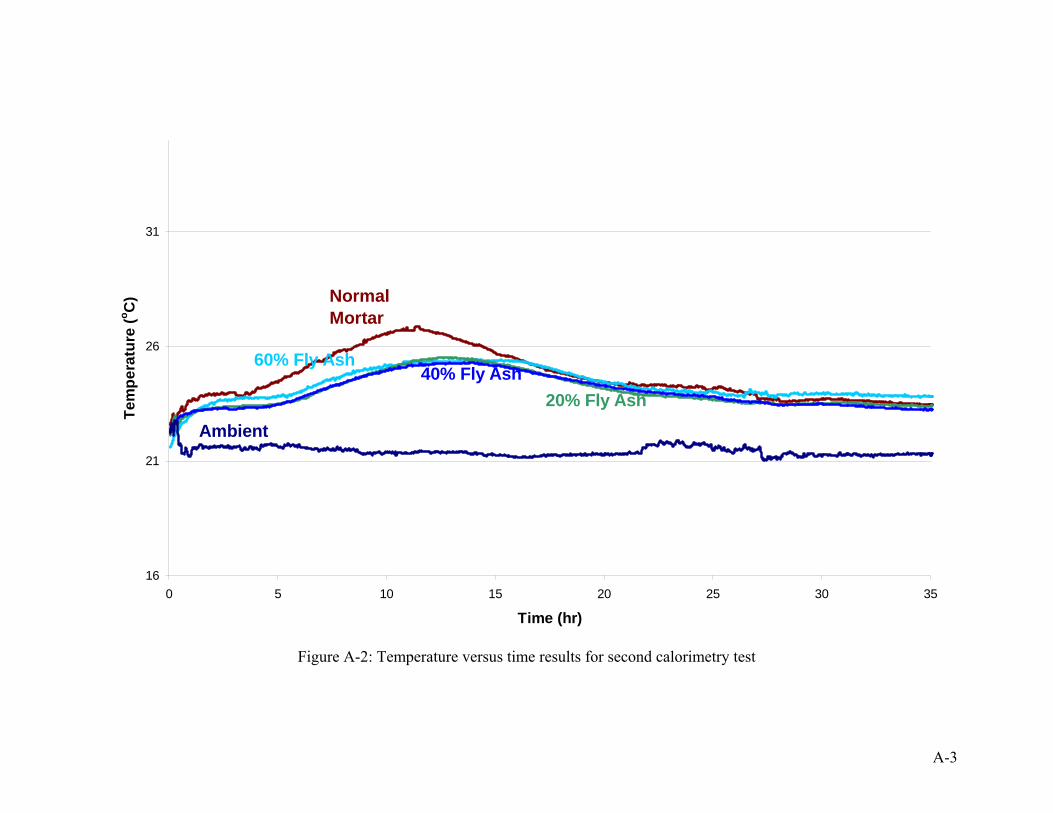
A-3
16
21
26
31
0 5 10 15 20 25 30 35
Time (hr)
Tem
pera
ture
(o C) Normal
Mortar
20% Fly Ash40% Fly Ash
60% Fly Ash
Ambient
Figure A-2: Temperature versus time results for second calorimetry test
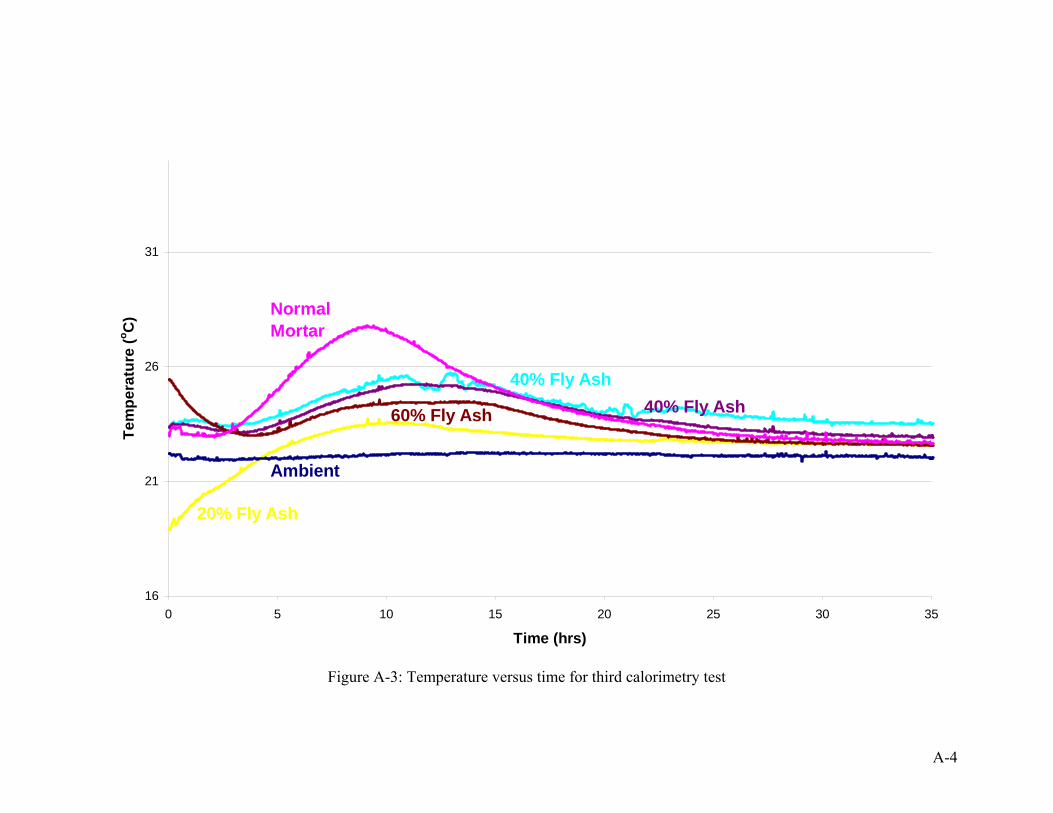
A-4
16
21
26
31
0 5 10 15 20 25 30 35
Time (hrs)
Tem
pera
ture
(o C) Normal
Mortar
20% Fly Ash
40% Fly Ash40% Fly Ash
Ambient
60% Fly Ash
Figure A-3: Temperature versus time for third calorimetry test
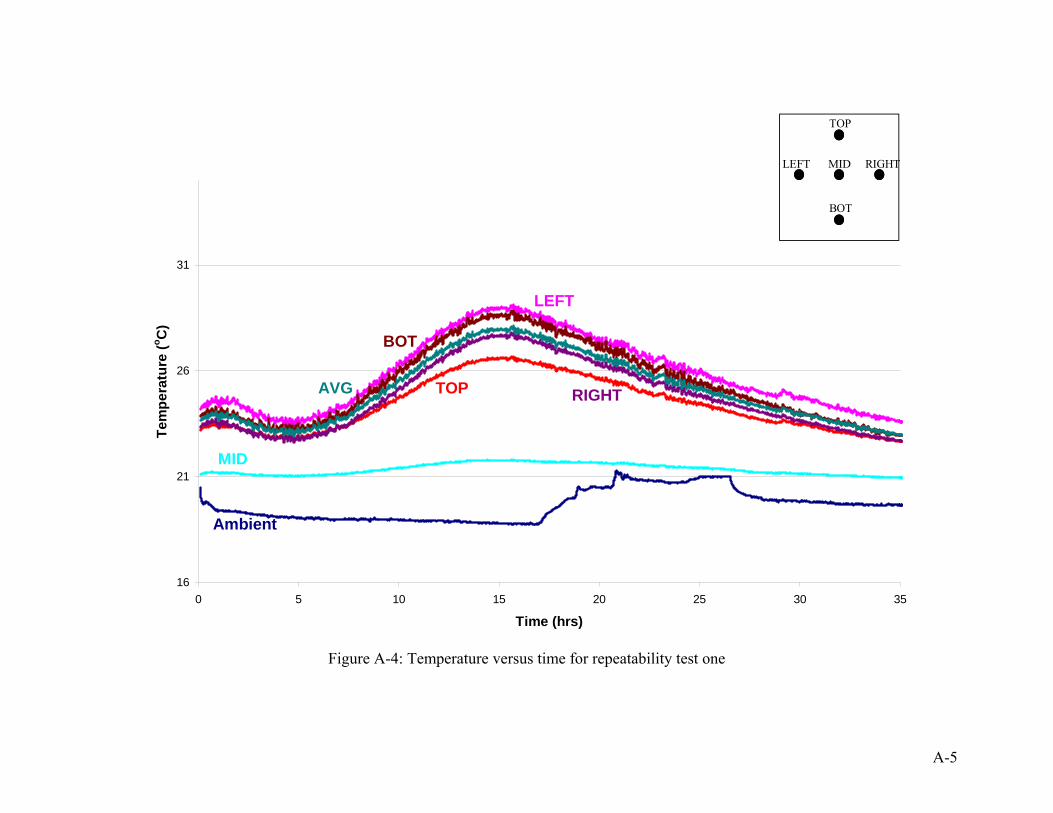
A-5
16
21
26
31
0 5 10 15 20 25 30 35
Time (hrs)
Tem
pera
ture
(o C)
TOP
Ambient
MID
BOT
RIGHT
LEFT
AVG
TOP
BOT
LEFT RIGHTMID
Figure A-4: Temperature versus time for repeatability test one
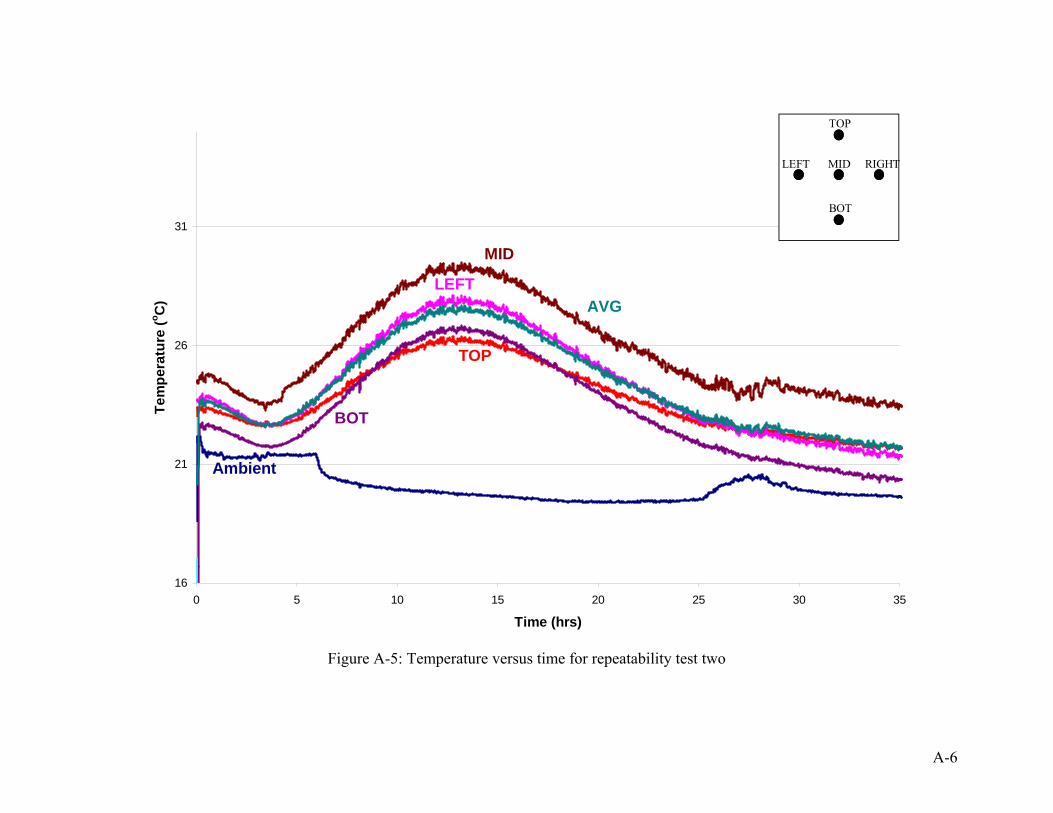
A-6
16
21
26
31
0 5 10 15 20 25 30 35
Time (hrs)
Tem
pera
ture
(o C)
Ambient
LEFT
TOP
BOT
MID
AVG
TOP
BOT
LEFT RIGHTMID
Figure A-5: Temperature versus time for repeatability test two
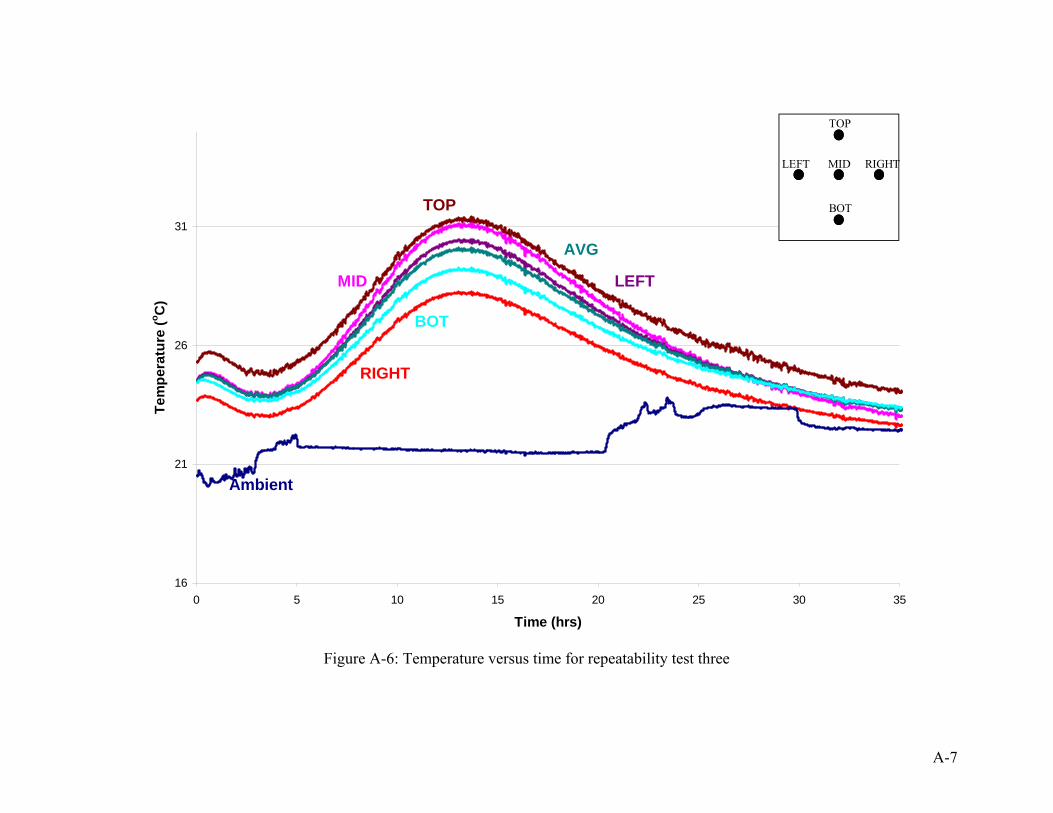
A-7
16
21
26
31
0 5 10 15 20 25 30 35
Time (hrs)
Tem
pera
ture
(o C)
Ambient
MID
RIGHT
BOT
LEFT
TOP
AVG
TOP
BOT
LEFT RIGHTMID
Figure A-6: Temperature versus time for repeatability test three
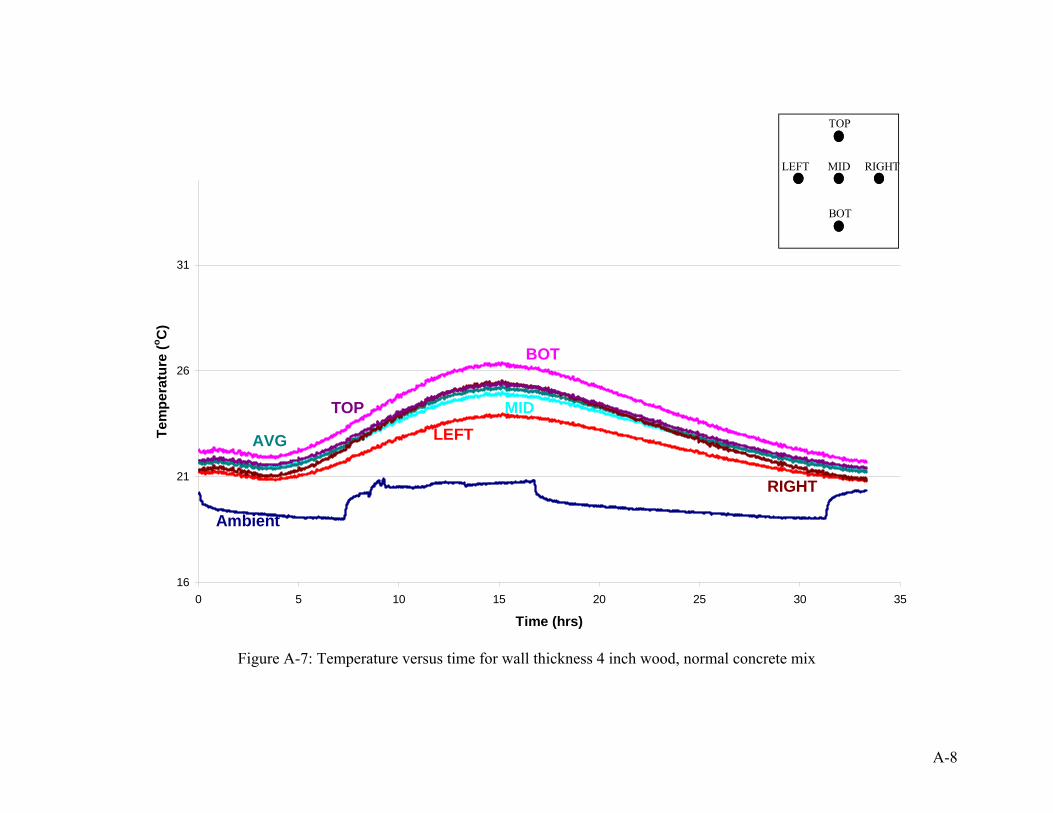
A-8
16
21
26
31
0 5 10 15 20 25 30 35
Time (hrs)
Tem
pera
ture
(o C)
RIGHT
TOPLEFT
MID
BOT
Ambient
AVG
TOP
BOT
LEFT RIGHTMID
Figure A-7: Temperature versus time for wall thickness 4 inch wood, normal concrete mix
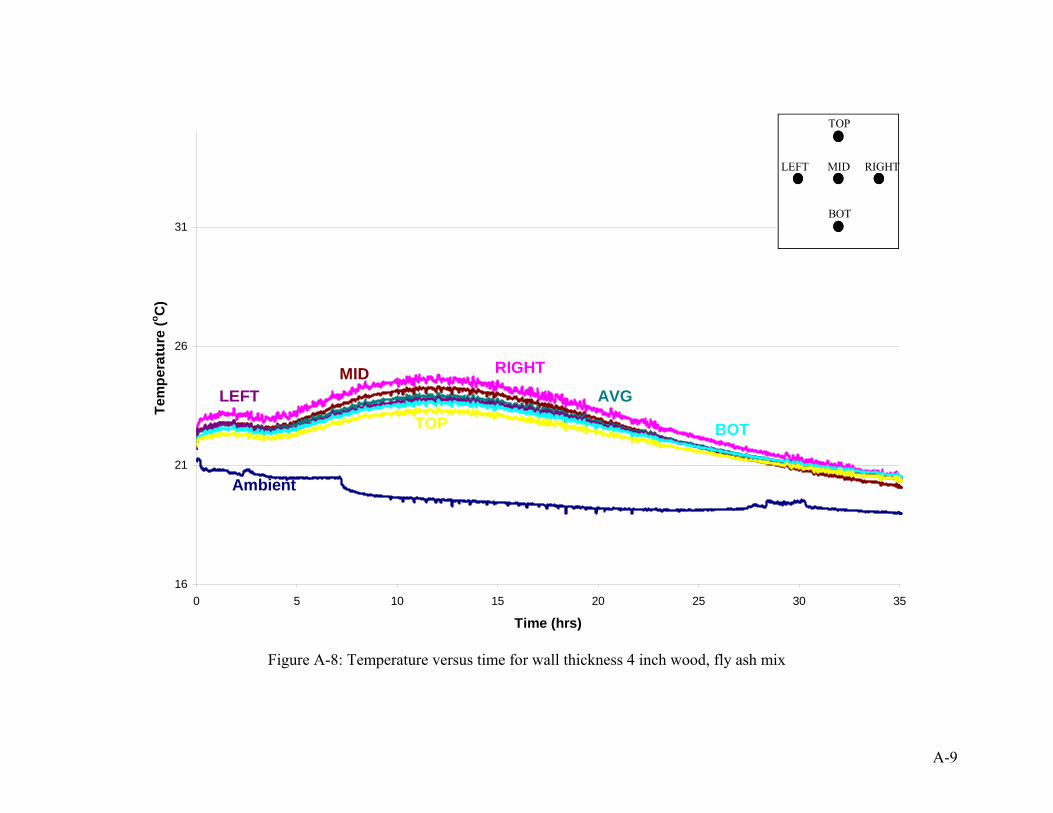
A-9
16
21
26
31
0 5 10 15 20 25 30 35
Time (hrs)
Tem
pera
ture
(o C)
MIDLEFT
TOP BOT
RIGHT
Ambient
AVG
TOP
BOT
LEFT RIGHTMID
Figure A-8: Temperature versus time for wall thickness 4 inch wood, fly ash mix
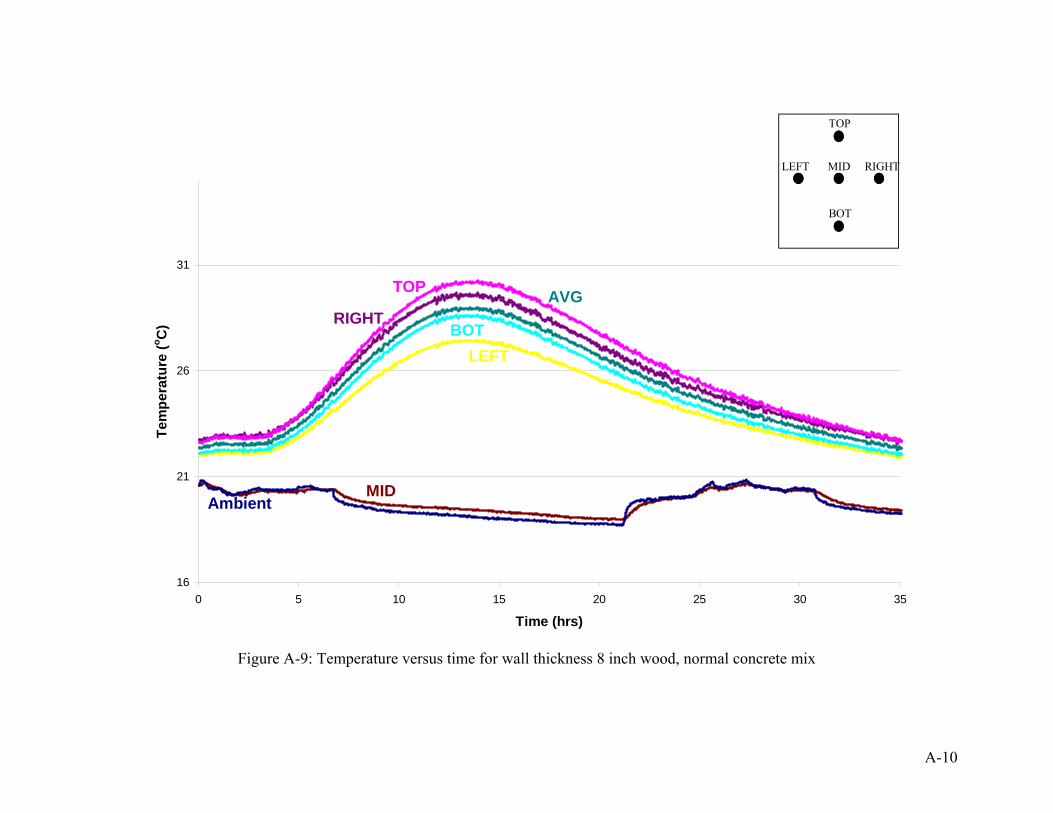
A-10
16
21
26
31
0 5 10 15 20 25 30 35
Time (hrs)
Tem
pera
ture
(o C)
MID
RIGHT
LEFTBOT
TOP
Ambient
AVG
TOP
BOT
LEFT RIGHTMID
Figure A-9: Temperature versus time for wall thickness 8 inch wood, normal concrete mix
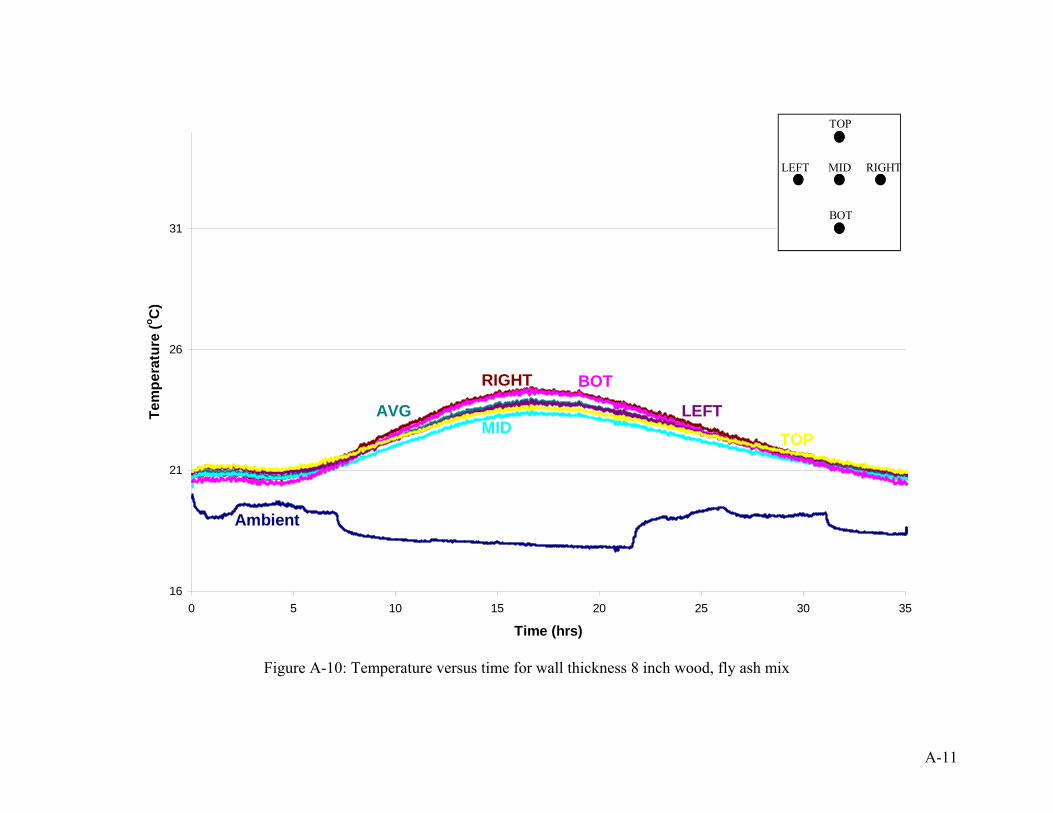
A-11
16
21
26
31
0 5 10 15 20 25 30 35
Time (hrs)
Tem
pera
ture
(o C)
RIGHT
LEFT
TOPMID
BOT
Ambient
AVG
TOP
BOT
LEFT RIGHTMID
Figure A-10: Temperature versus time for wall thickness 8 inch wood, fly ash mix
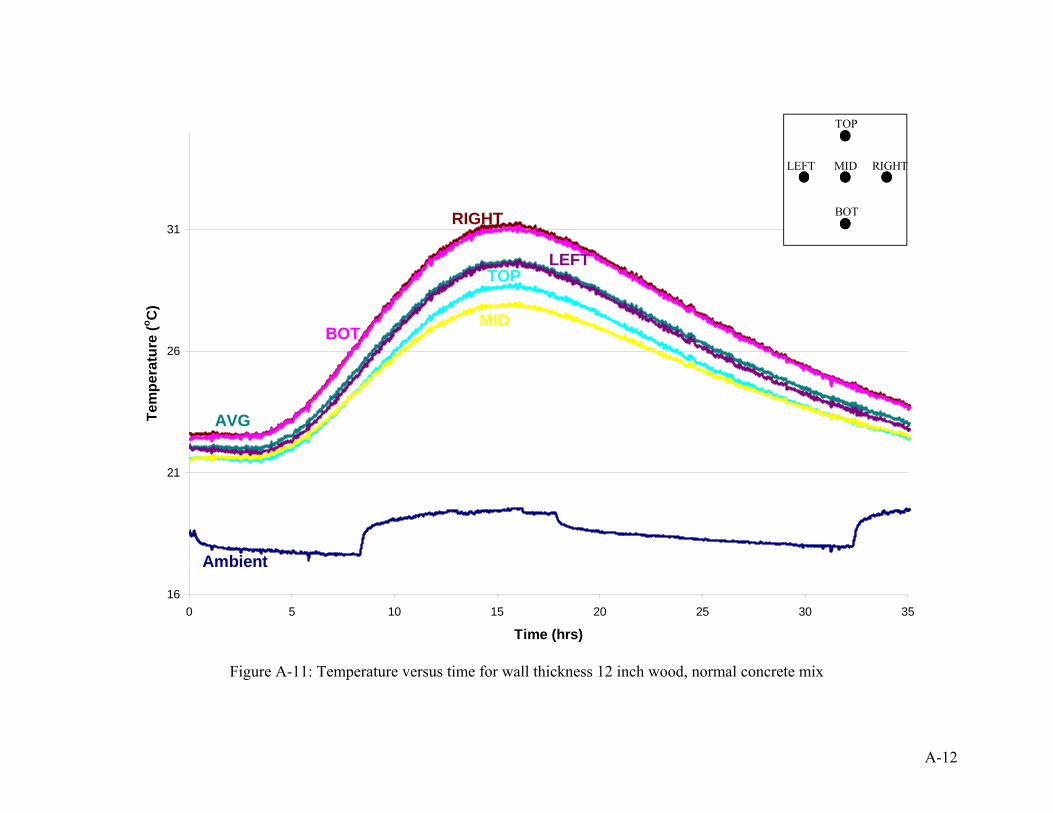
A-12
16
21
26
31
0 5 10 15 20 25 30 35
Time (hrs)
Tem
pera
ture
(o C)
RIGHT
LEFT
MID
TOP
BOT
AVG
Ambient
TOP
BOT
LEFT RIGHTMID
Figure A-11: Temperature versus time for wall thickness 12 inch wood, normal concrete mix
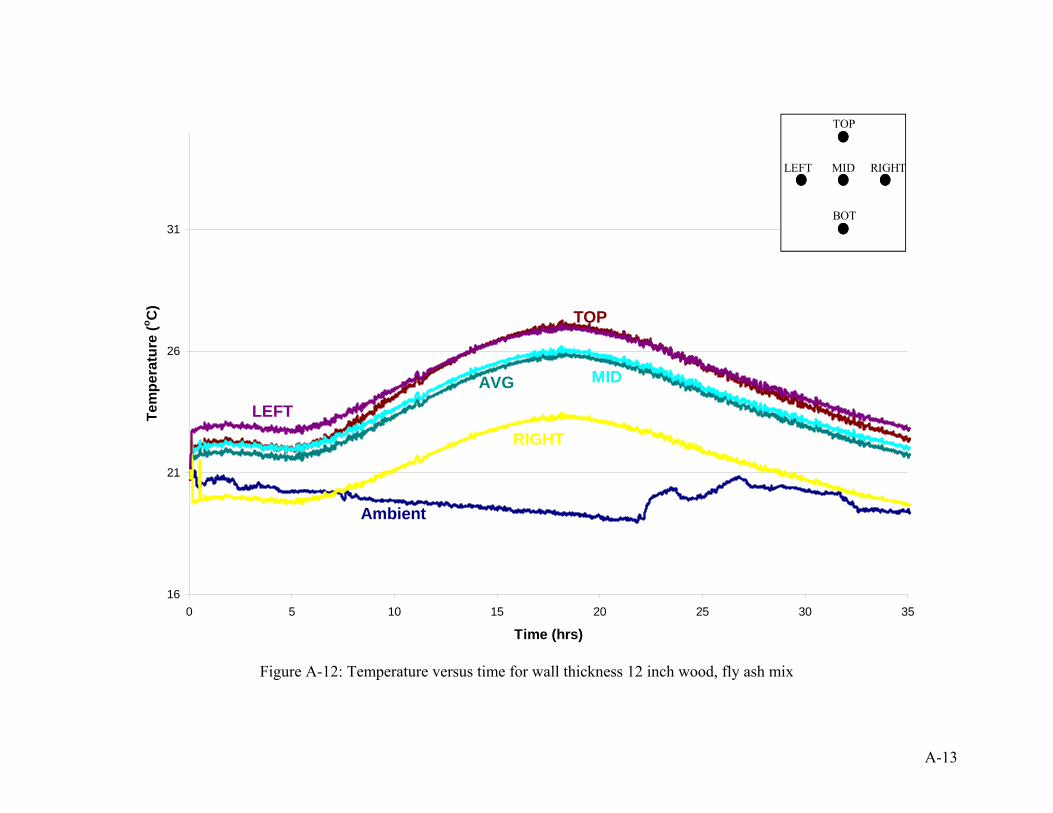
A-13
16
21
26
31
0 5 10 15 20 25 30 35
Time (hrs)
Tem
pera
ture
(o C)
TOP
LEFTRIGHT
MID
Ambient
AVG
TOP
BOT
LEFT RIGHTMID
Figure A-12: Temperature versus time for wall thickness 12 inch wood, fly ash mix
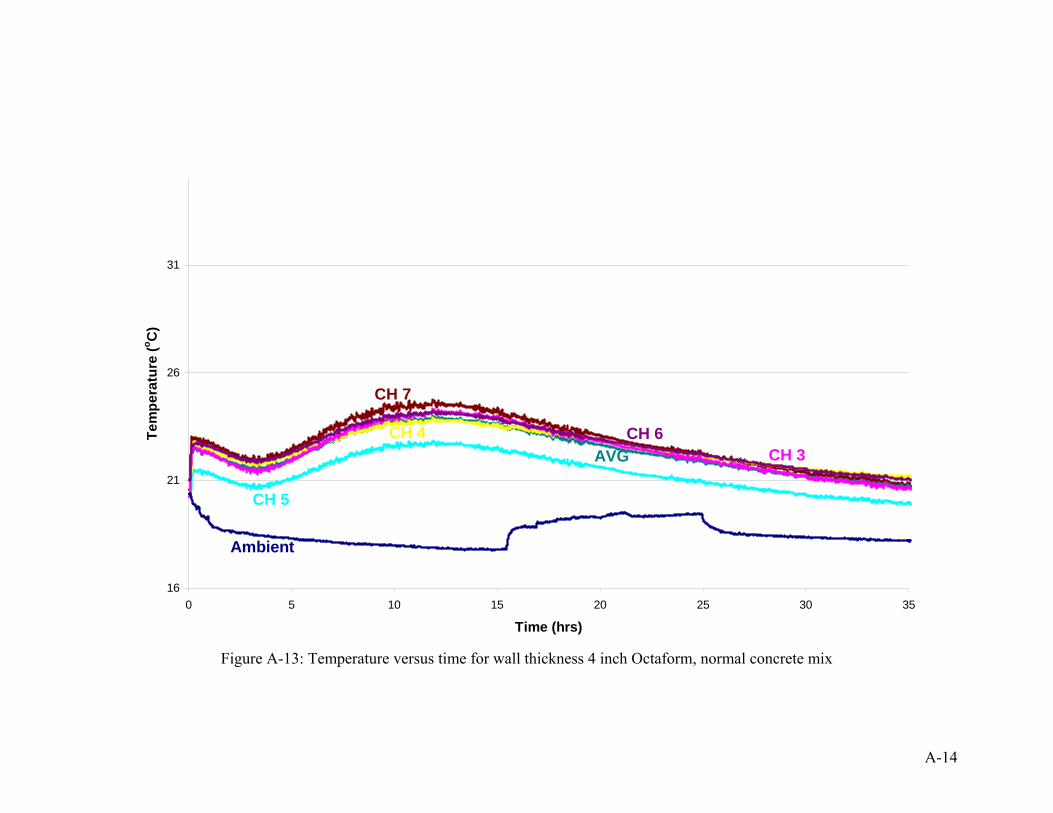
A-14
16
21
26
31
0 5 10 15 20 25 30 35
Time (hrs)
Tem
pera
ture
(o C)
CH 7
CH 6CH 4
CH 5
CH 3
Ambient
AVG
Figure A-13: Temperature versus time for wall thickness 4 inch Octaform, normal concrete mix
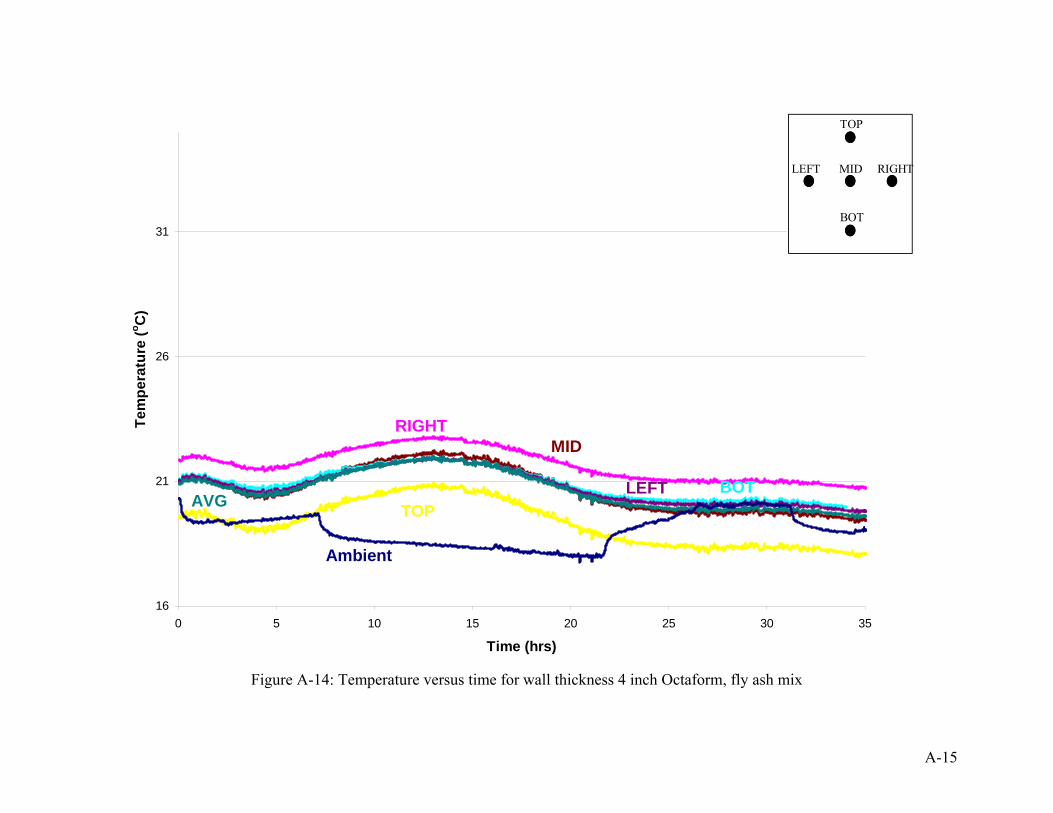
A-15
16
21
26
31
0 5 10 15 20 25 30 35
Time (hrs)
Tem
pera
ture
(o C)
MID
LEFTTOP
BOT
RIGHT
Ambient
AVG
TOP
BOT
LEFT RIGHTMID
Figure A-14: Temperature versus time for wall thickness 4 inch Octaform, fly ash mix
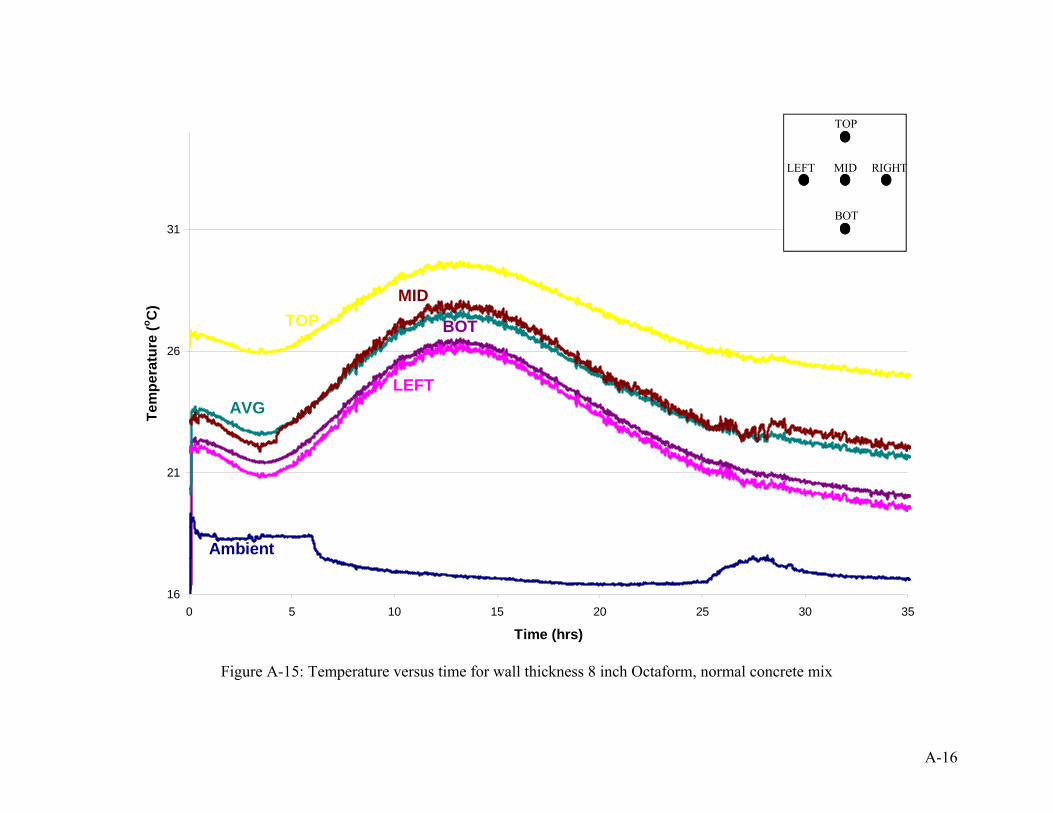
A-16
16
21
26
31
0 5 10 15 20 25 30 35
Time (hrs)
Tem
pera
ture
(o C)
Ambient
LEFT
TOP BOT
MID
AVG
TOP
BOT
LEFT RIGHTMID
Figure A-15: Temperature versus time for wall thickness 8 inch Octaform, normal concrete mix
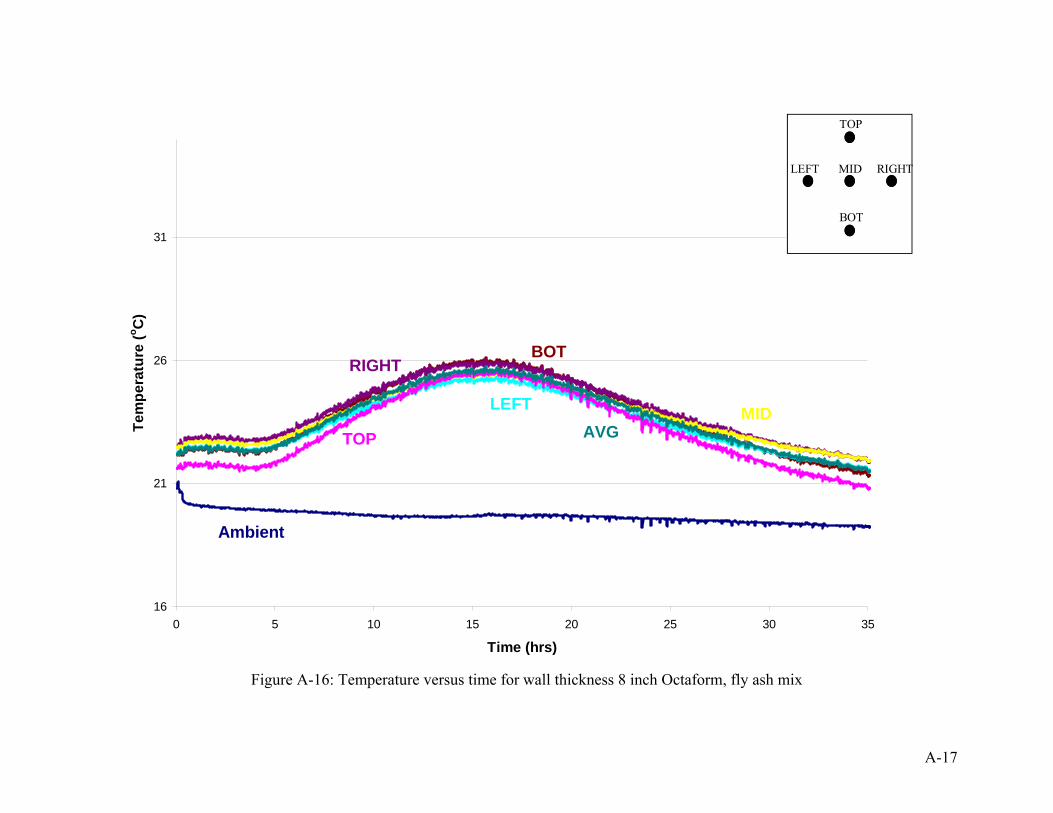
A-17
16
21
26
31
0 5 10 15 20 25 30 35
Time (hrs)
Tem
pera
ture
(o C)
Ambient
MIDLEFT
TOP
BOTRIGHT
AVG
TOP
BOT
LEFT RIGHTMID
Figure A-16: Temperature versus time for wall thickness 8 inch Octaform, fly ash mix
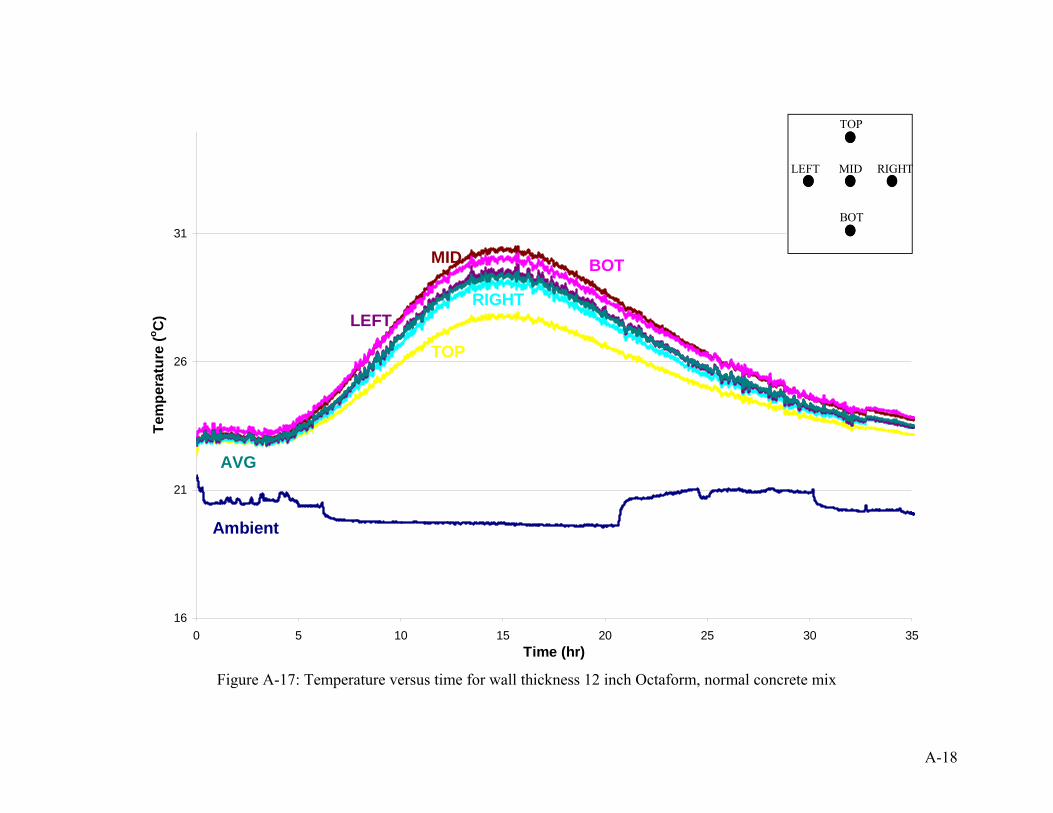
A-18
16
21
26
31
0 5 10 15 20 25 30 35Time (hr)
Tem
pera
ture
(o C)
Ambient
TOP
RIGHT
BOTMID
LEFT
AVG
TOP
BOT
LEFT RIGHTMID
Figure A-17: Temperature versus time for wall thickness 12 inch Octaform, normal concrete mix
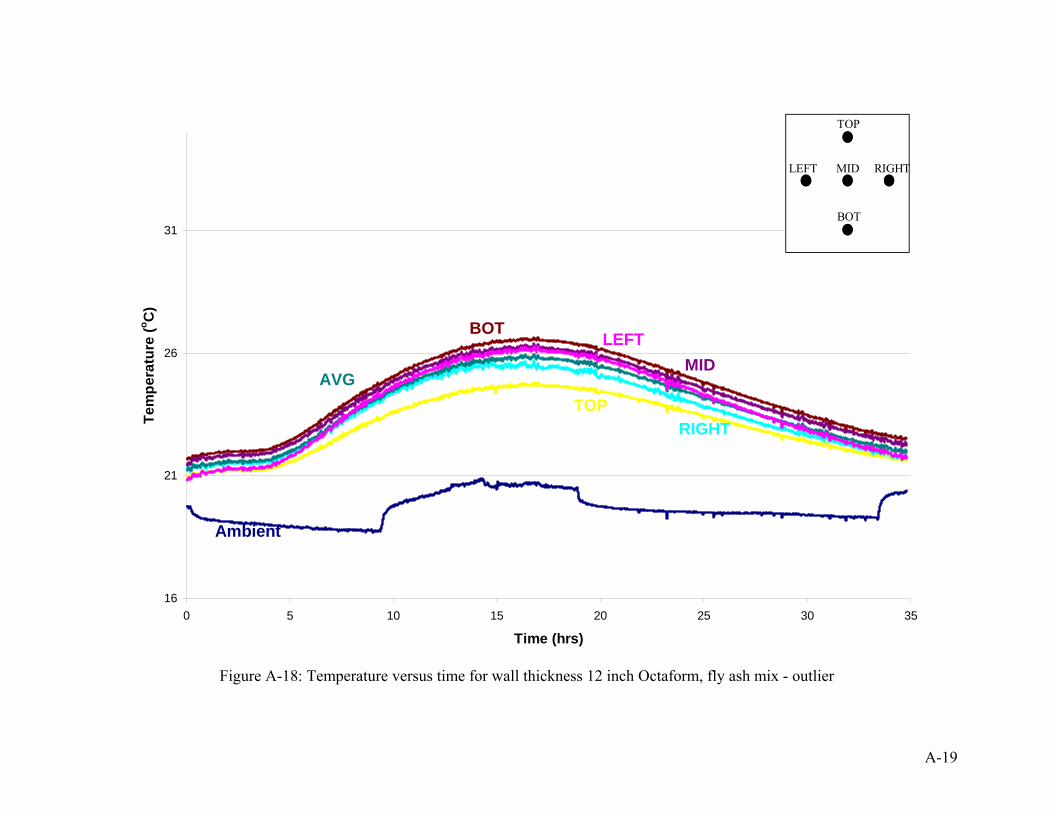
A-19
16
21
26
31
0 5 10 15 20 25 30 35
Time (hrs)
Tem
pera
ture
(o C)
Ambient
TOPRIGHT
LEFTBOT
MIDAVG
TOP
BOT
LEFT RIGHTMID
Figure A-18: Temperature versus time for wall thickness 12 inch Octaform, fly ash mix - outlier
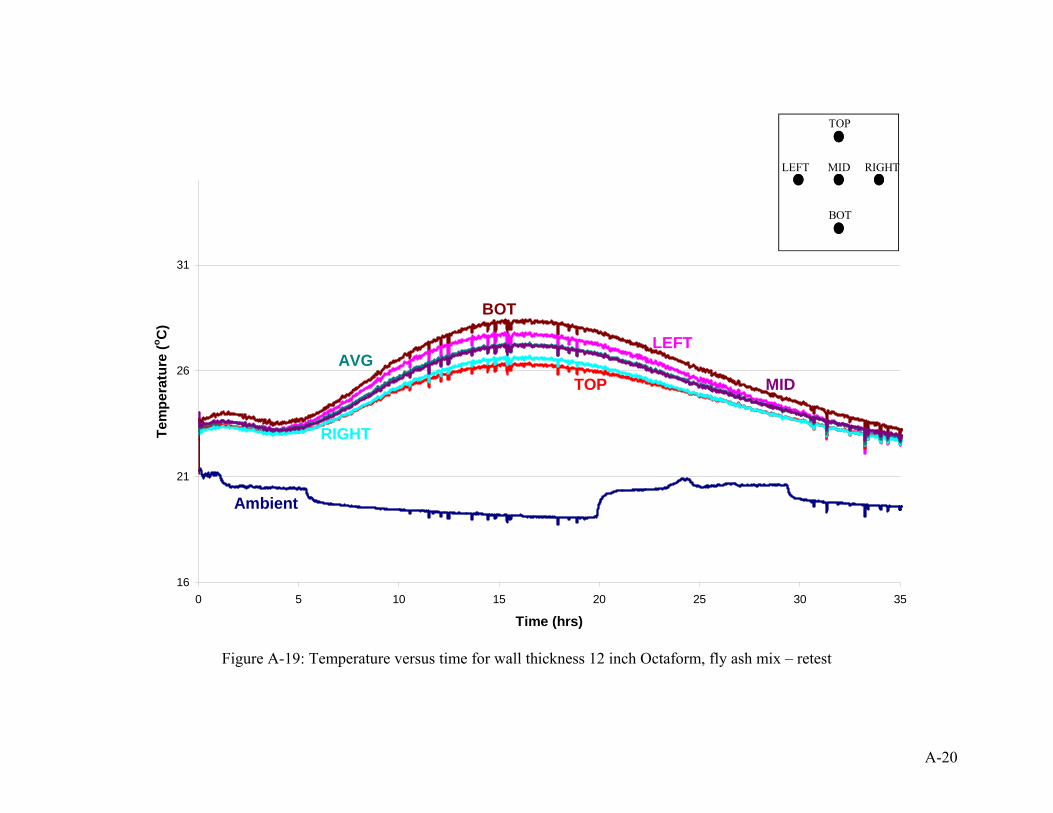
A-20
16
21
26
31
0 5 10 15 20 25 30 35
Time (hrs)
Tem
pera
ture
(o C)
TOP
BOT
LEFT RIGHTMID
Ambient
TOP
RIGHT
LEFT
BOT
MIDAVG
Figure A-19: Temperature versus time for wall thickness 12 inch Octaform, fly ash mix – retest
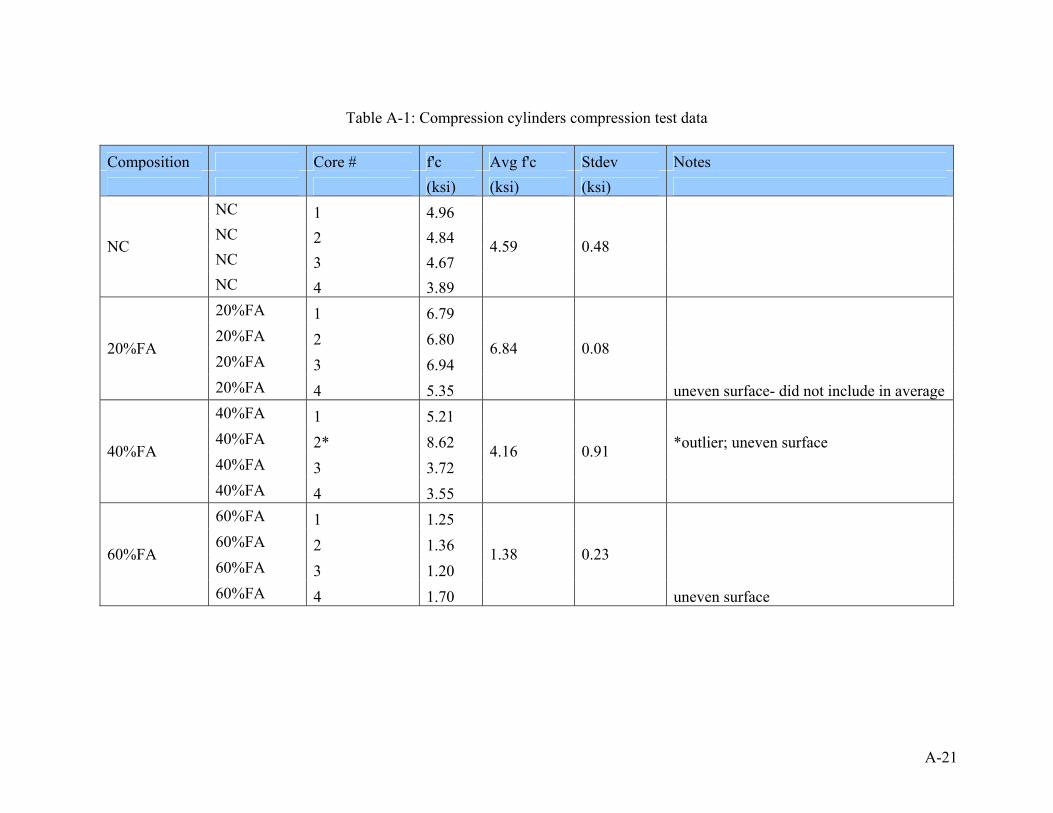
A-21
Table A-1: Compression cylinders compression test data
Composition Core # f'c Avg f'c Stdev Notes (ksi) (ksi) (ksi)
NC 1 4.96 NC 2 4.84 NC 3 4.67
NC
NC 4 3.89
4.59 0.48
20%FA 1 6.79 20%FA 2 6.80 20%FA 3 6.94
20%FA
20%FA 4 5.35
6.84 0.08
uneven surface- did not include in average 40%FA 1 5.21 40%FA 2* 8.62 *outlier; uneven surface 40%FA 3 3.72
40%FA
40%FA 4 3.55
4.16 0.91
60%FA 1 1.25 60%FA 2 1.36 60%FA 3 1.20
60%FA
60%FA 4 1.70
1.38 0.23
uneven surface
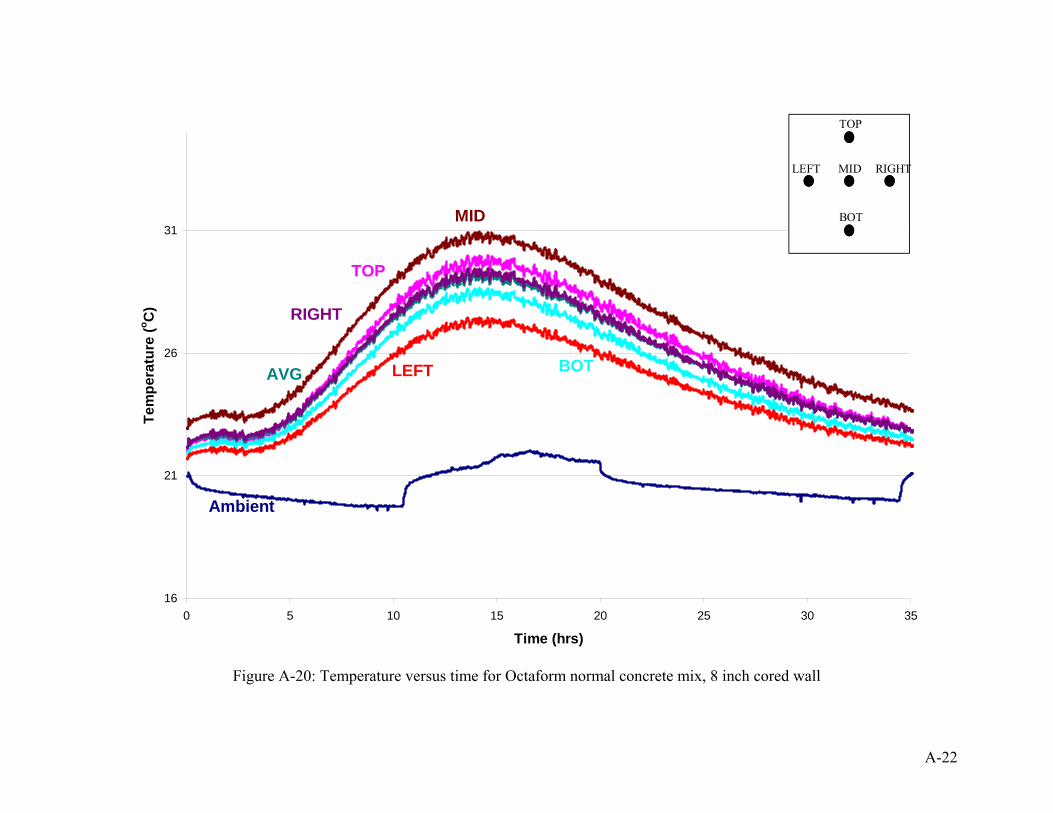
A-22
16
21
26
31
0 5 10 15 20 25 30 35
Time (hrs)
Tem
pera
ture
(o C)
TOP
BOT
LEFT RIGHTMID
Ambient
LEFT BOT
TOP
MID
RIGHT
AVG
Figure A-20: Temperature versus time for Octaform normal concrete mix, 8 inch cored wall
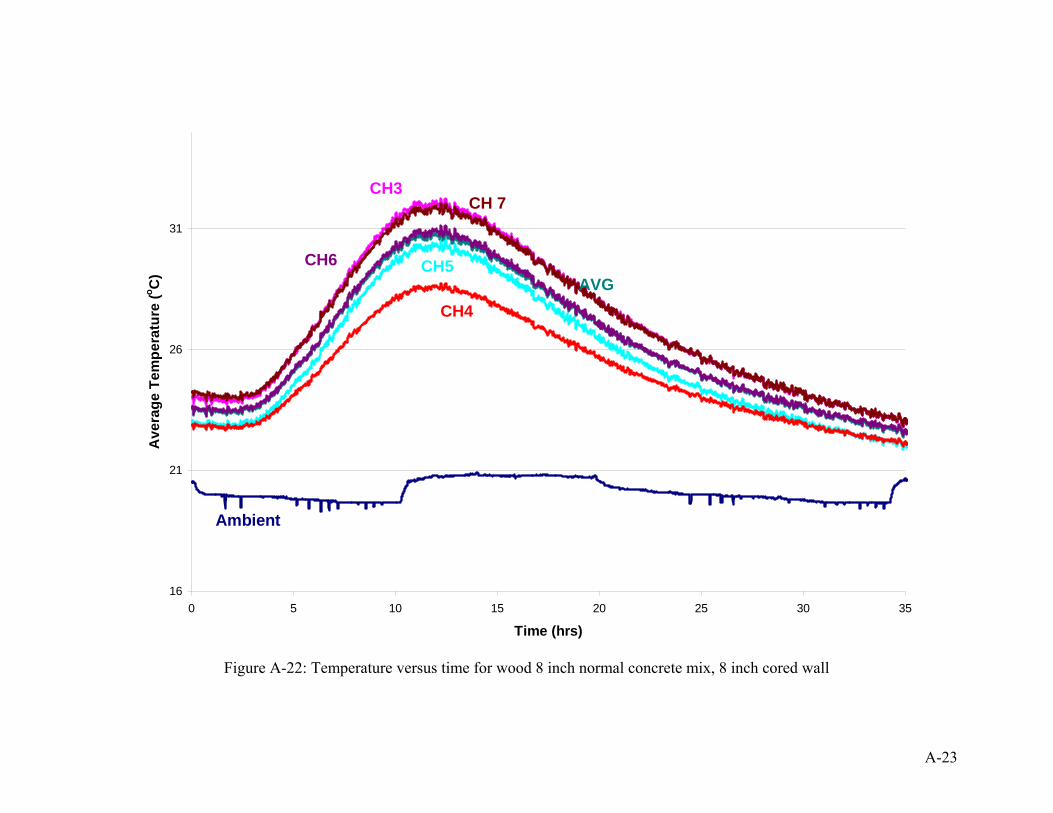
A-23
16
21
26
31
0 5 10 15 20 25 30 35
Time (hrs)
Ave
rage
Tem
pera
ture
(o C)
Ambient
CH5
CH3CH 7
CH6AVG
CH4
Figure A-22: Temperature versus time for wood 8 inch normal concrete mix, 8 inch cored wall
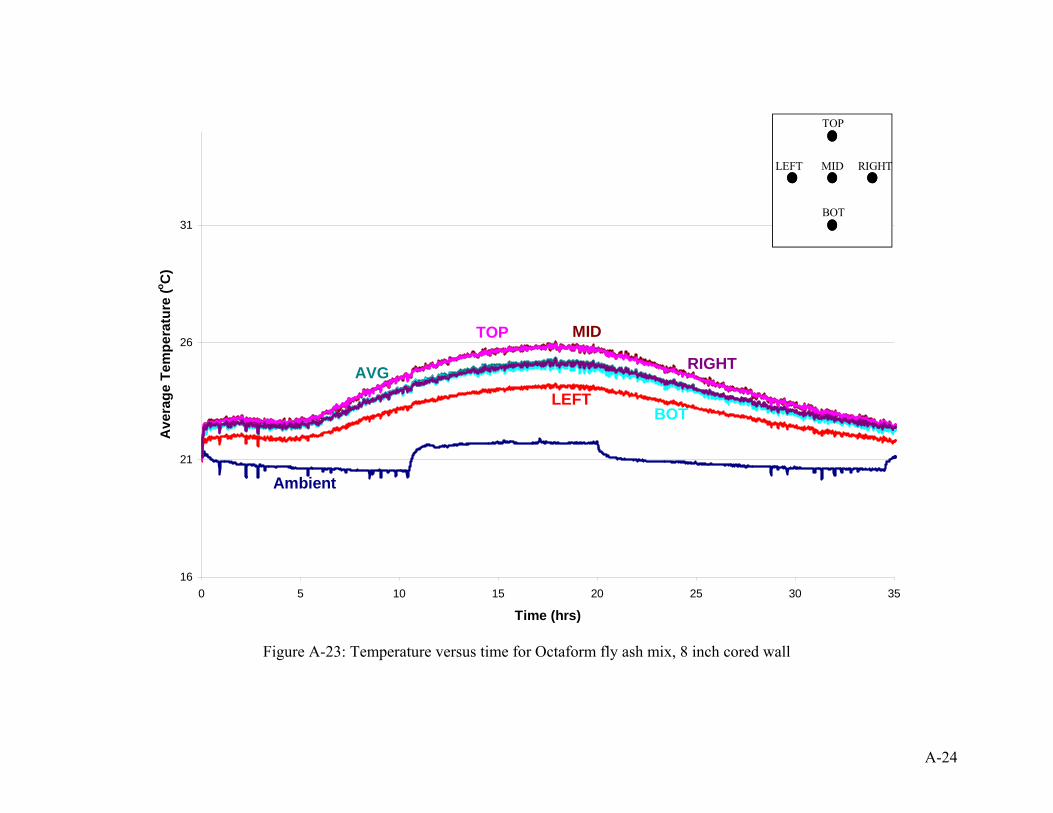
A-24
16
21
26
31
0 5 10 15 20 25 30 35
Time (hrs)
Ave
rage
Tem
pera
ture
(o C)
TOP
BOT
LEFT RIGHTMID
Ambient
LEFTBOT
TOP MID
RIGHTAVG
Figure A-23: Temperature versus time for Octaform fly ash mix, 8 inch cored wall
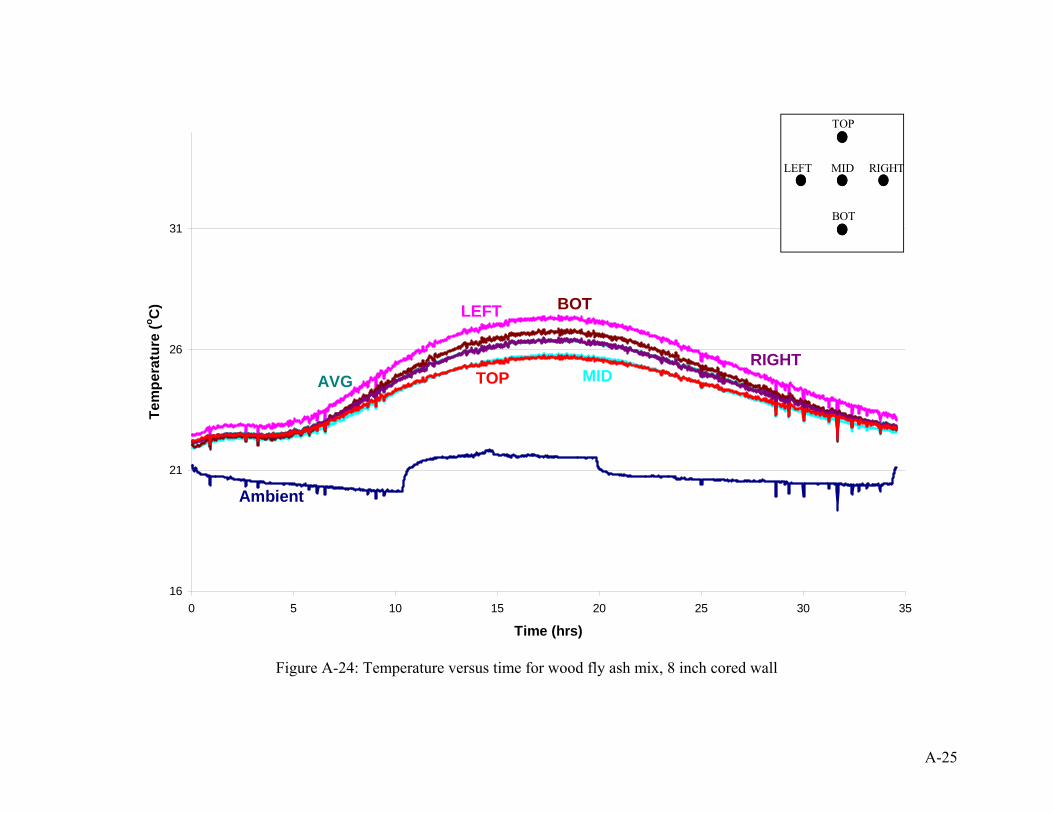
A-25
16
21
26
31
0 5 10 15 20 25 30 35
Time (hrs)
Tem
pera
ture
(o C)
Ambient
TOP MID
LEFT BOT
RIGHTAVG
TOP
BOT
LEFT RIGHTMID
Figure A-24: Temperature versus time for wood fly ash mix, 8 inch cored wall
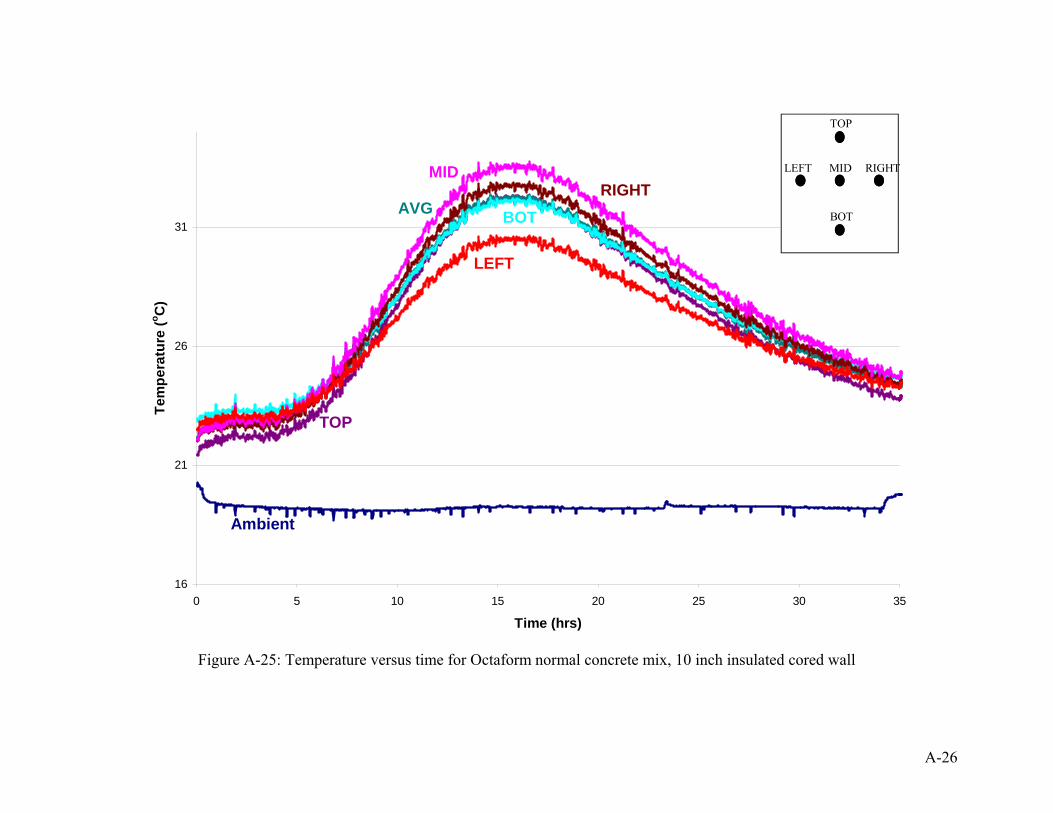
A-26
16
21
26
31
0 5 10 15 20 25 30 35
Time (hrs)
Tem
pera
ture
(o C)
TOP
BOT
LEFT RIGHTMID
Ambient
TOP
BOT
LEFT
MIDRIGHT
AVG
Figure A-25: Temperature versus time for Octaform normal concrete mix, 10 inch insulated cored wall
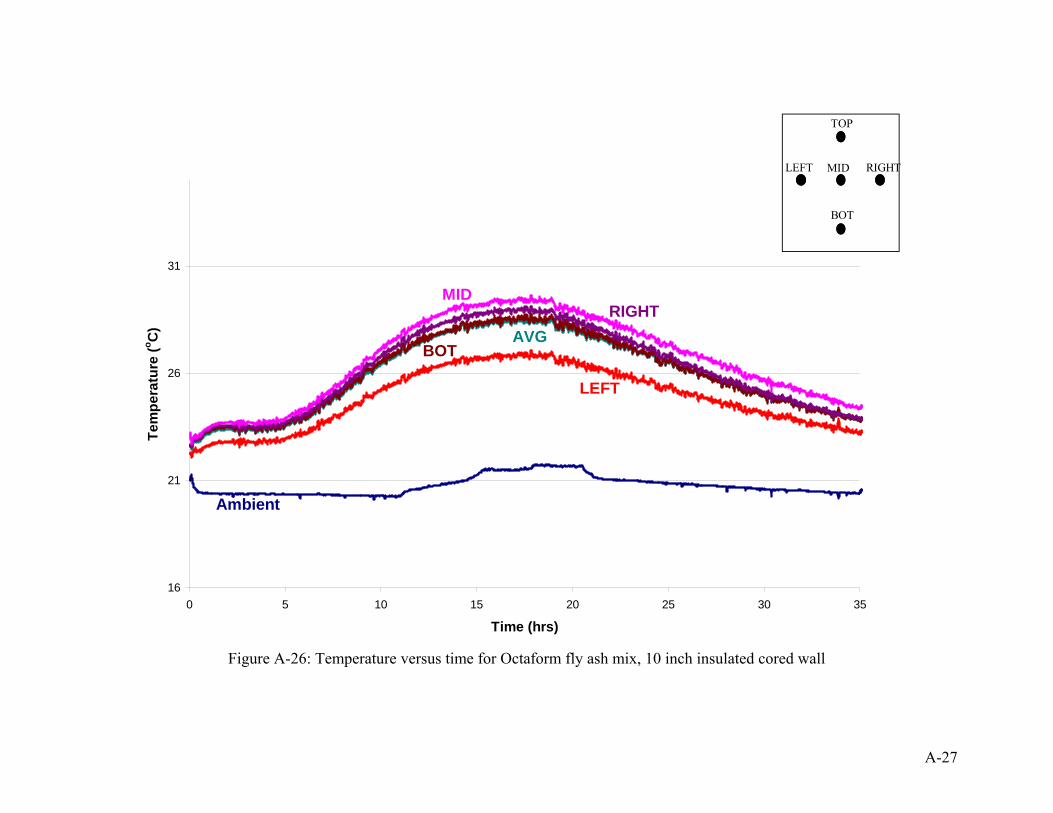
A-27
16
21
26
31
0 5 10 15 20 25 30 35
Time (hrs)
Tem
pera
ture
(o C)
Ambient
LEFT
MID
BOT
RIGHTAVG
TOP
BOT
LEFT RIGHTMID
Figure A-26: Temperature versus time for Octaform fly ash mix, 10 inch insulated cored wall
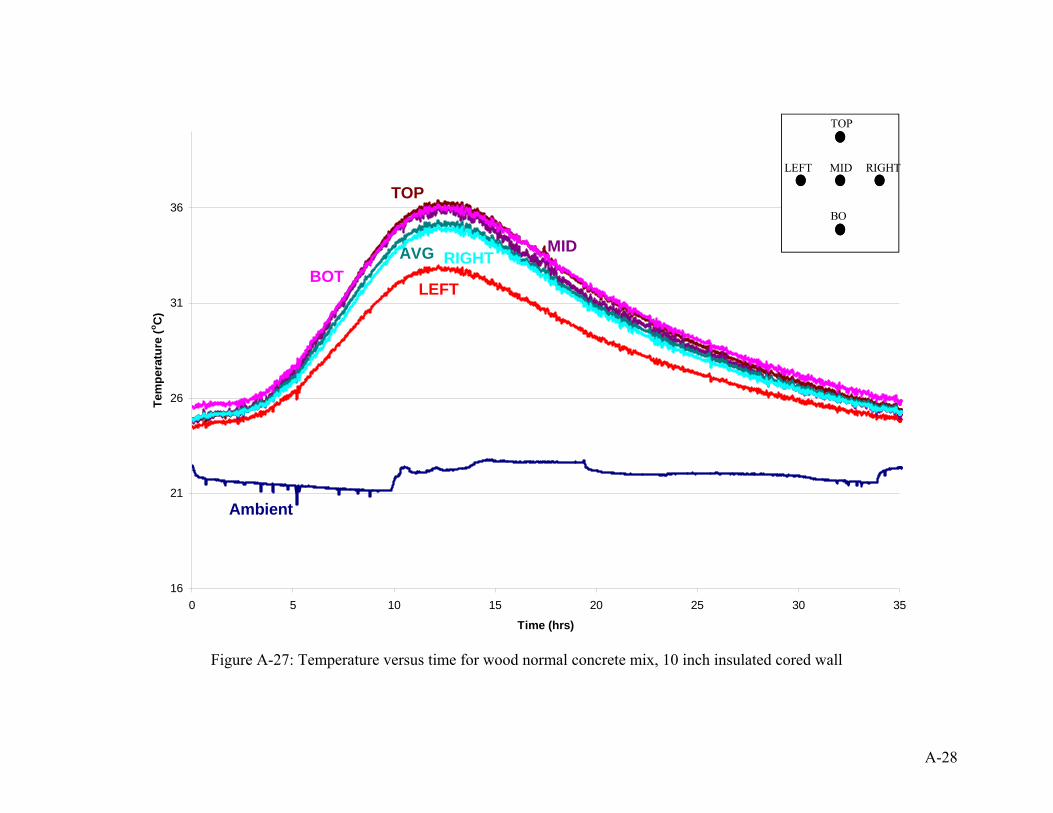
A-28
16
21
26
31
36
0 5 10 15 20 25 30 35
Time (hrs)
Tem
pera
ture
(o C)
Ambient
MIDRIGHT
LEFTBOT
TOP
AVG
TOP
BO
LEFT RIGHTMID
Figure A-27: Temperature versus time for wood normal concrete mix, 10 inch insulated cored wall
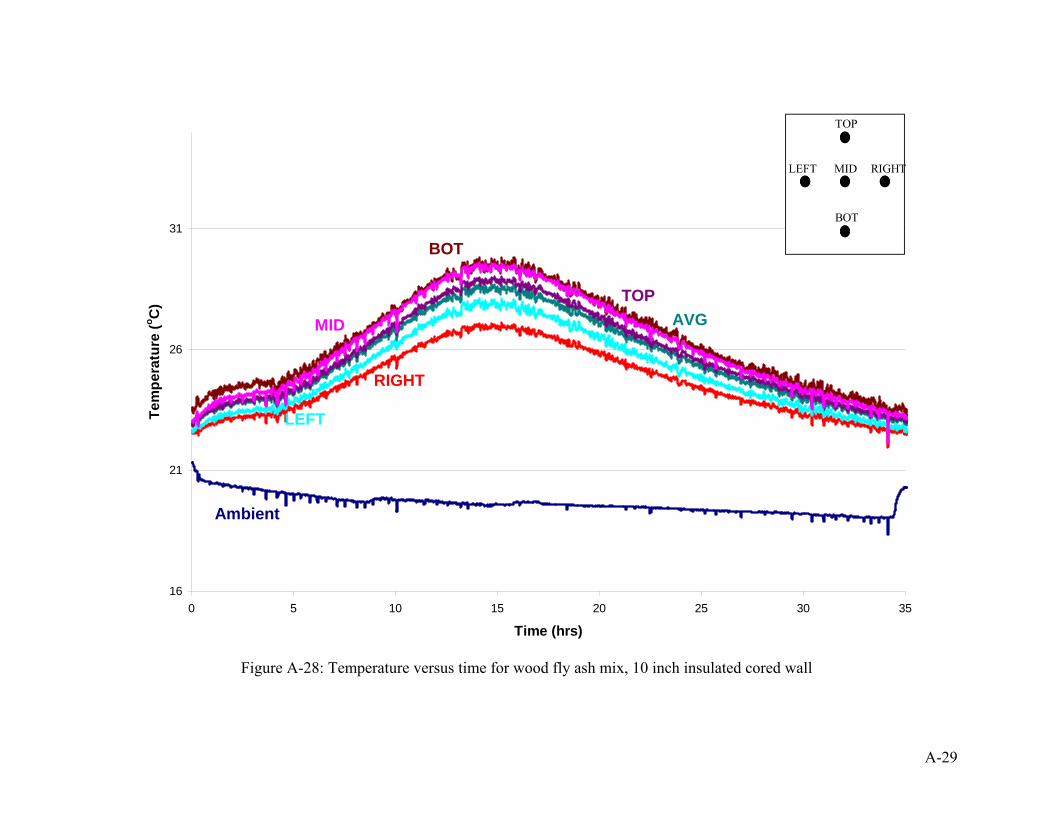
A-29
16
21
26
31
0 5 10 15 20 25 30 35
Time (hrs)
Tem
pera
ture
(o C)
Ambient
TOP
LEFT
RIGHT
MID
BOT
AVG
TOP
BOT
LEFT RIGHTMID
Figure A-28: Temperature versus time for wood fly ash mix, 10 inch insulated cored wall

B-1
Appendix B – Sample Calculations
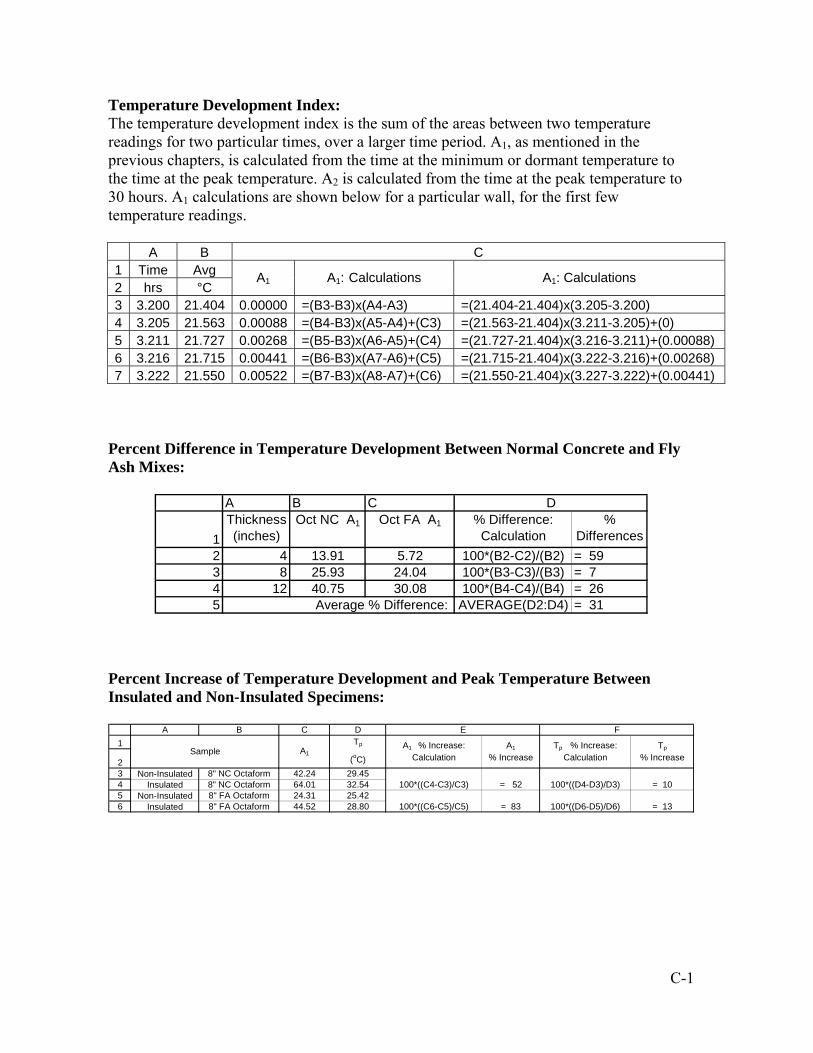
C-1
Temperature Development Index: The temperature development index is the sum of the areas between two temperature readings for two particular times, over a larger time period. A1, as mentioned in the previous chapters, is calculated from the time at the minimum or dormant temperature to the time at the peak temperature. A2 is calculated from the time at the peak temperature to 30 hours. A1 calculations are shown below for a particular wall, for the first few temperature readings.
A B C 1 Time Avg 2 hrs °C
A1 A1: Calculations A1: Calculations 3 3.200 21.404 0.00000 =(B3-B3)x(A4-A3) =(21.404-21.404)x(3.205-3.200) 4 3.205 21.563 0.00088 =(B4-B3)x(A5-A4)+(C3) =(21.563-21.404)x(3.211-3.205)+(0) 5 3.211 21.727 0.00268 =(B5-B3)x(A6-A5)+(C4) =(21.727-21.404)x(3.216-3.211)+(0.00088) 6 3.216 21.715 0.00441 =(B6-B3)x(A7-A6)+(C5) =(21.715-21.404)x(3.222-3.216)+(0.00268) 7 3.222 21.550 0.00522 =(B7-B3)x(A8-A7)+(C6) =(21.550-21.404)x(3.227-3.222)+(0.00441)
Percent Difference in Temperature Development Between Normal Concrete and Fly Ash Mixes:
A B C
1Thickness (inches)
Oct NC A1 Oct FA A1 % Difference: Calculation
% Differences
2 4 13.91 5.72 100*(B2-C2)/(B2) = 593 8 25.93 24.04 100*(B3-C3)/(B3) = 74 12 40.75 30.08 100*(B4-C4)/(B4) = 265 Average % Difference: AVERAGE(D2:D4) = 31
D
Percent Increase of Temperature Development and Peak Temperature Between Insulated and Non-Insulated Specimens:
A B C D1 Tp
2 (oC)3 Non-Insulated 8" NC Octaform 42.24 29.454 Insulated 8" NC Octaform 64.01 32.545 Non-Insulated 8" FA Octaform 24.31 25.426 Insulated 8" FA Octaform 44.52 28.80
= 10
100*((D6-D5)/D6) = 13
E F
= 52
= 83
Tp % Increase: Calculation
100*((D4-D3)/D3)
Tp
% IncreaseSample
A1 % Increase: Calculation
A1
% Increase
100*((C4-C3)/C3)
100*((C6-C5)/C5)
A1

C-2
Appendix C – Request For Proposal
C-2
SCIENCE AND ENGINEERING PROJECT CENTER MASTER PROJECT AGREEMENT EXHIBIT A: COMMITMENT AND SCOPE OF PROJECT AGREEMENT This Agreement is entered into by and between Seattle University, a Washington nonprofit corporation ( inchSU inch), and the undersigned ( inchSponsor inch). 1. Scope of Project. SU and Sponsor agree that the following Project will be jointly supervised by an SU faculty member and the Sponsor Liaison. Sponsor Name: Octaform Systems Inc. Sponsor Address: Suite 520, 885 Dunsmuir Street, Vancouver, BC Canada V6C 1N5 Sponsor Liaison: Rishi Gupta (Director of Research)/Dave Richardson (President) Project Title: Effect of Octaform’s forming system on properties of concrete Project Description: The study of the following properties of concrete when using an Octaform cell are proposed:
• Heat of hydration: Development of heat of hydration when using high volume fly ash (self consolidating concrete) in an insulated Octaform Cell will be investigated. The heat loss or temperature gradients across the Octaform cell will also be studied.
• Structural Properties: Response of reinforced and un-reinforced Octaform specimens subjected to in-plane bending will be studied. Some compressive strength tests will also be performed.
• Other: Effect of self compacting concrete on formwork pressure, Effect of Octaform in reducing permeability of concrete
Project Term: From October 2006 to June 2007. Hardware/Software Requirements: Testing equipment in the structures and/or concrete lab. Some additional equipment and data acquisition system will be required. Recommended Student Skills: Past experience with concrete design, casting, and testing will be an asset. Required Student Skills: Octaform is looking for highly motivated and dedicated students who could take on the project and complete the planned project under little or no supervision. 2. Commitment
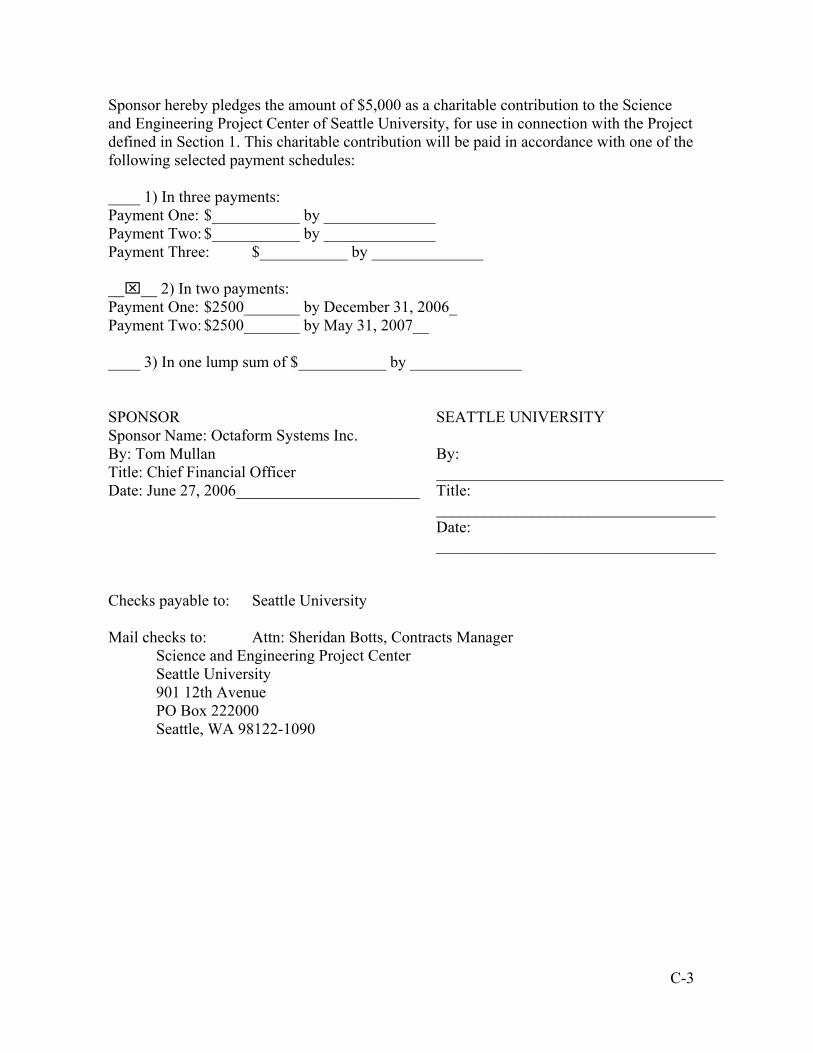
C-3
Sponsor hereby pledges the amount of $5,000 as a charitable contribution to the Science and Engineering Project Center of Seattle University, for use in connection with the Project defined in Section 1. This charitable contribution will be paid in accordance with one of the following selected payment schedules: ____ 1) In three payments: Payment One: $___________ by ______________ Payment Two: $___________ by ______________ Payment Three: $___________ by ______________ __⌧__ 2) In two payments: Payment One: $2500_______ by December 31, 2006_ Payment Two: $2500_______ by May 31, 2007__ ____ 3) In one lump sum of $___________ by ______________ SPONSOR Sponsor Name: Octaform Systems Inc. By: Tom Mullan Title: Chief Financial Officer Date: June 27, 2006_______________________
SEATTLE UNIVERSITY By: ____________________________________ Title: ___________________________________ Date: ___________________________________
Checks payable to: Seattle University Mail checks to: Attn: Sheridan Botts, Contracts Manager Science and Engineering Project Center Seattle University 901 12th Avenue PO Box 222000 Seattle, WA 98122-1090
C-4
Memorandum Date: November 21, 2006 To: Rishi Gupta, Octaform Systems Inc. cc: Dr. Katherine Kuder, Seattle University Faculty Advisor From: Seattle University Design Team CEE 07.3 Subject: Project Scope Dear Mr. Gupta: As per our discussion, team CEE 07.3 would like to clarify our scope of work. Regarding our schedule and testing program, our team has limited the scope of work to determine the effect of the Octaform PVC formwork system on the hydration process of concrete. The team will be comparing the Octaform forming system to wood forming systems. The team will introduce wall thickness and high volume fly ash content as testing variables. If time allows, the team will also investigate insulation inclusion and stripping time, examining how these variables affect the hydration process. Thank you for your correspondence over this proposal period. We look forward to working with you.

D-1
Appendix D – Resumes
Kristian Lowrie
David Sommer
Nikki Wheeler
D-2
Kristian Lowrie 1311 East Marion Street, Seattle, WA, 98122
[email protected] (425) 802-6644
SUMMARY OF QUALIFICATIONS • Project Management experience. • Materials testing experience. EDUCATION Seattle University, Seattle, WA Sept. 05—PresentBachelor of Science in Civil Engineering • Advanced classes include Structural Mechanics, Strength of Materials, Foundation Design • American Society of Civil Engineers (ASCE) – Seattle University student section – Treasurer
University of Washington, Seattle, WA Sept. 2001—June 2005Pursued Bachelor of Science in Civil Engineering • Completed Civil Engineering prerequisites • Completed Construction Management prerequisites. WORK EXPERIENCE Opus NW Contractors, LLC, BELLEVUE, WA March, 2005—presentAssistant Project Manager • Perform material take-offs to better estimate associated costs for construction. • Request proposals and choose subcontractors after critical review and comparison of bids. • Write specific scope of work to be included in subcontracts for each subcontractor. • Hold coordination meetings with engineer, architect, and subcontractors during design phase of project.• Review submittals from various subcontractors to confirm dimensions and installation procedure. • Manage budget, schedule and installation of products. Associated Earth Sciences, Inc, KIRKLAND, WA March, 2004—March, 2005Construction Monitor, Lab Technician • Monitored construction activities and their adherence to engineering requirements including backfill
compaction, tieback installation and pile driving. • Performed soils testing for clients including proctors and sieves. COMPUTER SKILLS • Proficient in Microsoft Office software: Excel, Word, Powerpoint • Experience with Solidworks (CAD), and Suretrak (scheduling)
D-3
David Sommer 1311 E Marion St, Seattle, WA 98122
[email protected] (425) 890-5536
SUMMARY OF QUALIFICATIONS • Currently working as a Structural Engineer designing with wood, steel, concrete and masonry • Experience in structural analysis, mechanics of materials, public relations EDUCATION Seattle University, Seattle, WA April 04—PresentWorking Towards a Bachelor of Science in Civil Engineering • Courses include Strengths of Materials, Structural Analysis, Concrete Design, Chemistry and others • Served as Vice President for Engineers Without Borders • Current Vice President of Tau Beta Pi, Engineering honor society • GPA of 4.0 • Bannan Scholar • Currently on both President’s List and Dean’s List
Bellevue Community College, Bellevue, WA Sept. 01—March 04Associate of Science in Engineering • On both the President’s List and Dean’s List • GPA of 4.0 in all Engineering courses WORK EXPERIENCE Dibble Engineers Incorporated, Kirkland, WA May 06—PresentProject Engineer • Provided structural engineering consulting to architects, property owners, and other engineering firms • Performed gravity, wind, and seismic analysis on wide variety of structures • Designed structural systems and connections using wood, steel, concrete and masonry • Evaluated on-site conditions for structural capacity and recommended remediation options • Acted as project manager for Microsoft office relocation, 20th Avenue residence 2-story addition,
Kirkland residence 3-story addition, as well as many structural forensics projects • Secured new clientele, potentially earning the company $12,000 City of Kirkland, Kirkland, WA June 05—Sept. 05Public Works Intern • Organized and performed inspections for private storm water systems • Set up system to comprehensively complete a city database, ensuring complete and accurate data in the
future • Organized daily work schedule to make the most efficient use of company time COMPUTER SKILLS • Proficiency in Excel, Microsoft Word, Enercalc, RISA, some experience with Microsoft Access

D-4
Nikki Wheeler 212 16th Ave, Seattle, WA, 98122
[email protected] (206) 325-3486
SUMMARY OF QUALIFICATIONS • Data collection, analysis and presentation skills • Technical writing abilities • Organization and communication skills EDUCATION Seattle University, Seattle, WA September, 2003—PresentBachelor of Science in Civil Engineering, Minor in Mathematics • Upper level engineering courses including Strength of Materials I and II, Structural Design I and II and
Senior Design I, II and III • Upper level engineering lab courses such as Engineering Measurements, Fluid Mechanics, Chemistry
and Strength of Materials I and II WORK EXPERIENCE DKS Associates: Transportation Solutions, Seattle, WA March, 2005—PresentTransportation Engineering Intern • Work with transportation engineers and planners on current and future transportation projects • Collect various traffic, pedestrian and lane geometric data to be used in performing traffic studies • Present and organize traffic data using Microsoft Excel spreadsheets • Compile information and assist in the writing process for several reports • Prepare visual aids and graphics that are used to clearly present information to clients during meetings Sound Transit, Seattle, WA June, 2005—May 2006Construction Field Office Intern • Acquired fundamental knowledge of construction management and Seattle’s Link Light Rail Project • Developed professional communication skills with coworkers as well as with the contractor • Observed progress in the downtown tunneling project • Performed volume calculations of excavated material • Worked closely with inspectors by assisting in field walks, inspections and monitoring progress • Researched materials for basic cost estimates • Attended meetings with the contractor, sub-contractors and consultants COMPUTER SKILLS • Proficient in Microsoft office programs, including Word, Excel, PowerPoint and Publisher as a means
to present information and data