EFFECT OF PUBLIC-PRIVATE PARTNERSHIP ON EFFICIENCY OF ... · Sales: This comprises revenue from...
81
EFFECTS OF PUBLIC-PRIVATE PARTNERSHIP ON EFFICIENCY OF HEALTH SERVICES DELIVERY IN UGANDA: A CASE STUDY OF KAGANDO HOSPITAL IN KASESE DISTRICT MUGISA MASEREKA GODFREY 2006/HD06/5479U B.A (ECONOMICS) MUK A DISSERTATION SUBMITTED TO THE SCHOOL OF GRADUATE STUDIES IN PARTIAL FULFILLMENT OF THE REQUIREMENTS FOR THE AWARD OF THE DEGREE OF MASTER OF ARTS IN ECONOMIC POLICY AND PLANNING OF MAKERERE UNIVERSITY November 2009
Transcript of EFFECT OF PUBLIC-PRIVATE PARTNERSHIP ON EFFICIENCY OF ... · Sales: This comprises revenue from...

EFFECTS OF PUBLIC-PRIVATE PARTNERSHIP ON EFFICIENCY OF
HEALTH SERVICES DELIVERY IN UGANDA: A CASE STUDY OF
KAGANDO HOSPITAL IN KASESE DISTRICT
MUGISA MASEREKA GODFREY
2006/HD06/5479U
B.A (ECONOMICS) MUK
A DISSERTATION SUBMITTED TO THE SCHOOL OF GRADUATE STUDIES IN
PARTIAL FULFILLMENT OF THE REQUIREMENTS FOR THE AWARD OF THE
DEGREE OF MASTER OF ARTS IN ECONOMIC POLICY AND PLANNING OF
MAKERERE UNIVERSITY
November 2009

ii
DECLARATION
I do hereby declare that the work presented in this dissertation has not been presented for any
award in any institution. All work is original unless otherwise acknowledged.
Signed …………………………………………….. Date……………………….
Mugisa Masereka Godfrey
Principal Investigator

iii
APPROVAL
This dissertation has been submitted for examination with the approval of the following
supervisors.
Supervisors
Signed…………………………………………… Date…………………………
Dr. Fred Matovu
Faculty of Economics and Management
Makerere University
Signed …………………………………………..… Date…………………………
Dr. Bruno L. Yawe
Faculty of Economics and Management
Makerere University

iv
DEDICATION
This piece of work is dedicated to my mother Julia Kahindo (Mrs) and the soul of my father Mr
(RIP) Andrew Kahindo Kalengyo for ensuring selflessness in laying the foundation for my
education. To my sons Asingya and Asimawe and my dear wife, Nelly for their endurance and
the care they missed up to completion of this course.

v
ACKNOWLEDGEMENTS
I am grateful to my supervisors; Dr. Fred Matovu and Dr. Bruno L. Yawe for their untiring
support and invaluable guidance. I thank the academic staff at the Faculty of Economics and
Management, Makerere University for their technical and administrative support and cooperation
that facilitated the completion of this work.
I am indebted to my colleagues and friends for their guidance, support and encouragement. In
particular, I thank Dr Francis Mulekya Bwambale for his technical guidance, the Kagando
hospital management team and staff for providing the information, which is contained in this
report.
I am greatly indebted to my employer, Kasese District Local Government for the financial and
moral support and encouragement throughout the training.
Lastly, I extend my appreciation to the Master of Arts in Economic Policy and Planning class for
year 2006/7 -2007/8 for their valuable contribution, support and team spirit they exhibited
throughout the course.

vi
TABLES OF CONTENTS
DECLARATION ··························································································· ii
APPROVAL ······························································································· iii
DEDICATION ······························································································iv
ACKNOWLEDGEMENTS ··············································································· v
LIST OF TABLES ·························································································ix
LIST OF FIGURES ························································································ x
LIST OF ACRONYMNS ··················································································xi
OPERATIONAL DEFINITIONS ······································································ xiii
ABSTRACT ······························································································ xiv
CHAPTER ONE: INTRODUCTION ································································· 1
1.0 BACKGROUND TO THE STUDY ······························································· 1
1.1 STATEMENT OF THE PROBLEM ······························································ 3
1.2 STUDY OBJECTIVES ············································································· 3
1.3 RESEARCH QUESTIONS ········································································ 4
1.4 SIGNIFICANCE OF THE STUDY ······························································· 4
1.5 ORGANIZATION OF THE STUDY ····························································· 5
CHAPTER TWO: LITERATURE REVIEW ······················································· 6
2.0 INTRODUCTION ···················································································· 6
2.1 PUBLIC – PRIVATE PARTNERSHIP AND HOSPITAL SERVICE DELIVERY INPUTS
············································································································· 7
2.2 PUBLIC – PRIVATE PARTNERSHIP AND HOSPITAL SERVICE DELIVERY
OUTPUTS ································································································ 9
2.3 MEASURING EFFICIENCY ····································································· 14
CHAPTER THREE: METHODOLOGY ··························································· 18
3.0 INTRODUCTION ··················································································· 18

vii
3.1 STUDY DESIGN··················································································· 18
3.2 STUDY SETTING ················································································· 18
3.3 DATA TYPES AND SOURCES ································································· 19
3.4 SAMPLE SELECTION ··········································································· 20
3.5 DATA COLLECTION ············································································ 21
3.6 MEASUREMENTS AND KEY CONCEPTS ·················································· 22
3.7 DATA MANAGEMENT AND ANALYSIS ···················································· 22
3.8 QUALITY CONTROL ············································································ 24
3.9 ETHIC CONSIDERATION ······································································· 24
CHAPTER FOUR: RESULTS ········································································ 25
4.0 PROFILE OF THE STUDY ······································································· 25
4.1 INPUTS TO HOSPITAL UNDER THE PUBLIC PRIVATE PARTNERSHIP ············· 25
4.1.1 SOURCES OF FUNDING FOR KAGANDO HOSPITAL ······························ 25
4.1.2 TRENDS IN FUNDING ····································································· 26
4.1.3 SUPPORT TO PRIMARY HEALTH CARE (PHC) ····································· 27
4.1.4 SUPPORT TO HIV/AIDS ACTIVITIES ·················································· 28
4.1.5 SUPPORT TO HUMAN RESOURCES FOR HEALTH ································ 29
4.1.6 STAFF BED RATIOS ········································································ 31
4.1.7 SUPPORT ON MEDICINES THROUGH CREDIT LINE ······························ 31
4.2 HOSPITAL SERVICE DELIVERY OUTPUTS················································ 32
4.2.1 IMMUNIZATION FOR CHILDREN 0-5 YEARS ······································· 32
4.2.2: SURGICAL OPERATIONS, NORMAL DELIVERIES AND ANC ATTENDANCE
AT KAGANDO HOSPITAL BETWEEN FY 1996/7 AND 2006/7. ·························· 33
4.2.3 OPD ATTENDANCES AND ADMISSIONS············································· 35
4.2.4 PATIENT TO DOCTOR AND NURSE RATIOS ······································ 36
4.3 STANDARD UNIT OF OUTPUT (SUO) ······················································· 37
4.3.1: STANDARD UNIT OF OUTPUT PER STAFF········································· 39
4.3.2: RELATIONSHIP BETWEEN SUO PER STAFF & DOCTOR: NURSE RATIO ··· 40
4.3.3 TOTAL COST PER UNIT OF OUTPUT (SUO) ········································· 41
viii
4.3.4 RELATIONSHIP BETWEEN TOTAL COST PER SUO AND GOVERNMENT
CONTRIBUTION FOR KAGANDO HOSPITAL – FY 1996/7-2006/7. ···················· 41
4.3.5 RELATIONSHIP BETWEEN COST OF DRUGS PER SUO AND GOVERNMENT
CONTRIBUTION FOR KAGANDO HOSPITAL FY 1996/7-2006/7 ······················· 42
4.3.6 USER FEES PER SUO······································································· 43
CHAPTER FIVE: DISCUSSION ····································································· 45
5.1 FINANCIAL AND HUMAN RESOURCE SUPPORT THROUGH PPP TO KAGANDO
HOSPITAL ······························································································ 45
5.2 HOSPITAL SERVICE DELIVERY OUTPUTS················································ 46
5.3 STANDARD UNIT OF OUTPUT································································ 49
5.4 LIMITATIONS OF THE STUDY ································································ 51
CHAPTER SIX: CONCLUSIONS AND RECOMMENDATIONS ···························· 53
6.1 CONCLUSIONS ··················································································· 53
6.2 RECOMMENDATIONS ·········································································· 54
REFERENCES ··························································································· 55
APPENDICES ···························································································· 60
APPENDIX 1: LETTER OF INTRODUCTION ···················································· 60
APPENDIX 2: CHECKLIST FOR HOSPITAL INPUTS AND OUTPUTS ····················· 61

ix
LIST OF TABLES
Table 1: Sources of Hospital inputs ........................................................................................... 19
Table 2: Sources of Hospital outputs data .................................................................................. 20
Table 3: Sources of Funding for Kagando Hospital FY 1996/97 – 2006/07 ............................... 25
Table 4: Financial support (in 000) by Joint Clinical Research Centre to Kagando hospital
between FY1998/9 and 2006/7 .................................................................................................. 28
Table 5: Staffing at Kagando hospital between FY 2002/3 and 2006/7 ...................................... 29
Table 6: Staff Seconded by Government to Kagando hospital, FY 2002/3 – 2006/7 .................. 30
Table 7: Average ratios for total staff per bed, doctor per bed and nurse per bed ratios .............. 31
Table 8: Joint Medical Stores (JMS) credit line for medicines grant to Kagando hospital, FY
2004/05 to 2007/8 ..................................................................................................................... 31
Table 9: Patient to doctor and nurse ratios ................................................................................. 36
Table 10: Total Cost per SUO for Kagando hospital FY 1996/97-2006/07 ................................ 41
x
LIST OF FIGURES
Figure 1: Trends in funding by source for Kagando Hospital 1996/97-2006/7 in billions (bn).... 26
Figure 2: Trends in government financial support to Kagando hospital under PPP ..................... 27
Figure 3: PHC support to Kagando Hospital, FY 1996/7 to 2006/7 ............................................ 28
Figure 4: Number of children immunized at Kagando hospital over the period 1996/7 to 2006/7.
................................................................................................................................................. 33
Figure 5: Trends of Surgical operations, normal deliveries and ANC attendance at Kagando
Hospital between FY 1996/7 and 2006/7. .................................................................................. 34
Figure 6: OPD attendance and Admissions at Kagando Hospital, FY 1996/7 to 2006/7. ............ 35
Figure 7: Standard Unit of Outputs for Kagando Hospital between 1996/7-2006/7 .................... 38
Figure 8: SUO per staff for Kagando Hospital 2002/3-2006/7 ................................................... 39
Figure 9: Scatter diagram showing relationship between SUO per staff and Doctor: Nurse ratio
for Kagando hospital between 2002/3 to 2006/7 ........................................................................ 40
Figure 10: Relationship between total cost per SUO and Government contribution for Kagando
Hospital – FY 1996/7-2006/7. ................................................................................................... 42
Figure 11: Relationship between cost of drugs per SUO and Government contribution for
Kagando Hospital FY 1996/7-2006/7 ........................................................................................ 43
Figure 12: Trend of variation of User fees per SUO for Kagando Hospital 1996/7- ................... 44

xi
LIST OF ACRONYMNS
ANC : Antenatal Care
bn : Billion
CG : Central Government
CSOs : Civil Society Organizations
EPI : Expanded Programme on Immunisation
HSSP : Health Sector Strategic Plan
IP : Inpatient
KARUDEC : Kagando Rural Development Centre
MDGs : Millennium Development Goals
MFPEC : Ministry of Finance Planning and Economic Development
MOH : Ministry of Health
n : Number
NFP : Not-for-profit
NGO : Non- Governmental Organisation
Op : Outpatients
OPD : Outpatient Department
PHC : Primary Health Care
PHC CG : Primary Health Care Conditional Grant
PFP : Private-for-profit
PFI : Public Finance Initiative
PNFP : Private- Not- For- Profit
PPP : Public-Private Partnership

xii
PPPH : Public-Private Partnership in Health
SUO : Standard Unit of Output
UBOS : Uganda Bureau of Statistics
UCMB : Uganda Catholic Medical Bureau
UMMB : Uganda Muslim Medical Bureau
UN : United Nations
UNDP : United Nations Development Programme
UPMB : Uganda Protestant Medical Bureau
WB : World Bank
WHO : World Health Organization
xiii
OPERATIONAL DEFINITIONS
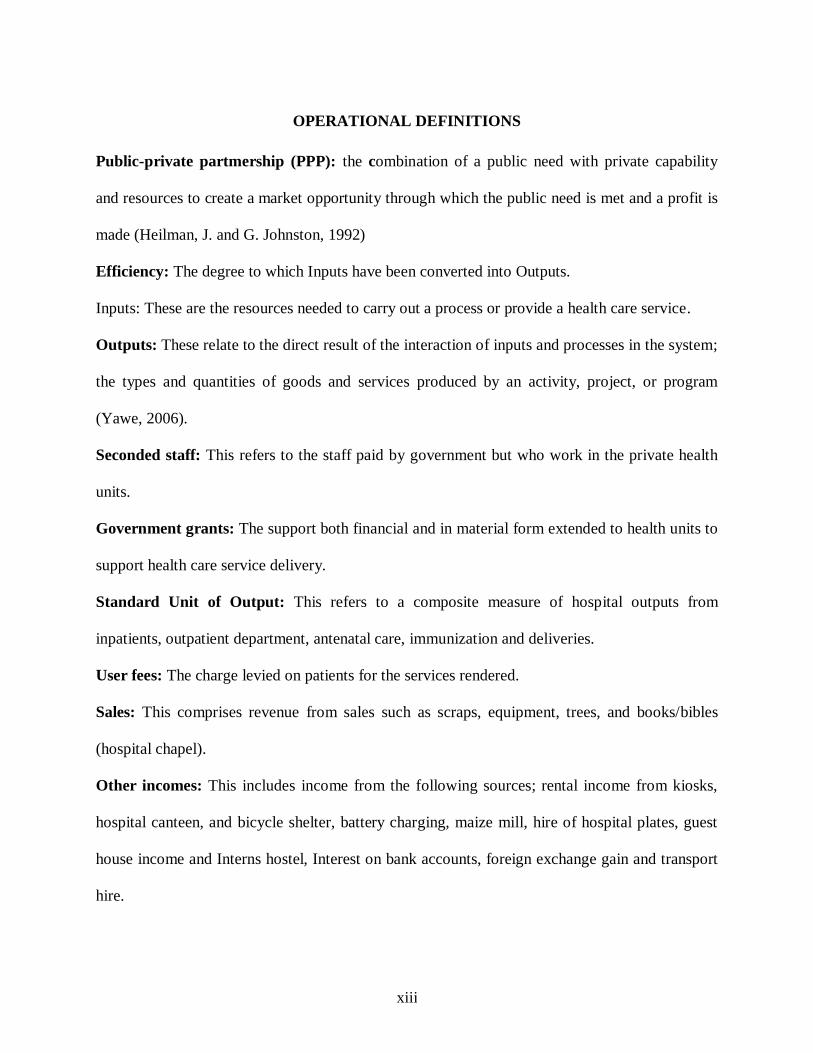
Public-private partmership (PPP): the combination of a public need with private capability
and resources to create a market opportunity through which the public need is met and a profit is
made (Heilman, J. and G. Johnston, 1992)
Efficiency: The degree to which Inputs have been converted into Outputs.
Inputs: These are the resources needed to carry out a process or provide a health care service.
Outputs: These relate to the direct result of the interaction of inputs and processes in the system;
the types and quantities of goods and services produced by an activity, project, or program
(Yawe, 2006).
Seconded staff: This refers to the staff paid by government but who work in the private health
units.
Government grants: The support both financial and in material form extended to health units to
support health care service delivery.
Standard Unit of Output: This refers to a composite measure of hospital outputs from
inpatients, outpatient department, antenatal care, immunization and deliveries.
User fees: The charge levied on patients for the services rendered.
Sales: This comprises revenue from sales such as scraps, equipment, trees, and books/bibles
(hospital chapel).
Other incomes: This includes income from the following sources; rental income from kiosks,
hospital canteen, and bicycle shelter, battery charging, maize mill, hire of hospital plates, guest
house income and Interns hostel, Interest on bank accounts, foreign exchange gain and transport
hire.

xiv
ABSTRACT
The extent to which public private partnership (PPP) strategy has enhanced efficiency in the
health service delivery at Kagando Hospital is not well understood. This study was therefore
undertaken to assess the extent to which of financial and human resources support through the
PPP affect Kagando hospital‘s delivery of healthcare service; and determine the Standard Unit of
Output for Kagando hospital and its relationship to human resource, cost of medicine, total costs
and user fees.
The study used a time series study design with quantitative and qualitative techniques. The study
used secondary data from hospital documents for the fiscal years between 1996/7 and 2006/7, a
period for the existence of PPP in Uganda. Efficiency was determined using Standard Unit of
Output (SUO) based on the health economics model developed by Giutsi (2002). Tables, charts,
ratios and correlation coefficients were used to determine relationship of government financial
and human resource support on hospital efficiency.
Results show that there was a general increase in government funding to the hospital over the
eleven year period. Seconded staff also increased over the five year period and the main staff
seconded by government to the hospital are medical doctors. Admissions, deliveries and surgical
operations show an increasing trend while Immunisations, Antenatal Care (ANC) and Outpatient
Department (OPD) attendances reveal a declining trend. Some outputs increased due to increase
xv
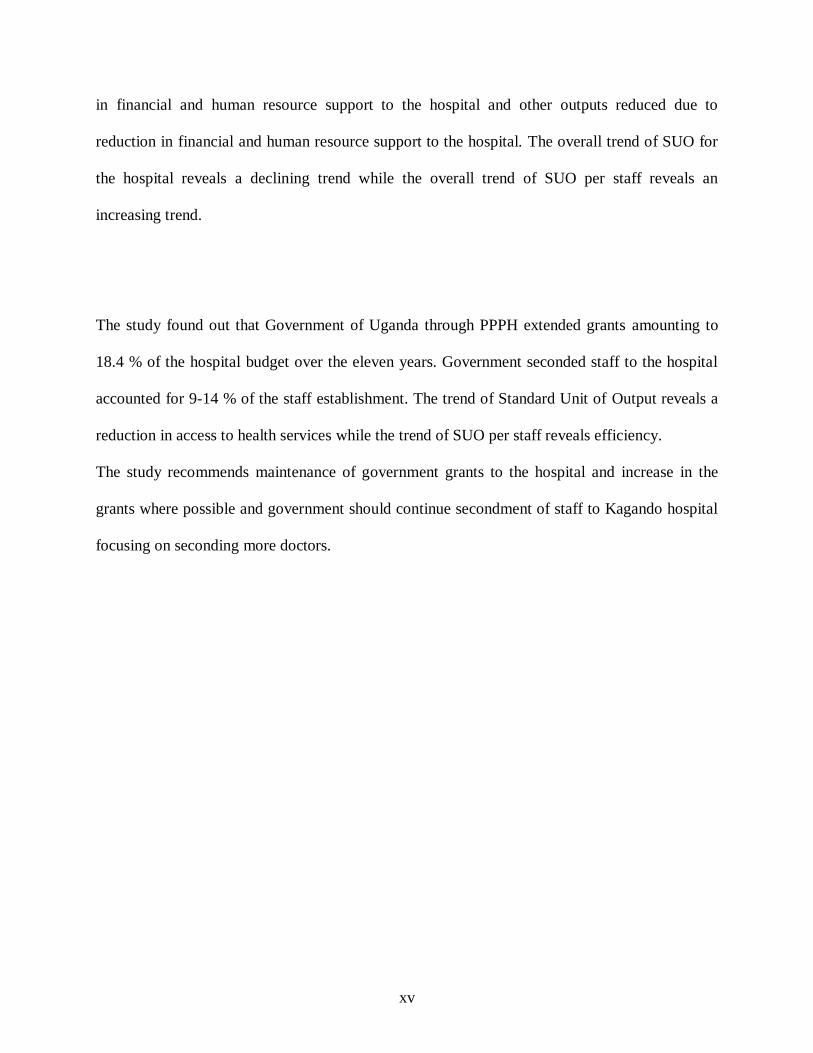
in financial and human resource support to the hospital and other outputs reduced due to
reduction in financial and human resource support to the hospital. The overall trend of SUO for
the hospital reveals a declining trend while the overall trend of SUO per staff reveals an
increasing trend.
The study found out that Government of Uganda through PPPH extended grants amounting to
18.4 % of the hospital budget over the eleven years. Government seconded staff to the hospital
accounted for 9-14 % of the staff establishment. The trend of Standard Unit of Output reveals a
reduction in access to health services while the trend of SUO per staff reveals efficiency.
The study recommends maintenance of government grants to the hospital and increase in the
grants where possible and government should continue secondment of staff to Kagando hospital
focusing on seconding more doctors.
1
CHAPTER ONE
INTRODUCTION
1.0 Background to the Study
The Public-Private Partnership in Health (PPPH) was initiated in 1997 by the Ministry of Health
in Uganda with the support of a parliamentary resolution implementation in July 2000. In
Uganda, the private sector can be broadly categorized into Private- for- Profit (PFP) and Private-
not-for-Profit (PNFP) providers. The PFP group contains both formal and informal providers.
Informal providers mainly include general merchandise, shops and traditional healers. There are
also new non Ugandan systems of care such as the Indian and Chinese medical systems.
Involvement of the private sector is, in part, linked to the wider belief that public sector
bureaucracies are inefficient and unresponsive and that market mechanisms will promote
efficiency and ensure cost effective, good quality services (WHO, 2000). Another perspective on
this debate is linked to the notion that the public sector must reorient its dual role of financing
and provision of services because of its increasing inability on both fronts (Mitchell J., 2001).
Under partnerships, public and private sectors can play innovative roles in financing and
providing health care services.
Partnership has significant potentialities for achieving efficient and effective high quality health
services. It aims to establish a functional integration and sustained operation of a pluralistic
health care delivery system by optimizing the equitable use of the available resources and
investing in comparative advantages of the partners. It ensures the utilization of the potentials of
2
both the public and private sectors (Barakat, 2003). The need to provide and improve the
efficiency of the health system delivery has been gaining attention worldwide (Jamison et al,
2006). Many countries have introduced reforms with the goal of making health care more
effective (Mattke et al, 2006).
In 2001, PNFP health sub sector in Uganda was commended as an indispensable subsystem that
offered comparable better and acceptable quality of health care than government (Muwanga et al,
2001). They are under three umbrella organizations: the Uganda Catholic Medical Bureau
(UCMB), the Uganda Protestant Medical Bureau (UPMB) and the Uganda Muslim Medical
Bureau (UMMB). By 2002, the Bureaus together represented 78% of the 490 PNFP health units
while the rest fell under other humanitarian organizations and community-based health care
organizations (MOH, 2001).
In partnership with government, Kagando hospital receives government support from three main
sources: Primary Health Care Conditional Grant (PHC CG), Essential Drugs and Personnel
through secondment of medical staff (Kagando hospital, 2007). Human resource remains the
central gist that determines the overall effects of the reforms (Rigoli, 2003). Kagando Hospital
has been a beneficiary of the PPP since 1996/7. Like any other PNFP hospital in Uganda, the
level of financial and human resource support and the extent to which such support has impacted
on Kagando hospital‘s efficiency in delivery of health services to the community remains not
well understood. This study was conducted to assess the effect of the financial and human
resources support through PPP on efficiency of delivery of health services in Uganda using
Kagando hospital as a case study.

3
1.1 Statement of the Problem
Like other Private –Not- For- Profit hospitals in Uganda, Kagando hospital faced financial and
human resource challenges resulting from increased cost of drugs, staffing, and budget. In 1997,
the hospital adopted the Public Private Partnership (PPP) in Health with the aim of improving
hospital efficiency in health services delivery to the general population. In spite of the
government financial and human resources support through the Public Private Partnership
strategy, Kagando hospital management is not certain if the institution has gained substantial
improvement in hospital efficiency with regard to service delivery especially hospital outputs
such as admissions, outpatient department attendance, antenatal care, immunization and
deliveries. Besides, the Standard Unit of Output (SUO) for Kagando hospital and its relationship
to human resource, cost of medicines, total costs and user fees is not known. Whether Kagando
hospital has gained efficiency in delivery of health services is a critical knowledge gap that needs
to be addressed. Failure to appreciate positive effects of PPP on hospital efficiency may
jeopardize future government support to the private -not -for -profit institutions and thus
negating the aims for which the partnership was established. Thus, this study therefore sought to
investigate the effects of public-private partnership on the efficiency of health service delivery at
Kagando Hospital.
1.2 Study Objectives
1.2.1 General
The general objective of the study was to establish the effects of Public Private Partnership (PPP)
on the efficiency of health services delivery at Kagando hospital over the period 1996/7 to
2006/7.

4
1.2.2 Specific
The study specifically aimed to:
1. Assess the extent to which the financial and human resources support through Public –
Private Partnership affect Kagando hospital‘s delivery of health care services.
2. Determine the Standard Unit of Output (SUO) for Kagando hospital and its relationship
to human resource, cost of medicines, total costs and user fees.
1.3 Research Questions
1. How does the financial and human resources support through Public-Private Partnership
affect Kagando hospital‘s delivery of healthcare service?
2. What is the Standard Unit of Output and other efficiency indicators related to standard
unit of output for Kagando hospital?
1.4 Significance of the Study
Little is known about how the financial and human resource support through the PPP has
influenced Kagando Hospital‘s ability to transform the inputs into health service delivery
outputs. Measuring the hospital efficiency in delivery of health services will help to understand
some of the disparities in performance as well as providing some guide in the reallocation of
resources in the bid to close the inequity gap in service provision. Furthermore, the findings from
this study, may guide health policy makers and planners in developing more effective strategies
for efficient allocation of resources in government supported health facilities.

5
1.5 Organization of the Study
The study is organized in six chapters. Chapter one is the introduction, while the second chapter
describes the literature review related to the topic studied. Chapter three is the methodology
while the fourth chapter presents the results. The fifth chapter gives an account of the discussion
of the key results. A summary of the conclusions and policy recommendations are presented in
chapter six.
6
CHAPTER TWO
LITERATURE REVIEW
2.0 Introduction
Public-private partnerships (PPP) were developed in the UK, where they are more usually known
as the Public Finance Initiative (PFI). PPP/PFI is now being promoted across the world as the
panacea for public sector capital investment. Uganda is one of the countries where this concept is
being actively encouraged by its government. Public-Private Partnership (PPP) refers to public
and private sector actors working together on the basis of shared objectives, strategies and agreed
monitoring and evaluation criteria (Ahmed, 2000).
The Uganda MOH defines the term partnership as ― The formal relationship between or more
partners who have agreed to work together in a harmonious and systematic fashion and being
mutually supportive towards common goals, including agreeing to combine or share their
resources and/or skills for the purpose of achieving these common goals‖ (MOH, 2003).
In Uganda, the PPP in health was initiated in 1997 by the Ministry of Health with the support of
a parliamentary resolution in July 2000. Within this resolution, the private sector can be broadly
categorized into Private- for- Profit (PFP) and Private-not-for-Profit (PNFP) providers. The PFP
group contains both formal and informal providers. Informal providers mainly include general
merchandise, shops and traditional healers. There are also new non Ugandan systems of care
such as the Indian and Chinese medical systems.

7
Operationally, the benefits of PPPs include efficiency gains; output focus; economies generated
from integrating the design, building, financing and operation of assets; innovative use of assets;
managerial expertise; and better project identification. These benefits can result in some
combination of better and more services for the same price, and savings, which can be used for
other services or for more investment elsewhere. Strategically, partnership contracts enhance
accountability by clarifying responsibilities and focusing on the key deliverables of a service. A
department‘s managerial efficiency can benefit significantly as existing departmental financial,
human and management resources can be refocused on strategic functions.
2.1 Public – Private Partnership and Hospital Service Delivery Inputs
2.1.1 Total Funding to PNFP Sub sector in Uganda
Total funding to the PNFP sub sector amounted to just 0.5 percent of the total health sector
budget in 1997/98, and this had grown to 7 percent by the year 2002/03 (Ssengoba et al, 2007).
This funding made a considerable contribution to the financial sustainability of the PNFP health
units. For example, in the year 2001/02, government funding from the PNFP conditional grant
constituted nearly 30 percent of the budgetary requirements of the PNFP health units
(Bataringaya & Lochoro, 2002).
Growing financial support from government grants and improvements in management efficiency
have enabled many of the PNFP facilities to adjust their user fees down ward. At least 81 percent
of the PNFP hospitals and a number of lower level units have been able to lower fees, leading to
increases in utilization, especially for child in-patient stays and general out- patient consultations
(Odaga & Maniple, 2003).

8
According to Green (1999), a financing system may have negative influences on the way health
services are provided. Litvack & Bodart (1993) in Cameroon and Gertler & Molyneaux (1997) in
Indonesia found that price increases without compensatory improvements in quality discourage
utilization of health services for the poor.
2.1.2 Human Resource in PNFP Sub sector
In Uganda, from 1972 to 1996, the number of doctors dropped from 1171 to 964; with a
population ratio more than doubling from 1:9090 up to 1: 20228; though the number of nurses
increased slightly from 3877 to 4059, the population ratio again rose from 1: 2745 to 1: 4804.
Similarly for mid-wives and medical assistants the population ratio rose from 1: 3917 to 1: 7431
and 1: 24457 to 1: 29367 respectively (Mwesigye et al, 2000)
The total volume of health workers coordinated by the three medical bureaus (UCMB, UPMB
and UMMB) was 11,114 as by June 30th
2007. This is up by 10% from the 10,000 as of
November 2004. It is a very minimal rise in about three years and still much lower compared to
28% rise in the Public sector. About 4% of the PNFP staff in Uganda is civil servants, either
deployed by the districts or posted by the Ministry of Health. Whereas there has been an increase
in the number of staff and in the percentage of qualified staff employed in PNFP health facilities
over along period, the size of the workforce has been stagnating.
2.1.3 Medicines
Access to affordable medicines is included amongst the health-related Millennium Development
Goals. Medicines are a major health expense for poor households in most developing countries
where 50-90 percent of medicines are paid for by the patients themselves, while in many
9
developed countries, 70 percent of medicines are publicly funded through reimbursement plans
and other mechanisms (Quick et al, 2002). Moreover it is estimated that less than half of the
population in the poorer parts of Africa and Asia have regular access to essential medicines. This
remains a major obstacle to good health despite the many achievements in the field of essential
medicines since the Declaration of Alma Ata in 1978 (Quick, 2003). Social and cultural
constraints disproportionately prevent women, children, ethnic minorities, and other
marginalized populations from gaining access to medicines (Ruxin et al, 2005).
Improved public expenditure on or/and medicines supply are expected to translate into higher
utilization of health services overall (Nazerali H & Oteba M.O. 2005).
2.1.4 Credit line for medicines grant from National Medical Stores (NMS)
The National Medical Stores (NMS) is a semi-autonomous medical supply agency serving the
Public Sector in Uganda. Similarly, faith based organizations running the many PNFP health
facilities can benefit from economies of scale through the Joint Medical Stores (Kawasaki,
2001). It should be noted that government spending buys far more medicine per unit of
expenditure than households spending, as government can benefit from bulk purchasing
efficiencies using the National Medical Stores(NMS)(Gabra and Green ,2000; Euro Health,
2004).
2.2 Public – Private Partnership and Hospital Service Delivery Outputs
Reich (2002) argues that partnerships result into innovative strategies and positive consequences
for well-defined public health goals, and they can create powerful mechanisms for addressing
difficult problems by leveraging the ideas, resources, and expertise of different partners. Such

10
line of thinking is the same enshrined in the objective of PPPH in Uganda which is ― to establish
functional integration and to sustain the operation of pluralistic health care delivery system by
optimizing the equitable use of available resources and investing in comparative advantage of the
partners‖ (MOH, 2006).
In Sub-Saharan Africa, for example, the number of people receiving HIV/AIDS treatment
increased more than eight-fold from about 100,000 to 810,000 between 2003 and 2005 and more
than doubled in 2005. This massive improvement would not have been possible without key
public-private partnerships in the HIV/AIDS sector (UNAIDS, 2006). Other studies have
reported increased access and reversal of the decline in utilization of health services immediately
after the introduction of government subsidies to PNFP sub sector. There was an upward trend in
utilisation of composite units of output (SUO) and this rise in utilisation has continued at an even
steeper pace into the present day. This is attributed to the effect of the government subsidy in
replacing user fees and allowing the charges to be gradually pushed downwards (Giutsi et al,
2004).
Singapore appears to be getting good value from its adoption of the public private partnership for
health in its health care system. Patients enjoy complete freedom of choice between easily
accessible private (80%) and public (20%) clinics for outpatient care, and public (80%) and
private (20%) hospitals for inpatient care. Singapore doctors enjoy a high reputation, as attested
by the steady streams of well-heeled foreign patients (150,000 in 2000) who fly in from the
surrounding region for medical treatment. Average length of stay in a public hospital is 5 days. A

11
recent nation-wide survey of patients discharged from all the corporatized public hospitals
revealed a high overall patient satisfaction (Meng Kim Lee, 2003).
2.2.1 Hospital Outputs
2.2.1.1 Immunisation
Immunisation is a method of primary prevention aimed at preventing communicable diseases in
order to reduce on morbidity and mortality due to the diseases being targeted. In Uganda, six
childhood immunisable diseases are tuberculosis (T.B), Diphtheria, Whooping cough (Pertusis),
Tetanus, poliomyelitis (polio), and measles. Immunisation is one of the government priorities
and is well spelt as an approach for primary health care (PHC). It is one of the most important
means of mortality and morbidity in children (Jelliffe, 1979), the others being good nutrition and
good environmental sanitation.
Each and every year, infants should be fully immunized. The immunization coverage rates are
greatly influenced by the socio-economic status of the mothers. An increase in socio-economic
status of mothers results in an increase in immunization coverage rates, the level of participation
in immunization activities and the number of fully immunized infants while a decrease results in
lowered rates(UBOS, 2007). During the period of 1962 to 1970, Uganda established a
comprehensive immunization programme, in which a high degree of vaccination coverage of
infants and young children was achieved especially for TB and Polio. By 1973 coverage of TB
and Polio was a bout 70 % for children less than 14 year.

12
A number of factors do affect immunization service delivery to populations. Some are related to
the populations themselves while others are related to the health services (Kasule, 1992). In a
study conducted by Kasule (1992), it was reported that knowledge, attitudes and practices of a
community affected coverage rates and that these were linked up with mismanagement. Other
factors influencing immunization included: education, status of parents, husbands consent, and
general health education to the community. In one study done in Hoima by Baguma (1988), it
was found that despite the mothers having good knowledge of immunization centres, the
immunization coverage was low (18.2 %).
2.2.1.2 Antenatal Care (ANC) attendance
Most women in Sub-Saharan Africa initiate ANC late in pregnancy thereby fail to reach the
recommended 4 visits. Unplanned/mistimed pregnancy is one of the contributing factors to
delayed ANC attendance. Makaweri (2000) on frequency and timing of ANC in Kenya found out
that the first visit occurs in the fifth month of pregnancy on average.
Nyane L (2007) conducted a study on factors associated with Antenatal care drop out among
pregnant women in Tororo District in Uganda and found out that the level of education, age,
parity (number of children previously had), distance and transport, socio-economic status, clients
perception on ANC services, knowledge about ANC, Occupation, decision making, marital
status, gender dimensions, timing for ANC and unplanned/mistimed pregnancy among others are
responsible for Antenatal Care drop out. A study done in Mberere District in Kenya found out
that mothers living less than 5 km from the health facility utilized ANC services better than the
mothers who were 5 km from the health facility (Mwaniki & Mbugua, 2002).
13
2.2.1.3 Deliveries
Munaaba E. (1995) found out that the distance to a health unit was a major factor in determining
whether professional care for delivery was sought or not. The difference in attendance of
mothers from within a radius of 3 km from a health unit, as compared to utilization of health
units by mothers who came from a distance of greater than 3 Km was found to be highly
significant. This finding suggested that the catchment area of a health unit for purposes of
maternity care, should be revised to 3 Km.
Other factors which influence mothers‘ choice of location of child – birth in Uganda include
ethnocentricity, position adopted at child birth, staffing at health units, health facility equipment.
Availability of service is a major factor contributing to choice of location of birth. And the WHO
chronicle sums it up thus; ―As long as they are not sufficient conventional health personnel for
total population coverage, as long as funds for health care remain mal-distributed and
inadequate, so long will these TBAs continue to be in demand‖ (WHO Chronicle 36 (3) 1982).
Many modern facilities charge a fee (user fee) which fees are in monetary terms and on a cash
delivery ‗basis‘. The expectant mother may opt for the traditional sector where payment in real
terms may be less, mode of payment flexible (that is, cash or kind), and allowing for credit
facilities. In Kenya it was estimated that 75 % of all births in areas where the research was
conducted occur under the supervision of Traditional Birth Attendants (Nyamawe, 1984)

14
A survey on utilization of Home and hospital deliveries in Botswana revealed that 77.1% of
urban women chose to deliver from hospital or clinic and only 45.2% of the rural women chose
hospital or clinic. The proportion of home deliveries was highest in the most remote villages
(low availability of modern service) and lowest in low-cost sites in the urban area (Anderson,
1986).
2.2.1.4 Inpatients
Access and use of hospital in-patient care services can be influenced by several factors. In
developing countries, Uganda inclusive, two main aspects of quality that have been documented
to influence service utilization significantly are availability of skilled personnel and essential
drugs (Hutchinson, 1999; Barnum and Kutzin, 1993). In the government hospital more patients
were likely to be admitted due to the ‗free services‘ rendered. However, due to higher tendency
of stock outs of drugs and poor quality services, patients are either discharged earlier or seek for
referral or may out right leave the government hospital, implying low costs of provision of
inpatient care. On the other hand, the PNFP hospital which charges a fee for service may have
fewer admissions, more IPDs and longer stays mainly due to good quality services. This may
contribute to the high costs of provision of inpatient care and higher unit costs and hence an
impression of poor efficiency (Ongom M, 2006).
2.3 Measuring Efficiency
The discussion on the definition and measurement of the output of health care organizations has
been dominated by two schools of thought namely; process approach and outcomes approach.
The process approach, asserts that the output of a health care organization consists of services

15
provided by the different units such as the X-rays, laboratory procedures, patient days etc; and
the outcomes approach, regards the above processes only as intermediate steps leading to the
desired change in patient's health status. According to this approach, therefore, output should be
measured in terms of the end result or outcome that is improved health (Mersha, 1989).
Output can be seen from the providers‘ technical standards and patients‘ expectation (Brown et
al, 2003). UCMB (2005) noted that efficiency in health care stimulate people to seek treatment
and reduce negative attitudes which increase access and utilization of services. Mills (1990)
mentioned that working in an environment where employees are aware that treatment quality is
poor is not motivating staff because it affects their morale. Lack of focus on quality results in
waste of resources. Focus on delivering quality of services provides opportunities to utilize
resources efficiently.
The outcomes approach is highly limited by practical difficulties. First, it is easier to measure
and define processes in health care than changes in health status. Second, changes in health
outcome can not be entirely attributed to health care. Health is multi-dimensional and affected
significantly by a host of other socio-economic factors. Consequently, output is measured as an
array of intermediate outputs (health services) that supposedly improve health status (Melbourne,
2004).
16
2.3.1 Standard Unit of Output
A composite Indicator of activity (Standard Unit of Output for hospitals-SUO (h) was calculated
by attributing to each output a relative weight. The weight attributed to each parameter was
worked out on the basis of costs drawn from the literature a, b, c
a) Barnum H. and Kutzin J. (1993) in the grey literature examined 1Ip day would equal to 4Op.
Given that in the PNFP Hospitals studied the Average Length of Stay (ALOS) is 6.9 days, 1Ip
would be equal to 24 to 28Op.
b) Flessa S. (1997); the first report of the study conducted by Flessa in the Lutheran Hospitals in
Tanzania, found that 1Ip day equals to 2Op. Therefore according to Flessa 1Ip would equal to
12-14Op.
c) Giusti D. (1993); the author conducted a cost analysis in Matany Hospital: in terms of cost 1Ip
would equal to 15Op.Eventually this latter weight was adopted because it was closer to the
finding of Flessa. The weight proposed by Barnum was drawn from cost analysis in Hospitals
from higher income countries. In addition a relative weight was attributed also to Deliveries =
5Op, immunizations=0.2Op and ANC activities= 0.5Op. The formula for the calculation of SUO
(h) would result: 1 SUO (h) = [15*Ip +1*Op +5*Del +0.2Imm +0.5*ANC].
The SUO is used as a proxy for measurement of the volume of activity of a hospital and adds up
5 main outputs as if they were all outpatients based on their relative cost to the outpatient.
2.3.2 Trends of Standard Unit of Output in PNFP Hospitals in Uganda
MOH (2007) revealed that for the three years running (2004/05, 2005/06 and 2006/07), there was
a trend analysis of access and efficiency parameters of a set of 65 PNFP hospitals in Uganda.
17
The components of the SUO revealed the following; the outpatient attendance has decreased by
2% from 2005/06; the inpatient attendance has decreased by 10 % from 2005/06; Utilisation of
antenatal services has increased by 14 %, immunization increased by 2%; and the overall volume
of outputs measured by SUO has decreased by 5%. UCMB-UPMB-UMMB (2007) documented
that both PNFP hospitals and lower level facilities have steadily registered increases in Standard
Unit of Output (SUO) –a proxy for access-which is a composite index of IP, OPD attendance,
ANC, Immunisation and deliveries. They mention that the slight drop in 2005/06 is undoubtedly
a consequence of the reduced support from government.
18
CHAPTER THREE
METHODOLOGY
3.0 Introduction
This chapter presents the methods used to carry out the study. It outlines the study design, study
setting, sampling procedure, measurements, data collection, data management and analysis as
well as quality control measures and ethical considerations.
3.1 Study Design
This was a time series study design. The study involved analysis of data generated from Kagando
hospital records over an eleven year period (1996/7 – 2006/7), during which time hospital
embraced the Public Private Partnership for Health.
3.2 Study Setting
The study was conducted at Kagando Hospital, which is located in Bukonzo County, about 40
kilometers a way from Kasese town to the west. Kagando hospital is a Private-Not-For-Profit
hospital founded by Church of Uganda. It has a catchment population of 148,195 (Kagando
Hospital HMIS, 2007). The hospital was established by the African Inland Mission in 1965
primarily as a treatment centre for leprosy. By 2007, the hospital had attained a 234 bed
capacity. It consists of eighth (8) wards, which include namely; maternity, surgical, paediatric,
medical male and female wards as well as the leprosy and tuberculosis treatment unit. Over the
years, the hospital activities diversified in response to the community needs and currently it acts
as a referral centre for both emergency and elective medical and surgical conditions in Kasese

19
district. Besides, Kagando hospital runs a school of nursing and midwifery that offers certificate
and diploma courses to an average of about 20 candidates per year.
3.3 Data Types and Sources
3.3.1 Inputs data
Table 1: Sources of Hospital inputs
Objective Type of
input data
Definition Measurement Source of data
Assess the
extent to
which the
financial and
human
resources
support
through
Public –
Private
Partnership
affect
Kagando
hospital‘s
delivery of
healthcare
service.
Financial
resources
Government ,
donor
agencies, user
fees, sales and
other income
Amount in Uganda
shillings per year
KARUDEC:
Diocese of South
Rwenzori C.O.U;
Audited Financial
Statements 1996/7-
2006/7
Human
resources
for health
Medical
doctors, nurses
and other
employees
Total staff
employed per year,
government
seconded medical
staff per year,
ratios
Kagando Hospital
Human Resource
Files 2002/3-
2006/7;
Establishment
Register for
seconded staff
2004-2007
Hospital
beds
Inpatient beds
in all wards
Total number of
hospital beds per
year
Kagando Hospital
Assets Register
Financial and human resource data was to ascertain whether the support received under PPPH
was adequate to propel the hospital to horizons of efficiency in health delivery. The number and
categories of seconded staff by government to Kagando hospital was established in order to
measure the extent of support. Appointments were made with hospital administration department
to gain access to the human resources, financial support and other relevant input data for the
period 1996/7 to 2006/7.
3.3.2 Outputs data
Data on key outputs of the study was got from the following documents/sources:
20
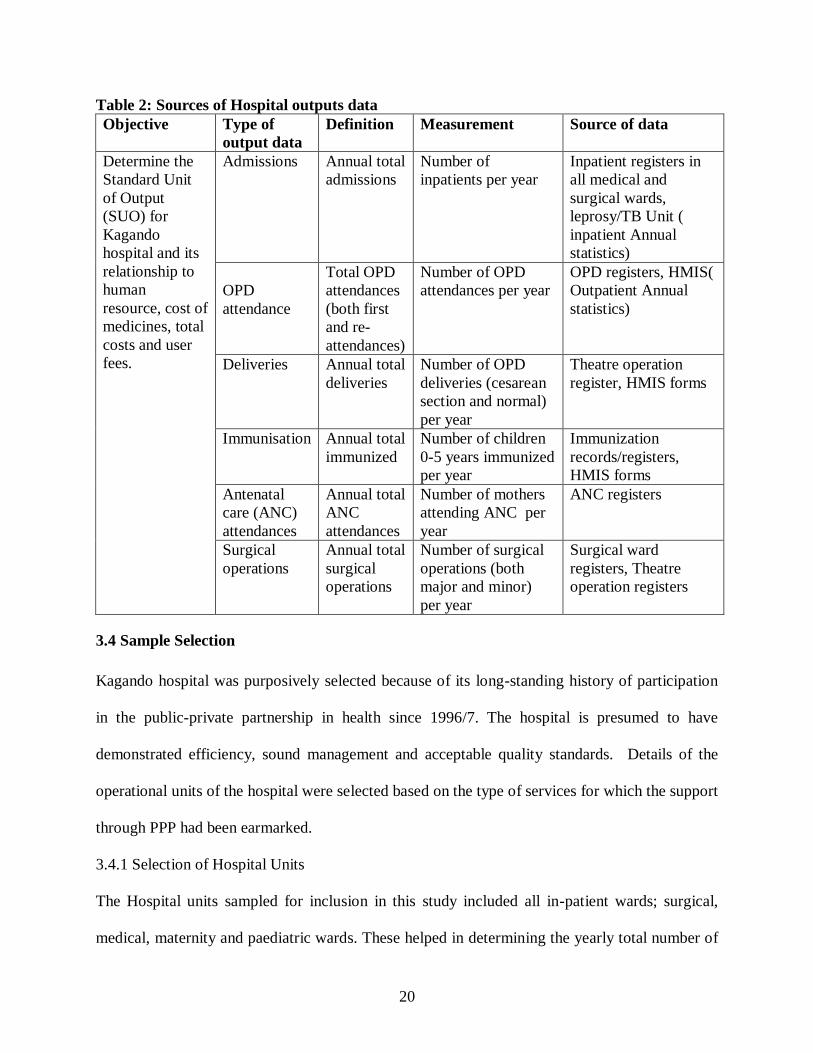
Table 2: Sources of Hospital outputs data
Objective Type of
output data
Definition Measurement Source of data
Determine the
Standard Unit
of Output
(SUO) for
Kagando
hospital and its
relationship to
human
resource, cost of
medicines, total
costs and user
fees.
Admissions Annual total
admissions
Number of
inpatients per year
Inpatient registers in
all medical and
surgical wards,
leprosy/TB Unit (
inpatient Annual
statistics)
OPD
attendance
Total OPD
attendances
(both first
and re-
attendances)
Number of OPD
attendances per year
OPD registers, HMIS(
Outpatient Annual
statistics)
Deliveries Annual total
deliveries
Number of OPD
deliveries (cesarean
section and normal)
per year
Theatre operation
register, HMIS forms
Immunisation Annual total
immunized
Number of children
0-5 years immunized
per year
Immunization
records/registers,
HMIS forms
Antenatal
care (ANC)
attendances
Annual total
ANC
attendances
Number of mothers
attending ANC per
year
ANC registers
Surgical
operations
Annual total
surgical
operations
Number of surgical
operations (both
major and minor)
per year
Surgical ward
registers, Theatre
operation registers
3.4 Sample Selection
Kagando hospital was purposively selected because of its long-standing history of participation
in the public-private partnership in health since 1996/7. The hospital is presumed to have
demonstrated efficiency, sound management and acceptable quality standards. Details of the
operational units of the hospital were selected based on the type of services for which the support
through PPP had been earmarked.
3.4.1 Selection of Hospital Units
The Hospital units sampled for inclusion in this study included all in-patient wards; surgical,
medical, maternity and paediatric wards. These helped in determining the yearly total number of

21
inpatients with medical conditions. The Operating theatre and maternity ward were used to
determine the number of deliveries by caesarian section and normal deliveries. The Out-patient
department (OPD) to determine the yearly total number of cases treated on an out patient basis.
The above units were selected based on the SUO model for outputs and thus relevant to research
objective one. The outputs data was used to measure the Standard Unit of Output as a proxy
measure for access to health services in terms of total admissions, total OPD attendances, total
deliveries, immunization and Ante-natal care services utilization and thus relevant to research
objective two.
3.5 Data Collection
A checklist was administered to the hospital administration and finance department staff to
extract information from the hospital records. Human resource checklist was used to capture staff
categories namely: the total number of medical doctors, nurses and other employees per year for
the period under study. A checklist on number of hospital beds and cost of drugs per year were
also used to capture input data. The sources of revenue or funding for Kagando hospital were
categorized to include government contribution, user fees, donor agencies, sales and other
income. Information on health services provided by the hospital was collected based on variables
used in the measurement of the standard unit of output. Specifically, the checklist captured data
on yearly total number of admissions, OPD attendance (both new and re-attendances), total
number of immunizations done, total deliveries and overall ANC attendance over the period
1996/7 to 2006/7.
22
3.6 Measurements and Key Concepts
Labour categories were combined into three variables: doctors, nurses and other employees to
minimize some variation in how the hospital records their staff in the registers. The variable
‗doctors‘ included all senior medical officers, medical officers as well as dental surgeons. The
variable ‗nurses‘ included senior nursing officers, nursing officers, Uganda registered nurses,
midwives, enrolled midwives, enrolled nurses, nursing assistants, and nursing aides. And the
variable ‗ other staff‘ included clinical officers, dispensers, anesthetics officers, radiographers,
orthopedic officers, laboratory technologists and technicians, laboratory assistants, hospital
administrator, accountant, clerical officers, supplies officers, stores assistants, telephone
operators, dark room attendants, mortuary attendants, drivers, security guards, carpenters,
electrical technicians and plumbers. All staff included in this study were salaried. The number of
hospital beds was used as a proxy indicator for capital stock because a reliable measure of the
value of assets is rarely available.
3.7 Data Management and Analysis
A study database was created. Data were entered into the computer using MS Excel version and
cleaned. Analysis was performed using MS Excel software. Categorical variables were
summarized using frequencies and proportions. Continuous variables were summarized using
medians, means, minimum and maximum values. Univariate analysis was performed to describe
the trends in the data while at bivariate level correlations were used to determine relationships
between two continuous variables. This was used to describe the SUO and its relationship with
other efficiency indictors and correlations. Results were presented by use of tables and charts.
23
Objective one; extent to which financial and human resource support through PPP affected
Kagando hospital‘s service delivery outputs was measured by documenting trends in
immunization, OPD utlisation, ANC attendance, Deliveries, Admissions and surgical operations
as these constitute key elements of the Uganda minimum health care package. Data on hospital
inputs was extracted from the final accounts, national disbursements and human resources files
of Kagando hospital.
In answering objective two to determine the Standard Unit of Output (SUO) to measure hospital
efficiency; SUO was calculated using the Giusti ( 2002) formula:
Standard Unit of Output = (15* Total Admissions) + (1* Total OPD Attendances) + (5*
Total Deliveries) + (0.2* Total Immunizations) + (0.5* Total ANC attendances).
This simply equates the cost of treating 1 inpatient to the one for 15 outpatients, 1 delivery to 5
outpatients, 0.2 immunisations to 1 outpatient and 0.5 antenatal care visits to 1 outpatient.
Therefore, a Standard Unit of Output (SUO) also referred to as ‗outpatient equivalent‘ was used
after converting the various hospital outputs-inpatients, deliveries, antenatal care contacts, and
immunizations, into outpatient equivalents.
Total yearly utilization figures for admissions, OPD attendance, deliveries, immunization and
ANC attendance for the period 1996/7 to 2006/7 were computed and factored into the SUO
equation and thus relevant to objective two. A composite indicator of activity (SUO) was
calculated by attributing to each output a relative weight. The weights attributed to each output
were derived based on the costs drawn from the formula provided by Giusti (2002).
24
Further analysis of efficiency related indicators to SUO to answer objective two was done. The
SUO, SUO per staff, Average fees per SUO, Unit cost of standard unit of output and Cost of
drugs per SUO were used as proxy for access to health services. The SUO per staff was
calculated by dividing the SUO for a particular year with total number of health workers from
that year. User fee per SUO was calculated by dividing total user fee generated for a particular
year with the SUO from that year. The unit cost of the SUO was calculated by dividing the total
hospital expenditure for a particular financial year by the SUO from that year. Cost of drugs per
SUO was calculated by dividing the total expenditure on drugs for a particular financial year by
the SUO from that year.
3.8 Quality Control
The data was collected by the Principal Investigator with guidance from the supervisors. The
study purpose was explained to the staff from the Finance & Administration department of
Kagando hospital. The tools for data collection were pre-tested at St Paul Health Centre IV in
Kasese town to determine their relevancy and validity and adjustments made accordingly. Data
collected was kept under lock and key.
3.9 Ethic Consideration
The Faculty of Economics and Management of Makerere University approved the study.
Permission to conduct the study was obtained from the Chief Administrative Officer and the
District Health Officer, Kasese. The purpose of the study was explained to the respondents and
requests to access the hospital records granted by the Hospital administration. All data collected
was treated with strict confidentiality and kept under lock and key.

25
CHAPTER FOUR
RESULTS
4.0 Profile of the Study
Between April and August 2008, data on hospital records to ascertain the level of government
financial and human resource support and the efficiency on health service delivery at Kagando
hospital through PPP were reviewed for the period 1996/97 to 2006/07. Findings in sections 4.1
and 4.2 are relevant to research objective one while section 4.3 is relevant to research objective
two.
4.1 Inputs to Kagando Hospital under the Public Private Partnership
4.1.1 Sources of Funding for Kagando hospital
The sources of funding for Kagando hospital with corresponding financial support based on
review of hospital financial records and disbursements from central government for the fiscal
years 1996/97 to 2006/07 are summarized in Table 3.
Table 3: Sources of Funding for Kagando Hospital FY 1996/97 – 2006/07
Source of funding Amount in Ugshs Percent (%)
Government contributions 2,163,774,934 18.42
User fees 5,591,330,621 47.61
Donor agencies 3,140,425,700 26.74
Sales 236,554,387 2.01
Other income 612,560,788 5.22
Total 11,744,646,436 100.0
Source: KARUDEC: South Rwenzori Diocese: Audited financial statements 1996/97-2006/07
26
Findings from Table 3 reveals that the hospital received 2,163,774,934 Uganda shillings from
government as contribution under the public private partnership scheme.
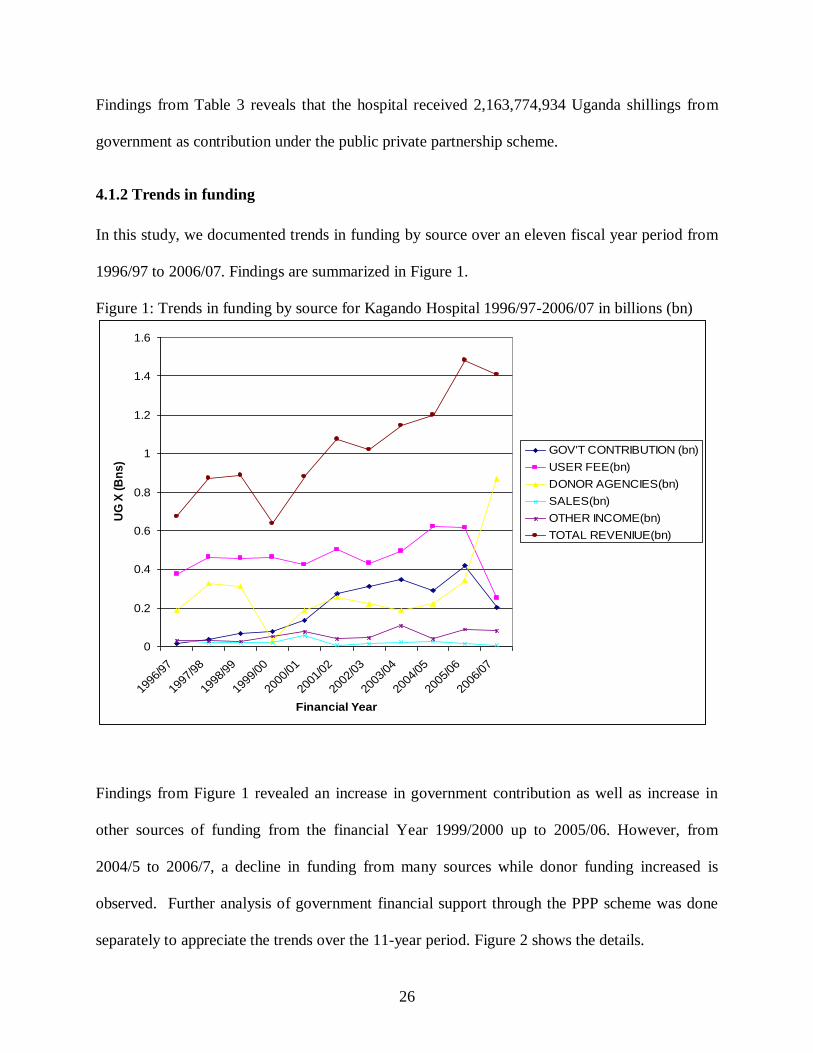
4.1.2 Trends in funding
In this study, we documented trends in funding by source over an eleven fiscal year period from
1996/97 to 2006/07. Findings are summarized in Figure 1.
Figure 1: Trends in funding by source for Kagando Hospital 1996/97-2006/07 in billions (bn)
0
0.2
0.4
0.6
0.8
1
1.2
1.4
1.6
1996
/97
1997
/98
1998
/99
1999
/00
2000
/01
2001
/02
2002
/03
2003
/04
2004
/05
2005
/06
2006
/07
Financial Year
UG
X (
Bn
s)
GOV'T CONTRIBUTION (bn)
USER FEE(bn)
DONOR AGENCIES(bn)
SALES(bn)
OTHER INCOME(bn)
TOTAL REVENIUE(bn)
Findings from Figure 1 revealed an increase in government contribution as well as increase in
other sources of funding from the financial Year 1999/2000 up to 2005/06. However, from
2004/5 to 2006/7, a decline in funding from many sources while donor funding increased is
observed. Further analysis of government financial support through the PPP scheme was done
separately to appreciate the trends over the 11-year period. Figure 2 shows the details.
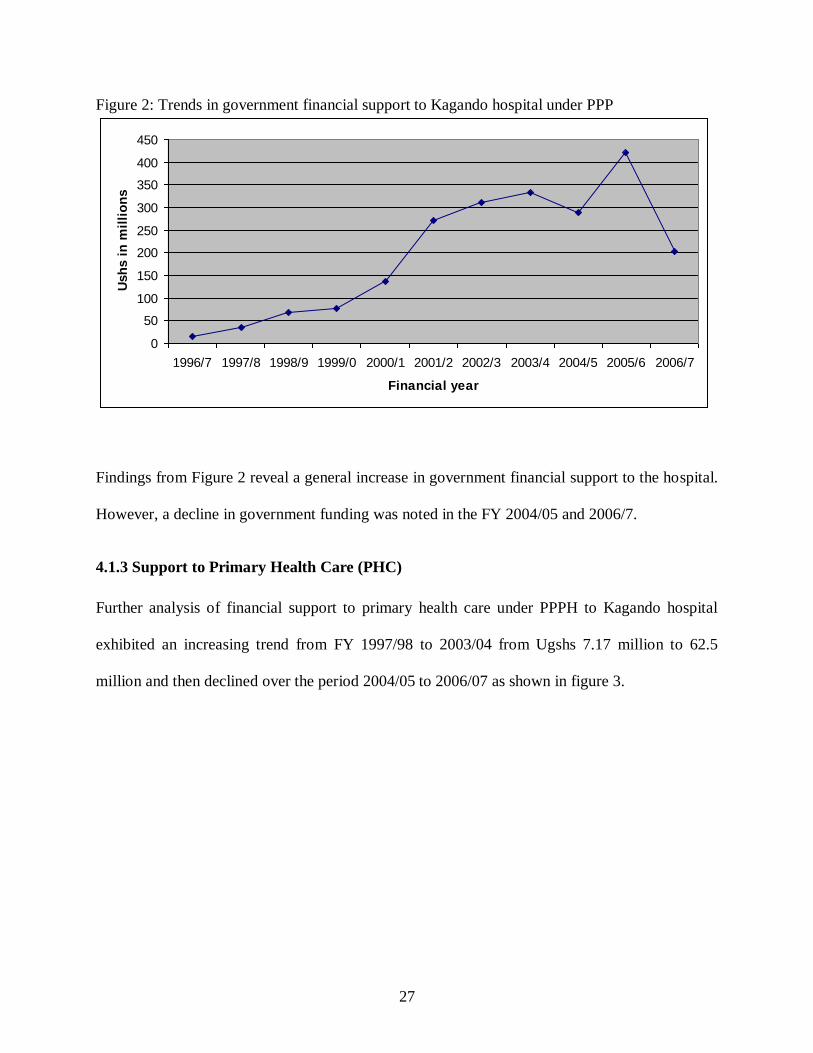
27
Figure 2: Trends in government financial support to Kagando hospital under PPP
0
50
100
150
200
250
300
350
400
450
1996/7 1997/8 1998/9 1999/0 2000/1 2001/2 2002/3 2003/4 2004/5 2005/6 2006/7
Financial year
Ush
s i
n m
illi
on
s
Findings from Figure 2 reveal a general increase in government financial support to the hospital.
However, a decline in government funding was noted in the FY 2004/05 and 2006/7.
4.1.3 Support to Primary Health Care (PHC)
Further analysis of financial support to primary health care under PPPH to Kagando hospital
exhibited an increasing trend from FY 1997/98 to 2003/04 from Ugshs 7.17 million to 62.5
million and then declined over the period 2004/05 to 2006/07 as shown in figure 3.

28
Figure 3: PHC support to Kagando Hospital, FY 1996/7 to 2006/7
7,173,598 7,728,301 6,768,522
24,471,140
58,493,178 58,284,77062,553,565
2,438,7500
10,000,000
20,000,000
30,000,000
40,000,000
50,000,000
60,000,000
70,000,000
1997/98 1998/99 1999/2000 2000/01 2001/02 2002/03 2003/04 2006/07
Financial year
Am
ou
nt
in U
ga
nd
a s
hillin
gs
Figure 3 shows that there was an overall increase in PHC funding to Kagando Hospital over the
period FY 1997/8 to 2003/4 and a decline in support in 2006/7. It is important to note that data
on PHC funding for 1996/7, 2004/5 and 2005/6 was missing.
4.1.4 Support to HIV/AIDS activities
The Joint Clinical Research Centre (JCRC) mobilized funds from development partners on
behalf of government and disbursed the funds to Kagando hospital for HIV/AIDS prevention
shown in Table 4.
Table 4: Financial support (in 000) by Joint Clinical Research Centre to Kagando hospital
between FY1998/9 and 2006/7 FY 1998/9 1999/0 2000/1 2001/2 2002/3 2003/4 2004/5 2005/6 2006/7
Ugshs
(000)
12,000
7,800
3,600
90,000
90,000
110,672
110,672
10,000
54,840

29
The pattern of financial support to HIV/AIDS in Table 4.2 shows that there was an overall
increase in financial support to HIV/AIDs activities over the period 1998/9 to 2004/5. The
HIV/AIDs support reveals a sharp declining trend in FY 2005/6
4.1.5 Support to Human Resources for health
Under public private partnership, government supported human resource development at
Kagando Hospital through the wage sub-vention fund to staff who are seconded by government.
Findings for the entire staff of Kagando hospital for the FY 2002/3 to 2006/7 are summarized in
Table 5.
Table 5: Staffing at Kagando hospital between FY 2002/3 and 2006/7 Year Doctors Nurses Other employees Total number
2002/03 6 101 92 199
2003/04 11 104 84 199
2004/05 6 77 60 143
2005/06 9 84 79 172
2006/07 9 109 77 195
Overall, Kagando Hospital employed on average 188 staff in a given year, ranging from 143 in
2004/05 to 195 in 2006/07. The staff included ‗Doctors‘ who ranged from Specialist Medical
Officers, Medical Officers, Pharmacists and Dentists to Residents and Interns. ―Nurses‖ included
Nurses/Midwives of different professional categories ranging from professional enrolled,
registered, community nurses/midwives, to nursing assistants. Other employees included
paramedics and assistants technicians, administrative staff and other general staff. It is important
to note that the majority of the staff were nurses compared to doctors and other employees. The
30
maximum staff level of 199 staff was achieved in FY 2002/3 and 2003/4 while the lowest
staffing of 143 was registered in 2004/5.
Further analysis of the staffing was done to determine what proportion of the total staff were
employed by government. Table 6 shows the staff who were seconded by government to
Kagando hospital under the PPP strategy.
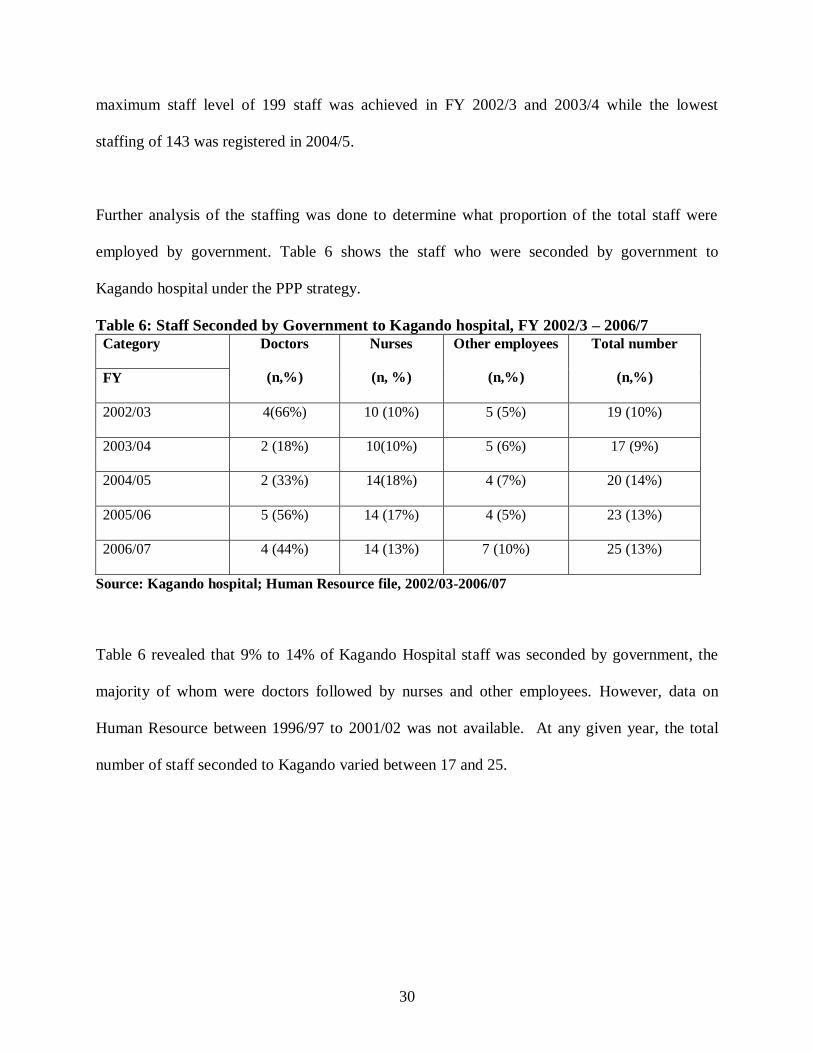
Table 6: Staff Seconded by Government to Kagando hospital, FY 2002/3 – 2006/7
Category Doctors
(n,%)
Nurses
(n, %)
Other employees
(n,%)
Total number
(n,%) FY
2002/03 4(66%) 10 (10%) 5 (5%) 19 (10%)
2003/04 2 (18%) 10(10%) 5 (6%) 17 (9%)
2004/05 2 (33%) 14(18%) 4 (7%) 20 (14%)
2005/06 5 (56%) 14 (17%) 4 (5%) 23 (13%)
2006/07 4 (44%) 14 (13%) 7 (10%) 25 (13%)
Source: Kagando hospital; Human Resource file, 2002/03-2006/07
Table 6 revealed that 9% to 14% of Kagando Hospital staff was seconded by government, the
majority of whom were doctors followed by nurses and other employees. However, data on
Human Resource between 1996/97 to 2001/02 was not available. At any given year, the total
number of staff seconded to Kagando varied between 17 and 25.

31
4.1.6 Staff bed ratios
Ideally, an increase in medical staff in a hospital should lead to an increase in staff to bed ratio if
the staffing is to have any effect on hospital efficiency. The yearly total staff per bed, doctor per
bed and nurse per bed ratios was calculated to assess if the increase in staffing due to
government secondment had an influence on staff bed ratios. Table 7 summarises the details.
Table 7: Average ratios for total staff per bed, doctor per bed and nurse per bed ratios
Year 2002/03 2003/04 2004/05 2005/06 2006/07 2007/08
Total staff per bed 0.88 0.88 0.63 0.73 0.83 0.91
Doctor per bed 0.03 0.05 0.03 0.04 0.04 0.03
Nurse per bed 0.44 0.46 0.34 0.34 0.46 0.5
Table 7 revealed that for the period 2002/03 to 2007/08, the average ratio of total staff per bed
for Kagando hospital was 0.81, doctor bed ratio was 0.04, nurse bed ratio 0.42. The ratio for
doctor per bed per year was lower than that of nurses per bed for the entire period of study.
4.1.7 Support on medicines through Credit line
The Government also provided medicines for use by the Hospital under the credit line for
medicines grant that was managed centrally by the Ministry of Health through the Joint Medical
Store (JMS) summarized in table 8.
Table 8: Joint Medical Stores (JMS) credit line for medicines grant to Kagando hospital,
FY 2004/05 to 2007/8 FY 2004/05 2005/06 2006/2007 2007/08
Credit line(Gushes) 193,874,563 200,216,373 2004,312,048 235,407,473
32
Table 8 revealed an overall increasing trend in funding by government to Kagando hospital
under the credit line for medicines grant. The value of medicines accessed under this credit line
increased from UG X 193,874,563 in FY 2004/2005 to 235,407, 473 in FY 2007/08 as revealed
in table 8. However, data on credit line between 1996/97 to 2003/04 was not available.
4.2 Hospital Service Delivery Outputs
The study looked at specific outputs at service delivery level to determine the extent to which
Kagando hospital utilized the government funding and human resource received over the eleven-
year period. This was based on key variables on the SUO and other vital output variables. These
included number of children immunized (irrespective of the type of immunization), number of
patients seen at OPD (irrespective of old and new cases), mothers who attended ANC
(irrespective of new and repeat visits), number of admissions, number of deliveries and surgeries
performed (both elective and emergency) during the period under study. Details are presented in
the proceeding sections.
4.2.1 Immunization for children 0-5 years
Immunization for children is a proxy for hospital involvement in the provision of PHC activities
to the community and thus a key output indicator. In this study, documentation of the trends in
immunization of children for the period FY 1996/7 to 2006/7 was done. Details are summarized
in Figure 4.

33
Figure 4: Number of children immunized at Kagando hospital over the period 1996/7 to
2006/7.
0
5000
10000
15000
20000
25000
1996
/7
1997
/8
1998
/9
1999
/0
2000
/1
2001
/2
2002
/3
2003
/4
2004
/5
2005
/6
2006
/7
Fiscal year
Nu
mb
er
of
ch
ild
ren
im
mu
nis
ed
Overall, there was a declining trend for the total number immunized from 20592 immunized
children in FY 1996/7 to 11399 immunized children in FY 2002/3, with a slight increase in
2004/5 and then a decline for rest of the period under study most likely due to changing priorities
in budget allocations.
4.2.2: Surgical operations, normal deliveries and ANC attendance at Kagando
Hospital between FY 1996/7 and 2006/7.
In this study, we assessed the trends in number of surgical operations, normal deliveries and
ANC attendance. These are important indicators in hospital service delivery. Results are
presented in Figure 5.

34
Figure 5: Trends of Surgical operations, normal deliveries and ANC attendance at
Kagando Hospital between FY 1996/7 and 2006/7.
0
5000
10000
15000
20000
25000
No
of
pa
tie
nts
Surgical operations 1873 1744 1915 1386 862 740 748 795 115 1410 2036
Deliveries 1720 1593 1917 1540 1243 1419 1638 1544 1565 1731 1850
ANC Attendance 20450 16014 16445 12448 9860 12587 11158 10916 11210 6725 6823
1996/7 1997/8 1998/9 1999/0 2000/1 2001/2 2002/3 2003/4 2004/5 2005/6 2006/7
ANC attendances over the period of 11 years showed a declining trend. Mothers can prefer to go
for re-attendances of ANC in other health facilities nearest to them not necessarily the health
facility of first visit. The total number of deliveries and surgical operations revealed a flattened
declining and increasing trend for the entire eleven year period of PPP implementation. Total
ANC attendances was highest in FY 1996/7 at 20,450 and continued to decline to 6,823 in the
FY 2006/7 while total deliveries per year was highest at 1,917 in FY 1998/9 and lowest at 1,243
in FY 2000/01. Surgical operations were highest at 2,036 in FY 2006/7 and lowest at 740 in FY
2001/2.
35
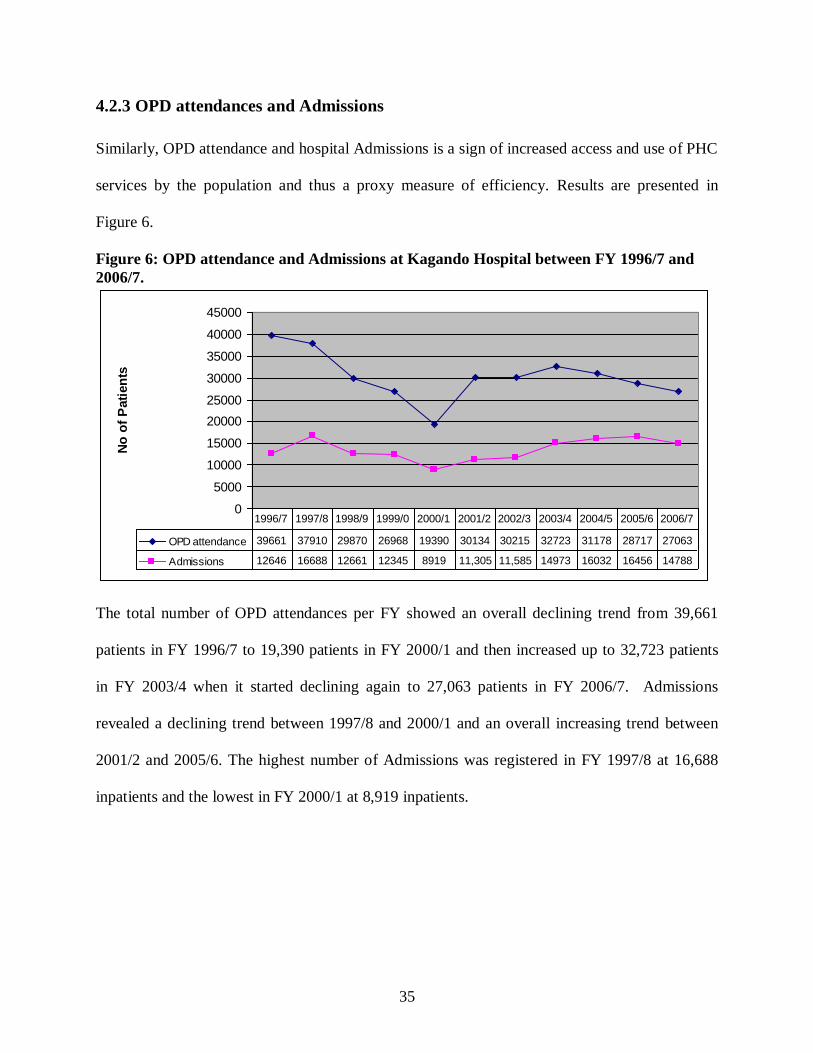
4.2.3 OPD attendances and Admissions
Similarly, OPD attendance and hospital Admissions is a sign of increased access and use of PHC
services by the population and thus a proxy measure of efficiency. Results are presented in
Figure 6.
Figure 6: OPD attendance and Admissions at Kagando Hospital between FY 1996/7 and
2006/7.
0
5000
10000
15000
20000
25000
30000
35000
40000
45000
No
of
Pati
en
ts
OPD attendance 39661 37910 29870 26968 19390 30134 30215 32723 31178 28717 27063
Admissions 12646 16688 12661 12345 8919 11,305 11,585 14973 16032 16456 14788
1996/7 1997/8 1998/9 1999/0 2000/1 2001/2 2002/3 2003/4 2004/5 2005/6 2006/7
The total number of OPD attendances per FY showed an overall declining trend from 39,661
patients in FY 1996/7 to 19,390 patients in FY 2000/1 and then increased up to 32,723 patients
in FY 2003/4 when it started declining again to 27,063 patients in FY 2006/7. Admissions
revealed a declining trend between 1997/8 and 2000/1 and an overall increasing trend between
2001/2 and 2005/6. The highest number of Admissions was registered in FY 1997/8 at 16,688
inpatients and the lowest in FY 2000/1 at 8,919 inpatients.

36
4.2.4 Patient to Doctor and Nurse Ratios
The ratios were calculated to determine the extent to which the secondment of staff by the
government to Kagando hospital translated into reduction in staff work load. Details of findings
are shown in Table 9.
Table 9: Patient to doctor and nurse ratios Financial year 2002/03 2003/04 2004/05 2005/06 2006/2007
OPD patient: Doctor ratio 5035.83 2974.82 5196.33 3190.78 3007
OPD patient: nurse ratio 299.16 314.64 404.91 341.87 248.28
Inpatient: Doctor ratio 1930.83 1361.18 2672 1828.44 1643.11
Inpatient: Nurse ratio 114.70 143.97 208.21 195.91 135.67
The OPD patient: Doctor ratio showed an overall reducing trend which implies a reduction in
doctor work load. The outpatient doctor ratio also reduced in FY 2005/06 and 2006/7 from 3191
to 3007 outpatients revealing reduction is doctor workload. The Inpatient: Doctor ratio revealed
an overall declining trend implying a reduction in doctor workload. Inpatient doctor ratio an
showed an overall declining trend between FY 2002/03 and FY 2003/4showing a reduction in
doctor workload and later started rising in FY 2004/05 and then declined for the rest of the study
period
The OPD patient: Nurse ratio revealed an overall increasing trend between FY 2002/03 and
2004/05 and later started declining. The outpatient nurse ratio revealed an increasing trend from
2002/3 to 2004/5 and later declined up to 2006/7. Inpatient: nurse ratio was highest in FY 2004/5
with 208 Inpatients per nurse per year and lowest in FY 2002/3 at 114 Inpatient per nurse per
year and later revealed an increasing trend up to FY 2005/6 and a decline in FY 2006/7.

37
4.3 Standard Unit of Output (SUO)
The SUO is used as a proxy for measurement of the volume of activity of a hospital and adds up
5 main outputs as if they were all outpatients based on their relative cost to the outpatient. This
analysis was relevant in achieving objective two. The SUO was calculated using the formula
developed by Giusti (2002): Standard Unit of Out put (SUO) = (15*total admissions) + (1*total
OPD attendances) + (5*total deliveries) + (0.2*total immunisation) + (0.5*total ANC
attendances). Based on this formula, Giusti (2002) concludes that a health facility is said to be
efficient if the SUO exhibits an increasing trend while a decreasing trend is said to reveal
inefficiency in health service delivery, as a proxy of access.
Figure 7 shows the trend of the total annual SUO for Kagando hospital from 1996/7 to 2006/7.
The trend of total annual SUO revealed a declining trend from 1997/8 to 2000/1 and an
increasing trend from 2001/2 to 2005/6. The declining trend of SUO was due to decline in
hospital service delivery outputs of Immunisation, OPD attendances and ANC attendance. In
addition, Government of Uganda budget support cuts to Kagando hospital could have negatively
impacted on the overall performance of the SUO.

38
Figure 7: Standard Unit of Outputs for Kagando Hospital between 1996/97-2006/07
0
50000
100000
150000
200000
250000
300000
350000
19
96
/97
19
97
/98
19
98
/99
19
99
/00
20
00
/01
20
01
/02
20
02
/03
20
03
/04
20
04
/05
20
05
/06
20
06
/07
Financial Year
Sta
nd
ard
Un
it o
f O
utp
ut
SUO
The SUO increased from 252,294 in FY 1996/97 to 307,699 in FY 1997/98 then declined and
was at its lowest in 2000/01. It then began to rise peaking at 290,380 in FY 2005/06.The standard
unit of output at Kagando hospital was highest at 307,699.8 in FY 1997/98 and lowest at
166,750.2 in FY 2000/2001. The SUO pattern is that of a decline from1997/98 till FY 2000/01
followed by an increase. The overall trend of the SUO revealed a declining trend between FY
1997/98 and 2000/01 and an increasing trend between FY 2001/02 and 2005/06, and then SUO
started declining thereafter. The average SUO for entire period of study was 252,199.

39
4.3.1: Standard Unit of Output per staff
Standard Unit of Output (SUO) per staff measures staff productivity over time. Gusty (2002)
argues that an increase in SUO per staff reveals improved staff productivity while a decline in
SUO per staff reveals a reduction in staff productivity. In this study, the SUO per staff for
Kagando hospital was determined as a way of measuring efficiency. The overall trend of the
SUO per staff is an increasing one as shown in figure 8
Figure 8: SUO per staff for Kagando Hospital 2002/03-2006/07
0
500
1000
1500
2000
2500
2002
/03
2003
/04
2004
/05
2005
/06
2006
/07
SUO per Staff
The Standard Unit of Output per staff increased from 1,084.8 in FY 2002/3 to 1,908.6 in FY
2004/5 when the total number of government seconded staff to the hospital increased in the same
year and then took on a declining pattern up to 1,489.1 in FY 2006/7 even when the hospital had
the highest number of seconded staff from government. The staff, on average, was responsible
for 1,389 outputs per year.

40
4.3.2: Relationship between SUO per staff and Doctor: Nurse ratio
The SUO per staff was plotted against the doctor: nurse ratio to ascertain the relationship
between the two variables using a scatter diagram. Findings are presented in Figure 4.9.
Figure 9: Scatter diagram showing relationship between SUO per staff and Doctor: Nurse ratio
for Kagando hospital between 2002/3 to 2006/7
0
500
1000
1500
2000
2500
0 0.05 0.1 0.15
Doctor:Nurse Ratio
SU
O p
er
Sta
ff
SUO per Staff
The SUO per staff and the doctor: nurse ratio showed an overall upward pattern from
1084.8:0.06 in FY 2002/3 to 1675.8:0.11 as revealed by the scatter diagram. The correlation
coefficient between SUO per staff and doctor: nurse ratio of 0.133 was positive which means that
there was a positive relationship between SUO per staff and doctor nurse ratio.
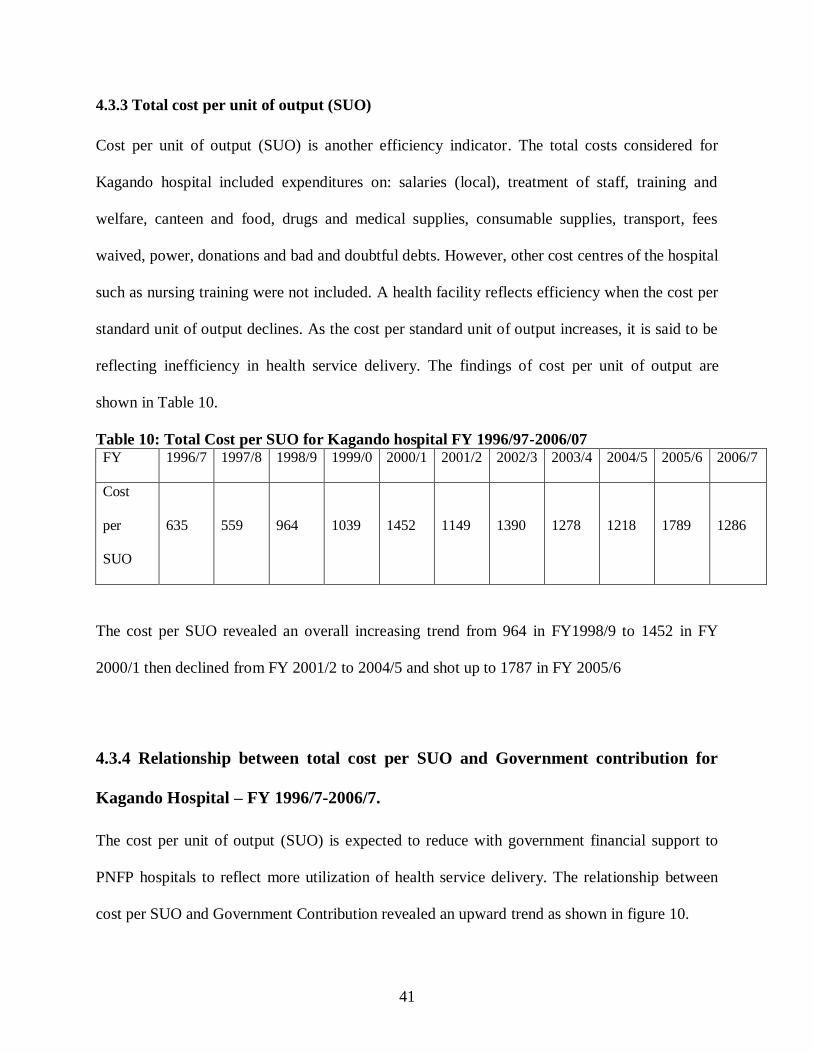
41
4.3.3 Total cost per unit of output (SUO)
Cost per unit of output (SUO) is another efficiency indicator. The total costs considered for
Kagando hospital included expenditures on: salaries (local), treatment of staff, training and
welfare, canteen and food, drugs and medical supplies, consumable supplies, transport, fees
waived, power, donations and bad and doubtful debts. However, other cost centres of the hospital
such as nursing training were not included. A health facility reflects efficiency when the cost per
standard unit of output declines. As the cost per standard unit of output increases, it is said to be
reflecting inefficiency in health service delivery. The findings of cost per unit of output are
shown in Table 10.
Table 10: Total Cost per SUO for Kagando hospital FY 1996/97-2006/07 FY 1996/7 1997/8 1998/9 1999/0 2000/1 2001/2 2002/3 2003/4 2004/5 2005/6 2006/7
Cost
per
SUO
635
559
964
1039
1452
1149
1390
1278
1218
1789
1286
The cost per SUO revealed an overall increasing trend from 964 in FY1998/9 to 1452 in FY
2000/1 then declined from FY 2001/2 to 2004/5 and shot up to 1787 in FY 2005/6
4.3.4 Relationship between total cost per SUO and Government contribution for
Kagando Hospital – FY 1996/7-2006/7.
The cost per unit of output (SUO) is expected to reduce with government financial support to
PNFP hospitals to reflect more utilization of health service delivery. The relationship between
cost per SUO and Government Contribution revealed an upward trend as shown in figure 10.

42
Figure 10: Relationship between total cost per SUO and Government contribution for
Kagando Hospital – FY 1996/7-2006/7.
From figure 10, as government contribution increased from UG X 15 million in FY 1996/7 to
137 million in FY 2000/1 the Cost per SUO increased from 634.6 to 1452.3 respectively.
However, in the FY 2003/4 when government contribution increased, the Cost per SUO
decreased implying that government resources were used to subsidise fees of services so that for
the same cost there was more utilization of health services at Kagando hospital.
4.3.5 Relationship between cost of drugs per SUO and Government contribution for
Kagando Hospital FY 1996/7-2006/7
The cost of drugs per SUO is a measure of efficiency of a health facility. As the cost of drugs per
SUO decreases a healthy facility exhibits efficiency and as the cost of drugs per SUO increases a
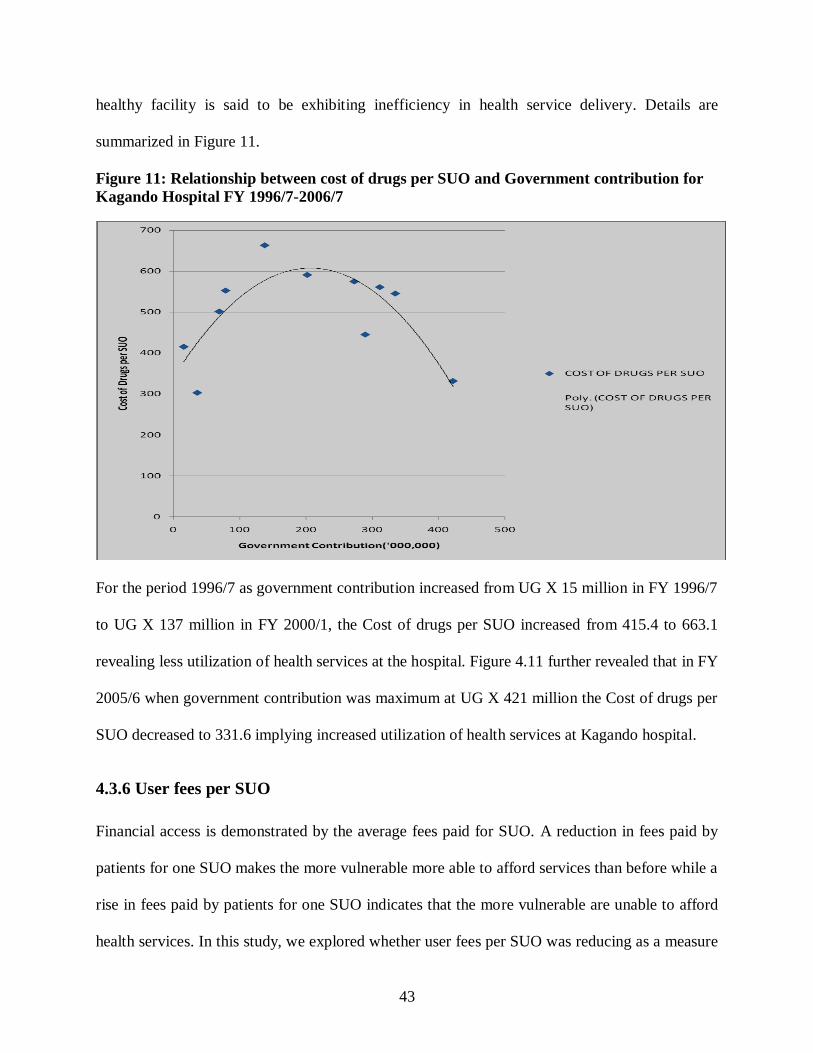
43
healthy facility is said to be exhibiting inefficiency in health service delivery. Details are
summarized in Figure 11.
Figure 11: Relationship between cost of drugs per SUO and Government contribution for
Kagando Hospital FY 1996/7-2006/7
For the period 1996/7 as government contribution increased from UG X 15 million in FY 1996/7
to UG X 137 million in FY 2000/1, the Cost of drugs per SUO increased from 415.4 to 663.1
revealing less utilization of health services at the hospital. Figure 4.11 further revealed that in FY
2005/6 when government contribution was maximum at UG X 421 million the Cost of drugs per
SUO decreased to 331.6 implying increased utilization of health services at Kagando hospital.
4.3.6 User fees per SUO
Financial access is demonstrated by the average fees paid for SUO. A reduction in fees paid by
patients for one SUO makes the more vulnerable more able to afford services than before while a
rise in fees paid by patients for one SUO indicates that the more vulnerable are unable to afford
health services. In this study, we explored whether user fees per SUO was reducing as a measure
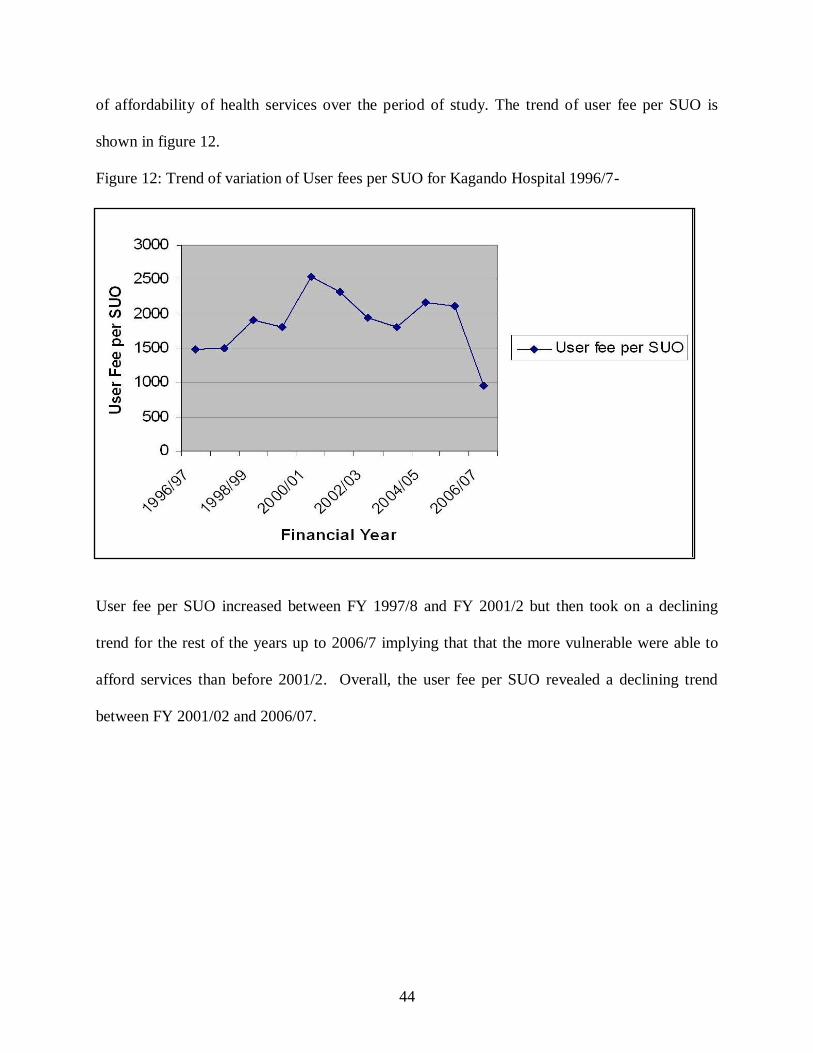
44
of affordability of health services over the period of study. The trend of user fee per SUO is
shown in figure 12.
Figure 12: Trend of variation of User fees per SUO for Kagando Hospital 1996/7-
User fee per SUO increased between FY 1997/8 and FY 2001/2 but then took on a declining
trend for the rest of the years up to 2006/7 implying that that the more vulnerable were able to
afford services than before 2001/2. Overall, the user fee per SUO revealed a declining trend
between FY 2001/02 and 2006/07.

45
CHAPTER FIVE
DISCUSSION
5.1 Financial and Human Resource Support through PPP to Kagando Hospital
Government financial support through PPP constituted 18.42% of the total budget for Kagando
hospital over the period under study. This contribution is lower than revenues received from
donors and user fees of 26.74% and 47.61% of total budget respectively. This finding is in
agreement with UCMB-UPMB-UMMB (2007) which estimated government contribution to
PNFP facilities to be at 15% to 36% of the facility total budget.
Trends in government financial support revealed a general increase in government financial
support to the hospital. However, a decline in government funding was noted in the FY 2004/5
and 2006/7. One of the reasons for this decline included budget cuts from the central
government. The above findings therefore imply that any fluctuations in government funding
have a direct effect on the budgets of government supported health facilities. Similar findings
have been reported in other developing countries where hospital budgets are dependent on
government support (Cush, 2005).
A higher proportion of Kagando Hospital ‗doctors‘ compared to ‗nurses‘ and ‗other employees‘
were seconded staff. However, the proportion of 9 to 14 % for seconded staff is still lower
compared to 28% rise in staffing of medical staff in the public sector (UCMB, UPMB and
UMMB, 2007). The findings in addition agree with Moody (2004) who reveals that health care
delivery is labour intensive and thus the workforce determines productivity and quality of
services.
46
5.2 Hospital Service Delivery Outputs
5.2.1 Immunisation
We observed a decrease in immunization trends with corresponding increment in government
financial support but also a reduction in numbers in spite of stepped PHC funding in some
instances. This may be attributed to changing priorities in budget allocations over the entire
period under study. It is possible that while government funding through PHC increased more
allocations could have been made to other activity outputs than immunization for the period
where numbers in total immunization reduced. The role of other factors that reduce
immunization numbers can not be underestimated. Kasule (1992) argues knowledge, attitudes
and practices of a community can affect immunization coverage rates.
5.2.2 Antenatal care (ANC), Deliveries and Surgical Operations
The overall pattern of Antenatal Care (ANC) revealed a declining trend despite of the increase in
government funding. Mothers can prefer to go for re-attendances of ANC in other health
facilities nearest to them not necessarily the health facility of first visit. Given that the illiteracy
levels in Kasese among women is low (37%) and that the majority of women are dependant on
men for financial support, it is possible that the above factors could have played a role in the
decline in utilization of ANC. We can not under estimate the role of other factors such low
sensitization among communities on importance of ANC and health care provider factors in
contributing to the low ANC uptake irrespective of the increased government funding. This is
further supported by Nyane (2007) in which Antenatal care drop out among pregnant women
may be attributable to the level of education, clients perception on ANC services and knowledge
about ANC.

47
As the financial support to Kagando hospital increased the total number of deliveries did not
significantly increase. This can partly be explained by the existence of the two government
owned health centres, Nyabirongo HC III and Kyondo HC III that have nurses – ‗Mid wives‘
offering a similar service within a radius of 5 km. These findings are in agreement with
Munaaba (1995) where distance to a health unit was a major factor in determining professional
care for delivery. Other factors that could explain such trends include traditional birth
attendants, ethnocentricity, position adopted at child birth, staffing at health units (WHO
chronicle 36 (3) 1982), Nyamawe (1992) & Anderson (1986).
The increasing trend in number of Surgical Operations per year in some instances could be
attributed to the increasing number of government seconded medical doctors. This observation
confirms that government secondment of health workers to PNFP health units is an endeavour to
work together with the private sector to improve the performance of the health system in general
(Lochoro et al, 2006) and thus human resource remains the central gist that determines the
overall effects of the reforms (Rigoli, 2003).
5.2.3 Outpatient Department (OPD) and Total Admissions/or Inpatient
When the OPD utilization and admissions are compared to government support, OPD utilization
and number of Admissions steadily increased with increasing government financial support from
FY 2000/1 and reduced when government funding was lowered in 2006/7. This observation
confirms that the support through PPP had a positive influence on health service delivery and
utilization at Kagando hospital. Outpatient Attendance in government and PNFP units is a
measure of utilization of health services, and is used as a proxy measure for both the quality and

48
quantity of services,(supply side) and the health seeking behaviour of the population (demand
side). The initial increase in new OPD attendance was attributed to the reduction of user fees and
flattening of fees in PNFP facilities (MOH, 2007).
5.2.4 OPD patient: Doctor ratio and OPD: Nurse ratio
When the hospital employed the highest number of doctors, the workload for doctors was lowest
compared to the year when the hospital employed the lowest number of doctors. This
observation confirms the fact that government secondment increased the number of doctors at
Kagando hospital which reduced doctor workload and thus likely to increase staff productivity in
terms of service delivery. On the other hand, as the number of nurses in Kagando hospital
reduced the nurses‘ workload increased and hence likely to have reduced staff productivity.
5.2.5 Inpatient: Doctor ratio and Inpatient: Nurse ratio
The Inpatient: Doctor ratio was high when Kagando hospital had low numbers of doctors and
this led to increased workload for doctors in the Inpatient wards. However, in the year when the
hospital employed the highest number of doctors, the workload for doctors was lowest.
Hutchinson( 1999) & Barnum and Kutzin, (1993) found out that in developing countries, Uganda
inclusive, two main aspects of quality that have been documented to influence service utilization
significantly are availability of skilled personnel and essential drugs .
The Inpatient: nurse ratio increased as the number of nurses in Kagando hospital reduced which
increased the nurses‘ workload in the Inpatient wards and reduced for the rest of the period as the
number of nurses employed increased. These findings are in agreement with UCMB- UPMB,-
49
UMMB (2007) who found out that there are high levels of attrition in PNFP hospitals at 16 % in
2005/6 and human resource gap represented a proportion of 54 % of the total human resource
gap in the health sector. Also agree with WHO(2000) who note that Gaps in human resources for
health in numbers, skill mix and distributions continue to pose a challenge for effective service
delivery in Uganda. In a hospital, the inpatient care departments consume the largest share of
inputs. Maurizio et al (2003) notes that the way these inputs are organized and managed can be
the predominant factor in determining the overall efficiency of a hospital.
5.3 Standard Unit of Output
The trend of SUO per year for Kagando hospital showed an overall declining pattern despite of
increased government funding implying a reduction in access to health services. However, in
some instances, the SUO per year increased with increased government funding to the hospital
which implies increased access to health services by the population for some particular years.
The declining trend of SUO can be attributed to the reduction in total admissions or inpatient,
OPD attendances, immunisation and ANC attendances observed in the initial years. This finding
is in agreement with MOH (2007) who found that over the 2 years of the HSSP II, there has been
a worrying trend of reversal with overall declining outputs, including OPD, IP and Primary
health Care services like Antenatal Care and immunization. These findings disagree with
UCMB-UPMB-UMMB,(2007) who noted that SUO per year from a sample of 27 hospitals(65%
of PNFP hospitals), shows constantly increasing values of SUO and that the slight drop in SUO
is undoubtedly a consequence of the reduced support from government to PNFP health units .
50
5.3.1 SUO per staff (Staff productivity)
Staff productivity which is measured by Standard Unit of Output (SUO) produced per staff
showed an overall rising pattern in comparison with financial and human resource support from
government. The upward trend of SUO produced per staff showed efficiency in use of human
resource. In some instances staff productivity reduced and this can be attributed to the declining
trend in SUO when total admissions, OPD attendances, immunization and ANC were declining
in Kagando hospital. However, this could also be attributed to staff attrition when total staff
reduced with reduced SUO. These findings are in agreement with UCMB, UPMB, UMMB
(2007) who reveal that efficiency gains are lost in PNFP hospitals due to increasing staff attrition
in a study carried out in 65 % of PNFP hospitals in Uganda.
The average SUO per staff of 1389 for Kagando hospital agrees with findings of MOH (2007)
who found out that a staff on average was responsible for 1,395 units of outputs. The findings
agree with Giusti et al (2004) who carried out a study on pro-poor health services and found out
that SUO per staff remained stable, and in some cases showed a decline.
5.3.2 Unit Cost per standard unit of output
The total cost per standard unit of output revealed an overall upward trend in comparison with
increase in government financial support to Kagando hospital implying that the hospital lost
efficiency gains. A steep rise between FY 1999/00 and 2000/01 can better be explained by the
significant reduction in the standard unit of output due to reduction in hospital outputs-
admissions, Immunisation, ANC and OPD attendances, and increasing costs of service delivery
at the hospital. This observation is in agreement with the findings of UCMB- UPMB- UMMB

51
(2007) who noted that with increasing cost of human resource; the cost per unit of output (SUO)
is increasing even in lower level health facilities as hospitals particularly increase salary levels in
attempt to retain staffs. However, this finding disagrees with Maurizzo et al (2003) who asserted
that an increment in expenditure alone does not guarantee efficiency but the way inputs are
organized and managed can be the predominant factor in determining the overall efficiency of a
hospital.
5.3.3 User fee per SUO
The results provide some evidence that the hospital has become more pro-poor with an overall
trend of declining fees paid per standard unit of output. It should be noted that drop in user fees
makes the more vulnerable to afford services than before and hence increased utilization of
hospital services by the poor. The findings are in agreement with McPake (1993) who noted that
although fee reductions were not targeted at the poor, it is known that utilization by the poor is
more elastic to fee adjustments. Bennet (2004) showed that substantial fee increases resulted in
immediate drops in demand, however, with higher income groups showing a less elasticity in
demand over time. Studies done in Uganda (WHO/MOH, 2002) also found out that user charge
rates and availability of drugs have a rapid effect on health service utilization. The mild increase
of user fees reflects the pressure on the sub-sector of the increased cost of service production and
reduced government support (UCMB-UPMB-UMMB, 2007).
5.4 Limitations of the Study
There was none availability of some records on personnel employed between 1996/97 and
2001/02.This might have limited the analysis on some variables for that period. However, given
that the data was collected for a long period – over 10 years, this did not significantly affect the
validity of results since the vast of the records accessed allowed meaningful comparisons.
52
Data on immunization and ANC was composite and not disaggregated and thus difficult to
differentiate between first, second, third etc (ANC and immunisation), new and old re-
attendances. However, this did not affect the validity of the results based on the economic model
(SUO) applied which takes into consideration use of aggregated data on the outputs.
Although efficiency of hospitals may be measured by use of Frontier methods of efficiency
measurement such as the linear programming techniques (for instance, data envelope analysis)
and econometric techniques (for instance, production and cost functions), in this study, these
techniques were not appropriate because the study was focusing on a single health facility.
There are other commonly used ratios as measures of operational efficiency that have not been
looked at in this study. These include: bed occupancy rate, turnover ratio, turnover interval and
average length of stay. These were not used due to inadequate data availability.

53
CHAPTER SIX
CONCLUSIONS AND RECOMMENDATIONS
6.1 Conclusions
Kagando Hospital received financial support from government to the tune of UGX 2.2 billion
over the eleven years amounting to 18.4 % of the hospital budget.
Government seconded staff to the hospital accounted for 9-14 % of the staff establishment,
which is still low to significantly improve hospital efficiency in service delivery.
The main staff seconded by government is medical doctors and nurses with the former
accounting for 18% to 66% of the total number of doctors employed in the hospital. Seconded
nurses only account for 10% - 18 % while ‗other employees account for 5% - 10%.
The hospital service delivery outputs that reveal an increasing trend include Admissions while
deliveries and surgical operations reveal a flattened increasing trend. Hospital service delivery
outputs that show a declining trend include Immunizations, ANC and OPD attendances
There is evidence that some hospital service delivery outputs increased due to increase in
financial and human resource support to the hospital and also a reduction in outputs due to
reduction in support from the government.
The overall trend of Standard Unit of output for Kagando hospital reveals a declining trend
implying a reduction in access to health services over the period 1996/7 to 2006/7. The overall
rising trend of SUO per staff reveals efficiency in utilization of human resource at Kagando
hospital.
There is evidence that the hospital has become more pro-poor with an overall trend of declining
fees paid per standard unit of output. A reduction in user fees per SUO enables the more
vulnerable to afford and access services.

54
6.2 Recommendations
Government grants to Kagando hospital should not be overlooked in view of the cost of health
service delivery. The grants should be maintained and increased where possible to ensure
sustainable and increased utilization of health services by the community.
The government of Uganda through the PPP strategy should continue secondment of staff to
Kagando hospital focusing on seconding more doctors to the hospital since they offer specialized
services that can improve the health outputs of the hospital in critical departments.
Kagando hospital should recruit more doctors in addition to those seconded by the government to
increase the health outputs of the hospital. This will improve staff workload and efficient
utilization of the human resource at the hospital.
Further research into the efficiency of health service delivery at Kagando Hospital should be
carried out taking into account quality of care indicators in addition to the standard unit of
output. A study is recommended to assess the quality of service delivery in the periods before
and after the PPP in health at Kagando hospital in comparison with government health facilities.
This will provide valuable information that would guide investments into quality improvement.

55
REFERENCES
Ahmed, M. (2000): Promoting Public-private partnership in health and education: The case of
Bangladesh, Paper presented to the seminar Public-Private Partnerships in Health, Ayuthya,
Thailand, ADB Institute and the National Economic and Social Development Board, October,
2000.
Anderson Sandra, Frants Staugard. Traditional Midwives. Ipelegny Publishers 1986.
Baguma J. (1988): Acceptability of immunization in Hoima district. DPH Thesis IPH, Makerere
University.
Barnum H., Kutzin J. (1993): Public hospitals in developing countries: resource use, cost,
financing. Baltimore, Md: Johns Hopkins University Press,
Barakat (2003): IMC-EU, presenter in Egypt, ―The Jordanian Experience in Investment
Promotion and Enterprise Development‖
Barnum, H., and J. and Kutzin (1993): Public Hospitals in Developing Countries. Baltimore,
MD: Johns Hopkins University Press.
Bataringaya J, Lochoro P. (2002): The Framework of Public-private partnership. Health Uganda
Health Bulletin, 8 July-December; 294-301.
Bennett (2004): "Overcoming Health systems constraints to achieve the millennium development
goals." The Lancet 364 (9437): 900 - 906.
Cush J.J (2005): Remodeling a rheumatology practice to facilitate early referral. Rheum Dis clin
North Am Nov, 31 (4): 591-604.
EuroHealth. (2004): Technical Review of the National Medical Stores. Final Report July 2004.
EuroHealth Group. For Ministry of Health, Government of Uganda and Health Development
Partners Group.
Flessa S. (1997): The cost of hospital services; A case study of Evangelical Lutheran Hospitals
in Tanzania.
Gabra M, Green T. (2000): Review of Drug Procurement and Management in Uganda. Rational
Pharmaceutical Management Project, Management Sciences for Health Arlington, VA for
USAID, World Bank and Ministry of Health.
Gertler, P. & Molyneaux J. (1994): ―How Economic Development and Family Planning
Combined to Reduce fertility in Indonesia,‖ Demography 31: 33-64
56
Green Andrew (1999): ― An introduction to health planning in developing Countries‖ 2dn
edition, oxford university press, New York. p 95 – 113.
Giutsi D, Lochoro p, Odaga J, maniple E (2004): Pro-Poor Health Services. The Catholic health
Network in Uganda. Development Outreach, 6(1) March: 18-21. The World Bank Institute.
Giutsi D, Lochoro P, Mandeli A. (2002): Public-Private Partnership in Health. What is its effect
on the Performance of health sector? Uganda health Bulletin, 8, January – March: 22-26
Guisti D (2002): Monitoring Hospital Performance: A practical Experience‘ in CUAM Medici
con L‘Africa Health and Development,
Giusti D. (1993): Cost analysis in Matany Hospital: (unpublished)
Heilman, J and G. Johnston, (1992): The Politics of Economics of Privatisation, University of
Alabam Press.
Hutchison P (1999): Health Care in Uganda: Selected issues. World Bank Discussion paper No.
404. The World Bank, Washington DC.
Jamison, Dean T. & World Bank (2006): Priorities in health/editors, World Bank, Washington,
DC:
Jelliffe, Jelliffe DB, and Jelliffe EFP (1979): Human Milk in the Modern World. 2nd ed. Oxford
University Press. Oxford, England. 1979: p211-240, p313-324.
Kagando Hospital Annual Statistics 1996/7- 2006/7.
Kagando Hospital; Human Resource files, 2002/03 -2006/7.
Kagando Rural Development Centre: Diocese of South Rwenzori C.O.U; Audited Financial
Statements for the year ended 30th June 1996/97-2006/7.
Kasule, S. (1992): Demographic characteristics of women with under five children and factors
which influence immunization coverage in Katanga Valley, Kampala. Unpublished Master
degree thesis, Makerere University, Kampala, Uganda.
Kawasaki 2001 E. (2001): Drug Supply Systems of missionary organizations. Identifying factors
affecting expansion and efficiency; Case studies from Uganda and Kenya. MPH Dissertation.
Boston University School of Public Health.
Litvark F & Bordat C (1993): ― User Charges plus quality equals improved access to health care;
results of a field experiment in Cameroon.‖ Social Science and Medicine. 37: 369 -383.

57
Lochoro P., Bataringaya J., Kirunga C. T and Kyabaggu J.H (2006): Public-Private Partnership
in Health. Working together to improve health sector performance in Uganda. .83-96
Makaweri M.A (2000): Frequency and timing of ANC in Kenya: explaining the variations
between women of different communities: Social Science and medicine 51: 551-561.
Mattke, S. Epstein, M. Leathman, A,S (2006): The OECD health care quality indicators project.
History and background. International journal or quality in health care. OECD health Policy unit.
Paris FranceHavard school of Public health, Boston. MA. University of North Carolina Chapel
Hill. NC USA.
Maurizzo M. Corrado B. Odaga J. Ahairwe D. Akullo E. Bavcar A. Boonane E . Kirunda D,
Mwesezi H, Nagujja A. and Ndindayino K. (2003): Costing health services in Lacor Hospital.
Health Policy and development. Volume 1. No. 1. 40 -47.
McPake, Barbara. (1993): User charges for health services in developing countries. A review of
economic literature, social science and Medicine, vol. 36, no. 11.
Melbourne (2004): Steering Committee for the Review of Commonwealth/State Service
Provision: Data Envelopment Analysis: A technique for measuring the efficiency of government
service delivery.
Mersha. T (1989): The Relationship between Cost and Perceived Quality in Services," with,
National DSI Proceedings,
Meng-Kin Lim (2003): Shifting the burden of health care finance: a case study of public–private
partnership in Singapore. Elsevier Ireland Ltd.
Mills A (1990): The Economics of hospitals in developing countries. Part II: Costs and Sources
of Income. Health policy and planning 5 (3).
Mitchell J (2000): In Parliamentary Debates, public sector pay, Dublin, Ireland. available at
[http://historical –debates, oireachtas.ie/D/0533/D.0533,200104030007.html]
MOH (2007): Annual Health Sector Performance Report.
MOH (2003): Draft Policy on Public Private Partnership in Health.
MOH (2002): Uganda Demographic and Health Survey, 2001/02, UBOS, Uganda.
MOH (2001): Health Infrastructure, www.health.go.ug/.
MOH (2000): Health Policy Statement 2001/2002.
Munaaba Elliot (1995): Factors which influence Mothers choice of location of Child-birth in
Pallisa District, Uganda. Master of Medicine in Public health Dissertation, Makerere University,
Kampala, Uganda.

58
Muwanga, N. Mugisha, F. and Ngarok, JP (2001): The effects of government recruitment of staff
from PNFP facilities on district health system. Research paper for Uganda Catholic Medical
bureau.
Mwaniki P.K, Kabiru E. and Mbugua G.G (2002): Utilisation of ANC and maternal services by
mothers seeking child welfare services in Mberere district: Eastern provinces of Kenya: East
African Medical journal Vol. 79 No. 4 April 2002 pp 184-187.
Mwesigye F. & de Torrente N (2000): The changing role of the State, Donors and NGOs
Providing health Services in a Liberal Environment: Some Insights from Uganda, center for
Basic Research, Kampala, Uganda.
Nazerali H, Oteba M O. (2005): Escalating Medicines prices and the Uganda minimum Health
Car package; For Health of for profit? Paper presented at the International Health Economics
Association (IHEA) Conference, Barcelona, Spain July 10-13, 2005. Unpublished document.
Nyamawe David (1992): African Indigenous Medicine. An anthropological perspective for
policy matters. AMREF Indigenous concepts of illness and health. Examples of from Kenya
Community.
Nyane Letsie (2007): Factors associated with ANTENATAL Care dropout among pregnant
women in Tororo District, Uganda. Master of Public Health Dissertation, Makerere University,
Kampala, Uganda.
Odaga, John and Everd Maniple (2003): Faithfulness to the mission: Effect of reducing user fees
on access to PNFP health services‖, Study Report, Uganda Martyrs University. October
Ongom Moses (2006): A comparative study of the costs of Inpatient care in private not for profit
and government hospitals in Kumi District. Master of Public health Dissertation, Makerere
University, Kampala, Uganda.
Quick J D, HogerZeil, Valasque G, Rago L (2002): Twenty -five years of essential medicines.
Bulletin of the World health Organisation, 80(11); 913-4.
Quick J D.2003. Essential medicines twenty- five years on: Closing the access gap. Health policy
and planning, 18(1); 1-3.
Reich M (2002): Public-Private Partnerships for Public Health. Cambridge, MA: Harvard
Center for Population and Development Studies;
Rigoli, F., G. Dussault (2003): "The interface between health sector reform and human resources
in health" http:// www.human-resources-health .com/content/1/1/9.

59
Ruxin J, Paluzzi J E, Wilson P A, Kruk M, Teklehaimanot A (2005): Emerging consensus in
HIV_AIDS, Malaria, tuberculosis, and access to essential medicines. The Lancet, 365(9459);
618-21.
Ssengooba F, Rahman SA, Hongoro C, Rutebemberwa E, Mustafa A, Kielmann T and McPake
B (2007): Health sector reforms and human resources in health in Uganda and Bangladesh:
mechanisms of effect. Human Resources for Health 5: 3,.
Ssengooba F (2003): Maternal situation analysis in Uganda. Health Policy Unit, London School
of Hygiene & Tropical Medicine.
UCMB (2005): Public-private partnership for Health. Looking at trends. UCMB position paper
to HPAC, April 2005. Uganda Catholic Medical BUREAU, Kampala, Uganda.
UCMB-UPMB-UMMB (2007): Facts and Figures of the PNFPs, Knowing and understanding
the facility-based PNFP Health Sub-Sector in Uganda.
UBOS (2007): 2006 Uganda demographic and health survey
UNAIDS (2006): Joint UN Programme on AIDS. Report on the global AIDS epidemic. Geneva,
2006.
WHO (2000): ―World Health Report 2000: Health System Improving performance‖.
WHO Chronicle 36 (3) 92-96. 1982. The extension of health service coverage.
WHO/MOH (2002): The effects of abolition of cost sharing in Uganda – a report on findings for
2001.
World Health Organization (2000): The World Health Report; Health systems—improving
performance. Geneva: World Health Organization, Geneva, Switzerland.
Yawe, L. B (2006): Technical Efficiency and Total Factor Productivity growth in Uganda‘s
district referral hospitals, PhD(Economics) Thesis, University of Dar es Salaam

60
APPENDICES
Appendix 1: Letter of introduction
(FOR KAGANDO HOSPITAL ADMINISTRATORS)
RE: RESEARCH ON EFFECTS OF PUBLIC-PRIVATE PARTNERSHIP ON EFFICIENCY
OF HEALTH SERVICE DELIVERY IN UGANDA: A CASE STUDY OF KAGANDO
HOSPITAL IN KASESE DISTRICT.
I am a student of Makerere University in the Faculty of Economics and Management (FEMA)
and I am undertaking research on the above topic that will lead to an award of Master of Arts in
Economic Policy and Planning of Makerere University.
Kagando hospital has been selected as a case study for the research and the Administration will
assist to respond by providing the required data based on the hospital records on the topic under
study. The data that you will provide will be treated with utmost confidentiality and under no
circumstances will it be personalized. The basic research ethics are to be observed and adhered
to.
Kindly avail the data on each of the issues raised as objectively as possible. In each section of the
checklist, instructions are given on how to categorise the data.
Your positive and quick response will be highly appreciated.
Yours faithfully,
Mugisa Masereka Godfrey
Principal Investigator
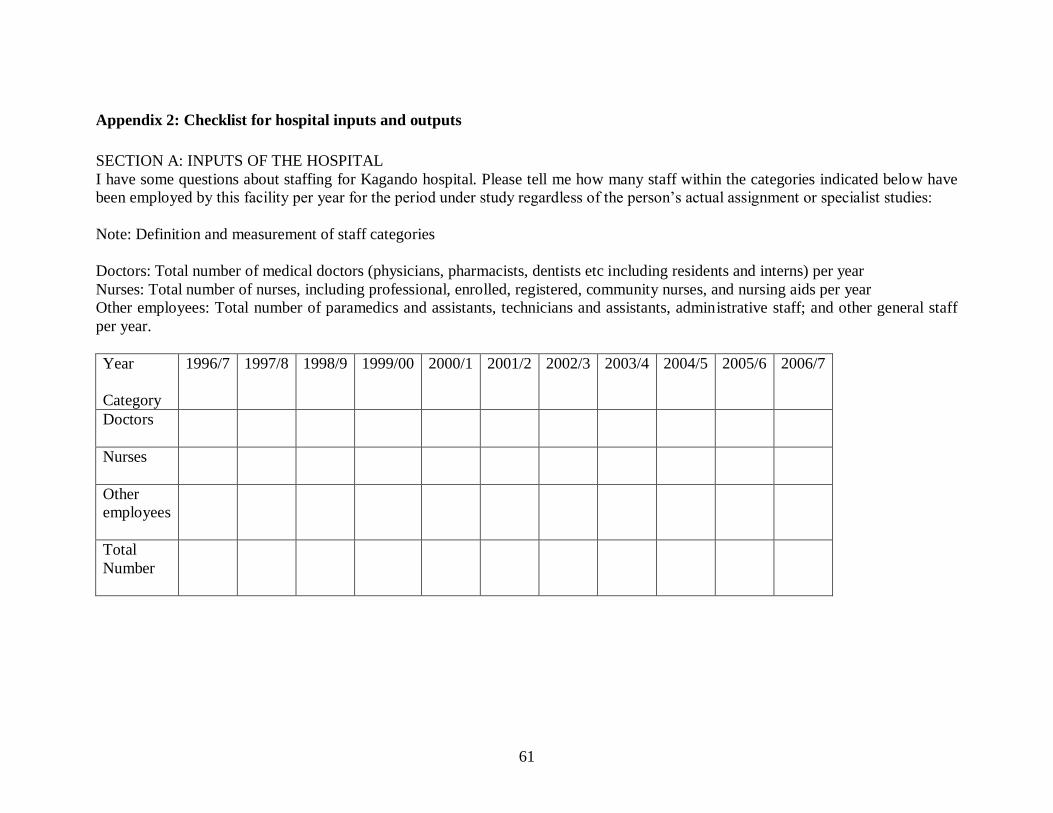
61
Appendix 2: Checklist for hospital inputs and outputs
SECTION A: INPUTS OF THE HOSPITAL
I have some questions about staffing for Kagando hospital. Please tell me how many staff within the categories indicated below have
been employed by this facility per year for the period under study regardless of the person‘s actual assignment or specialist studies:
Note: Definition and measurement of staff categories
Doctors: Total number of medical doctors (physicians, pharmacists, dentists etc including residents and interns) per year
Nurses: Total number of nurses, including professional, enrolled, registered, community nurses, and nursing aids per year
Other employees: Total number of paramedics and assistants, technicians and assistants, administrative staff; and other general staff
per year.
Year
Category
1996/7
1997/8 1998/9 1999/00 2000/1 2001/2
2002/3 2003/4 2004/5 2005/6 2006/7
Doctors
Nurses
Other
employees
Total
Number
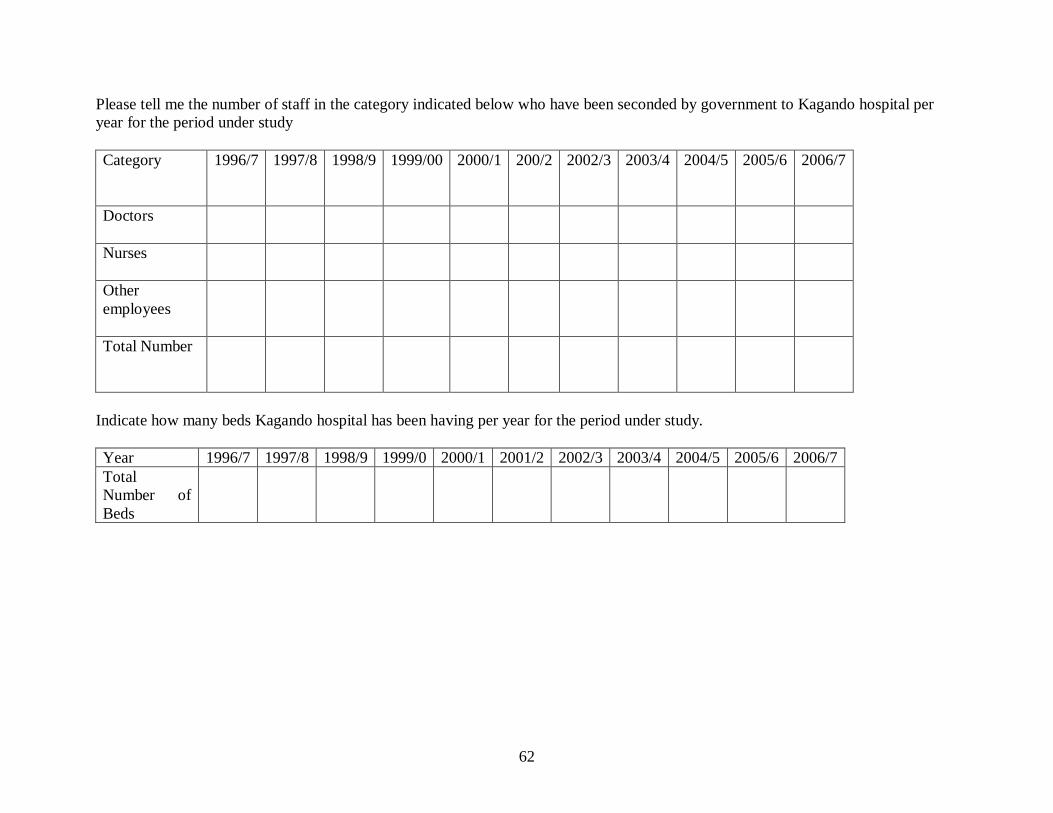
62
Please tell me the number of staff in the category indicated below who have been seconded by government to Kagando hospital per
year for the period under study
Category 1996/7
1997/8 1998/9 1999/00 2000/1 200/2
2002/3 2003/4 2004/5 2005/6 2006/7
Doctors
Nurses
Other
employees
Total Number
Indicate how many beds Kagando hospital has been having per year for the period under study.
Year 1996/7 1997/8 1998/9 1999/0 2000/1 2001/2 2002/3 2003/4 2004/5 2005/6 2006/7
Total
Number of
Beds

63
Indicate the total cost on drugs per year for the hospital for the period under study.
Year 1996/7 1997/8 1998/9 1999/0 2000/1 2001/2 2002/3 2003/4 2004/5 2005/6 2006/7
Total cost of
drugs
Now, I would like to ask you about the sources of revenue or funding for Kagando hospital. Tell me if the facility received any
revenue or funding from any of the listed sources for the period under study and the amount. Also indicate the estimated budget in the
years specified below.
Amount in Ug shillings Source of revenue
1996/7 1997/8 1998/9 1999/0 2000/1 2001/2 2002/3 2003/4 2004/5 2005/6 2006/7
Government
Contribution
to PNFP hospital
User fees
Donor
agencies
Sales
Other
income
Total revenue
Budget
Estimates
for the year
PNFP: Private Not-For-Profit

64
EXPENDITURES
(a) Direct Expenditures for Kagando Hospital per year
Expenditures 1996/7 1997/8 1998/9 1999/00 2000/01 2001/02 2002/03 2003/04 2004/05 2005/06 2006/07
Total Direct
Expenditure
Salaries local
Treatment of
staff
Training
&welfare
Canteen &
food
Drugs &
medical
Consumable
supplies
Transport
Fees waived
Power
Donation
Bad &
doubtful
debts
Primary
health care
Fistula
management

65
(b) Capital Investments costs; including costs on vehicles, buildings, furniture and equipment, and hospital equipment
Year
1996/7 1997/8 1998/9 1999/00 2000/1 2001/2 2002/3 2003/4 2004/5 2005/6 2006/7
Total capital
investment costs
Joint Medical Store Credit Line for medicines grants
Year
1996/7 1997/8 1998/9 1999/00 2000/1 2001/2 2002/3 2003/4 2004/5 2005/6 2006/7
Total Credit
Line (ugshs)
Highest paid and lowest paid employee; Gross salary per year in gushes
Year 1996/7 1997/8 1998/9 1999/00 2000/01 2001/02 2002/03 2003/04 2004/05 2005/06 2006/07
Highest
paid
employee
Lowest
paid
employee

66
SECTION B: OUTPUTS OF KAGANDO HOSPITAL
Now I would like to ask you about the health care outputs of Kagando hospital per year for the period under study.
Definition and Measurement of output Variables
Admissions: Total Admissions per year
Outpatient Department Attendances: Total Number of Outpatient department attendances per year
Immunisations: Total Number of children immunized per year
Deliveries: Total Number of Deliveries in the hospital per year
Antenatal Care: Total Number of mothers attending Antenatal Care per year
Year
Output
Variables
1996/7 1997/8
1998/9 1999/0 2000/1 2001/2 2002/3 2003/4 2004/5 2005/6 2006/7
Admissions
Outpatient
attendances
Deliveries
Immunizati
ons
Antenatal
Care(ANC)
Surgical
operations