Effect of Pedestrian Buck Contact Area and Force … of the components of the pedestrian buck need...
12
Abstract In order to develop requirements for designing a pedestrian buck, this study conducted two parametric studies that investigated the effect of the vehicle stiffness characteristics and the area of contact between the pedestrian pelvis and lower limb and a vehicle on pedestrian pelvis and lower limb injury measures. The parametric study for different vehicle stiffness characteristics was conducted using a human finite element (FE) model and simplified vehicle models with different front shapes for which stiffness parameters were varied. With regard to the contact area, a prescribed force model representing the contact force time histories from a vehicle was developed and applied to the human FE model, without using a vehicle model, to allow change in the contact area while maintaining the total force magnitude. It was found that maintaining the peak force magnitude is much more important than the maximum deflection of the stiffness characteristics and that accurate representation of the impacted body region is much more significant than the contact area, in reproducing the maximum injury measures. Keywords Buck, Contact area, Finite Element Method, Injury, Pedestrians I. INTRODUCTION Pedestrian protection has been one of the major issues in traffic safety in the world [1]. For the purpose of mitigating pedestrian injuries, many studies have been conducted in an attempt to clarify injury mechanisms in car-to-pedestrian accidents. As one of such efforts, a full-scale pedestrian dummy has been developed that represents a mid-sized male [2]. In addition, information reports have been developed and published under the auspices of the Society of Automotive Engineers Human Biomechanics And Simulations Standards Steering Committee that specify performance specifications for full-body pedestrian dummies, including the whole body kinematics and the biofidelity at the component level [3][4]. In one of the information reports (J2868), an example is presented with regard to the trajectory corridors of different body segments obtained from the full-scale car-pedestrian impact tests using Post Mortem Human Subjects (PMHSs) and a vehicle buck. Since the vehicle buck used in this experiment represents a specific passenger vehicle, questions have been raised on the specific vehicle used, in terms of both the future availability of the vehicle and the representativeness of the vehicle in real world car-pedestrian collisions. In order to address this issue, some of the past studies attempted to develop pedestrian bucks that represent the vehicle front shape and stiffness characteristics with simple structures. Untaroiu et al. [5] developed two FE models of pedestrian bucks that represent a mid-sized sedan and a large sedan, and conducted impact simulations using a pedestrian dummy FE model against a full vehicle FE model along with the pedestrian buck FE model representing the corresponding vehicle. They confirmed a good correlation of the upper body kinematics between the full vehicle and buck models. Similarly, Suzuki et al. [6] conducted car-pedestrian impact simulations using a human FE model against the full vehicle and buck FE models used by Untaroiu et al. for representing a mid-sized sedan, and compared the upper body kinematics and pelvis and lower limb injury measures. It was found that the upper body kinematics and the wave profiles of the injury measure time histories matched well with the vehicle and buck models. However, it was also concluded that the geometric and stiffness characteristics along with the rate sensitivity, effective mass and crash stroke of Miwako Ikeda is Engineer (e-mail; [email protected]), Shunji Suzuki is Assistant Chief Engineer (e-mail; [email protected]), and Yukou Takahashi is Chief Engineer (e-mail; [email protected]) at Honda R&D Co., Ltd. Automobile R&D Center in Japan (tel; +81-28-677-3311). Shinsuke Oda is Technical manager at Autoliv Japan Ltd. (e-mail; [email protected], tel; +81-45-475-3989). Rikard Fredriksson is Research Engineer (email; [email protected]), and Bengt Pipkorn is Technical Specialist (email; [email protected]) at Autoliv Research (tel; +46-322-626300). Effect of Pedestrian Buck Contact Area and Force-Deflection Property on Pedestrian Pelvis and Lower Limb Injuries Miwako Ikeda 1 , Shunji Suzuki 1 , Yukou Takahashi 1 , Shinsuke Oda 2 , Rikard Fredriksson 3 , Bengt Pipkorn 3 IRC-12-26 IRCOBI Conference 2012 - 182 -
Transcript of Effect of Pedestrian Buck Contact Area and Force … of the components of the pedestrian buck need...

Abstract In order to develop requirements for designing a pedestrian buck, this study conducted two parametric studies that investigated the effect of the vehicle stiffness characteristics and the area of contact between the pedestrian pelvis and lower limb and a vehicle on pedestrian pelvis and lower limb injury measures. The parametric study for different vehicle stiffness characteristics was conducted using a human finite element (FE) model and simplified vehicle models with different front shapes for which stiffness parameters were varied. With regard to the contact area, a prescribed force model representing the contact force time histories from a vehicle was developed and applied to the human FE model, without using a vehicle model, to allow change in the contact area while maintaining the total force magnitude. It was found that maintaining the peak force magnitude is much more important than the maximum deflection of the stiffness characteristics and that accurate representation of the impacted body region is much more significant than the contact area, in reproducing the maximum injury measures. Keywords Buck, Contact area, Finite Element Method, Injury, Pedestrians
I. INTRODUCTION
Pedestrian protection has been one of the major issues in traffic safety in the world [1]. For the purpose of
mitigating pedestrian injuries, many studies have been conducted in an attempt to clarify injury mechanisms in
car-to-pedestrian accidents. As one of such efforts, a full-scale pedestrian dummy has been developed that
represents a mid-sized male [2]. In addition, information reports have been developed and published under the
auspices of the Society of Automotive Engineers Human Biomechanics And Simulations Standards Steering
Committee that specify performance specifications for full-body pedestrian dummies, including the whole body
kinematics and the biofidelity at the component level [3][4]. In one of the information reports (J2868), an
example is presented with regard to the trajectory corridors of different body segments obtained from the
full-scale car-pedestrian impact tests using Post Mortem Human Subjects (PMHSs) and a vehicle buck. Since the
vehicle buck used in this experiment represents a specific passenger vehicle, questions have been raised on the
specific vehicle used, in terms of both the future availability of the vehicle and the representativeness of the
vehicle in real world car-pedestrian collisions.
In order to address this issue, some of the past studies attempted to develop pedestrian bucks that
represent the vehicle front shape and stiffness characteristics with simple structures. Untaroiu et al. [5]
developed two FE models of pedestrian bucks that represent a mid-sized sedan and a large sedan, and
conducted impact simulations using a pedestrian dummy FE model against a full vehicle FE model along with
the pedestrian buck FE model representing the corresponding vehicle. They confirmed a good correlation of
the upper body kinematics between the full vehicle and buck models. Similarly, Suzuki et al. [6] conducted
car-pedestrian impact simulations using a human FE model against the full vehicle and buck FE models used by
Untaroiu et al. for representing a mid-sized sedan, and compared the upper body kinematics and pelvis and
lower limb injury measures. It was found that the upper body kinematics and the wave profiles of the injury
measure time histories matched well with the vehicle and buck models. However, it was also concluded that
the geometric and stiffness characteristics along with the rate sensitivity, effective mass and crash stroke of
Miwako Ikeda is Engineer (e-mail; [email protected]), Shunji Suzuki is Assistant Chief Engineer (e-mail; [email protected]), and Yukou Takahashi is Chief Engineer (e-mail; [email protected]) at Honda R&D Co., Ltd. Automobile R&D Center in Japan (tel; +81-28-677-3311). Shinsuke Oda is Technical manager at Autoliv Japan Ltd. (e-mail; [email protected], tel; +81-45-475-3989). Rikard Fredriksson is Research Engineer (email; [email protected]), and Bengt Pipkorn is Technical Specialist (email; [email protected]) at Autoliv Research (tel; +46-322-626300).
Effect of Pedestrian Buck Contact Area and Force-Deflection Property on Pedestrian Pelvis and Lower Limb Injuries
Miwako Ikeda1, Shunji Suzuki1, Yukou Takahashi1, Shinsuke Oda2, Rikard Fredriksson
3, Bengt Pipkorn
3
IRC-12-26 IRCOBI Conference 2012
- 182 -

some of the components of the pedestrian buck need to be modified in order to more accurately reproduce
time histories of the pelvis and lower limb injury measures. Takahashi et al. [7][8] developed simplified vehicle
models representing three different types of vehicles with simple structures for investigating the effect of
simplification of stiffness characteristics of front-end structures on pedestrian injury measures in car-pedestrian
collisions. They found that the maximum injury measures highly depend on the peak force magnitude, and that
maximum injury measures for the pelvis and lower limb could be reproduced with the accuracy of ±10%
provided that the peak force magnitude and the deflection and the absorbed energy up to the peak force were
conserved, regardless of the stiffness curves up to the peak force. Although the study provided a guideline for
the stiffness characteristics of a pedestrian buck by showing the significance of some of the stiffness
parameters, the relationship between the accuracy of the representation of these stiffness parameters and the
accuracy of the injury measure prediction still requires further clarifications, since such information is deemed
necessary when developing an actual pedestrian buck with a certain target of the accuracy of the injury
measure prediction. In addition, the effect of the contact area still needs to be investigated, considering the
difficulties in precisely reproducing the contact area time histories using simplified buck components.
The goal of this study was to quantitatively investigate the effect of the change in the peak force magnitude
and the deflection at the peak force, and the effect of the change in the contact area between the pedestrian
and the vehicle, on pedestrian pelvis and lower limb injury measures.
II. METHODS
Effect of Change in Peak Force Magnitude and Deflection at Peak Force
Vehicle Models: Simplified vehicle models used in this study were taken from those developed in our
previous study by Takahashi et al. [7] (Fig. 1). Three types of vehicles with different front shapes were selected
in order to represent different loading patterns to the pelvis of a pedestrian. Vehicle A representing a
sedan-type vehicle simulated the pelvis loading through the acetabulum due to direct loading to the leg and
thigh. Vehicle B representing an SUV reproduced the pelvis loading through the acetabulum due to direct
loading to the greater trochanter. Vehicle C representing a minivan represented the direct loading to the iliac
wing. Each model consisted of four components: the hood, the grille, the bumper, and the bumper lower (the
lower part of the bumper). These components were modeled as rigid bodies and were connected via springs to
a node to which the mass was added in such a way that the total mass of the vehicle model is identical to that
of the actual vehicle. In terms of the degree of freedom of the motion of each component, the motion in the
x-direction (vehicle longitudinal direction) was allowed for all the vehicles and their components. Since the
result of the previous study using an FE full vehicle model showed that the peak contact force in the z-direction
from the hood was significant for Vehicle A, the motion in the z-direction (vertical direction) of the hood of
Vehicle A was also set free. A multi-linear representation of the stiffness curves that was found to be able to
reproduce most of peak pelvis and lower limb injury measures within 15% was used to determine the baseline
stiffness curves. Fig.2 shows an example of the stiffness curves (Grille of Vehicle A in the x-direction).
Y XZ
Hood (X, Z: Vehicle A Only)
Grille (X)
BumperFace (X)
BumperLower (X)
Vehicle A Vehicle B Vehicle C
ConcentratedMass
0
1000
2000
3000
0.00 0.02 0.04 0.06 0.08 0.10
Fo
rce
(N
)
Deflection (m)
Fig. 1. Simplified Vehicle Models Fig. 2. Multi-linear Representation of
Stiffness Curves
Human FE Model: A human FE model representing a mid-sized male pedestrian used in this study was
developed by Takahashi et al. [9] and Ikeda et al. [10] (Fig.3). The pelvis and the lower limb were modeled using
shell and solid elements to accurately represent the geometry of these body regions. The material property and
failure characteristics were determined from the literature, and were validated against published quasi-static
IRC-12-26 IRCOBI Conference 2012
- 183 -
0
1000
2000
3000
0.00 0.02 0.04 0.06 0.08 0.10
Fo
rce
(N
)
Deflection (m)
Baseline
Scaled±10%
Scaled±20%
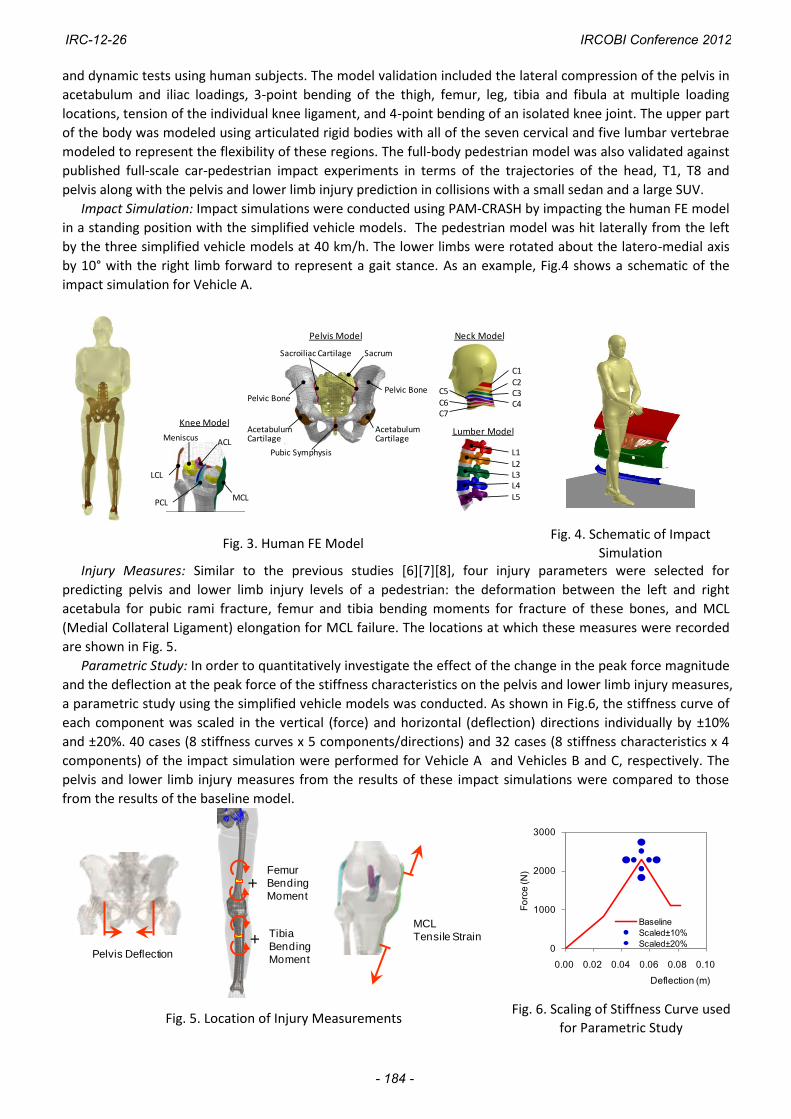
and dynamic tests using human subjects. The model validation included the lateral compression of the pelvis in
acetabulum and iliac loadings, 3-point bending of the thigh, femur, leg, tibia and fibula at multiple loading
locations, tension of the individual knee ligament, and 4-point bending of an isolated knee joint. The upper part
of the body was modeled using articulated rigid bodies with all of the seven cervical and five lumbar vertebrae
modeled to represent the flexibility of these regions. The full-body pedestrian model was also validated against
published full-scale car-pedestrian impact experiments in terms of the trajectories of the head, T1, T8 and
pelvis along with the pelvis and lower limb injury prediction in collisions with a small sedan and a large SUV.
Impact Simulation: Impact simulations were conducted using PAM-CRASH by impacting the human FE model
in a standing position with the simplified vehicle models. The pedestrian model was hit laterally from the left
by the three simplified vehicle models at 40 km/h. The lower limbs were rotated about the latero-medial axis
by 10° with the right limb forward to represent a gait stance. As an example, Fig.4 shows a schematic of the
impact simulation for Vehicle A.
Pelvis Model
Knee ModelLumber Model
Neck Model
C1
C2C3C4
C5C6C7
L1
L2L3L4L5
PCL
Meniscus ACL
MCL
LCL
Sacroiliac Cartilage
Pelvic Bone
Sacrum
Pelvic Bone
Pubic Symphysis
Acetabulum Cartilage
Acetabulum Cartilage
Fig. 3. Human FE Model Fig. 4. Schematic of Impact
Simulation Injury Measures: Similar to the previous studies [6][7][8], four injury parameters were selected for
predicting pelvis and lower limb injury levels of a pedestrian: the deformation between the left and right
acetabula for pubic rami fracture, femur and tibia bending moments for fracture of these bones, and MCL
(Medial Collateral Ligament) elongation for MCL failure. The locations at which these measures were recorded
are shown in Fig. 5.
Parametric Study: In order to quantitatively investigate the effect of the change in the peak force magnitude
and the deflection at the peak force of the stiffness characteristics on the pelvis and lower limb injury measures,
a parametric study using the simplified vehicle models was conducted. As shown in Fig.6, the stiffness curve of
each component was scaled in the vertical (force) and horizontal (deflection) directions individually by ±10%
and ±20%. 40 cases (8 stiffness curves x 5 components/directions) and 32 cases (8 stiffness characteristics x 4
components) of the impact simulation were performed for Vehicle A and Vehicles B and C, respectively. The
pelvis and lower limb injury measures from the results of these impact simulations were compared to those
from the results of the baseline model.
Pelvis Deflection
MCL
Tensile Strain
+
+
Femur
Bending
Moment
Tibia
Bending
Moment
Fig. 5. Location of Injury Measurements Fig. 6. Scaling of Stiffness Curve used
for Parametric Study
IRC-12-26 IRCOBI Conference 2012
- 184 -

Effect of Change in Contact Area
Development of Baseline Prescribed Force-Time Model: Since the contact area between a pedestrian and a
vehicle varies during a collision, it is impossible to isolate the effect of the contact area from the impact
simulations using vehicle models. In order to purely isolate the effect of the contact area while maintaining the
magnitude of the applied force, this study developed a methodology to model the forces applied to a
pedestrian from a vehicle without using a vehicle model. The baseline Prescribed Force-Time (PFT) model was
developed, for which prescribed force time histories were directly applied to the nodes of a surface of the
human FE model. Since the load generated by the contact with a vehicle was represented by a prescribed force
time history, no vehicle model was used for the PFT model. The baseline PFT model was developed for each
vehicle using the following procedure:
1. The distribution of the contact pressure and the time histories of the contact area and contact force
magnitude were identified for each combination of the pedestrian body region and the component of
the vehicle from the impact simulation using a full FE vehicle model.
2. The contact area on the surface of the human FE model was divided into small regions based on the
distribution of the contact pressure at the time of the peak force generated by each component.
3. The time histories of the contact force for each combination of the small region and the vehicle
component were calculated.
4. The prescribed force time histories determined in step 3 were evenly distributed among the nodes
constituting each small region of the human FE model.
5. Peak injury measures from the model obtained in step 4 were compared to those from the impact
simulation using the full FE vehicle model to calculate the difference of the peak measures.
6. Steps 2 through 5 were repeated until all the differences in the injury measures fell within ±15% of the
results from the full FE vehicle model. The threshold of the difference was determined as 15% with reference to the development of the simplified
vehicle models in the previous study. Since Takahashi et al. [9] found that the peak pelvis injury measure is
affected by the effective mass of the contralateral lower limb, the regions on the right (contralateral) limb were
also investigated. The segmentations of the small regions are shown in Figs.7 through 9 for Vehicles A, B and C,
respectively. The comparisons of the injury measures between the full FE vehicle model and the baseline PFT
model are shown in TABLE I and Fig.10.
12 Areas
14 Areas
15 Areas
Fig. 7. Segmentation of Small
Region in Baseline PFT Model for Vehicle A
Fig. 8. Segmentation of Small Region in Baseline PFT Model for
Vehicle B
Fig. 9. Segmentation of Small Region in Baseline PFT Model for
Vehicle C
TABLE I
COMPARISON OF PEAK INJURY MEASURES BETWEEN FULL FE VEHICLE MODEL AND PFT MODEL
Pelvis Deformation
(mm) and Difference
Femur Bending Moment
(Nm) and Difference
MCL Tensile Strain
(-) and Difference
Tibia Bending Moment
(Nm) and Difference
FE Baseline
PFT Difference FE
Baseline
PFT Difference FE
Baseline
PFT Difference FE
Baseline
PFT Difference
Vehicle A 1.59 1.71 7.5% 264 253 -4.2% 0.101 0.092 -8.9% 242 230 -5.0%
Vehicle B 5.48 5.42 -1.1% 272 265 -2.6% 0.106 0.118 11.3% 274 249 -9.1%
Vehicle C 4.8 4.31 -10.2% 194 216 11.3% 0.089 0.101 13.5% 265 246 -7.2%
IRC-12-26 IRCOBI Conference 2012
- 185 -
Pelvis Deflection Femur Bending Moment MCL Tensile Strain Tibia Bending MomentVehicle A
Vehicle B
Vehicle C
-1
0
1
2
0 0.01 0.02 0.03 0.04 0.05
Def
lect
ion
(m
m)
/
Time (s)
FE Prescribed F-t-100
0
100
200
300
0 0.01 0.02 0.03 0.04 0.05
Mo
men
t (N
m)
Time (s)
-0.020
0.020.040.060.08
0.10.12
0 0.01 0.02 0.03 0.04 0.05
Ten
sile
str
ain
(-)
Time (s)
-100
0
100
200
300
0 0.01 0.02 0.03 0.04 0.05
Mo
men
t (N
m)
/
Time (s)
-2
0
2
4
6
0 0.01 0.02 0.03 0.04 0.05
Def
lect
ion
(m
m)
/
Time (s)
FE Prescribed F-t-100
0
100
200
300
0 0.01 0.02 0.03 0.04 0.05
Mo
men
t (N
m)
Time (s)
-0.05
0
0.05
0.1
0.15
0 0.01 0.02 0.03 0.04 0.05
Ten
sile
str
ain
(-)
Time (s)
-100
0
100
200
300
0 0.01 0.02 0.03 0.04 0.05
Mo
men
t (N
m)
/
Time (s)
-10123456
0 0.01 0.02 0.03 0.04 0.05
Def
lect
ion
(m
m)
/
Time (s)
FE Prescribed F-t
-100
0
100
200
300
0 0.01 0.02 0.03 0.04 0.05
Mo
men
t (N
m)
Time (s)
-0.020
0.020.040.060.08
0.10.12
0 0.01 0.02 0.03 0.04 0.05
Ten
sile
str
ain
(-)
Time (s)
-100
0
100
200
300
0 0.01 0.02 0.03 0.04 0.05
Mo
men
t (N
m)
/
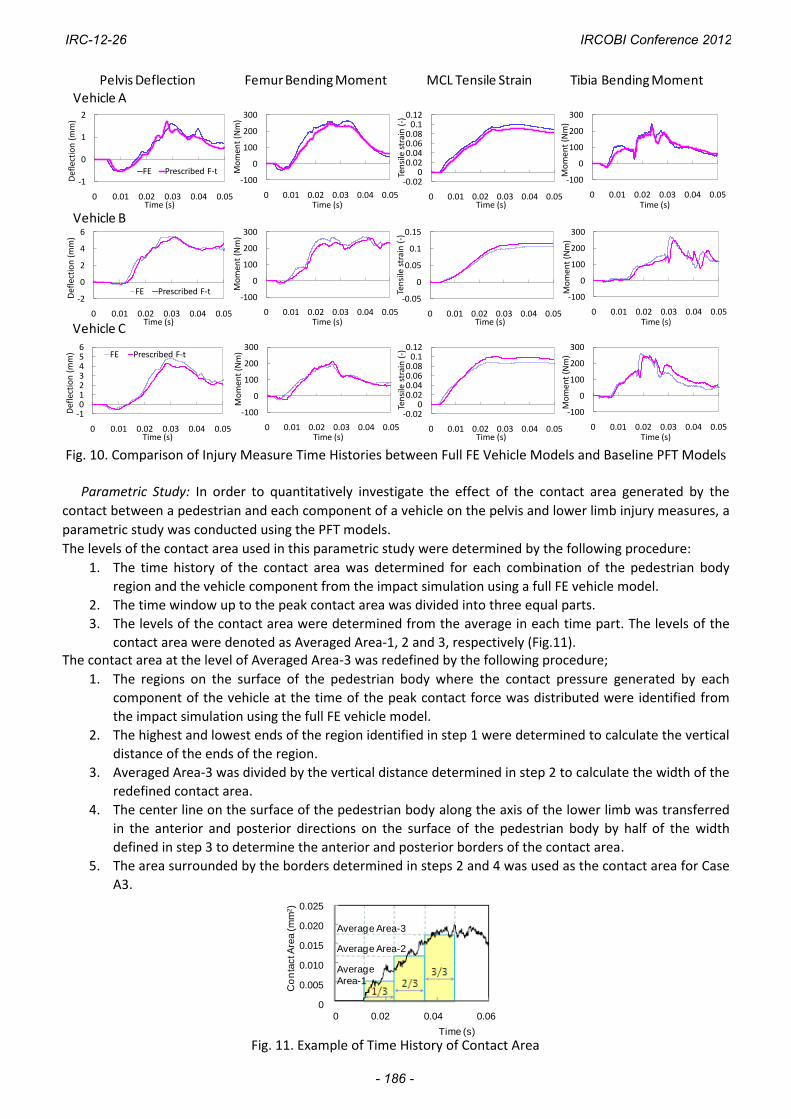
Time (s) Fig. 10. Comparison of Injury Measure Time Histories between Full FE Vehicle Models and Baseline PFT Models
Parametric Study: In order to quantitatively investigate the effect of the contact area generated by the
contact between a pedestrian and each component of a vehicle on the pelvis and lower limb injury measures, a
parametric study was conducted using the PFT models.
The levels of the contact area used in this parametric study were determined by the following procedure:
1. The time history of the contact area was determined for each combination of the pedestrian body
region and the vehicle component from the impact simulation using a full FE vehicle model.
2. The time window up to the peak contact area was divided into three equal parts.
3. The levels of the contact area were determined from the average in each time part. The levels of the
contact area were denoted as Averaged Area-1, 2 and 3, respectively (Fig.11). The contact area at the level of Averaged Area-3 was redefined by the following procedure;
1. The regions on the surface of the pedestrian body where the contact pressure generated by each
component of the vehicle at the time of the peak contact force was distributed were identified from
the impact simulation using the full FE vehicle model.
2. The highest and lowest ends of the region identified in step 1 were determined to calculate the vertical
distance of the ends of the region.
3. Averaged Area-3 was divided by the vertical distance determined in step 2 to calculate the width of the
redefined contact area.
4. The center line on the surface of the pedestrian body along the axis of the lower limb was transferred
in the anterior and posterior directions on the surface of the pedestrian body by half of the width
defined in step 3 to determine the anterior and posterior borders of the contact area.
5. The area surrounded by the borders determined in steps 2 and 4 was used as the contact area for Case
A3.
0 0.02 0.04 0.06
Time (s)
Co
nta
ct A
rea (m
m2)
0
0.025
0.020
0.015
0.010
0.005
Average Area-3
Average Area-2
Average
Area-1
Fig. 11. Example of Time History of Contact Area
IRC-12-26 IRCOBI Conference 2012
- 186 -

This redefinition of the contact area was necessary to change the contact area between Averaged Area-1, 2 and 3 in a consistent manner. Since Averaged Area-1 and 2 are smaller than Averaged Area-3, the locations of contact area at the levels of Averaged Area-1 and 2 were defined by the following procedure;
1. Two vertically different locations of the contact area for Averaged Area-1 and 2 were determined.
2. The same anterior and posterior borders of the contact area as those for Averaged Area-3 were used
for Averaged Area-1 or 2 as well.
3. For the upper and lower locations of the contact area for Averaged Area-1 and 2, the lower and upper
borders were determined in such a way that the upper and lower borders of the contact area
redefined for Averaged Area-3, respectively, were used, and the area coincides with Averaged Area-1
and 2 (Cases A1-U and A2-U for the upper location, Cases A1-L and A2-L for the lower location).
Since Averaged Area-3 for the bumper lower was significantly smaller than those for the other components
in all vehicles, the effect of the size of the contact area of the bumper lower was not investigated in this
parametric study. In addition, since Averaged Area-3 for the grille and bumper were significantly smaller than
those for the hood in all vehicles, only Cases A1-U, A1-L, and A3 were selected for the grille and bumper in the
parametric study. The force-time history to be applied to the nodes in each contact area defined above was
determined in such a way that the total force applied to the small regions of the baseline PFT model
representing the contact with the corresponding vehicle component was evenly distributed among the nodes.
The combinations of the component and the level of the contact area are shown in TABLE II. The location of the
contact area in Cases H-A1-U, H-A1-L, G-A1-U, G-A1-L, B-A1-U, and B-A1-L is shown in Figs.12 through 14.
TABLE II COMBINATIONS OF THE COMPONENT AND THE LEVEL OF CONTACT AREA
Case
ID Component
Level of
Contact Area
Location
in the A3
Case
ID Component
Level of Contact
Area
Location
in the A3
H-A1-U Hood A1 Upper G-A1-U Grille A1 Upper
H-A1-L Hood A1 Lower G-A1-L Grille A1 Lower
H-A2-U Hood A2 Upper G-A3 Grille A3 -
H-A2-L Hood A2 Lower B-A1-U Bumper A1 Upper
H-A3 Hood A3 - B-A1-L Bumper A1 Lower
- - - - B-A3 Bumper A3 -
III. RESULTS
Effect of Change in Peak Force Magnitude and Deflection at Peak Force
The comparisons of the injury measures for the pelvis and lower limb are summarized in TABLEs III through
VIII.
In the cases using the stiffness curves scaled in the direction of the deflection, all differences between these
cases and the baseline model were within the range of ±5%. In the cases using the stiffness curves scaled in the
direction of the force at the level of ±10%, all differences between these cases and the baseline model were
within the range of ±8%.
Fig. 12. Locations of the Contact Area for Vehicle A
Fig. 13. Locations of the Contact Area for Vehicle B
Fig. 14. Location of the Contact Area for Vehicle C
H-A1-U
H-A1-L
G-A1-L
G-A1-U
B-A1-L
B-A1-U
H-A1-U
H-A1-L
G-A1-L
G-A1-U
B-A1-L
B-A1-U
H-A1-U
H-A1-L
G-A1-L
G-A1-U
B-A1-L
B-A1-U
IRC-12-26 IRCOBI Conference 2012
- 187 -

TABLE III COMPARISONS OF INJURY MEASURES BETWEEN BASELINE MODEL AND MODELS WITH DIFFERENT STIFFNESS CURVES SCALED IN
DEFLECTION FOR VEHICLE A (BPR LWR STANDS FOR BUMPER LOWER)
Component
Scaled
Factor
Pelvis Deformation
(mm) and Difference
Femur Bending
Moment (Nm) and
Difference
MCL Tensile Strain
(-) and Difference
Tibia Bending Moment
(Nm) and Difference
Baseline - 1.85 - 280 - 0.097 - 216 -
Hood -10% 1.85 -0.2% 283 1.2% 0.097 0.2% 216 -0.2%
Grille -10% 1.84 -0.7% 272 -2.9% 0.097 -0.1% 221 2.5%
Bumper -10% 1.86 0.4% 275 -1.9% 0.099 1.5% 217 0.4%
BPR LWR -10% 1.89 2.2% 274 -2.3% 0.098 0.6% 221 2.2%
Hood (Z) -10% 1.88 1.6% 282 0.6% 0.097 -0.3% 214 -1.0%
Hood +10% 1.84 -0.3% 277 -0.9% 0.097 0.0% 215 -0.3%
Grille +10% 1.88 1.7% 285 1.9% 0.099 1.9% 217 0.5%
Bumper +10% 1.86 0.6% 280 0.1% 0.098 0.2% 217 0.6%
BPR LWR +10% 1.83 -0.9% 282 0.7% 0.098 0.9% 214 -0.9%
Hood (Z) +10% 1.84 -0.4% 279 -0.5% 0.098 0.4% 215 -0.2%
Hood -20% 1.86 0.5% 286 2.3% 0.097 0.2% 217 0.5%
Grille -20% 1.84 -0.4% 269 -3.8% 0.097 -0.7% 224 3.6%
Bumper -20% 1.86 0.5% 282 0.9% 0.097 -0.1% 217 0.5%
BPR LWR -20% 1.86 0.4% 275 -1.9% 0.098 1.0% 217 0.4%
Hood (Z) -20% 1.91 3.1% 281 0.5% 0.097 -0.7% 216 -0.1%
Hood +20% 1.85 0.0% 276 -1.4% 0.097 -0.2% 216 0.0%
Grille +20% 1.91 3.4% 288 2.7% 0.099 1.9% 217 0.3%
Bumper +20% 1.86 0.5% 279 -0.4% 0.098 0.4% 217 0.5%
BPR LWR +20% 1.81 -2.2% 283 1.2% 0.098 1.0% 211 -2.2%
TABLE IV COMPARISONS OF INJURY MEASURES BETWEEN BASELINE MODEL AND MODELS WITH DIFFERENT STIFFNESS CURVES SCALED IN
FORCE FOR VEHICLE A (BPR LWR FOR BUMPER LOWER)
Component
Scaled
Factor
Pelvis Deformation
(mm) and Difference
Femur Bending
Moment (Nm) and
Difference
MCL Tensile Strain
(-) and Difference
Tibia Bending Moment
(Nm) and Difference
Baseline - 1.85 - 280 - 0.097 - 216 -
Hood -10% 1.84 -0.4% 278 -0.7% 0.097 -0.5% 215 -0.4%
Grille -10% 1.82 -1.6% 265 -5.4% 0.097 -0.1% 219 1.5%
Bumper -10% 1.73 -6.5% 275 -1.8% 0.097 -0.6% 202 -6.5%
BPR LWR -10% 1.82 -1.4% 285 2.0% 0.098 0.6% 213 -1.4%
Hood (Z) -10% 1.83 -1.2% 279 -0.4% 0.098 0.6% 217 0.5%
Hood +10% 1.87 1.0% 283 1.1% 0.098 0.7% 218 1.0%
Grille +10% 1.90 2.5% 289 3.2% 0.099 1.7% 216 0.1%
Bumper +10% 2.00 8.1% 278 -0.6% 0.099 2.0% 234 8.1%
BPR LWR +10% 1.89 2.0% 274 -2.1% 0.098 0.6% 220 2.0%
Hood (Z) +10% 1.87 1.3% 279 -0.4% 0.097 0.1% 214 -1.0%
Hood -20% 1.84 -0.6% 277 -1.1% 0.096 -1.0% 215 -0.6%
Grille -20% 1.81 -2.1% 260 -7.2% 0.096 -1.6% 219 1.5%
Bumper -20% 1.60 -13.7% 264 -5.9% 0.096 -1.1% 186 -13.7%
BPR LWR -20% 1.83 -1.1% 285 1.8% 0.099 1.9% 214 -1.1%
Hood (Z) -20% 1.81 -2.1% 279 -0.3% 0.097 0.0% 217 0.3%
Hood +20% 1.84 -0.7% 283 1.1% 0.099 1.7% 215 -0.7%
Grille +20% 1.94 4.9% 303 8.1% 0.101 3.8% 215 -0.3%
Bumper +20% 2.15 16.1% 283 1.2% 0.100 2.5% 251 16.1%
BPR LWR +20% 1.90 2.9% 274 -2.3% 0.098 0.2% 222 2.9%
IRC-12-26 IRCOBI Conference 2012
- 188 -
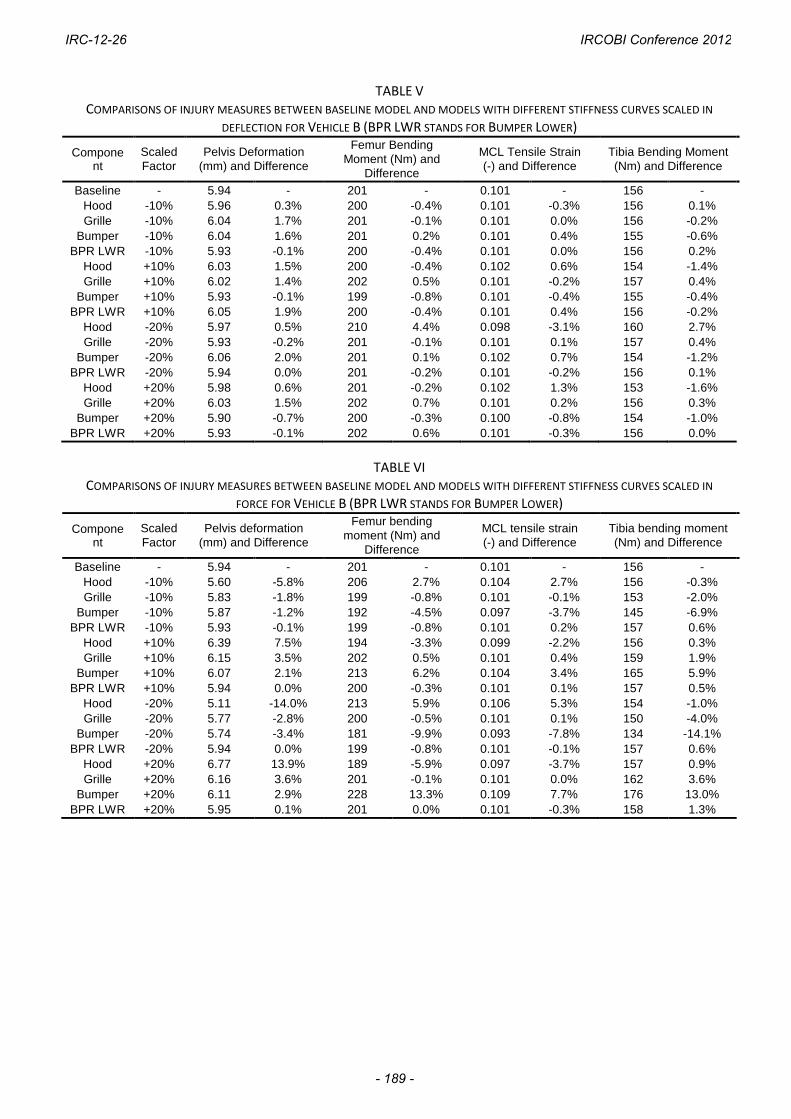
TABLE V COMPARISONS OF INJURY MEASURES BETWEEN BASELINE MODEL AND MODELS WITH DIFFERENT STIFFNESS CURVES SCALED IN
DEFLECTION FOR VEHICLE B (BPR LWR STANDS FOR BUMPER LOWER)
Component
Scaled
Factor
Pelvis Deformation
(mm) and Difference
Femur Bending
Moment (Nm) and
Difference
MCL Tensile Strain
(-) and Difference
Tibia Bending Moment
(Nm) and Difference
Baseline - 5.94 - 201 - 0.101 - 156 -
Hood -10% 5.96 0.3% 200 -0.4% 0.101 -0.3% 156 0.1%
Grille -10% 6.04 1.7% 201 -0.1% 0.101 0.0% 156 -0.2%
Bumper -10% 6.04 1.6% 201 0.2% 0.101 0.4% 155 -0.6%
BPR LWR -10% 5.93 -0.1% 200 -0.4% 0.101 0.0% 156 0.2%
Hood +10% 6.03 1.5% 200 -0.4% 0.102 0.6% 154 -1.4%
Grille +10% 6.02 1.4% 202 0.5% 0.101 -0.2% 157 0.4%
Bumper +10% 5.93 -0.1% 199 -0.8% 0.101 -0.4% 155 -0.4%
BPR LWR +10% 6.05 1.9% 200 -0.4% 0.101 0.4% 156 -0.2%
Hood -20% 5.97 0.5% 210 4.4% 0.098 -3.1% 160 2.7%
Grille -20% 5.93 -0.2% 201 -0.1% 0.101 0.1% 157 0.4%
Bumper -20% 6.06 2.0% 201 0.1% 0.102 0.7% 154 -1.2%
BPR LWR -20% 5.94 0.0% 201 -0.2% 0.101 -0.2% 156 0.1%
Hood +20% 5.98 0.6% 201 -0.2% 0.102 1.3% 153 -1.6%
Grille +20% 6.03 1.5% 202 0.7% 0.101 0.2% 156 0.3%
Bumper +20% 5.90 -0.7% 200 -0.3% 0.100 -0.8% 154 -1.0%
BPR LWR +20% 5.93 -0.1% 202 0.6% 0.101 -0.3% 156 0.0%
TABLE VI COMPARISONS OF INJURY MEASURES BETWEEN BASELINE MODEL AND MODELS WITH DIFFERENT STIFFNESS CURVES SCALED IN
FORCE FOR VEHICLE B (BPR LWR STANDS FOR BUMPER LOWER)
Component
Scaled
Factor
Pelvis deformation
(mm) and Difference
Femur bending
moment (Nm) and
Difference
MCL tensile strain
(-) and Difference
Tibia bending moment
(Nm) and Difference
Baseline - 5.94 - 201 - 0.101 - 156 -
Hood -10% 5.60 -5.8% 206 2.7% 0.104 2.7% 156 -0.3%
Grille -10% 5.83 -1.8% 199 -0.8% 0.101 -0.1% 153 -2.0%
Bumper -10% 5.87 -1.2% 192 -4.5% 0.097 -3.7% 145 -6.9%
BPR LWR -10% 5.93 -0.1% 199 -0.8% 0.101 0.2% 157 0.6%
Hood +10% 6.39 7.5% 194 -3.3% 0.099 -2.2% 156 0.3%
Grille +10% 6.15 3.5% 202 0.5% 0.101 0.4% 159 1.9%
Bumper +10% 6.07 2.1% 213 6.2% 0.104 3.4% 165 5.9%
BPR LWR +10% 5.94 0.0% 200 -0.3% 0.101 0.1% 157 0.5%
Hood -20% 5.11 -14.0% 213 5.9% 0.106 5.3% 154 -1.0%
Grille -20% 5.77 -2.8% 200 -0.5% 0.101 0.1% 150 -4.0%
Bumper -20% 5.74 -3.4% 181 -9.9% 0.093 -7.8% 134 -14.1%
BPR LWR -20% 5.94 0.0% 199 -0.8% 0.101 -0.1% 157 0.6%
Hood +20% 6.77 13.9% 189 -5.9% 0.097 -3.7% 157 0.9%
Grille +20% 6.16 3.6% 201 -0.1% 0.101 0.0% 162 3.6%
Bumper +20% 6.11 2.9% 228 13.3% 0.109 7.7% 176 13.0%
BPR LWR +20% 5.95 0.1% 201 0.0% 0.101 -0.3% 158 1.3%
IRC-12-26 IRCOBI Conference 2012
- 189 -

TABLE VII COMPARISONS OF INJURY MEASURES BETWEEN BASELINE MODEL AND MODELS WITH DIFFERENT STIFFNESS CURVES SCALED IN
DEFLECTION FOR VEHICLE C (BPR LWR STANDS FOR BUMPER LOWER)
Component
Scaled
Factor
Pelvis deformation
(mm) and Difference
Femur bending
moment (Nm) and
Difference
MCL tensile strain
(-) and Difference
Tibia bending moment
(Nm) and Difference
Baseline - 4.00 - 201 - 0.101 - 156 -
Hood -10% 4.10 2.6% 160 0.1% 0.076 -0.1% 197 0.3%
Grille -10% 3.93 -1.7% 158 -1.4% 0.075 -0.8% 198 0.8%
Bumper -10% 3.98 -0.5% 164 2.7% 0.076 0.3% 199 1.5%
BPR LWR -10% 4.00 0.0% 160 0.1% 0.076 0.0% 196 0.0%
Hood +10% 3.93 -1.7% 161 0.8% 0.076 0.0% 195 -0.5%
Grille +10% 3.97 -0.7% 164 2.3% 0.077 1.4% 195 -0.6%
Bumper +10% 4.00 0.1% 157 -1.7% 0.076 -0.2% 193 -1.3%
BPR LWR +10% 4.01 0.3% 162 1.4% 0.076 -0.2% 197 0.3%
Hood -20% 4.19 4.8% 160 -0.1% 0.076 0.2% 197 0.3%
Grille -20% 3.91 -2.1% 155 -3.3% 0.075 -1.2% 200 1.8%
Bumper -20% 3.94 -1.4% 165 3.2% 0.076 0.6% 198 1.2%
BPR LWR -20% 3.97 -0.7% 160 -0.1% 0.076 -0.3% 195 -0.7%
Hood +20% 3.88 -3.0% 159 -0.6% 0.076 -0.2% 196 0.0%
Grille +20% 3.98 -0.5% 167 4.2% 0.077 1.4% 195 -0.8%
Bumper +20% 4.04 1.1% 153 -4.1% 0.076 -0.3% 191 -2.7%
BPR LWR +20% 4.00 0.1% 161 0.8% 0.076 0.6% 196 0.1%
TABLE VIII COMPARISONS OF INJURY MEASURES BETWEEN BASELINE MODEL AND MODELS WITH DIFFERENT STIFFNESS CURVES SCALED IN
FORCE FOR VEHICLE C (BPR LWR STANDS FOR BUMPER LOWER)
Component
Scaled
Factor
Pelvis Deformation
(mm) and Difference
Femur Bending
Moment (Nm) and
Difference
MCL Tensile Strain
(-) and Difference
Tibia Bending Moment
(Nm) and Difference
Baseline - 4.00 - 201 - 0.101 - 156 -
Hood -10% 3.90 -2.6% 160 0.3% 0.076 0.4% 198 0.9%
Grille -10% 3.91 -2.4% 161 0.5% 0.076 0.7% 198 1.1%
Bumper -10% 3.96 -1.0% 147 -8.2% 0.074 -1.9% 181 -7.5%
BPR LWR -10% 4.02 0.4% 162 1.0% 0.076 0.6% 197 0.4%
Hood +10% 4.13 3.1% 158 -1.4% 0.076 0.3% 195 -0.6%
Grille +10% 4.11 2.8% 160 0.0% 0.076 -0.1% 196 -0.1%
Bumper +10% 3.99 -0.3% 172 7.3% 0.078 3.4% 209 6.5%
BPR LWR +10% 3.99 -0.2% 161 0.4% 0.076 -0.3% 196 -0.2%
Hood -20% 3.80 -5.0% 162 1.1% 0.076 0.2% 196 0.0%
Grille -20% 3.76 -5.9% 162 1.2% 0.077 1.2% 197 0.4%
Bumper -20% 3.95 -1.3% 127 -20.9% 0.071 -6.0% 163 -16.8%
BPR LWR -20% 4.03 0.6% 164 2.6% 0.078 2.1% 197 0.6%
Hood +20% 4.21 5.2% 160 0.3% 0.076 0.1% 197 0.4%
Grille +20% 4.24 5.9% 159 -0.8% 0.076 -0.4% 198 0.8%
Bumper +20% 3.89 -2.8% 183 14.7% 0.080 5.1% 228 16.4%
BPR LWR +20% 3.95 -1.2% 162 1.1% 0.075 -0.9% 194 -1.2%
IRC-12-26 IRCOBI Conference 2012
- 190 -

Effect of Change in Contact Area
The comparisons of the pelvis and lower limb injury measures are shown in TABLEs VIIII through XI. The
differences in the peak injury measures were within the range of ±15% for all measures in H-A1-L, G-A1-U,
G-A1-L and G-A3 for Vehicle A, H-A1-L, H-A2-U, G-A1-U, G-A1-L and G-A3 for Vehicle B, and H-A1-U, H-A2-U,
H-A2-L, H-A3 and G-A3 for Vehicle C.
TABLE VIII COMPARISONS OF INJURY MEASURES BETWEEN BASELINE MODEL AND MODELS
WITH DIFFERENT CONTACT AREA FOR VEHICLE A
Case ID Pelvis Deformation
(mm) and Difference
Femur Bending Moment
(Nm) and Difference
MCL Tensile Strain
(-) and Difference
Tibia Bending Moment
(Nm) and Difference
Baseline 1.71 - 253 - 0.092 - 230 -
H-A1-U 2.46 43.9% 152 -39.9% 0.068 -25.6% 202 -12.2%
H-A1-L 1.47 -14.0% 280 10.7% 0.092 0.0% 236 2.6%
H-A2-U 1.89 10.5% 179 -29.2% 0.074 -19.6% 214 -7.0%
H-A2-L 1.31 -23.4% 221 -12.6% 0.083 -9.4% 209 -9.1%
H-A3 1.69 -1.2% 202 -20.2% 0.077 -15.5% 218 -5.2%
G-A1-U 1.6 -6.4% 249 -1.6% 0.097 5.6% 229 -0.4%
G-A1-L 1.49 -12.9% 244 -3.6% 0.101 10.8% 237 3.0%
G-A3 1.57 -8.2% 243 -4.0% 0.098 6.6% 234 1.7%
B-1-U 1.74 1.8% 310 22.5% 0.153 66.7% 218 -5.2%
B-1-L 1.67 -2.3% 239 -5.5% 0.075 -17.8% 218 -5.2%
B-A3 1.58 -7.6% 272 7.5% 0.112 22.2% 227 -1.3%
TABLE X
COMPARISONS OF INJURY MEASURES BETWEEN BASELINE MODEL AND MODELS WITH DIFFERENT CONTACT AREA FOR VEHICLE B
Case ID Pelvis Deformation
(mm) and Difference
Femur Bending Moment
(Nm) and Difference
MCL Tensile Strain
(-) and Difference
Tibia Bending Moment
(Nm) and Difference
Baseline 5.42 - 265 - 0.118 - 249 -
H-A1-U 5.45 0.6% 179 -32.5% 0.106 -10.4% 233 -6.4%
H-A1-L 5.78 6.6% 283 6.8% 0.106 -10.4% 252 1.2%
H-A2-U 5.62 3.7% 234 -11.7% 0.105 -11.2% 235 -5.6%
H-A2-L 5.64 4.1% 223 -15.8% 0.103 -12.8% 244 -2.0%
H-A3 5.79 6.8% 196 -26.0% 0.108 -8.8% 243 -2.4%
G-A1-U 5.7 5.2% 255 -3.8% 0.116 -2.4% 243 -2.4%
G-A1-L 5.2 -4.1% 267 0.8% 0.117 -0.8% 266 6.8%
G-A3 5.55 2.4% 256 -3.4% 0.116 -2.4% 252 1.2%
B-1-U 5.92 9.2% 367 38.5% 0.178 50.4% 227 -8.8%
B-1-L 5.21 -3.9% 178 -32.8% 0.124 4.8% 242 -2.8%
B-A3 5.73 5.7% 262 -1.1% 0.155 31.2% 213 -14.5%
TABLE XI
COMPARISONS OF INJURY MEASURES BETWEEN BASELINE MODEL AND MODELS WITH DIFFERENT CONTACT AREA FOR VEHICLE C
Case ID Pelvis Deformation
(mm) and Difference
Femur Bending Moment
(Nm) and Difference
MCL Tensile Strain
(-) and Difference
Tibia Bending Moment
(Nm) and Difference
Baseline 4.31 - 216 - 0.101 - 246 -
H-A1-U 3.84 -10.9% 213 -1.4% 0.100 -0.9% 248 0.8%
H-A1-L 5.39 25.1% 203 -6.0% 0.100 -0.9% 248 0.8%
H-A2-U 4.47 3.7% 211 -2.3% 0.101 0.0% 247 0.4%
H-A2-L 4.82 11.8% 207 -4.2% 0.100 -0.9% 247 0.4%
H-A3 4.56 5.8% 210 -2.8% 0.101 0.0% 248 0.8%
G-A1-U 5.24 21.6% 140 -35.2% 0.082 -18.8% 232 -5.7%
G-A1-L 3.19 -26.0% 317 46.8% 0.116 14.0% 266 8.1%
G-A3 4.38 1.6% 192 -11.1% 0.092 -9.2% 244 -0.8%
B-1-U 4.36 1.2% 392 81.5% 0.147 44.9% 220 -10.6%
B-1-L 3.72 -13.7% 151 -30.1% 0.121 19.6% 290 17.9%
B-A3 4.1 -4.9% 240 11.1% 0.149 46.7% 254 3.3%
IRC-12-26 IRCOBI Conference 2012
- 191 -
IV. DISCUSSION
The maximum difference in the peak injury measures between the results from the baseline model and the
simulations using the stiffness curves scaled in the direction of the deflection was approximately 3% and 5%
when the deflection at the peak force was varied by ±10% and ±20%, respectively. In contrast, the
corresponding difference for the stiffness curves scaled in the direction of the force was approximately 5% and
21% when the peak force magnitude was varied by ±10% and ±20%, respectively. This suggests that the effect
of the level of the force on the injury measures is more significant than that of the deflection.
The absorbed energy up to the peak force from the stiffness curves scaled in the direction of the deflection
was the same as that from the stiffness curves scaled in the direction of the force, when these parameters
were varied by the same percentage. Therefore, it is also suggested that the effect of the level of the force on
the injury measures is more significant than that of the absorbed energy up to the peak force.
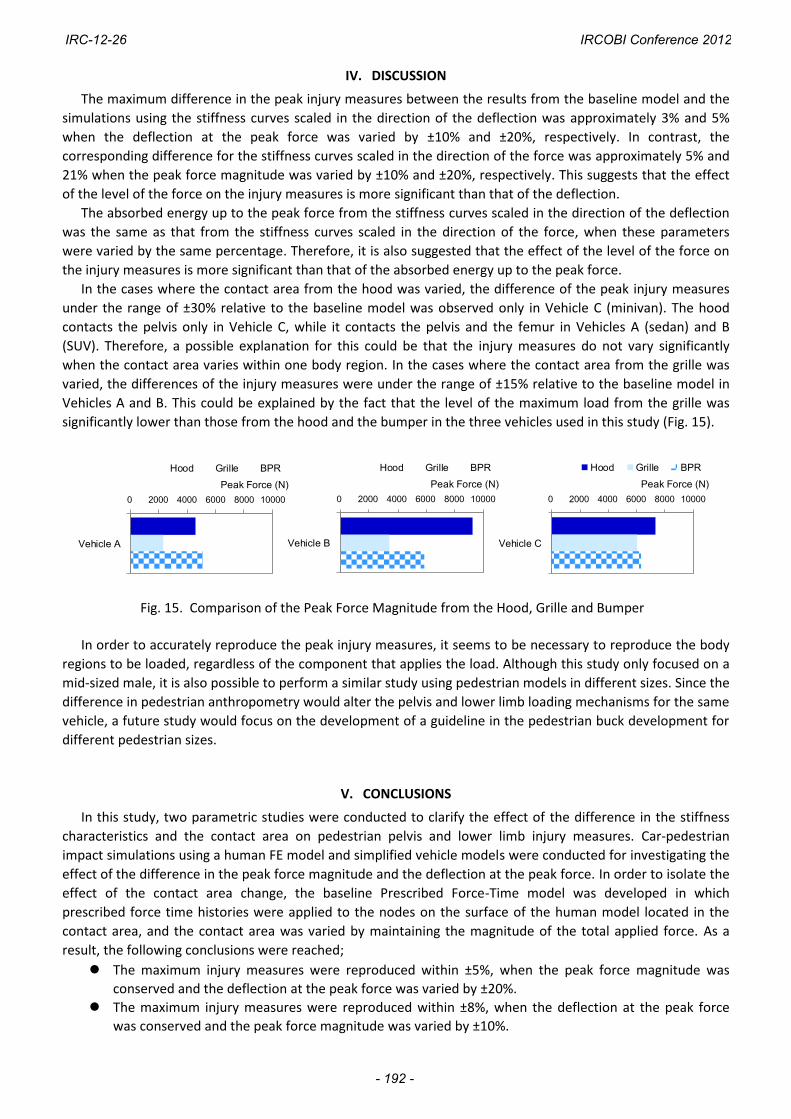
In the cases where the contact area from the hood was varied, the difference of the peak injury measures
under the range of ±30% relative to the baseline model was observed only in Vehicle C (minivan). The hood
contacts the pelvis only in Vehicle C, while it contacts the pelvis and the femur in Vehicles A (sedan) and B
(SUV). Therefore, a possible explanation for this could be that the injury measures do not vary significantly
when the contact area varies within one body region. In the cases where the contact area from the grille was
varied, the differences of the injury measures were under the range of ±15% relative to the baseline model in
Vehicles A and B. This could be explained by the fact that the level of the maximum load from the grille was
significantly lower than those from the hood and the bumper in the three vehicles used in this study (Fig. 15).
In order to accurately reproduce the peak injury measures, it seems to be necessary to reproduce the body
regions to be loaded, regardless of the component that applies the load. Although this study only focused on a
mid-sized male, it is also possible to perform a similar study using pedestrian models in different sizes. Since the
difference in pedestrian anthropometry would alter the pelvis and lower limb loading mechanisms for the same
vehicle, a future study would focus on the development of a guideline in the pedestrian buck development for
different pedestrian sizes.
V. CONCLUSIONS
In this study, two parametric studies were conducted to clarify the effect of the difference in the stiffness
characteristics and the contact area on pedestrian pelvis and lower limb injury measures. Car-pedestrian
impact simulations using a human FE model and simplified vehicle models were conducted for investigating the
effect of the difference in the peak force magnitude and the deflection at the peak force. In order to isolate the
effect of the contact area change, the baseline Prescribed Force-Time model was developed in which
prescribed force time histories were applied to the nodes on the surface of the human model located in the
contact area, and the contact area was varied by maintaining the magnitude of the total applied force. As a
result, the following conclusions were reached;
The maximum injury measures were reproduced within ±5%, when the peak force magnitude was
conserved and the deflection at the peak force was varied by ±20%.
The maximum injury measures were reproduced within ±8%, when the deflection at the peak force
was conserved and the peak force magnitude was varied by ±10%.
0 2000 4000 6000 8000 10000
Vehicle A
Peak Force (N)
Hood Grille BPR
0 2000 4000 6000 8000 10000
Vehicle B
Peak Force (N)
Hood Grille BPR
0 2000 4000 6000 8000 10000
Vehicle C
Peak Force (N)
Hood Grille BPR
Fig. 15. Comparison of the Peak Force Magnitude from the Hood, Grille and Bumper
IRC-12-26 IRCOBI Conference 2012
- 192 -
The maximum injury measures were reproduced within ±21%, when the deflection at the peak force
was conserved and the peak force magnitude was varied by ±20%.
In order to accurately reproduce the maximum injury measures, the buck components that represent
the hood, grille and bumper face should apply load to the whole area on a pedestrian body that these
components are supposed to contact in an impact from the vehicle represented by the buck.
VI. REFERENCES
[1] International Traffic Safety Data and Analysis Group IRTAD Annual report 2010, [http://internationaltransportforum.org/ irtadpublic/pdf/10IrtadReport.pdf]
[2] Akiyama, A., Okamoto, M. and Rangarajan, N. Development and Application of New Pedestrian Dummy, Paper Number 463, Proceedings of the 17th Conference on the Enhanced Safety Vehicle (ESV), 2001.
[3] Society of Automobile Engineers Human Biomechanics And Simulations Standards Steering Committee :
Performance Specifications for a Midsize Male Pedestrian Research Dummy, Surface Vehicle Information Report J2782, 2010.
[4] Society of Automobile Engineers Human Biomechanics And Simulations Standards Steering Committee :
Pedestrian Dummy Full Scale Test Results and Resource Materials, Surface Vehicle Information Report J2868, 2010.
[5] Untaroiu, C., Shin, J., Crandall, J. R., Fredriksson, R., Bostrom, O., Takahashi, Y., Akiyama, A., Okamoto, M.,
Kikuchi. Y. : Development and Validation of Pedestrian Sedan Bucks using Finite Element Simulations; Application in Study in the Influence of Vehicle Automatic Breaking on the Kinematics of the Pedestrian Involved in Vehicle Collisions, Proceedings of 21st ESV Conference, Paper Number 09-0485, 2009.
[6] Suzuki, S., Takahashi, Y., Okamoto, M., Fredriksson, R., Oda, S. , Validation of a Pedestrian Sedan Buck Using
a Human Finite Element Model, Proceedings of 22nd ESV Conference, Paper Number 11-0277, 2011. [7] Takahashi, Y., Suzuki, S., Oda, S., Frederiksson, R., Pipkorn, B., Effect of Stiffness Characteristics of Vehicle
Front-end Structures on Pedestrian Pelvis and Lower Limb Injury Measures, Proceedings of IRCOBI Conference, 2011.
[8] Takahashi, Y., Suzuki, S., Okamoto, M., Oda, S., Investigation of the Effect of Stiffness Characteristics of
Vehicles on Pedestrian Pelvis and Lower Limb Injury Measures, Transactions of Society of Automotive Engineers of Japan (JSAE), Vol. 43 No.2, 20124216, 2011. (in Japanese)
[9] Takahashi, Y., Suzuki, S., Ikeda, M., Gunji, Y. , Investigation on Pedestrian Pelvis Loading Mechanisms Using
Finite Element Simulations, Proceedings of IRCOBI Conference, 2010. [10] Ikeda, M., Suzuki, S., Gunji, Y., Takahashi, Y., Motozawa, Y., Hitosugi, M., Development of An Advanced
Finite Element Model for A Pedestrian Pelvis, Proceedings of 22nd ESV Conference, Paper Number 11-0009, 2011
IRC-12-26 IRCOBI Conference 2012
- 193 -