EFFECT OF NOSE RADIUS ON SURFACE …roughness, in CNC turning of Aluminium (6061) in dry condition....
15
International Journal of Recent advances in Mechanical Engineering (IJMECH) Vol.5, No.2, May 2016 DOI: 10.14810/ijmech.2016.5203 31 EFFECT OF NOSE RADIUS ON SURFACE ROUGHNESS DURING CNC TURNING USING RESPONSE SURFACE METHODOLOGY Devendra Singh 1 , Vimanyu Chadha 2 and Ranganath M Singari 3 1 Department of Mechanical, Production and Industrial Engineering, Sagar Institute Of Technology And Management, Uttar Pradesh, India [email protected] 2,3 Department of Mechanical, Production and Industrial Engineering, Delhi Technological University, New Delhi, India [email protected] ABSTRACT The work and study presented in this paper aims to investigate the effect of nose radius on surface roughness, in CNC turning of Aluminium (6061) in dry condition. The effect of cutting conditions (speed, feed and depth of cut) and tool geometry (nose radius) on surface roughness were studied and analysed. Design of Experiments (DOE) were conducted for the analysis of the influence of the turning parameter on the surface roughness by using Response Surface Methodology (RSM) and then followed by optimization of the results using Analysis of Variance (ANOVA) to minimize surface roughness. The nose radius was identified as the most significant parameter. Surface roughness value decreased with increase in nose radius. KEYWORDS Nose Radius, CNC, Design of Experiments, Response Surface Methodology, Central Composite Design, Turning, Speed, Depth of cut, Feed, Surface Roughness, and Aluminium 606. 1.INTRODUCTION The increase of consumer needs for quality metal cutting related products (more precise tolerance and better surface finish) has driven the metal cutting industry to continuously improve quality control of the metal cutting processes. Quality of the surface roughness is an important requirement of many work pieces in the machining operations. This parameter is increasingly needed in automotive, aerospace, die and mould manufacturing application. Within the metal cutting processes, one of the most fundamental metal removal operations is turning process, which is used in the manufacturing industry. The surface roughness, which is used to determine and evaluate quality of a product, is one of the major quality attribute of the turned product. The surface roughness of a machined product could affect several of the product‘s functional attributes such as contact causing surface friction, light reflection, wearing, ability of distributing and holding a lubricant, heat transmission, resisting fatigue in material. Hence, surface roughness is one of the most important quality aspects in turning operations. Hence, there is a need to optimize the process parameters in a systematic way to achieve the output characteristics/responses by using experimental methods and statistical models [24] .
Transcript of EFFECT OF NOSE RADIUS ON SURFACE …roughness, in CNC turning of Aluminium (6061) in dry condition....

International Journal of Recent advances in Mechanical Engineering (IJMECH) Vol.5, No.2, May 2016
DOI: 10.14810/ijmech.2016.5203 31
EFFECT OF NOSE RADIUS ON SURFACE
ROUGHNESS DURING CNC TURNING USING
RESPONSE SURFACE METHODOLOGY
Devendra Singh1, Vimanyu Chadha 2 and Ranganath M Singari3
1Department of Mechanical, Production and Industrial Engineering, Sagar Institute Of Technology And Management, Uttar Pradesh, India
2,3Department of Mechanical, Production and Industrial Engineering, Delhi Technological University, New Delhi, India
ABSTRACT
The work and study presented in this paper aims to investigate the effect of nose radius on surface
roughness, in CNC turning of Aluminium (6061) in dry condition. The effect of cutting conditions (speed,
feed and depth of cut) and tool geometry (nose radius) on surface roughness were studied and analysed.
Design of Experiments (DOE) were conducted for the analysis of the influence of the turning parameter on
the surface roughness by using Response Surface Methodology (RSM) and then followed by optimization of
the results using Analysis of Variance (ANOVA) to minimize surface roughness. The nose radius was
identified as the most significant parameter. Surface roughness value decreased with increase in nose
radius.
KEYWORDS
Nose Radius, CNC, Design of Experiments, Response Surface Methodology, Central Composite Design,
Turning, Speed, Depth of cut, Feed, Surface Roughness, and Aluminium 606.
1.INTRODUCTION
The increase of consumer needs for quality metal cutting related products (more precise tolerance and better surface finish) has driven the metal cutting industry to continuously improve quality control of the metal cutting processes. Quality of the surface roughness is an important requirement of many work pieces in the machining operations. This parameter is increasingly needed in automotive, aerospace, die and mould manufacturing application. Within the metal cutting processes, one of the most fundamental metal removal operations is turning process, which is used in the manufacturing industry. The surface roughness, which is used to determine and evaluate quality of a product, is one of the major quality attribute of the turned product. The surface roughness of a machined product could affect several of the product‘s functional attributes such as contact causing surface friction, light reflection, wearing, ability of distributing and holding a lubricant, heat transmission, resisting fatigue in material. Hence, surface roughness is one of the most important quality aspects in turning operations. Hence, there is a need to optimize the process parameters in a systematic way to achieve the output characteristics/responses by using experimental methods and statistical models[24].
International Journal of Recent advances in Mechanical Engineering (IJMECH) Vol.5, No.2, May 2016
32
Therefore, in order to obtain better surface roughness, proper setting of cutting parameters is very crucial before the process takes place. Starting point for determining cutting parameters, technologists can use the hands on data tables that are furnished in the machining data handbooks. The trial and error approach could be followed previously in order to obtain the optimal machining conditions for particular operations. Recently, a Design of Experiment (DOE) has been implemented to select manufacturing process parameters that could result in a better quality product. The methods of design such as Taguchi’s method, Response Surface Methodology (RSM), factorial designs etc., are finding unbound use nowadays replacing the earlier one factor at a time experimental approach which more costly as well as time-consuming. Surface roughness is the factor which is not only hard to measure but also it is very versatile and it depends upon every minute input parameter. So it becomes highly compulsive to have a detailed study of the process to keep the roughness in limits. Hasan Gokkaya and Muammer Nalbant[10] investigated the effects of insert radii of cutting tools, depths of cut and feed rates on the surface quality of the work pieces depending on various processing parameters. In the range of importance, the effective parameters on the average surface roughness were determined as the following: speed rate, insert radius, and depth of cut. Thus a good combination among the insert radius, speed rate and depth of cut can provide better surface qualities. Ranganath M S et. al[32] have presented a paper on “Surface Finish Monitoring in CNC Turning Using RSM and Taguchi Techniques”. This paper presented the findings of an experimental investigation into the effects of speed, feed rate and depth of cut on surface roughness in CNC turning of Aluminium (KS 1275). The three factors speed, feed rate, depth of cut, which were selected in the screening experiment, were used in CCD. Minitab 15 was used to develop the experimental plan for Taguchi and response surface methodology. The same software was also used to analyze the data collected. The Response surface methodology showed significance of all possible combinations of interactions and square terms, whereas, in Taguchi’s technique only three interactions are normally studied. This is because of the fact that the interactions between control factors were aliased with their main effects. Response surface methodology technique required almost double time for conducting experiments as that needed for Taguchi technique. 3D surfaces generated by Response surface methodology could help in visualizing the effect of parameters on response in the entire range specified whereas Taguchi’s technique gave the average value of response at given level of parameters. Optimization plot obtained from Response surface methodology was not a feature of Taguchi technique. Thus Response surface methodology is a better tool for optimization and can better predict the effect of parameters on response. Ranganath M S, Vipin[33] carried out experimental investigation and parametric analysis of surface roughness in CNC turning using design of experiments. Their work integrated the effect of various parameters which affect the surface roughness. The important parameters discussed were cutting speed, feed, depth of cut, nose radius and rake angle Experiments were carried out with the help of factorial method of design of experiment (DOE) approach to study the impact of turning parameters on the roughness of turned surfaces. The following conclusions have been made on the basis of results obtained and analysis performed: Increase in cutting speed improved the surface finish, thus the average surface roughness value decreased. Increase in depth of cut affected the surface finish adversely to a small extent, but as depth of cut increased beyond a certain limit surface finish deteriorated to a large extent. Small increase in feed rate deteriorated surface finish to a large extent as compared to same amount of increase of depth of cut. Surface roughness also decreased as the nose radius increased hence surface finish increased. With increase in back rake angle the surface roughness decreased and improved the surface finish. The ANOVA and F-test revealed that the feed is dominant parameter followed by depth of cut, speed, and nose radius and rake angle for surface roughness. Ranganath M S et. al[35] had predicted the surface roughness model for CNC turning of EN 8 steel using response surface methodology. In

International Journal of Recent advances in Mechanical Engineering (IJMECH) Vol.5, No.2, May 2016
33
this prediction model of surface roughness had been developed for turning EN-8 steel with uncoated carbide inserts using response surface methodology. The model was developed in the form of multiple regression equations correlating dependent parameter surface roughness, with speed, feed rate and depth of cut, in a turning process. The box-behnken design was used to perform the experiments. The second order model was found suitable for this work. Moreover a good agreement between the predicted and experimental surface roughness was observed within reasonable limit. Zahari Taha et. al[48] have investigated on Effect of insert geometry on surface roughness in the turning process of AISI D2 steel. The objective of his study was to compare measured surface roughness (from experiments) with theoretical surface roughness (from theoretical calculations) of two types of insert, 'C' type and 'T' type. Consequently at high feed rates (0.4 mm/rev) the 'C' type insert resulted in 40% lower roughness compared to the 'T' type due to differences in insert geometry. In this project various research papers were studied and it was assessed that the surface roughness depended upon various cutting parameters as well as tool geometry (nose radius). RSM was adopted to be used as the optimization technique so that the focused parameters could be obtained in a much better and comprehensive way in the process ANOVA and Taguchi were taken in consideration but due to the ability of RSM to control the surface parameters and also the ability to have a second order fitting curve the RSM was chosen to bring the optimality in the system.
2. EXPERIMENTAL WORK
2.1. Workpiece Material
Aluminium 6061 was selected as the work material. It is one of the most extensively used of the 6000 series aluminium alloys. This standard structural alloy, one of the most versatile of the heat-treatable alloys, is popular for medium to high strength requirements and has good toughness characteristics. Applications range from transportation components to machinery and equipment applications to recreation products and consumer durables. It is widely used for producing automotive components by turning process. It has excellent corrosion resistance to atmospheric conditions and good corrosion resistance to sea water. This alloy also offers good finishing characteristics and responds well to anodizing. Alloy 6061 is easily welded and joined by various commercial methods. For screw machine applications, alloy 6061 has adequate machinability characteristics in the heat-treated condition. The different alloying elements present in this alloy are shown in the Table 1.
Table 1: Workpiece Composition
Components % by weight Aluminium (Al) 95.9 to 98.6 %
Magnesium (Mg) 0.8 to 1.2 % Silicon (Si) 0.4 to 0.8 %
Iron (Fe) 0 to 0.7 % Copper (Cu) 0.15 to 0.4 %
Chromium (Cr) 0.04 to 0.35 % Zinc (Zn) 0 to 0.25 %
Manganese (Mn) 0 to 0.15 % Residuals 0 to 0.15 %
Titanium (Ti) 0 to 0.15 %

International Journal of Recent advances in Mechanical Engineering (IJMECH) Vol.5, No.2, May 2016
34
2.2. Cutting Tool Inserts
CNMG cutting tool inserts of nose radius 0.4 mm, 0.8 mm, 1.2 mm. The geometry of the tool was.
Table 2: Details of Cutting Inserts
Insert Shape Clearance
Angle
Inscribed
Circle
Size
Thickness Nose
Radius
CNMG120404 Diamond 00 12.7 mm 4.76 mm 0.4 mm CNMG120408 Diamond 00 12.7 mm 4.76 mm 0.8 mm CNMG120412 Diamond 00 12.7 mm 4.76 mm 1.2 mm
2.3. Experimental Plan
The experimental work was carried out on CNC turning center LMW LL20TL3
Fig. 1: CNC Turning- LMW LL20TL3 (Lakshmi Machine Works Limited)
Fig. 2: Roughness Measuring Instrument (Taylor Hobson Surtronic 3+)

International Journal of Recent advances in Mechanical Engineering (IJMECH) Vol.5, No.2, May 2016
35
Surface Roughness of these machined surfaces has been measured by a Surface Roughness measuring instrument Talysurf Surtronic 3+. Surtronic 3+ is a self-contained, portable instrument for the measurement of surface texture and is suitable for use in both the workshop and laboratory. Parameters available for surface texture evaluation are: Ra, Rq, Rz (DIN), Ry and Sm. The parameter evaluation and other functions of the instrument are microprocessor based. The measurement results are displayed on a LCD screen and can be an output to an optional printer or computer for further results[30].
2.4. Design of Experiment
The process was studied with a standard RSM design called a Central composite design (CCD). The factorial portion is a full factorial design with all factors at three levels, the star points are at the face of the cube portion on the design which correspond to value of -1. This is commonly referred to as a face centered CCD. The center points, as implied by the name, are points with all levels set to coded level 0, the midpoint of each factor range, and this is repeated six times. Thirty experiments were performed. For each experimental trial, a new cutting edge was used. The Minitab-17 was used to develop the experimental plan for response surface methodology. The same software was also used to analyze the data collected. As RSM helps to find out the factor level which will satisfy the desired dimensions. Helps in finding relationships of responses on individual input parameter. Helps in forecasting the properties of the product and find out the responses it would give when obtained settings are given. Helps in finding out all the necessary situations for the stability of the process. Hence on the basis of the above uses, RSM is a better tool for optimization and able to forecast effectively the effect of parameters on response. The design table to be used was made by deciding the values of the parameters to be set in the experiment. Namely, the depth of cut, feed rate, speed or rpm and nose radius were set accordingly. The values were defined on basis of the values available in the machine so as to perform the experiment. The process parameters and their values at three levels are given in Table 3.
Table 3: Process Parameters with their values at three levels Parameters Level 1 Level 2 Level 3
A Speed(RPM) 1600 1900 2200 B Feed
(mm/rev.) 0.12 0.18 0.24
C Depth of Cut(mm)
0.25 0.50 0.75
D Nose Radius(mm)
0.4 0.8 1.2
2.5. Analysis
ANOVA was used for analyzing the results obtained. ANOVA is used in the analysis of comparative experiments, those in which only the difference in outcomes is of interest. The statistical significance of the experiment is determined by a ratio of two variances. This ratio is independent of several possible alterations to the experimental observations. Adding a constant to all observations does not alter significance. Multiplying all observations by a constant does not alter significance. So in ANOVA, statistical significance results are independent of constant bias and scaling errors as well as the units used in expressing observations.

International Journal of Recent advances in Mechanical Engineering (IJMECH) Vol.5, No.2, May 2016
36
3. ANALYSIS AND DISCUSSION
The results from the machining trials performed as per the experimental plan are shown in Table 4. These results were used as input in the Minitab Software for further analysis. The CCD details are given in Table 5.
Table 4: Design Table
Order Block Speed(RP
M)
Feed(mm/rev
)
Depth of
Cut(mm)
Nos
e
Rad
ius
(mm
)
Surface
Roughness(µm)
1 3 1900 0.18 0.5 1.2 0.92 2 3 1900 0.18 0.5 0.8 2.86 3 3 1900 0.12 0.5 0.8 0.8 4 3 1600 0.18 0.5 0.8 1.56 5 3 1900 0.18 0.5 0.4 1.76 6 3 1900 0.24 0.5 0.8 2.48 7 3 1900 0.18 0.5 0.8 1.46 8 3 1900 0.18 0.75 0.8 1.40 9 3 2200 0.18 0.5 0.8 2.92 10 3 1900 0.18 0.25 0.8 1.38 11 1 2200 0.24 0.5 0.4 2.30 12 1 2200 0.24 0.25 1.2 1.95 13 1 1600 0.12 0.25 1.2 0.60 14 1 1600 0.12 0.75 0.4 0.94 15 1 1600 0.24 0.75 1.2 0.60 16 1 2200 0.12 0.75 1.2 0.92 17 1 1600 0.24 0.25 0.4 1.56 18 1 1900 0.18 0.5 0.8 0.96 19 1 2200 0.12 0.25 0.4 1.00 20 1 1900 0.18 0.5 0.8 1.48 21 2 1600 0.24 0.25 1.2 0.54 22 2 1900 0.12 0.5 0.8 0.64 23 2 1600 0.24 0.75 0.4 3.04 24 2 2200 0.24 0.25 0.4 2.64 25 2 2200 0.24 0.75 1.2 1.10 26 2 1600 0.12 0.25 0.4 1.36 27 2 1600 0.12 0.75 1.2 1.00 28 2 1900 0.18 0.5 0.8 1.56 29 2 2200 0.12 0.25 1.2 1.60 30 2 2200 0.12 0.75 0.4 1.08

International Journal of Recent advances in Mechanical Engineering (IJMECH) Vol.5, No.2, May 2016
37
.Table 5: Central Composite Design Details
Factors: 4 Replicates: 1
Base Runs: 30 Total Runs: 30 Base Blocks: 3 Total Blocks: 3
Two-Level Factorial: 16 Cube Points: 8
Centre Points in Cube: 4 Axial Points: 8
Center Points in Axial: 2 Alpha 1
Table 6: Analysis of Variance
Source DF Adj SS Adj MS F-Value P-Value
Model 6 8.7527 1.45879 9.04 0.000 Linear 4 6.3277 1.58192 9.81 0.000
S 1 1.3566 1.35665 8.41 0.008 F 1 2.2339 2.23390 13.85 0.001 D 1 0.0348 0.03480 0.22 0,647 N 1 2.6971 2.69712 16.72 0.000
2-Way
Interaction
2 2.4299 1.21494 7.53 0.003
s*d_1 1 0.9809 0.98091 6.08 0.022 f*n 1 1.2803 1.28027 7.94 0.010
Error 23 3.7097 0.16129 Lack-of-Fit 18 3.7097 0.20610 * * Pure Error 5 0.0000 0.0000
Total 29 12.4625
Table 7: Model Summary
S R-sq R-sq(adj) R-sq(pred)
0.401614 70.23% 62.47% 45.69%
Regression Equation:
Ra = -5.50 + 0.002678×(Speed) + 15.36×(Feed) + 6.38×(Depth of Cut) + 1.159×(Nose Radius)
- 0.00345 (Speed)×(Depth of Cut) - 11.84 (Feed)×(Nose Radius)
Without performing any transformation on the response, examination of the fit summary output revealed that the quadratic model is statistically significant for all the conditions and therefore, it has been used for further analysis. An ANOVA table is commonly used to summarize the tests performed. It is evident that speed, depth of cut, feed and nose radius are significant at 95%

International Journal of Recent advances in Mechanical Engineering (IJMECH) Vol.5, No.2, May 2016
38
confidence level and thus affects mean value and variation around the mean value of the Ra. The nose radius is the most significant in ANOVA for and thus affects the mean value of Ra followed by feed and then speed. The value of “P >F” for models less than 0.05 indicates that the model is significant, which is desirable as it indicates that the terms in the model have a significant effect on the response. The value of P < 0.0001 indicates that there is only a 0.01% chance that a “model F-value” could occur due to noise. Values greater than 0.1000 indicate the model terms are not significant. Some of the model terms were found to be significant. However, the main effect of nose radius was found to be the most significant factor followed by feed and then depth of cut.
Fig. 3: Residual Plots for Ra
Fig. 4: Interaction Plots of Ra
International Journal of Recent advances in Mechanical Engineering (IJMECH) Vol.5, No.2, May 2016
39
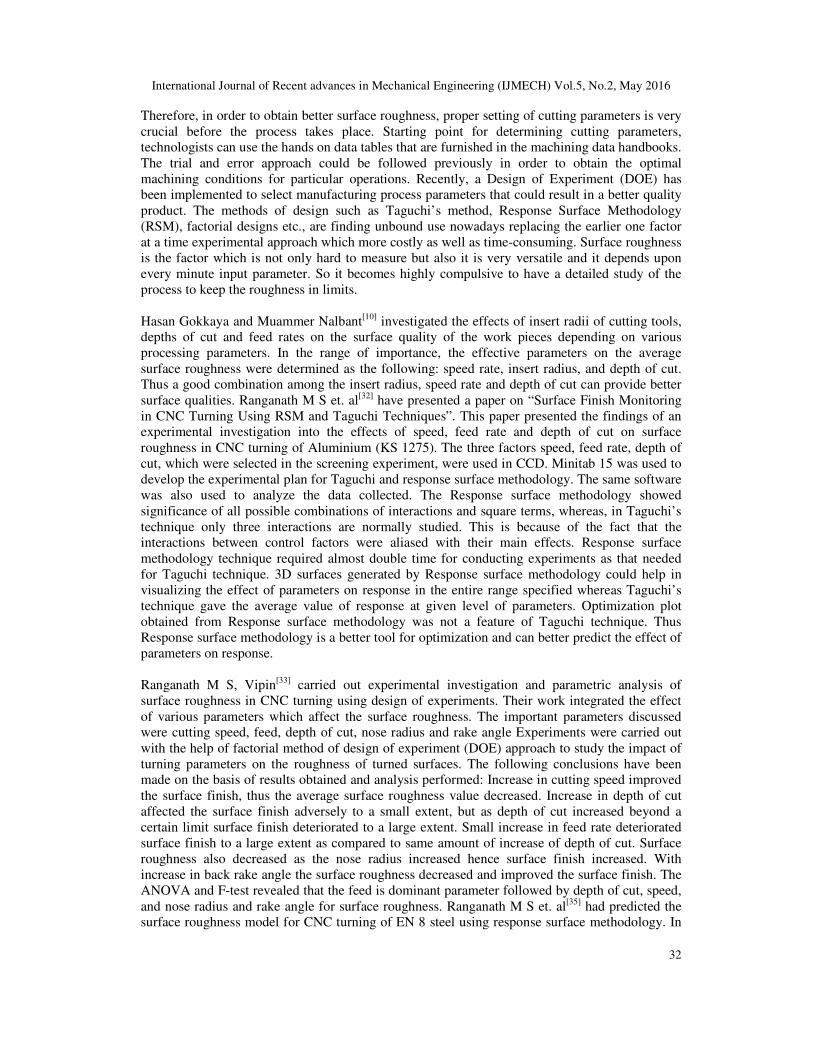
The normal probability plots of the residuals for Ra shows that the residuals generally fall on a straight line implying that errors are distributed normally. Also in Fig. 3 showing residuals vs order for Ra reveals that they have no visible pattern and unusual structure. This implies that the models proposed are adequate and there is no reason to suspect any violation of the independence or constant variation assumption. Fig.4 shows the interaction plots of Ra for four parameters.
Fig. 5: Main Effects Plot for Means The main effects plot for Ra is shown in Fig. 5. The optimal values obtained are at 1600 rpm speed, 0.12 m/min feed, 0.25 mm depth of cut and 1.2 mm nose radius. During Optimal Design of A, B, C the Response surface design selected is according to D-optimality. Number of candidate design points are 30, Number of design points in optimal design are 15 and Model terms are A, B, C, D, AA, BB, CC, DD, AB, AC, AD, BC, BD, CD. Initial design generated by Sequential method and Initial design improved by Exchange method. Number of design points exchanged is 1. For Optimal Design Row number of selected design points are 11, 13, 15, 19, 28, 16, 17, 18, 21, 23, 24, 1, 2, 4 and 6. Condition number: 10.8640 D-optimality (determinant of XTX): 3.47892E+11 A-optimality (trace of inv(XTX)): 5.48611 G-optimality (avg leverage/max leverage): 1 V-optimality (average leverage): 1 Maximum leverage: 1
International Journal of Recent advances in Mechanical Engineering (IJMECH) Vol.5, No.2, May 2016
40
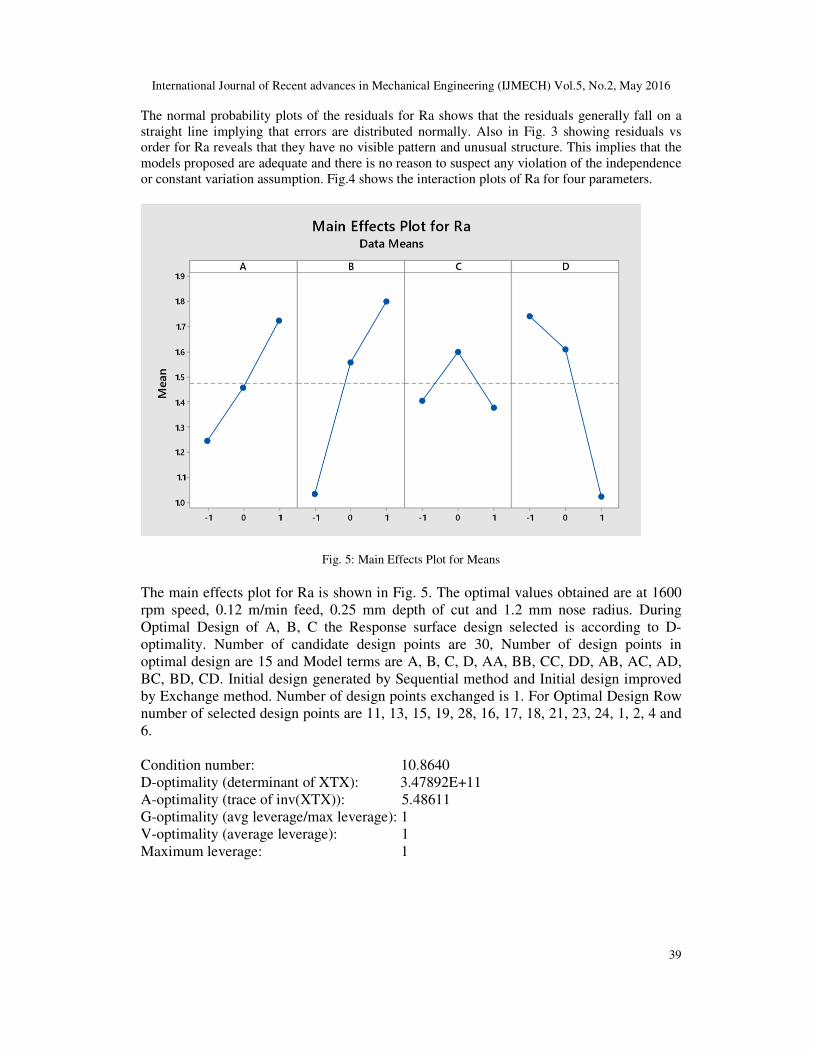
Fig. 6: Contour Plot of Ra vs D, C.
Fig. 7: Contour Plot of Ra vs D, B.
Fig. 8: Contour Plot of Ra vs C, B.
International Journal of Recent advances in Mechanical Engineering (IJMECH) Vol.5, No.2, May 2016
41
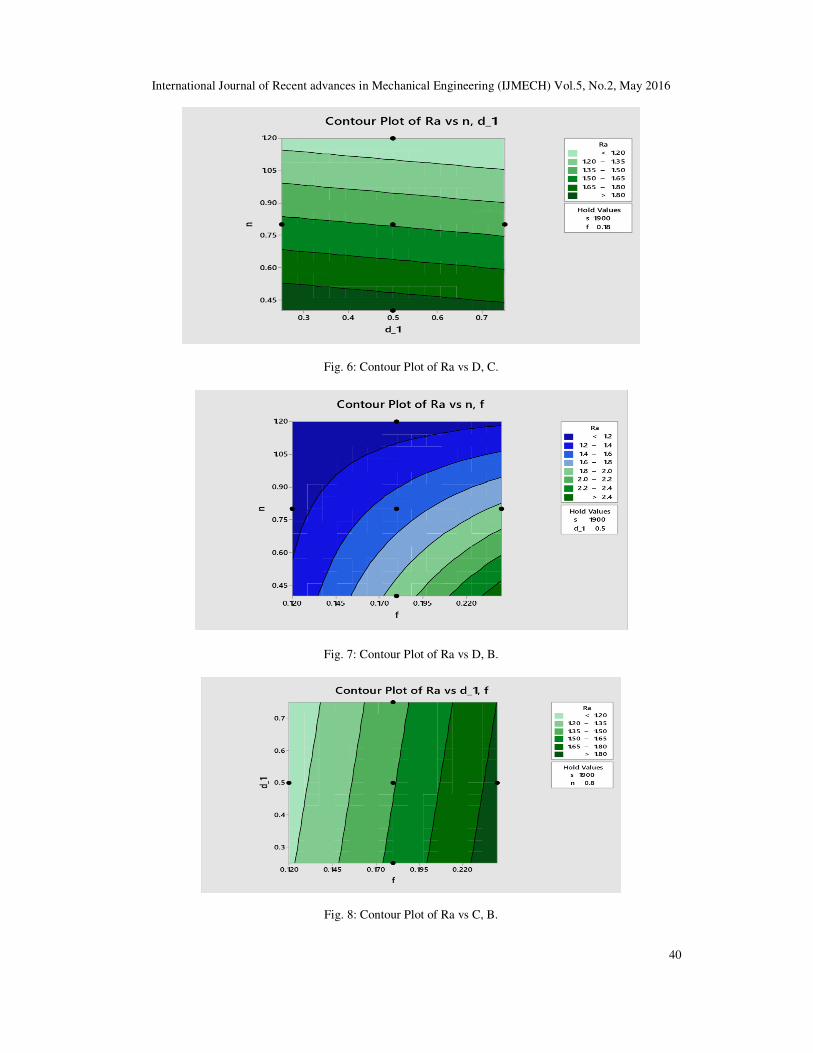
Fig. 9: Contour Plot of Ra vs D, A.
Fig. 10: Contour Plot of Ra vs C, A.
Fig. 11: Contour Plot of Ra vs B, A.

International Journal of Recent advances in Mechanical Engineering (IJMECH) Vol.5, No.2, May 2016
42
The contour plots for the response, surface roughness are shown Fig. 6 to Fig. 11. The surface roughness decreases with increase in nose radius and increases with increase in feed. Fig. 12 shows 3D surface plot graphs of the effect of nose radius, feed, speed and depth of cut on the surface roughness. It has a curve linear shape according to the model fitted. The entire 3D surface graph for surface roughness has curvilinear profile in accordance to the quadratic model fitted.
Fig. 12: Various Surface Plots of Ra. 4. CONCLUSIONS
The conclusions which have been drawn on the basis of results obtained and analysis performed are:
• The analysis of the results for surface roughness shows that the nose radius is the most significant factor followed by feed. The 3D surface plots of Response Surface Methodology reveals that nose radius has a very significant effect on the surface roughness.
• The average surface roughness value increases with increase in feed within the specified range.
• Increase in cutting speed within the specified range deteriorates the surface finish, thus the average surface roughness value increases.
• Increase in depth of cut within the specified range affects the surface finish adversely to a small extent.
• Small decrease in nose radius within the specified range deteriorates surface finish to a large extent. Hence, increasing nose radius improves surface finish.
• Empirical models for surface roughness has been determined based on which predictions can be carried out for output response for appropriate applications.

International Journal of Recent advances in Mechanical Engineering (IJMECH) Vol.5, No.2, May 2016
43
• The optimum value of surface roughness in the given range of parameters as depicted by graphs is 1600 rpm (speed), 0.12 m/min (feed), 0.25 mm (depth of cut) and 1.2 mm (nose radius).
• 3D surfaces generated by Response surface methodology can help in visualizing the effect of parameters on response in the entire range specified, thus Response surface methodology is a better tool for optimization and can better predict the effect of parameters on response.
REFERENCES
[1] A.R.C. Sharman, J.I. Hughes, K. Ridgway, The effect of tool nose radius on surface integrity and
residual stresses when turning Inconel 718™, Journal of Materials Processing Technology, Volume 216, February 2015, Pages 123-132, ISSN 0924-0136
[2] Aman Aggarwal, Hari Singh, Pradeep Kumar & Manmohan Singh, “Optimizing power consumption for CNC turned parts using response surface methodology and Taguchi’s technique - A comparative analysis”, Elsevier Journal, Journal of materials processing technology, pp. 373–384, 2008
[3] Aman Aggarwal and Hari Singh,"Optimisation of machining techniques-a retrospective and literature review", Sadhana, Vol. 30, Part 6, December 2005, pp. 699–711
[4] Anupam Agrawal, Saurav Goel, Waleed Bin Rashid, Mark Price, Prediction of surface roughness during hard turning of AISI 4340 steel (69 HRC), Applied Soft Computing, Volume 30, May 2015, Pages 279-286, ISSN 1568-4946
[5] Chung-Shin Chang, Gwo-Chung Tsai, A force model of turning stainless steel with worn tools having nose radius, Journal of Materials Processing Technology, Volume 142, Issue 1, 10 November 2003, Pages 112-130, ISSN 0924-0136
[6] C. Ahilan, Somasundaram Kumanan, N. Sivakumaran, J. Edwin Raja Dhas, Modeling and prediction of machining quality in CNC turning process using intelligent hybrid decision making tools, Applied Soft Computing, Volume 13, Issue 3, March 2013, Pages 1543-1551, ISSN 1568-4946
[7] C.R. Prakash Rao, M.S. Bhagyashekar, Narendraviswanath, Effect of Machining Parameters on the Surface Roughness while Turning Particulate Composites, Procedia Engineering, Volume 97, 2014, Pages 421-431, ISSN 1877-7058
[8] D. C. Montgomery, Design and Analysis of Experiments, 4th ed. Wi1ey, New York. 1997 [9] Feng C. X. & Wang X., “Development of Empirical Models for Surface Roughness Prediction in
Finish Turning, International Journal of Advanced Manufacturing Technology,” Vol. 20, 348-356, 2002
[10] Gökkayaa H. & Nalbant M., “The effects of cutting tool geometry and processing parameters on the surface roughness of AISI 1030 steel”, Materials & Design, vol. 28(2), 717-721, 2007
[11] H. K. Dave, L. S. Patel & H. K. Raval, “Effect of machining conditions on MRR and surface roughness during CNC Turning of different Materials Using TiN Coated Cutting Tools – A Taguchi approach”, International Journal of Industrial Engineering Computations 3, pp. 925-930, 2012
[12] Harish Kumar, Mohd. Abbas, Aas Mohammad, Hasan Zakir Jafri, “Optimization of cutting parameters in CNC Turning”, International Journal of Engineering Research and Applications (IJERA), Vol. 3, Issue 3, pp. 331-334, 2013
[13] Ilhan Asilturk & Harun Akkus, “Determining the effect of cutting parameters on surface roughness in hard turning using the Taguchi method”, Elsevier Journal, Measurement 44, pp. 1697–1704, 2011
[14] Jakhale Prashant P, Jadhav B. R., “Optimization Of Surface Roughness Of Alloy Steel By Changing Operational Parameters and Insert Geometry in The Turning Process”, International Journal of Advanced Engineering Research and Studies, II/ IV, pp. 17-21, 2013
[15] Makadia A.J. and Nanavati J.I., (2013), “Optimisation of machining parameters for turning operations based on response surface methodology,” Measurement, 46(4) pp.1521-1529.
[16] Meenu Gupta, Surinder Kumar, Investigation of surface roughness and MRR for turning of UD-GFRP using PCA and Taguchi method, Engineering Science and Technology, an International Journal, Volume 18, Issue 1, March 2015, Pages 70-81, ISSN 2215-0986
[17] Meng Liu, Jun-ichiro Takagi, Akira Tsukuda, Effect of tool nose radius and tool wear on residual stress distribution in hard turning of bearing steel, Journal of Materials Processing Technology, Volume 150, Issue 3, 20 July 2004, Pages 234-241, ISSN 09240136

International Journal of Recent advances in Mechanical Engineering (IJMECH) Vol.5, No.2, May 2016
44
[18] M. Kaladhar , K. Venkata Subbaiah & Ch. Srinivasa Rao, “Parametric optimization during machining of AISI 304 Austenitic Stainless Steel using CVD coated DURATOMICTM cutting insert”, International Journal of Industrial Engineering Computations 3, pp. 577–586, 2012
[19] M. Kaladhar, K. V. Subbaiah, Ch. Srinivasa Rao & K. Narayana Rao, “Application of Taguchi approach and Utility Concept in solving the Multi-objective problem when turning AISI 202 Austenitic Stainless Steel”, Journal of Engineering and Technology Review (4), pp. 55-61, 2011
[20] M. Kaladhar, K. Venkata Subbaiah & Ch. Shrinivasa Rao, “Determination of Optimum Process Parameter during turning of AISI 304 Austenitic Stainless Steels using Taguchi method and ANOVA”, International Journal of Lean Thinking, Volume 3,Issue 1, 2012
[21] M. Kaladhar, K. Venkata Subbaiah, Ch. Srinivasa Rao and K. Narayana Rao, “Optimization of Process Parameters in Turning of AISI202 Austenitic Stainless Steel”, ARPN Journal of Engineering and Applied Sciences, VOL. 5, NO. 9, pp. 79-87, 2010
[22] M. Nalbant, H. Gokkaya & G. Sur, “Application of Taguchi method in the optimization of cutting parameters for surface roughness in turning”, Elsevier Journal, Materials and Design 28, pp. 1379–1385, 2007
[23] M. V. R. D. Prasad, Yelamanchili Sravya, and Karri Sai Tejasw," Study of the Influence of Process Parameters on Surface Roughness When Inconel 718 Is Dry Turned Using CBN Cutting Tool by Artificial Neural Network Approach", International Journal of Materials, Mechanics and Manufacturing, Vol. 2, No. 4, November 2014
[24] N. E. Edwin Paul, P. Marimuthu & R. Venkatesh Babu, “Machining Parameter Setting For Facing EN8 Steel with TNMG Insert” American International Journal of Research in Science, Technology, Engineering & Mathematics, 3(1), pp. 87-92, 2013
[25] N. Satheesh Kumar, Ajay Shetty, Ashay Shetty, Ananth K, Harsha Shetty, Effect of Spindle Speed and Feed Rate on Surface Roughness of Carbon Steels in CNC Turning, Procedia Engineering, Volume 38, 2012, Pages 691-697, ISSN 1877-7058
[26] Özel T., Hsu T.K., & Zeren, E., “Effects of cutting edge geometry, workpiece hardness, feed rate and cutting speed on surface roughness and forces in finish turning of hardened AISI H13 steel”, International Journal of Advanced Manufacturing Technology, 25(3-4), 262-269, 2005
[27] P. Jayaraman, L. Mahesh kumar, Multi-response Optimization of Machining Parameters of Turning AA6063 T6 Aluminium Alloy using Grey Relational Analysis in Taguchi Method, Procedia Engineering, Volume 97, 2014, Pages 197-204, ISSN 18777058
[28] Ranganath M S, Vipin, R S Mishra, “Optimization of Surface Roughness and Material Removal Rate on Conventional Dry Turning of Aluminium (6061)”, International Journal of Advance Research and Innovation, Volume 1, pp 62-71, 2014
[29] Ranganath M S, Vipin, “Optimization of Process Parameters in Turning Operation Using Taguchi Method and Anova: A Review”, International Journal of Advance Research and Innovation, Volume 1, pp 31-45, 2013
[30] Ranganath M S, Vipin, Nand Kumar, R Srivastava, “Surface Finish Monitoring in CNC Turning Using RSM and Taguchi Techniques”, International Journal of Emerging Technology and Advanced Engineering, Volume 4, Issue 9, September 2014
[31] Ranganath M. S., Vipin, Nand Kumar and Rakesh Kumar, “Experimental Analysis of Surface Roughness in CNC Turning of Aluminium Using Response Surface Methodology”, International Journal of Advance Research and Innovation, vol. 3, Issue 1, pp. 45-49, 2015
[32] Ranganath M. S, Vipin, “Experimental Investigation and Parametric Analysis of Surface Roughness in CNC Turning Using Design of Experiments”, International Journal of Modern Engineering Research, Vol. 4, Issue 9, September 2014
[33] Ranganath. M. S, Vipin, “Effect of Rake Angle on Surface Roughness in CNC Turning”, International Journal of Advance Research and Innovation, Volume 2, 2014
[34] Ranganath M S, Vipin, Harshit, Optimization of Process Parameters in Turning Operation Using RSM: A Review, International Journal of Emerging Technology and Advanced Engineering, (ISSN 2250-2459, ISO 9001:2008 Certified Journal, Volume 4, Issue 10, October 2014) 351-360.
[35] Ranganath M S, Vipin, Harshit, Surface roughness prediction model for CNC turning of EN-8 using Response Surface Methodology, International Journal of Emerging Technology and Advanced Engineering, (ISSN 2250-2459, ISO 9001:2008 Certified Journal, Volume 5, Issue 6, June 2015).
[36] Ranganath. M.S, Vipin, Prateek, Nikhil, Rahul, Nikhil Gaur, “Experimental Investigation and Parametric Studies of Surface Roughness Analysis in CNC Turning”, International Journal of Modern Engineering Research, Vol. 4, Issue 10, october 2014

International Journal of Recent advances in Mechanical Engineering (IJMECH) Vol.5, No.2, May 2016
45
[37] Ravinder Kumar, Santram Chauhan, Study on surface roughness measurement for turning of Al 7075/10/SiCp and Al 7075 hybrid composites by using response surface methodology (RSM) and artificial neural networking (ANN), Measurement, Volume 65, April 2015, Pages 166-180, ISSN 0263-2241
[38] Richárd Horváth, Ágota Drégelyi-Kiss, Analysis of surface roughness of aluminum alloys fine turned: United phenomenological models and multi-performance optimization, Measurement, Volume 65, April 2015, Pages 181-192, ISSN 0263-2241
[39] Rony Mohan, Josephkunju Paul C, George Mathew," Optimization of Surface Roughness of Bearing Steel during CNC Hard Turning Process", International Journal of Engineering Trends and Technology (IJETT) – Volume 17 Number 4 – Nov 2014
[40] Sayak Mukherjee, Anurag Kamal, Kaushik Kumar, Optimization of Material Removal Rate During Turning of SAE 1020 Material in CNC Lathe using Taguchi Technique, Procedia Engineering, Volume 97, 2014, Pages 29-35, ISSN 1877-7058
[41] Shreemoy Kumar Nayak, Jatin Kumar Patro, Shailesh Dewangan, Soumya Gangopadhyay, Multi-objective Optimization of Machining Parameters During Dry Turning of AISI 304 Austenitic Stainless Steel Using Grey Relational Analysis, Procedia Materials Science, Volume 6, 2014, Pages 701-708, ISSN 2211-8128
[42] S. Sivasankaran, P.T. Harisagar, E. Saminathan, S. Siddharth, P. Sasikumar, Effect of Nose Radius and Graphite Addition on Turning of AA 7075-ZrB2 in-situ Composites, Procedia Engineering, Volume 97, 2014, Pages 582-589, ISSN 1877-7058
[43] S. S. Acharya, R. L. Karwande," Investigation and optimization of turning process parameter in wet andMQL system on EN 31", IJMET, Volume 5, Issue 7, July (2014), pp. 134-143
[44] Upinder Kumar Yadav, Deepak Narang & Pankaj Sharma Attri, “Experimental investigation and Optimization of machine parameters for surface roughness in CNC turning by Taguchi method”, International Journal of Engineering Research and Application, vol. 2, Issue 4, pp 2060-2065, 2012
[45] V. Mugendiran, A. Gnanavelbabu, R. Ramadoss, Parameter Optimization for Surface Roughness and Wall Thickness on AA5052 Aluminium alloy by Incremental Forming using Response Surface Methodology, Procedia Engineering, Volume 97, 2014, Pages 1991-2000, ISSN 1877-7058
[46] Y.B. Kumbhar, C.A. Waghmare, "Tool life and surface roughness optimization of pvd tialn/tin multilayer coated carbide inserts in semi hard turning of hardened en31 alloy steel under dry cutting conditions", International Journal of Advanced Engineering Research and Studies E-ISSN2249–8974
[47] Y.Kevin Chou, Hui Song, Tool nose radius effects on finish hard turning, Journal of Materials Processing Technology, Volume 148, Issue 2, 15 May 2004, Pages 259-268, ISSN 0924-0136
[48] Zahari Taha, Hani-kurniati LELANA, Hideki AOYAMA,"Effect of insert geometry on surface roughness in the turning process of AISI D2 steel", 11th Asia pacific industrial engineering and management system, Melaka 7-10 december 2010.
AUTHORS Devendra Singh received his M.Tech degree from Delhi Technological University, Delhi, in 2015.He is currently working as an Assistant Professor in Department of Mechanical Engineering in Sagar Institute of Technology and Management, Barabanki, Uttar Pradesh. Vimanyu Chadha is currently pursuing (Third Year) his B.Tech degree from Delhi Technological University, Delhi.
Dr. Ranganath M Singari currently the Associate Professor, Department of Production & Industrial Engineering, Delhi Technological University. Dr. Ranganath M Singari Post Graduate and Doctorate from Delhi University.