
Plastics Spoon Mould Manufacturers, Plastic fork Mould Manufacturer

SAIIE26 Proceedings, 14th – 16th of July 2014, Muldersdrift, South Africa © 2014 SAIIE
1167-1
EFFECT OF MOULD TEMPERATURE ON THE FILLING BEHAVIOR OF MOLTEN RESIN IN PLASTIC INJECTION MOULDING OF HIGH DENSITY POLYETHYLENE (HDPE)
A.M. Gwebu1*, L. Nyanga², S.T. Nyadongo³, A.F. Van der Merwe4, S Mhlanga5,
1,3Department of Industrial and Manufacturing Engineering National University of Science and Technology, Bulawayo, Zimbabwe
[email protected] [email protected]
2,4Department of Industrial Engineering Stellenbosch University, South Africa
[email protected] [email protected]
5Faculty of Engineering and the Built Environment
University of Johannesburg, South Africa [email protected]
ABSTRACT
The growth of injection moulding as a manufacturing process has led to the development of more products resulting in an increase in the focus on product quality, as manufacturers try to lower production costs, reduce product weight and eliminate defects. Of particular concern is the flow behavior of molten resin in the mould cavities during the production process. Inconsistencies in the flow of the melt tend to result in uneven or incomplete filling of the mould, resulting in production of defects (short shots). In the paper the Taguchi method is used to determine the optimum values of the injection moulding process parameters for High Density Polyethylene (HDPE.) plastic parts. A moulding processing window in which the process will achieve maximum quality, with major focus being on mould filling is developed.
* Corresponding author

SAIIE26 Proceedings, 14th – 16th of July 2014, Muldersdrift, South Africa © 2014 SAIIE
1167-2
1 INTRODUCTION
In recent years plastic products have become more appreciated globally, resulting in a high demand that has made it essential for companies in this industry to improve their processing operations to meet the demand for high quality parts. At the same time, as the companies try to produce high quality parts, they seek to retain a competitive edge and make profits in the present market place by lowering the costs of production. Injection moulding ranks as one of the prime processes for producing plastic parts. According to Shin & Park [1], injection moulding is one of the most commonly used manufacturing processes for the fabrication of plastic parts in net shape with excellent dimensional properties. Thermoplastic injection moulding is a well-known fast process for manufacturing simple and complex shaped products. Understanding the phenomena that govern the production of high quality parts determines resultant output in production of plastic parts.
From past literature survey various techniques have been used to assess the effect of different injection moulding parameters on the process. The flow of molten resin and its filling behavior in injection moulds is one such phenomenon that has been studied by different authors. This has been achieved by application of simulation software such as Moldflow and Moldex 3D, in most cases to understand the development of warpage related defects [1]. In this research the effect of filling behavior is assessed by the application of the Taguchi experimental design approach. The research assesses the effect of mould temperature on the injection moulding process versus other key process parameters.
In previous injection moulding research different control parameters have been used depending on the nature of the investigation being carried out [2]. In this study, mould temperature was considered among other injection moulding parameters to assess its impact on the filling of an injection moulded High Density Polyethylene (HDPE) Coke Light weight crate. The effect of injection pressure, mould temperature, melt temperature, switch over value (injection stroke) and injection speed on the filling behavior of polymer melt was investigated by application of the Taguchi parameter design approach. The experimental results were analyzed using Minitab 16 software.
2 THEORETICAL BACKGROUND
2.1 THE INJECTION MOULDING PROCESS
Spina [3] states that the fabrication process consists of three main phases, necessary to fill the mould cavity with molten polymer resin; the injection step, packing step and the cooling step. Therefore, several process parameters which include melt temperature, mould temperature, injection pressure, injection velocity, injection time, packing pressure (holding pressure), packing time (holding pressure time), cooling temperature, switch over value, cooling time and the injection stroke all influence the quality of the injection moulded parts produced [4]. All injection moulding steps are related to the several factors that govern the behavior of the process and part quality.
Filling behavior of polymer melt is an important aspect of injection moulding. The ability of the polymer melt to flow into the injection mould’s cavities, all the way to the micro channels is a very crucial factor in successful injection moulding. In recent studies it has been developed that the nature of the flow of the polymer melt in the mould cavities determines the extent of its penetration into all the crevices of the mould. However with injection moulding being a thermal process the extent of the flow is governed further by the thermal activity of the melt and the mould in as much as the nature of the polymer itself is a key factor.
2.2 Melt flow models
Over the past three decades many authors have developed conjectures on the concepts of injection moulding, particularly on the flow of polymer melt and related defects such as

SAIIE26 Proceedings, 14th – 16th of July 2014, Muldersdrift, South Africa © 2014 SAIIE
1167-3
warpage and incomplete filling of the moulds. According to Bolur [5], Galantucci & Spina [6] in the filling phase melt flows evenly in all directions, assuming that the resistance to flow is equal in all directions creating balanced filling. However Mehat et al. [7] argue that this occurs in the most ideal, because wall thickness, holes/slots and variations in the mould surface temperatures introduce flow resistance differences. Therefore in reality, melt moves in a number of streams with different properties with different resistances to flow which create an unbalanced flow [5]. In the most ideal, the flow of molten polymer is modeled as a Newtonian fluid, with the assumptions that the fluid flow and the temperature preserve their shape along the length of the mould. The concept itself is impractical as molten High Density Polyethylene is a highly viscous substance that solidifies as its temperature drops to equilibrium with the mould temperature at the polymer’s glass transition temperature [8].
Whale et al. [9] state that in an infinite mould, either the skin thickness reaches an equilibrium level at which viscous heat generation within the plastic balances heat loss to the mould, or the mould closes off the gap. In a finite mould, the solid layer maintains the same shape (time invariant) but may or may not attain a constant thickness. The time variant nature of the polymer melt’s flow to its solidification presents a certain level of independence of the flow length from the applied forces on the polymer, to its dependence on its thermal surroundings. Whale et al’s [9] theory is further elucidated by that of Thermokinetic asymmetry of polymer flow inside mould cavities brought forward by Bociaga et al.[10] who states that asymmetric flow exists when there is a temperature difference between opposing mould walls. Bociaga et al. [10] link uneven mould filling and warpage defects in injection moulding to asymmetry in flow of the molten polymer.
Young [11] in developing the Microfilling model proposed that melt flow stops when the melt temperature reaches (or goes below) the transition temperature. As the polymer melt temperature reaches transition temperature, the velocity decreases to zero sharply, this is due to increases in the flow length and viscosity increases due to the cooling polymer melt, thereby leading to the reduction in velocity.
2.3 Effect of temperature on High density polyethylene
In general, polymers degrade at elevated temperatures. According to Galantucci & Spina [6] in polymer degradation, weight loss occurs only after the volatile products begin to vaporize from the sample. Before weight loss the sample would have modified due to the heating experience from the melting temperature (or glass transition temperature) to the decomposition temperature.
Rideal & Padget [12] determined experimentally that the molecular structure of HDPE changes during processing with changes in temperature. Later on Bolur [5] confirmed this empirical result that at high melt temperatures, greater than 290°C, decreases in melt viscosity and narrowing of molecular weight distribution is observed while an increase in viscosity is observed at low temperatures. Moeller [13] affirms that in injection moulding of HDPE, the low temperature limit is characterized by excessive injection pressures and/or physical property degradation. The increases in melt viscosity arise from the molecular enlargement reaction which is mainly attributable to the formation of long chain branches (LCB).
Many processes allow for parts to be moulded below the lower limit temperature at which sufficient physical properties are developed with the most common property failure being poor impact strength. The effect of the low melt temperature is highly retained orientation which results in poor impact performance. The high temperature limit is typically characterized by material degradation or moulding problems due to unreliable part, or runner ejection from the mould these failure modes are easily identified [13].
SAIIE26 Proceedings, 14th – 16th of July 2014, Muldersdrift, South Africa © 2014 SAIIE
1167-4
2.4 Quality characteristics of injection moulded parts
According to Yang & Gao [14], the quality characteristics of plastic injection-moulded products can be roughly divided into three kinds:
the dimensional properties,
the surface properties and
the mechanical or optical properties
Kamal et al. [15] showed that product weight is a critical quality characteristic and a good indication of the stability of the manufacturing process in plastic injection moulding. Yang & Gao [14] revealed that product weight is an important attribute for plastic injection-moulded products because the product weight has a close relation to other quality properties; surface and mechanical properties, particularly other dimensional properties for example thickness and lengths (governed by part packing and filling). They also claimed that the performance of a manufacturing process and quality control can be monitored by the product weight. Kamal et al. [15] showed that controlling the product weight is of great commercial interest and can produce great value for production management.
In this research crate weight was used as the quality characteristic to monitor the extent of filling.
3 METHODOLOGY
Spina [3] stated that Taguchi methods are structured and organized Design of Experiments (DOE) methods that are used to determine and understand relationships between factors affecting a particular process and the resultant output .These techniques are applied in different scenarios to statistically quantify indeterminate measurements of factors and their relationships (interactions) by observing methodically forced changes. The main advantage of the technique is the identification of principal factors that govern the output of a particular process and the subsequent development of an understanding on how to achieve desired part quality.
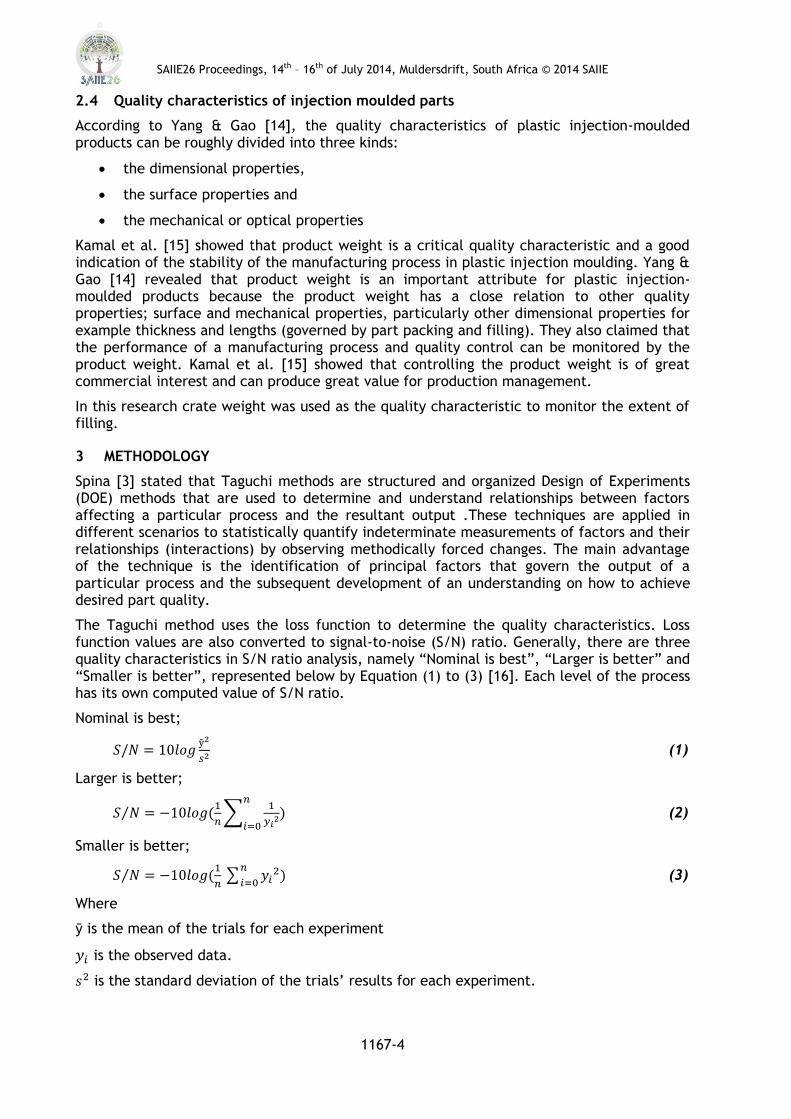
The Taguchi method uses the loss function to determine the quality characteristics. Loss function values are also converted to signal-to-noise (S/N) ratio. Generally, there are three quality characteristics in S/N ratio analysis, namely “Nominal is best”, “Larger is better” and “Smaller is better”, represented below by Equation (1) to (3) [16]. Each level of the process has its own computed value of S/N ratio.
Nominal is best;
(1)
Larger is better;
⁄
∑
(2)
Smaller is better;
⁄
∑
(3)
Where
ȳ is the mean of the trials for each experiment
is the observed data.
is the standard deviation of the trials’ results for each experiment.

SAIIE26 Proceedings, 14th – 16th of July 2014, Muldersdrift, South Africa © 2014 SAIIE
1167-5
3.1 Taguchi Experimental Procedure
In Taguchi experimental procedure the process objective has to be defined. In defining the process objective, the factors (design parameters) that affect the process are determined. The number of levels that the factors are varied over should then be specified. Based on the number of factors and levels selected for the experiments, the appropriate orthogonal array is chosen. The factors are then assigned to the columns as is defined by the selected array before conducting the actual experimentation. The experiments are conducted according to the indications by the array and observed data is collected as they are being carried out. Complete data is analyzed to determine the effects of the different parameters on the performance objective. Figure 1 shows the steps on the application of the Taguchi method in experimental design.
Figure 1: Steps on application of Taguchi Method
3.2 Experimental Set up
The experiments were carried out on an Engel DUO 16050/1000 injection moulding machine shown in Figure 2, running production on the light weight Coke mould. The set values for the injection pressure, injection speed and switch over value were set on the human machine interface on the machine. The melt temperature was achieved by changing the set temperatures on the injection moulder’s barrel heaters; these values were set on the human machine interface as well. The actual melt temperature value was then obtained after purging the molten polymer and measuring the temperature using an infrared hand held temperature pyrometer. The mould temperature was obtained by use of the pyrometer as well on the mould cores under monitoring. The Piovan water heater provided the temperature regulation for the heated up sections of the mould, to provide the desired mould temperature for experimentation.

SAIIE26 Proceedings, 14th – 16th of July 2014, Muldersdrift, South Africa © 2014 SAIIE
1167-6
Figure 2: The machine and mould used for the experiments
4 DESIGN OF EXPERIMENT
The experiment focused on determining the effect of injection moulding parameters on the weight of a moulded part. It involved the variation of five (5) parameters (injection pressure, mould temperature, melt temperature, switch over set value and injection speed) over two levels. According to the Taguchi Design of Experiments approach, the samples should be organized into 8 groups; this is the L8 Orthogonal array as shown in Table 1. The numbers 1 and 2 represent the levels of the different factors.
Table 1: L8 Orthogonal array
Experiment P1 P2 P3 P4 P5
1 1 1 1 1 1
2 1 1 1 2 2
3 1 2 2 1 1
4 1 2 2 2 2
5 2 1 2 1 2
6 2 1 2 2 1
7 2 2 1 1 2
8 2 2 1 2 1
Where:
P1 is Injection Pressure in bar P2 is Mould Temperature in °C
P3 is Melt temperature in °C P4 is Switch over set value in mm
P5 is Injection speed in mm/s
The parameters were tested at two levels due to limitations from the company policies in the organization in which the experiments were executed. The choice of values for injection

SAIIE26 Proceedings, 14th – 16th of July 2014, Muldersdrift, South Africa © 2014 SAIIE
1167-7
pressure and injection speed was based on the lowest that had ever been set for that particular product and the highest pressure achievable by the machine. Mould and melt temperature values were limited by the viability of the process and the desire to avoid excessive production of rejects during the experimentation; though the inevitability of this was understood. The switch-over value is indicative of the injection stroke. Increasing it reduces the injection stroke and the opposite is true.
The weight was chosen as the measuring characteristic as it is indicative of filling behavior for a crate. The process parameter settings that were applied are as shown in Table 2.
Table 2: Parameters and levels for the experiment
Level Injection Pressure
Mould temperature
Melt Temperature
Switch over value
Injection Speed
1 175 bar 35°C 230°C 60mm 60mm/s
2 208 bar 60°C 260°C 75mm 87mm/s
The combination of the parameters and the levels yields are summarized in Table 3 below.
Table 3: Combination of parameters and levels
Experiment Injection Pressure
Mould Temperature
Melt temperature
Switch over set value
Injection speed
1 175 bar 35°C 230 °C 60mm 60mm/s
2 175 bar 35°C 230 °C 75mm 87mm/s
3 175 bar 60°C 260 °C 60mm 60mm/s
4 175 bar 60°C 260 °C 75mm 87mm/s
5 208 bar 35°C 260 °C 60mm 87mm/s
6 208 bar 35°C 260 °C 75mm 60mm/s
7 208 bar 60°C 230 °C 60mm 87mm/s
8 208 bar 60°C 230 °C 75mm 60mm/s
5 RESULTS AND DISCUSSION
In determining the result the S/N ratio, the nominal is best quality characteristic, represented by equation (1), was the targeted quality characteristic for crate weight. The effects of the level of each factor on the quality characteristic were analyzed using S/N ratios. Table 4 showed the result for the 8 trials and the calculated means and standard deviations. All computations were done on Minitab 16 software.

SAIIE26 Proceedings, 14th – 16th of July 2014, Muldersdrift, South Africa © 2014 SAIIE
1167-8
Table 4: Summary of results for coke crate weight
Expt P1 P2 P3 P4 P5 Trial 1
Trial 2
Trial 3
Mean SN Value
1 175 bar 35°C 230 °C 60mm 60mm/s 1.394 1.397 1.398 1.396 56.5316
2 175 bar 35°C 230 °C 75mm 87mm/s 1.422 1.419 1.420 1.420 59.3680
3 175 bar 60°C 260 °C 60mm 60mm/s 1.445 1.445 1.442 1.444 58.4201
4 175 bar 60°C 260 °C 75mm 87mm/s 1.481 1.481 1.484 1.482 58.6458
5 208 bar 35°C 260 °C 60mm 87mm/s 1.459 1.460 1.459 1.460 63.2871
6 208 bar 35°C 260 °C 75mm 60mm/s 1.428 1.424 1.427 1.426 56.7162
7 208 bar 60°C 230 °C 60mm 87mm/s 1.530 1.530 1.529 1.530 63.6938
8 208 bar 60°C 230 °C 75mm 60mm/s 1.426 1.425 1.426 1.426 63.0824
Table 5 shows the response for the S/N ratio for the crate weight based on rankings as calculated on Minitab 16. Table 5 shows rankings of the parameters based on their impact on the filling of the mould, with weights as the performance measuring characteristic.
Table 5: Response table of S/N Ratio for part weight
Level Injection Pressure (bar)
Mould Temperature (°C)
Melt temperature (°C)
Switch over value (mm)
Injection speed (mm/s)
1 58.24 58.98 60.67 60.48 58.69
2 61.69 60.96 59.27 59.45 61.25
Delta 3.45 1.98 1.40 1.03 2.56
Rank 1 3 4 5 2
The standard weight for a Coke Light weight crate is 1.420 kg +/- 20g. The mean weight for the 8 experiments was 1.448kg. According to the selected quality characteristic, ‘’the nominal is best’’ the optimum combinations for the parameters for crate filling with respect to part weight were selected by them achieving the target part weight of 1.420kg and are shown in Table 6 below. It should be noted however that, factor combinations for experiments 3, 6 and 8 also produce parts that fall within the acceptable quality level of +/-20g from the target value.

SAIIE26 Proceedings, 14th – 16th of July 2014, Muldersdrift, South Africa © 2014 SAIIE
1167-9
Table 6: Optimum factor combinations
Parameter Level Value
Injection pressure 1 175 bar
Mould temperature 1 35°C
Melt temperature 1 230 °C
Switch over value 2 75mm
Injection speed 2 87mm/s
In this study ANOVA was also used to analyze the effects of the injection pressure, mould temperature, melt temperature, switch over value and injection pressure. ANOVA is a tool for determining individual interactions of all control factors. The performed experimental plan was evaluated at a confidence level of 95%. The ANOVA values for the experimental results were computed on Minitab 16 and displayed as shown in Figure 3 below. The significance level of the experiments is represented by R-Sq and is 89.66%.
Figure 3: Results of ANOVA for the experiments
The significance of each factor was depicted by the F value of each control factor. Figure 4 shows the S/N response diagram constructed for the part weight based on Table 5 and as plotted on Minitab 16.
SAIIE26 Proceedings, 14th – 16th of July 2014, Muldersdrift, South Africa © 2014 SAIIE
1167-10
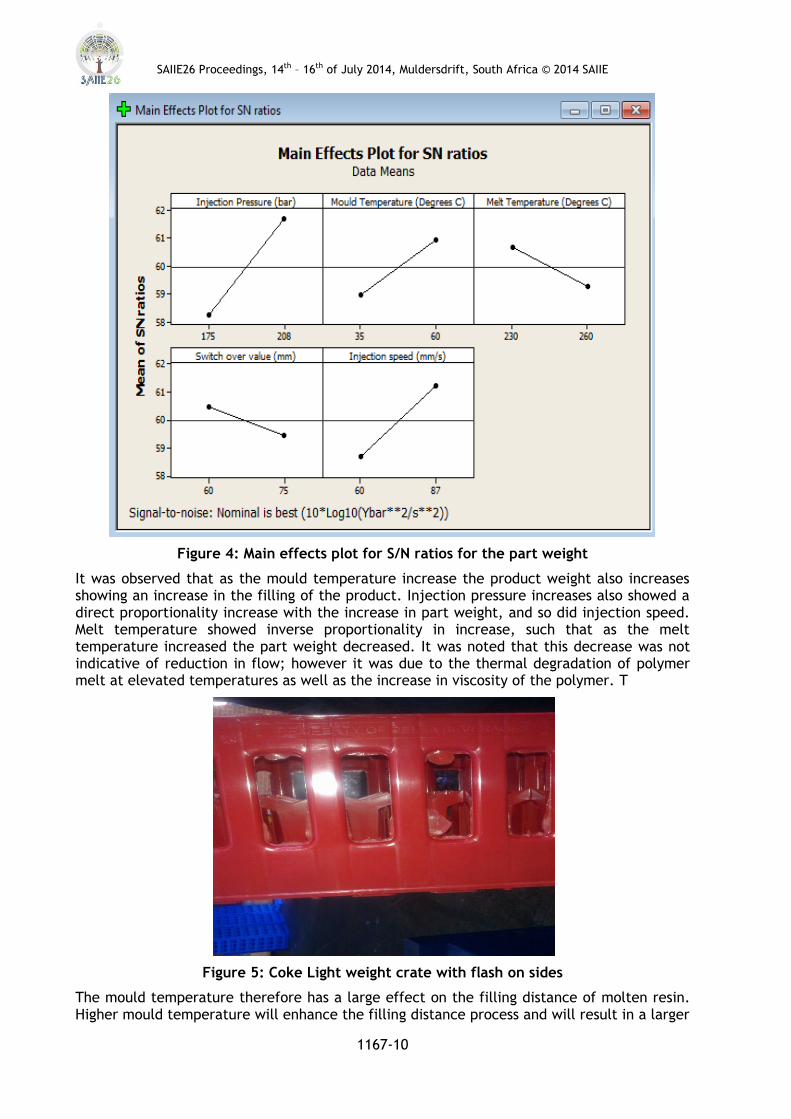
Figure 4: Main effects plot for S/N ratios for the part weight
It was observed that as the mould temperature increase the product weight also increases showing an increase in the filling of the product. Injection pressure increases also showed a direct proportionality increase with the increase in part weight, and so did injection speed. Melt temperature showed inverse proportionality in increase, such that as the melt temperature increased the part weight decreased. It was noted that this decrease was not indicative of reduction in flow; however it was due to the thermal degradation of polymer melt at elevated temperatures as well as the increase in viscosity of the polymer. T
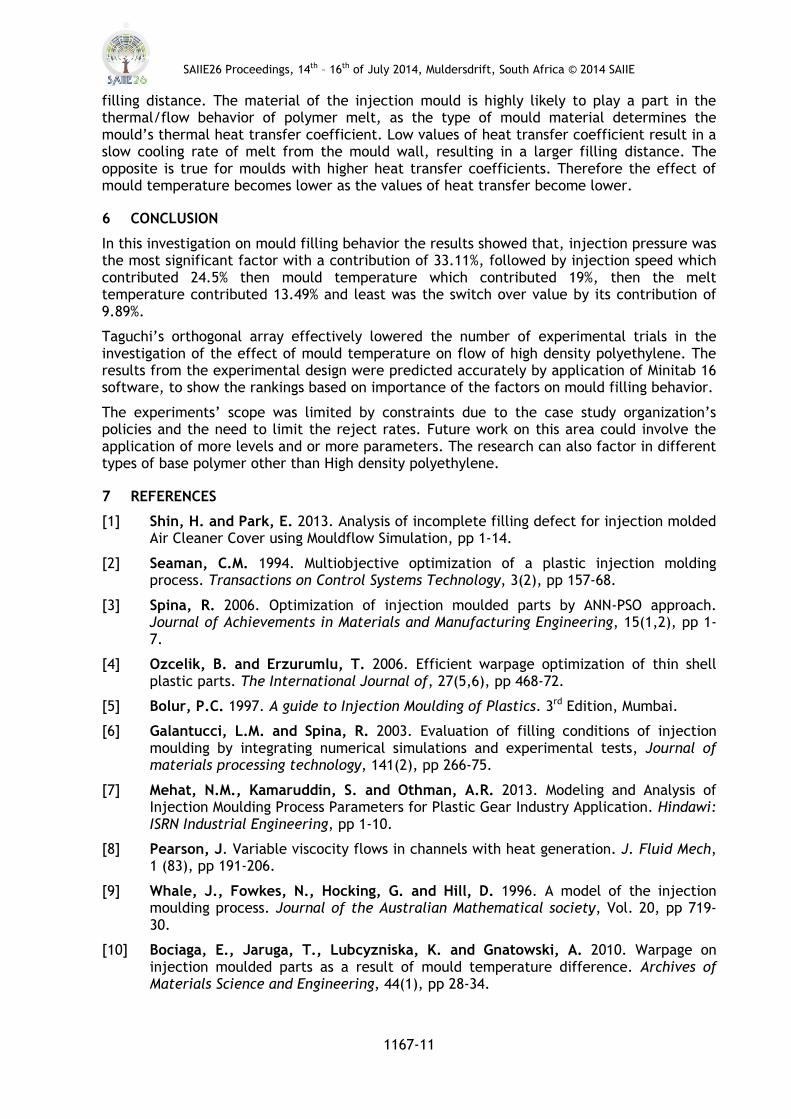
Figure 5: Coke Light weight crate with flash on sides
The mould temperature therefore has a large effect on the filling distance of molten resin. Higher mould temperature will enhance the filling distance process and will result in a larger
SAIIE26 Proceedings, 14th – 16th of July 2014, Muldersdrift, South Africa © 2014 SAIIE
1167-11
filling distance. The material of the injection mould is highly likely to play a part in the thermal/flow behavior of polymer melt, as the type of mould material determines the mould’s thermal heat transfer coefficient. Low values of heat transfer coefficient result in a slow cooling rate of melt from the mould wall, resulting in a larger filling distance. The opposite is true for moulds with higher heat transfer coefficients. Therefore the effect of mould temperature becomes lower as the values of heat transfer become lower.
6 CONCLUSION
In this investigation on mould filling behavior the results showed that, injection pressure was the most significant factor with a contribution of 33.11%, followed by injection speed which contributed 24.5% then mould temperature which contributed 19%, then the melt temperature contributed 13.49% and least was the switch over value by its contribution of 9.89%.
Taguchi’s orthogonal array effectively lowered the number of experimental trials in the investigation of the effect of mould temperature on flow of high density polyethylene. The results from the experimental design were predicted accurately by application of Minitab 16 software, to show the rankings based on importance of the factors on mould filling behavior.
The experiments’ scope was limited by constraints due to the case study organization’s policies and the need to limit the reject rates. Future work on this area could involve the application of more levels and or more parameters. The research can also factor in different types of base polymer other than High density polyethylene.
7 REFERENCES
[1] Shin, H. and Park, E. 2013. Analysis of incomplete filling defect for injection molded Air Cleaner Cover using Mouldflow Simulation, pp 1-14.
[2] Seaman, C.M. 1994. Multiobjective optimization of a plastic injection molding process. Transactions on Control Systems Technology, 3(2), pp 157-68.
[3] Spina, R. 2006. Optimization of injection moulded parts by ANN-PSO approach. Journal of Achievements in Materials and Manufacturing Engineering, 15(1,2), pp 1-7.
[4] Ozcelik, B. and Erzurumlu, T. 2006. Efficient warpage optimization of thin shell plastic parts. The International Journal of, 27(5,6), pp 468-72.
[5] Bolur, P.C. 1997. A guide to Injection Moulding of Plastics. 3rd Edition, Mumbai.
[6] Galantucci, L.M. and Spina, R. 2003. Evaluation of filling conditions of injection moulding by integrating numerical simulations and experimental tests, Journal of materials processing technology, 141(2), pp 266-75.
[7] Mehat, N.M., Kamaruddin, S. and Othman, A.R. 2013. Modeling and Analysis of Injection Moulding Process Parameters for Plastic Gear Industry Application. Hindawi: ISRN Industrial Engineering, pp 1-10.
[8] Pearson, J. Variable viscocity flows in channels with heat generation. J. Fluid Mech, 1 (83), pp 191-206.
[9] Whale, J., Fowkes, N., Hocking, G. and Hill, D. 1996. A model of the injection moulding process. Journal of the Australian Mathematical society, Vol. 20, pp 719-30.
[10] Bociaga, E., Jaruga, T., Lubcyzniska, K. and Gnatowski, A. 2010. Warpage on injection moulded parts as a result of mould temperature difference. Archives of Materials Science and Engineering, 44(1), pp 28-34.

SAIIE26 Proceedings, 14th – 16th of July 2014, Muldersdrift, South Africa © 2014 SAIIE
1167-12
[11] Young, W.B. 2007. Analysis of filling distance in cylindrical microfeatures for microinjection molding. Applied mathematical modelling, 31(9), pp 178-1806.
[12] Rideal, G.R. and Padget, J.C. 1976. The Thermal-mechanical degradation of high density polyethylene. In Journal of Polymer Science: Symposia, 57(1), pp 1-15.
[13] Moeller, H. W. 2007. Progress in polymer degradation and stability research. Nova publisher.
[14] Yang, Y. and Gao, F. 2006. Injection molding product weight: online prediction and control based on a nonlinear principal component regression model. Polymer Engineering and Science, 46(4), pp 540-48.
[15] Kamal, M.R., Varela, A.E. and Patterson, W.I. 1999. Control of part weight in injection molding of amorphous thermoplastics. Polymer Engineering and Science, 27(5/6), pp 468-72.
[16] MINITAB version 16.0. 2014. Computer software, Minitab Inc. State College, Pennsylvania.