Effect of Microstructure on the Static and Dynamic Behavior … · · 2016-05-13For Cold In-Place...
45
Effect of Microstructure on the Static and Dynamic Behavior of Recycled Asphalt Material Martin H. Sadd, Professor Qingli Dai, Research Assistant May 2001 URI-TC Project No. 536108 Prepared For University of Rhode Island Transportation Center DISCLAIMER This report, prepared in cooperation with the University of Rhode Island Transportation Center, does not constitute a standard, specification, or regulation. The contents of this report reflect the views of the author(s) who is (are) responsible for the facts and the accuracy of the data presented herein. This document is disseminated under the sponsorship of the Department of Transportation, University Transportation Centers Program, in the interest of information exchange. The U.S. Government assumes no liability for the contents or use thereof. i
Transcript of Effect of Microstructure on the Static and Dynamic Behavior … · · 2016-05-13For Cold In-Place...

Effect of Microstructure on the Static and Dynamic Behavior of Recycled Asphalt Material
Martin H. Sadd, Professor
Qingli Dai, Research Assistant
May 2001
URI-TC Project No. 536108
Prepared For
University of Rhode Island Transportation Center
DISCLAIMER This report, prepared in cooperation with the University of Rhode Island Transportation Center, does not constitute a standard, specification, or regulation. The contents of this report reflect the views of the author(s) who is (are) responsible for the facts and the accuracy of the data presented herein. This document is disseminated under the sponsorship of the Department of Transportation, University Transportation Centers Program, in the interest of information exchange. The U.S. Government assumes no liability for the contents or use thereof.
i

1. Report No 2. Government Accession No. 3. Recipient's Catalog No. URITC 99-8 NN/A N/A 4. Title and Subtitle 5. Report Date
May 2001 6. Performing Organization Code
Effect of Microstructure on the Static and Dynamic Behavior of Recycled Asphalt Materials
N/A 7. Authors(s) 8. Performing Organization Report No. Martin H. Sadd and Qingli Dai 9. Performing Organization Name and Address 10. Work Unit No. (TRAIS)
N/A 11. Contract or Grant No. 536108 13. Type of Report and Period Covered
University of Rhode Island Mechanical Engineering & Applied Mechanics Department 92 Upper College Road Kingston, RI 02881 Final 12. Sponsoring Agency Name and Address 14. Sponsoring Agency Code
URITC 99-8 A Study Conducted in Cooperation With the U.S. DOT
University of Rhode Island Transportation Center Kingston, RI 02881 15. Supplementary Notes N/A 16. Abstract This report describes the first year’s research activities of a project dealing with the behavior of recycled asphalt pavement (RAP). The project’s primary interest is to relate particular microstructural and recycling parameters to the material’s mechanical response. The first year was devoted to the development of a theoretical/numerical modeling scheme. Future work will involve both theoretical/numerical and experimental studies. The numerical model was developed using the finite element method, whereby the microstructural asphalt/binder system was replaced by an equivalent finite element network. Special elements in the network are developed and these represent the load carrying behavior between neighboring aggregate pairs. Based on this modeling work, a computer simulation code (FEAMS) was created. Also developed was a material generating code (AMGEN), which can create an aggregate-binder model system with varying degrees of microstructure. Development of the finite element model and the material generating procedure are discussed in detail. Comparative verification computer runs on single element and 4-cell aggregate structures are presented. Finally, model simulations of standard laboratory experiments including compression and indirect tension tests are given. Although the results are preliminary, they do indicate that the modeling scheme provides useful comparisons and information that can be applied to RAP materials. 17. Key Words 18. Distribution Statement
Recycled Asphalt, Finite Element Modeling, Asphalt Microstructure, Numerical Simulation
No restrictions. This document is available to the public through the University of Rhode Island Transportation Center, 85 Briar Lane, Kingston, RI 02881
19. Security Classif. (of this report) 20. Security Classif. (of this page) 21. No. of Pages 22. Price
Unclassified Unclassified 45 N/A Form DOT F 1700.7 (8-72) Reproduction of completed page authorized (art. 5/94)
ii
TABLE OF CONTENTS
Page
ABSTRACT 1
1. INTRODUCTION 2
2. ASPHALT MATERIAL MODELING 5
3. FINITE ELEMENT AGGREGATE/BINDER MODEL 8
4. COMPUTER CODES 12
4.1 Asphalt Material Generating Code (AMGEN) 12
4.2 Finite Element Simulation Code (FEAMS) 17
5. MODEL VERIFICATION RESULTS 19
5.1 Single Element Verification 20
5.2 4-Cell Verification 24
6. COMPRESSION AND INDIRECT TENSION SIMULATIONS 28
6.1 Compression Test Simulation 28
6.2 Indirect Tension Test Simulation 32
7. SUMMARY & CONCLUSIONS 37
8. REFERENCES 38
iii

ABSTRACT
This report describes the first year’s research activities of a project dealing with the
behavior of recycled asphalt materials (RAP). The project’s primary interest is to relate
particular microstructural and recycling parameters to the material’s mechanical response. The
first year was devoted to the development of a theoretical/numerical modeling scheme. Future
work will involve both theoretical/numerical and experimental studies. The numerical model
was developed using the finite element method, whereby the microstructural asphalt/binder
system was replaced by an equivalent finite element network. Special elements in the network
are developed and these represent the load carrying behavior between neighboring aggregate
pairs. Based on this modeling work, a computer simulation code (FEAMS) was created. Our
modeling has also developed a material generating code (AMGEN), which can create an
aggregate-binder system with varying degrees of microstructure. Development of the finite
element model and the material generating procedure are discussed in detail. Comparative
verification computer runs on single element and 4-cell aggregate structures are presented.
Finally, model simulations of standard laboratory experiments including compression and
indirect tension tests are given. Although the results are preliminary, they do indicate that the
modeling scheme provides useful comparisons and information that can be applied to recycled
asphalt materials.
1

1. INTRODUCTION
Because of its environmentally friendly nature and promise for cost savings, there exists
considerable state, national and international interest in the use of recycled asphalt pavement
materials (RAP). Such use of recycled materials has been occurring with varying degrees of
success in the United States for the past 20 years. In 1998 the U.S. Congress established the
Recycled Materials Resource Center (RMRC) at the Universtiy of New Hampshire. The purpose
of the Center was to use research and outreach to reduce barriers to recycling in road
construction. Just recently the Federal Highway Administration completed a report by
Schimmoller, et.al. (1) of a scanning tour of recycling activities in several European countries.
This report was presented at the last Transportation Research Board meeting in January 2001.
These activities clearly indicate the strong national interest in the appropriate use of recycled
products for roadways.
Both hot and cold mix recycled materials exhibit different mechanical properties when
compared with new pavement product. In some cases the performance of RAP materials has not
been as good, while in other cases the recycled product had better structural performance,
Kandhal, et.al. (2). For Cold In-Place Recycling (CIR), recent work by Brayton, et.al. (3) has
investigated performanced-based mix-designs in an effort to provide information on the proper
use of such materials. However, there still exists uncertainty on proper recycling processes and
on the subsequent performance of the recycled product. Asphalt is a complex heterogeneous
material composed of aggregate, binder/cement, additives and void space. Recycling processes
further complicate the mechanical behavior by introducing additional variation of these
constituents, and by adding several ageing/time-dependent effects such as hardening, chemical
oxidation and binder microcracking. A fundamental understanding of the material behavior is
2

needed to help understand and explain recycling issues, and a micromechanical model would be
best to establish such basic mechanisms.
During service, asphalt pavements must withstand a wide variety of loading and
temperature conditions. For example, traffic loadings can vary from quasi-static to dynamic
impact, and pavement breakdown commonly occurs as a result of strength (stress), fracture
and/or fatigue failure, and time dependent deformation (creep-rutting). Early studies on the
mechanical and fracture behaviors of asphalt and bituminous cements include the work of Salam
and Monismith (4), Majidzaheh and Kauffmann (5), Majidzadeh et.al. (6), Karakouzian and
Majidzadeh (7), and Sousa and Monismith (8). With regard to recycled materials, Sulaiman and
Stock (9) have conducted fracture experiments on RAP materials with varying amounts of
recycled constituent. Most recently Venkatram (10) conducted a series of fracture and dynamic
impact experiments on RAP materials.
As mentioned, asphalt is a multiphase, heterogeneous material composed of aggregate
particles, binder cementation and open void space. Previous studies focusing on the continuum
response of asphalt materials cannot be used to describe the micromechanical behavior between
aggregate and binder. Recently some studies have been investigating the micromechanical
behaviors of particulate, porous and heterogeneous materials. For example, studies on cemented
particulate materials by Dvorkin et.al. (11) and Zhu et.al. (12,13) provide information on the load
transfer between particles which are cemented together. Such mechanics provide details on the
normal and tangential interparticle load transfer, and would be fundamental in developing a
micromechanical theory for load distribution and failure of such materials. Some contact-based
analysis of asphalt performance has recently been reported by Zhu et.al. (14,15). Using mixture
theory, Krishnan and Rao (16) presented a multi-phase approach to explain air void reduction in
asphalt materials under load.
3

Recent numerical modeling of cemented particulate materials has generally used two
particular simulation schemes. The first method uses finite element procedures to establish the
load carrying behavior between the particles. A second general approach incorporates the
discrete element method, which models the individual motion of each particle in model granular
systems.
Discrete element modeling studies on cemented particulate materials include the work by
Rothenburg, et.al. (17), Chang and Meegoda (18), Trent and Margolin (19), Buttlar and You (20)
and Ullidtz (21). Sadd et.al. (22,23) have also used this scheme to numerically investigated the
dynamic response of cemented and damaged granular materials.
In regard to finite element modeling (FEM), Stankowski (24) applied standard FEM
techniques to cemented particulate composites, while Liao and Chang (25) established a FEM
scheme for particulate materials with no cementation. A general finite element approach to
simulate particulate material systems has used the idea of representing the interparticle behavior
using an equivalent lattice network system. This type of microstructural modeling has been used
previously; see for example Bazant, et.al. (26), Sadd et.al. (27) and Budhu, et.al. (28). Recently,
Mustoe and Griffiths (29) developed a finite element model, which was equivalent to a particular
discrete element approach. They pointed out that the FEM model has an advantage over the
discrete element scheme for static problems.
Based on the review of past modeling work, the finite element scheme appeared to be
most suited for developing an asphalt simulation model. Recycling will obviously affect the
cemenatation/binder properties and the cohesion response between binder and aggregate, and
these particular behaviors are of prime interest in the study. Using fundamental modeling at the
micromechanical level, emphasis was placed on particular aggregate-binder behaviors which
most directly affect the overall mechanical properties of the material and which are related to
4

recycling processes. Current research results for the first year include the development of two
computer codes: one for generating model material systems and one for conducting mechanical
asphalt simulation of the generated models. Results using each of these codes are presented.
2. ASPHALT MATERIAL MODELING
Bituminous asphalt can be described as a multi-phase material containing aggregate,
binder cement (including mastic and fine particles) and air voids (see Figure 1). The load
transfer between the aggregates plays a primary role in determining the load carrying capacity
and failure of such complex materials. Our goal is to develop a numerical micromechanical
Aggregate
Aggregate
Binder
Void
FIGURE 1 Schematic of multi-phase asphalt materials.
model of such materials by properly accounting for the load transfer between all aggregates in an
idealized cemented particulate system. The aggregate material is normally much stiffer than the
binder, and thus aggregates are to be modeled as rigid particles. On the other hand, the softer
binder cement material usually gives a time-dependent viscoelastic response under loading.
Additionally, binder behavior also can include hardening, debonding and microcracking, and
5

these lead to many complicated failure mechanisms. Therefore, asphalt materials provide great
challenges to develop models that can adequately predict such failures.
In order to properly account for the load transfer between aggregates in an idealized
system, we assume that there is an effective binder zone between neighboring particles. It is
through this zone that the micro-mechanical load transfer occurs between each aggregate pair.
This loading can be reduced to a resultant force and moment system as shown in Figure 2. The
resultant force loading on a given aggregate can be reduced to normal and tangential components
with respect to a coordinate system parallel and perpendicular to a line connecting the aggregate
mass centers.
t n
Fn
Ft M
Aggregate Pair Cement Binder Loading
Resultant Force and Moment System
FIGURE 2 Interparticle loading between typical aggregate pairs. This concept suggests the use of a finite element model to simulate this interparticle load transfer
using a frame-type of element. Such a modeling scheme would then replace the cemented
aggregate system with a network of specially created finite elements connected at the aggregate
mass centers, as shown in Figure 3.
6

FIGURE 3 Finite element network model.
In order to model the inter-particle load transfer behavior some simplifying assumptions
must be made about allowable aggregate shape and the binder geometry. Aggregate geometry
has been studied for many years, and recently some work has been conducted on quantifying
such geometrical properties, Zhu and Nodes (15), Buchanan (30), Maerz and Lusher (31),
Masad, et.al. (32), and Ketcham and Shashidhar (33). Issues related to particle size, shape,
angularity and texture have been proposed; however, for the present modeling only size and
shape will be considered. In general, asphalt concrete contains aggregate of very irregular
geometry as shown in Figure 4(a). Our approach is to allow variable size and shape using a
simple elliptical aggregate model as represented in Figure 4(b).
(b) Model Asphalt System (a) Typical Asphalt Material
FIGURE 4 Asphalt aggregate modeling.
7

Using this scheme, a typical model aggregate pair is shown in Figure 5. In order to construct the
various geometrical properties, each idealized elliptical aggregate is characterized by shape
measures ai and bi, and location and orientation with respect to a global coordinate system. The
finite element lies along the branch vector defined as the line connecting particle mass centers.
The effective binder area is defined as a strip of cementation material parallel to the branch
vector as shown. By varying the cementation widths w1 and w2, different amounts and
distributions of binder can be created within the numerical model.
Particle (i)
Particle (j)
Effective Binder Area = Aij
xi
xj
yi
yj
12
2
2
2
=+i
i
i
i
by
ax
12
2
2
2
=+j
j
j
j
by
ax
)( xijb
)( yijb
2)(2)( yij
xijij bbbVectorBranch +==
X
Y
Global Coordinate System
w1
w2
FIGURE 5 Idealized aggregate geometry.
3. FINITE ELEMENT AGGREGATE/BINDER MODEL
We propose to model the interparticle load transfer by using a specially developed frame-
type finite element. In order to determine the stiffness properties of the proposed microstructural
finite element, consider the element shown in Figure 6. Nodal displacements and rotations
correspond to the aggregate mass center motions.
8

U1
U2
V1
V2
M1
M2
1
2
FIGURE 6 Finite element model.
The element has three degrees of freedom at each of the two nodes, and would therefore have the
following element equation for the chosen coordinate system,
)1(
.........
.....
.
2
2
2
1
1
1
2
2
2
1
1
1
66
5655
464544
36353433
2625242322
161514131211
⎪⎪⎪
⎭
⎪⎪⎪
⎬
⎫
⎪⎪⎪
⎩
⎪⎪⎪
⎨
⎧
=
⎪⎪⎪
⎭
⎪⎪⎪
⎬
⎫
⎪⎪⎪
⎩
⎪⎪⎪
⎨
⎧
θ
θ
⎥⎥⎥⎥⎥⎥⎥
⎦
⎤
⎢⎢⎢⎢⎢⎢⎢
⎣
⎡
MFFMFF
VU
VU
KKKKKKKKKKKKKKKKKKKKK
t
n
t
n For a usual frame element, the various stiffness terms Kij are determined using standard uniaxial
bar and Euler-Bernouli or Timoshenko beam theory. However, for our particular application, the
asphalt cement cannot be modeled by simple bar or beam action. A more complete stress
analysis within the binder material is need, and this can be determined from an approximate
elasticity solution originally developed by Dvorkin et.al. (11). This work provides a simple
9

analytical solution for the stress distribution in a cement layer between two particles. We use the
special case where the particle material stiffness is much greater than that of the cement layer,
and thus the particles are assumed to be rigid. Dvorkin has shown that effects of non-uniform
cement thickness are generally negligible, and so we will use the analytical solution for the
uniform cementation case. Dvorkin’s two-dimensional model is based on the geometry shown in
Figure 7 (uniform cement thickness case). Note that since we are allowing arbitrary non-
symmetric cementation (see Figure 5), the finite element will not necessarily pass through the
center of the binder material, i.e. . w = w1 + w2 , but w1 ≠ w2 ≠ w/2 , and an eccentricity variable
may be defined by e = (w2 - w1)/2.
x
z
ho
w2
Cement Binder w1
Element Line
FIGURE 7 Cement layer between two particles.
The stresses σx, σz and τxz within the cementation layer can be calculated for particular
relative particle motion cases as shown in Figure 8. These stresses can then be integrated to
determine the total load transfer within the cement binder.
10

x
z Wo
(Normal Displacement)
x
z Uo
(Tangential Displacement)
x
z Υo
(Rotational Displacement @ Point O)
w1 w2
O
FIGURE 8 Normal, tangential and rotational inter-particle motions.
Resultant force calculations for the cases of normal, tangential and rotational particle motions are
given by equations (2), (3) and (4), respectively.
( )
( ) ( ) ( )0
021
2210
0
0
0
0
221
)2(0
2
hewW
wwdxwxM
dxF
hwW
dxF
z
w
zo
w
xzt
w
zn
μ+λ=−σ=−σ=
=τ=
μ+λ=σ=
∫
∫
∫
)3(
0
00
0
0
∫
∫μ=τ=
=σ=
w
xzt
w
zn
hwU
dxF
dxF
( ) ( ) ( )
( ) ( ) ( ) ( ) ( )2121
22
0
0
0 0
21
0
01
0 020
0
0
0 0 10
0
322
)4(
22
wwwwhw
dxwxh
dxwxM
kch
wdxF
hew
dxwxh
dxF
w w
zo
w
xzt
w w
zn
+−θ
μ+λ=−θ
μ+λ=−σ=
⎟⎠⎞
⎜⎝⎛ θ+μ=τ=
θμ+λ=−
θμ+λ=σ=
∫ ∫
∫
∫ ∫
11

Using relations (2), (3) and (4) the various stiffness terms Kij in relation (1) can be determined
employing the direct stiffness method by making special choices of the nodal displacement
vector. The final result is given by
( ) ( )
( ) ( )
)5(
33
0000
33
0000
][
2121
22
222
2121
22212
21
2121
22211
2121
22
211
21
⎥⎥⎥⎥⎥⎥⎥⎥⎥
⎦
⎤
⎢⎢⎢⎢⎢⎢⎢⎢⎢
⎣
⎡
+−+−+−−−
−−−−−
+−−−−+−+
−−−
=
wwwwKrKrKeKwwwwKrrKrKeK
rKKrKKeKKeKK
wwwwKrrKrKeKwwwwKrKrKeK
rKKrKKeKKeKK
K
nnttttnn
nnttttnn
tttttttt
nnnnnnnn
nnttttnn
nnttttnn
tttttttt
nnnnnnnn
where Knn = (λ+2μ)w/ho , Ktt = μw/ho , and r1 and r2 are the radial dimensions from each
aggregate center to the cementation boundary.
4. COMPUTER CODES
As mentioned the purpose of the research was to develop a numerical simulation model,
which could predict the two-dimensional behavior of asphalt materials using micromechanical
physics. The end result of this work was the creation of computer codes, which implement
particular theoretical and analytical formulations. In particular our software development
involved the creation of an asphalt material generating code and a finite element simulation
code. The generating code creates idealized materials, which are input into the simulation code
to conduct numerical experiments. Each of these codes will now be discussed in detail.
4.1 Asphalt Material Generating Code (AMGEN)
In order to simulate the micromechanical behavior of asphalt materials, it is first
necessary to create particular idealized asphalt materials. These idealized material models must
contain appropriate microstructural geometry such as the size, shape and distribution of the
12

aggregates, binder and voids. This internal microstructure or fabric must be controllable by the
software and should allow the user to create a variety of asphalt materials commonly used in
pavement applications. With this in mind, we developed the Asphalt Material Generator
(AMGEN) code, which was written using MATLAB software. The code has the following
general features:
- creates and spatially distributes aggregate particles of circular or elliptical shape
- particle shapes and distributions can be regular or random
- creates and spatially distributes rectangular strips of binder material between
neighboring particles
- can create materials of rectangular or circular domain
- generates model geometric and material property files needed as input to the finite
element simulation code
The code may be described by considering the required geometrical data needed to
generate the material model. Consider first the typical particle pair shown previously in Figure
5. In order to create aggregate microstructure, the following particle geometry is needed: mass
center location (xi, yi); orientation θi; and shape factors (ai ,bi). Binder microstructure requires
the geometrical specification of the cementation widths (w1, w2). Further code calculations
determine additional binder geometry of thickness ho , average thickness, and cement area.
Particle locations allow the calculation of the branch vectors bij and these in turn become the
elements in the finite element network system. Each two-noded element has several
microstructural properties including element and nodal numbering, and an overlap marker (0 or
1) to indicate whether the element link crosses with another element in the model. Note that an
overlapping element would have a higher overall stiffness property. The generating code
decision to create a binder finite element link is determined by a proximity parameter. If the
13

distance between a particle pair (branch vector) exceeds this proximity criterion, the interaction
is to be neglected and no element is created for this particular aggregate pair. The basic
geometry is developed from user selection of the following: material domain (rectangular or
circular); particle type(s); and particle orientation. AMGEN further calculates the total areas of
the aggregates, binder and void space, and determines the average material porosity.
Examples of several model materials that have been generated by AMGEN are shown in
Figures 9-14. For these particular cases, the particles were distributed evenly along the domain
perimeter and particle orientation was randomly specified from 0 to π2 . Aggregates were
chosen randomly from a set of four different particle types described by the following major and
minor axes dimensions: {(6.0, 5.2) mm, (5.2, 4.5) mm, (6.0, 5.0) mm, (5.5, 5.5) mm}. Figure 9
shows an idealized model material of rectangular shape with specific dimensions of 75mm x
75mm. This model contains 36 aggregate particles, and the cementation is distributed in such a
fashion as to create 110 elements of which 25 pairs are of overlapping type. The model
material’s porosity, 1 - (aggregate + cementation area)/(total area) equals . %16
FIGURE 9 Typical rectangular generated material model with 36 aggregates.
14

Figure 10 shows another rectangular material model with 400 particles. This model has a total
1482 elements (361 overlapping pairs) and has a porosity of 15.4%.
FIGURE 10 Regular rectangular model with 400 aggregates.
The final rectangular model is shown in Figure 11, and this generated system has a total of 1681
particles and 6480 elements.
FIGURE 11 Regular rectangular model with 1681 aggregates.
15

Models of circular domain are shown in Figures 12, 13 and 14. The model in Figure 12 contains
39 particles and 108 elements, while Figures 13 and 14 show material models with 491 and 1321
particles, respectively. Complete details on the model material geometry are given the Table 1.
FIGURE 12 Typical model of circular domain with 39 aggregates.
FIGURE 13 Model material of circular domain with 491 aggregates.
16

FIGURE 14 Model material of circular domain with 1321 aggregates.
TABLE 1 Model Material Parameters
Model Domain Dimensions
Number of Particles
Number of Elements
Number of Overlap
Element Pairs Porosity
Figure 9 75x75mm 36 110 25 16.1%
Figure 10 250x250mm 400 1482 361 15.4%
Figure 11 500x500mm 1681 6480 1600 13.2%
Figure 12 R = 43mm 39 108 13 15.8%
Figure 13 R = 155.5mm 491 1851 451 12.6%
Figure 14 R = 255.5mm 1321 4563 729 16.6% 4.2 Finite Element Simulation Code (FEAMS)
In order to incorporate our modeling concepts into a useful simulation tool, a basic two-
dimensional, truss-frame finite element computer code is needed. Reddy (34) has given the
basics of such a Fortran code for analysis of trusses, and Euler-Bernoulli and Timoshenko frame
17

structures. Starting with this basic code, we added the special micro-structural frame element and
thus developed a new special purpose code for Finite Element Asphalt Material Simulation
(FEAMS). The new element is based on the developed stiffness matrix given previously in
equation (5) using the particulate cementation mechanics developed by Dvorkin (11). A load
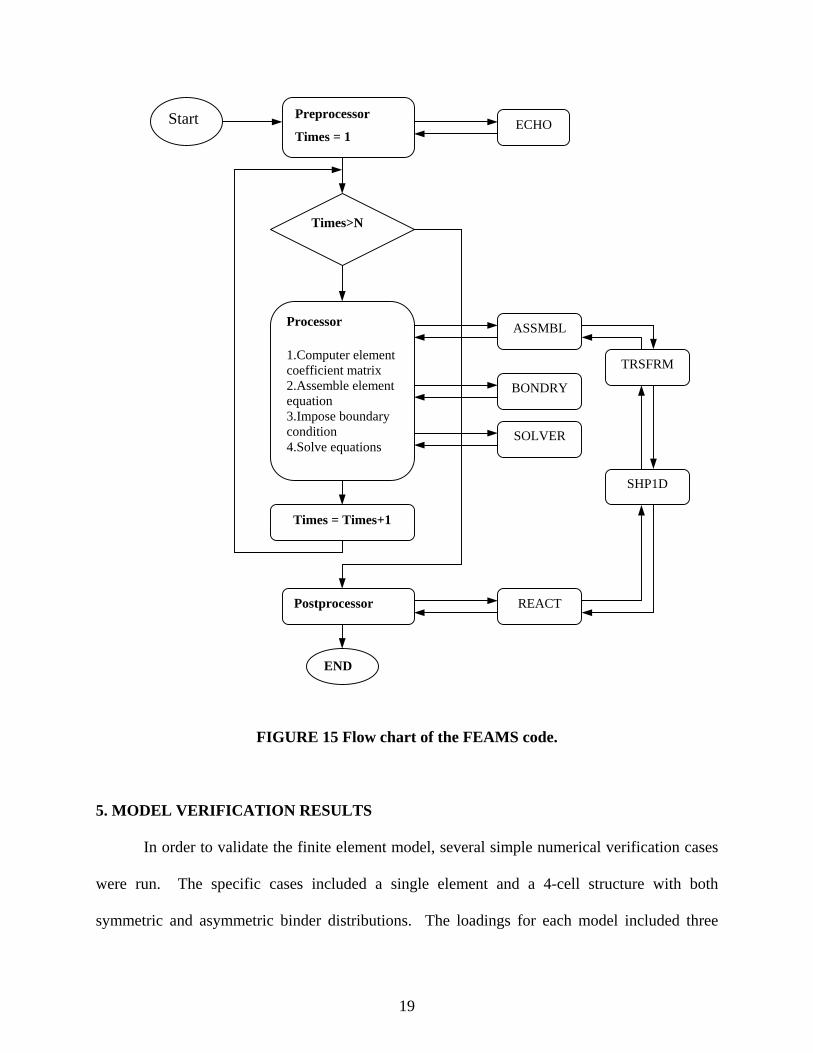
incrementation scheme was also added to the FEAMS code. A flow chart of the code along with
a description of various subroutines are given in Figure 15. The preprocessor unit consists of
reading input data, generating the finite element mesh and printing data and mesh information.
The processor unit includes: construction of element matrices; assembly of element equations;
imposition of boundary conditions; and solution of system equations for nodal displacements. In
the postprocessor section, the displacement solution is computed by interpolation at points other
than nodes, force values are derived from the displacement solution, and the solution is outputted
in desired format. The code subrountines are described as follows:
ECHO: Read the input data and write the input data
ASSMBL: Assemble element equations to the upper-banded form
BONDRY: Impose specified displacement and force boundary conditions
SOLVER: Solve linear algebraic equation to get nodal displacements
TRSFRM: Computer element stiffness matrices and force vectors
SHP1D: Compute the shape function and their derivative
REACTN: Calculate solution at points other than the nodes
18
Start Preprocessor
Times = 1 ECHO
Times>N
Processor 1.Computer element coefficient matrix 2.Assemble element equation 3.Impose boundary condition 4.Solve equations
ASSMBL
BONDRY
SOLVER
Times = Times+1
TRSFRM
SHP1D
Postprocessor REACT
END
FIGURE 15 Flow chart of the FEAMS code. 5. MODEL VERIFICATION RESULTS
In order to validate the finite element model, several simple numerical verification cases
were run. The specific cases included a single element and a 4-cell structure with both
symmetric and asymmetric binder distributions. The loadings for each model included three
19

standard cases for the two-dimensional situation: compression force, shear force and
rotation/moment.
5.1 Single Element Verification
In the single element verification, we compare symmetric and asymmetric binder models
for the five cases shown in Figure 16. The selected models are chosen to demonstrate the effect
of binder properties and eccentricity on the element stiffness behavior. Details of the geometric
and mechanical properties for each model are given in Table 2. Each model is to undergo three
loading cases of compression, shear (left to right loading) and counter-clockwise moment. The
displacement and rotation of node 1 are kept fixed for all loading cases.
Symmetric Asymmetric-A Asymmetric-B Asymmetric-C Asymmetric-D
FIGURE 16. Five types of two-node element models.
TABLE 2 Structural Parameters For Single Element Models
Models Average
Thickness ( )mmh0
Left Binder Width
( )mmw1
Right Binder Width 2w ( )mm
Radius (node 1)
1r ( )mm
Radius (node2) 2r ( )mm
Element Area ( )2mmS
Elastic Constants ( )υ,MPaE
Symmetric 3.0 3.0 3.0 5.5 5.5 18.0 (1.0, 0.3) Asymmetric-A 3.0 3.5 2.5 5.5 5.5 18.0 (1.0, 0.3) Asymmetric-B 3.0 3.8 2.2 5.5 5.5 18.0 (1.0, 0.3) Asymmetric-C 3.0 2.5 3.5 5.5 5.5 18.0 (1.0, 0.3) Asymmetric-D 3.0 2.2 3.8 5.5 5.5 18.0 (1.0, 0.3)
20

Using the developed finite element code FEAMS, the normal and tangential
displacements and rotation at node 2 for each loading case can be determined. Figures 17-19
show the results for a series of loading steps from 0 to 140N.
Compression case
0
20
40
60
80
100
120
140
160
-0.2-0.18-0.16-0.14-0.12-0.1-0.08-0.06-0.04-0.020
Normal Displacement (mm)
Nor
mal
For
ce (N
)
symasym-caseAasym-caseBasym-caseCasym-caseD
Compression Case
0
20
40
60
80
100
120
140
160
-0.6 -0.4 -0.2 0 0.2 0.4 0.6Tangential Displacement (mm)
Nor
mal
For
ce (N
)
symasym-caseAasym-caseBasym-case Casym -case D
Compression Case
0
20
40
60
80
100
120
140
160
-0.1 -0.08 -0.06 -0.04 -0.02 0 0.02 0.04 0.06 0.08 0.1
Rotation (rad)
Nor
mal
For
ce (N
)
symasym-case Aasym-case Basym-case Casym-case D
FIGURE 17 Normal, tangential and rotational displacements for the compressional loading case.
21

Shear Case
0
20
40
60
80
100
120
140
160
-0.5 -0.4 -0.3 -0.2 -0.1 0 0.1 0.2 0.3 0.4 0.5
Normal Displacement
Shea
r For
ce
sym asym-case Aasym-case Basym-case Casym-case D
Shear Case
020406080
100120140160
0 0.5 1 1.5Tangential Displacement (mm)
Shea
r For
ce (N
)
2
symasym-case Aasym-case Basym-case Casym-case D
Shear Case
020406080
100120140160
-0.3-0.25-0.2-0.15-0.1-0.050
Rotation (rad)
Shea
r For
ce (N
)
symasym-case Aasym-case Basym-case Casym-case D
FIGURE 18 Normal, tangential and rotational displacements for the shear loading case.
22

Moment Case
0
500
1000
1500
2000
2500
3000
-2 -1.5 -1 -0.5 0 0.5 1 1.5 2
Normal Displacement (mm)
Mom
ent (
N.m
m)
symasym-case Aasym-case Basym-case Casym-case D
Moment Case
0
500
1000
1500
2000
2500
3000
-5-4.5-4-3.5-3-2.5-2-1.5-1-0.50Tangential Displacement (mm)
Mom
ent (
N.m
m)
symasym-case A asym-case Basym-case Casym-case D
Moment Case
0
500
1000
1500
2000
2500
3000
0 0.2 0.4 0.6 0.8 1
Rotation (rad)
Mom
ent (
N.m
m)
symasym-case Aasym-case Basym-case Casym-case D
FIGURE 19 Normal, tangential and rotational displacements for the moment loading case.
For the normal loading case, Figure 17 illustrates consistent and symmetric nodal (particle)
displacements and rotations. Compressional and shear loading cases for the two-particle
problem were independently analyzed using a commercial finite element code (ANSYS), and the
23

results compared within 4-6%. The increase in displacements with cementation asymmetry has
also been verified by independent ANSYS finite element analysis.
4-Cell Verification
In order to verify the behavior of a simple cemented aggregate group, a 4-cell (4-
aggregate) microstructure was selected as shown in Figure 20. As in the previous section, both
symmetric and asymmetric binder distributions are considered. Each model consists of four
elements, and no cross or diagonal elements have been used. Table 3 provides additional
specifics on the model data.
1 2
3 4
1 2
3 4
(Symmetric Cemented Cell) (Asymmetric Vertical Binder Cell)
FIGURE 20 Two 4-cell cemented aggregate model structures.
TABLE 3 Structural Parameters For 4-Cell Models
Models Average
Thickness ( )mmh0
Left Width
( )mmw1
Right Width 2w ( )mm
Radius (node 1)
1r ( )mm
Radius (node2) 2r ( )mm
Element Area ( )2mmS
Elastic Constants ( )( )υ,MPaE
Symmetric 3.0 2.5 2.5 5.5 5.5 15.0 (1.0, 0.3) Asymmetric 3.0 3.0 2.0 5.5 5.5 15.0 (1.0, 0.3)
For this model, node 1 is fixed in the horizontal and vertical, while node 2 is fixed in the
vertical. As in the previous example, three loading cases of compression, shear and moment are
to be investigated as shown in Figure 21.
24

Compression Shear Moment
FIGURE 21 Loading cases for the 4-cell model.
Using the FEAMS simulation code, the normal, tangential and rotational displacements
associated with nodes 3 and 4 are calculated for a series of loading steps from 0 to 140N. These
results are summarized in Figures 22-24.
Compression Case
0
20
40
60
80
100
120
140
160
-0.09-0.08-0.07-0.06-0.05-0.04-0.03-0.02-0.010
Normal Displacement (mm)
Nor
mal
For
ce (N
)
SymmetricUnsymmetric
Compression Case
0
20
40
60
80
100
120
140
160
-0.007-0.006-0.005-0.004-0.003-0.002-0.0010.000
Rotation (rad)
Nor
mal
For
ce (N
)
Symmetricunsymmetric
FIGURE 22 Normal and rotational displacements
for the compressional loading case.
25

Shear Case
0
20
40
60
80
100
120
140
160
0 0.1 0.2 0.3 0.4 0.5 0.6
Tangential Displacement (mm)
Shea
r For
ce (N
)
symmetricunsymmetric
Shear Case
020406080
100120140160
-0.4 -0.2 0 0.2 0.4Normal Displacement(mm)
Shea
r For
ce(N
)
node 3 (sym)node 4 (sym)node 3 (unsym)node 4 (unsym)
Shear Case
020406080
100120140160
-0.05-0.04-0.03-0.02-0.010
Rotation (rad)
Shea
r For
ce (N
)
Node 3 (sym)Node 4 (sym)Node 3 (unsym)Node 4 (unsym)
FIGURE 23 Normal, tangential and rotational displacements for the shear loading case.
26

Moment Case
0
500
1000
1500
2000
2500
-0.5 -0.3 -0.1 0.1 0.3 0.5Normal Displacement (mm)
Mom
ent (
N.m
m)
Node 3 (sym)node 4 (sym)node 3 (unsym)node 4 (unsym)
Moment Case
0
500
1000
1500
2000
2500
-0.1-0.08-0.06-0.04-0.020Tangential Displacement (mm)
Mom
ent(N
.mm
)
Symmetricunsymmtric
Moment Case
0
500
1000
1500
2000
2500
0 0.005 0.01 0.015 0.02 0.025Rotation (rad)
Mom
ent (
N.m
m)
Node 3 (sym)Node 4 (sym)Node 3 (unsym)Node 4 (unsym)
FIGURE 24 Normal, tangential and rotational displacements for the moment loading case.
Figure 22 again shows that asymmetrical cementation produces larger compressional
deformation most likely due to the generated rotational motions within the cell structure. For the
shear loading case shown in Figure 23, displacement and rotation differences between the
symmetric and asymmetric binder geometries seem to be small. The moment loading case
27

shown in Figure 24 illustrates expected symmetrical normal displacement behaviors; however,
the rotational motions appear to be more complex.
6. COMPRESSION AND INDIRECT TENSION SIMULATIONS The developed modeling has been applied to two common ASTM laboratory tests; i.e.
the compression and indirect tension tests. Each test provides a simple method to allow finite
element comparisons to be made with standard test data.
6.1 Compression Test Simulation
The geometry of the compression test is shown in Figure 25. Because of the cylindrical
symmetry of the specimen and loading, a planar rectangular simulation domain can be taken
from the test specimen as shown. This rectangular region would then be appropriate for use with
our two-dimensional simulation code, and the simulation information would provide the
mechanical response of the specimen under axisymmetric conditions.
(Test Specimen) (Simulation Domain)
FIGURE 25 Compression test geometry.
28

The boundary conditions for these simulations are:
- left edge: symmetry conditions of zero horizontal displacement and vertical traction
- right edge: zero forces
- top edge: prescribed loading
- bottom edge: zero vertical displacement and horizontal traction
Three different numerical simulations have been conducted of this test for specimens
with a nominal diameter and height of 100mm (4in). For all cases, the cementation width
distribution was of uniform value of 1/4 the particle diameter. No stiffness modification was
made for overlapping elements. Figure 26 shows a model geometry for a case with 45 equal-
sized circular aggregates distributed in a uniform manner in rows and columns. Numerical
results of the particle displacements (values scaled for visualization) are also shown in Figure 26.
1 2 3 4 5
6 7 8 9 10
11 12 13 14 15
16 17 18 19 20
21 22 23 24 25
26 27 28 29 30
31 32 33 34 35
36 37 38 39 40
41 42 43 44 45
(Material Model) (Aggregate Displacements)
FIGURE 26 Compression test simulation for 45-particle model.
29

Because of the uniform aggregate size and distribution, the deformation field is quite uniform.
The aggregates move down and outward to the right as shown with a maximum vertical
displacement along the top edge of 0.187 mm for the applied loading of 500N. Further details
on this model are given in Table 4. Another similar model with 153 equal-sized particles are
shown in Figure 27. For this case the particle size and spacing was reduced in order to
maintaining the same overall nominal specimen dimensions. Numerical results of the particle
displacements (values scaled for visualization) are shown in Figure 27. Similar to the previous
case, the deformation field is again very uniform with vertical displacements being predominant
with a maximum value of 0.29mm along the top edge with a vertical loading of 900N.
Additional details on this model are given in Table4.
(Material Model) (Aggregate Displacements)
FIGURE 27 Compression test simulation for 153-particle model.
1 2 3 4 5 6 7 8 9
10 11 12 13 14 15 16 17 18
19 20 21 22 23 24 25 26 27
28 29 30 31 32 33 34 35 36
37 38 39 40 41 42 43 44 45
46 47 48 49 50 51 52 53 54
55 56 57 58 59 60 61 62 63
64 65 66 67 68 69 70 71 72
73 74 75 76 77 78 79 80 81
82 83 84 85 86 87 88 89 90
91 92 93 94 95 96 97 98 99
100 101 102 103 104 105 106 107 108
109 110 111 112 113 114 115 116 117
118 119 120 121 122 123 124 125 126
127 128 129 130 131 132 133 134 135
136 137 138 139
145 146 147 148 149 150 151 152 153
140 141 142 143 144
30

The final numerical simulation of this specimen type modifies the previous case to include 153
aggregates of variable size and shape. Four different aggregate types are randomly used in this
model and Table 4 indicates the specific aggregate dimensions used. Figure 28 shows the model
geometry for this variable aggregate case along with the corresponding deformation field from
the numerical simulation. Although it is not very easy to observe from the figure, the particle
displacements are now no longer completely uniform, and we see the local effects of variable
microstructure on the deformation field. Again Table 4 provides additional details on this
particular model.
1 2 3 4 5 6 7 8 9
10 11 12 13 14 15 16 17 18
19 20 21 22 23 24 25 26 27
28 29 30 31 32 33 34 35 36
37 38 39 40 41 42 43 44 45
46 47 48 49 50 51 52 53 54
55 56 57 58 59 60 61 62 63
64 65 66 67 68 69 70 71 72
73 74 75 76 77 78 79 80 81
82 83 84 85 86 87 88 89 90
91 92 93 94 95 96 97 98 99
100 101 102 103 104 105 106 107 108
109 110 111 112 113 114 115 116 117
118 119 120 121 122 123 124 125 126
127 128 129 130 131 132 133 134 135
136 137 138 139 140 141 142 143 144
145 146 147 148 149 150 151 152 153
(Material Model) (Aggregate Displacements)
FIGURE 28 Compression test simulation for variable size 153-particle model.
31
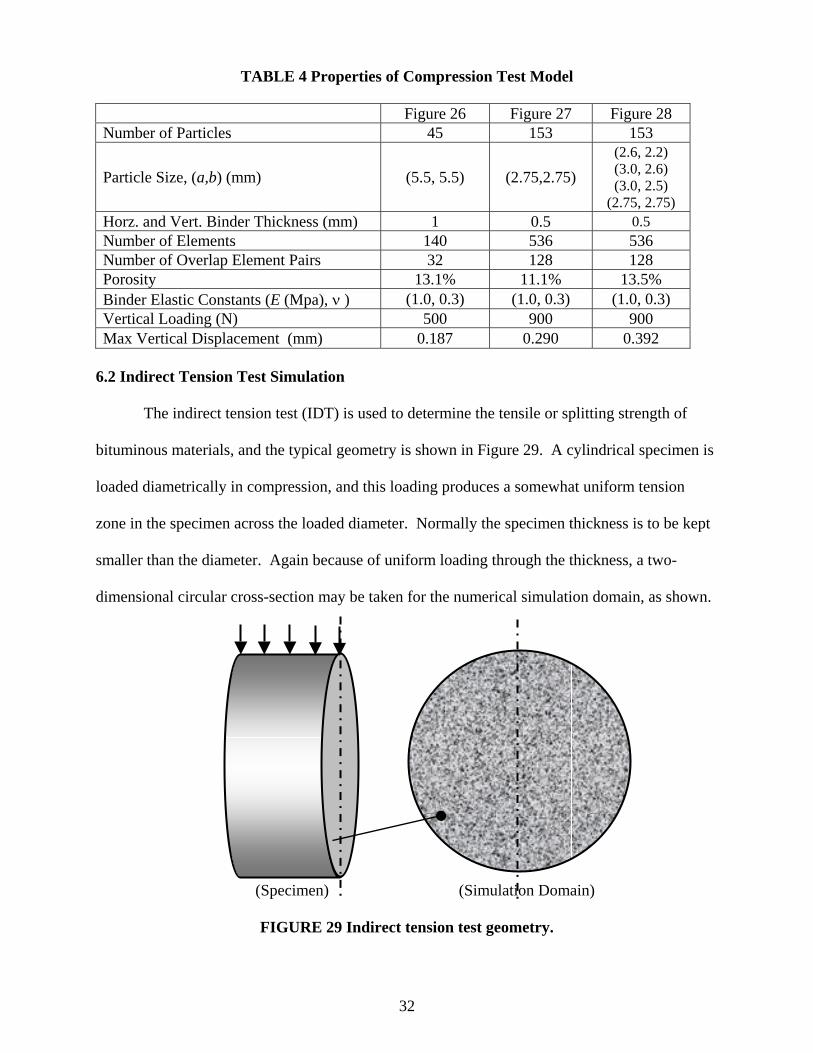
TABLE 4 Properties of Compression Test Model
Figure 26 Figure 27 Figure 28 Number of Particles 45 153 153
Particle Size, (a,b) (mm) (5.5, 5.5) (2.75,2.75) (2.6, 2.2) (3.0, 2.6) (3.0, 2.5)
(2.75, 2.75) Horz. and Vert. Binder Thickness (mm) 1 0.5 0.5 Number of Elements 140 536 536 Number of Overlap Element Pairs 32 128 128 Porosity 13.1% 11.1% 13.5% Binder Elastic Constants (E (Mpa), ν ) (1.0, 0.3) (1.0, 0.3) (1.0, 0.3) Vertical Loading (N) 500 900 900 Max Vertical Displacement (mm) 0.187 0.290 0.392
6.2 Indirect Tension Test Simulation
The indirect tension test (IDT) is used to determine the tensile or splitting strength of
bituminous materials, and the typical geometry is shown in Figure 29. A cylindrical specimen is
loaded diametrically in compression, and this loading produces a somewhat uniform tension
zone in the specimen across the loaded diameter. Normally the specimen thickness is to be kept
smaller than the diameter. Again because of uniform loading through the thickness, a two-
dimensional circular cross-section may be taken for the numerical simulation domain, as shown.
(Specimen) (Simulation Domain)
FIGURE 29 Indirect tension test geometry.
32

Again three different numerical simulations have been conducted on typical indirect
tension test specimens with a nominal diameter of 100mm (4in). For all cases, the cementation
width distribution was of uniform value of 1/4 the particle diameter. No modification was made
for overlapping elements. Boundary conditions fixed the bottom aggregate for both horizontal
and vertical displacements while the top particle is constrained only for horizontal motion.
Figure 30 shows a simulation with 64 equal-sized circular particles loaded through three
aggregates. The corresponding deformation field is also shown in the displacement vector plot.
(Material Model) (Aggregate Displacements)
FIGURE 30 Indirect tension test simulation for 64 aggregate model.
For this simulation, we see a predominant vertical deformation pattern with downward aggregate
displacements being much larger than the horizontal components. With a total loading of 300N,
the maximum vertical displacement was 0.163mm, which occurred directly under the loading on
aggregate #45. Further details on this model are provided in Table 5. Another simulation as
shown in Figure 31 was run on a model with a larger number of smaller particles. This model
had 227 particles of uniform circular shape arranged in a similar distribution pattern as the
33

previous case. The deformation field is also shown in the figure including vertical, horizontal
and total particle displacement plots. Again it is seen that the vertical displacements represent
(Material Model) (Vertical Displacements)
1
23
4
5 6
7
8
91011
12
13
14
1516 17
18
19
20
21
22
232425
2627
28
29
30
31
3233
34 3536
37
38
39
40
41
42
43444546
47
48
49
50
51
52
53
54
55
5657 58 59
60
61
62
63
64
65
66
67
68
6970
71727374
75
76
77
78
79
80
81
82
83
84
8586 87 88
8990
91
92
93
94
95
96
97
98
99
100
101102
103104105106107
108
109
110
111
112
113
114
115
116
117
118
119
120121
122 123 124 125126
127
128
129
130
131
132
133
134
135
136
137
138
139
140141
142143144145
146147
148
149
150
151
152
153
154
155
156
157
158
159
160
161
162163
164 165 166 167 168169
170
171
172
173
174
175
176
177
178
179
180
181
182
183
184
185186
187188189190191
192193
194
195
196
197
198
199
200
201
202
203
204
205
206
207
208
209
210211
212213 214 215 216
217218
219
220
221
222
223
224
225
226
227
(Horizontal Displacements) (Total Resultant Displacements)
FIGURE 31 Indirect tension test results for 227 particle model.
34

the primary deformations of the aggregates in the asphalt model. The horizontal displacement
figure illustrates the splitting action of the test specimen with the tendency of deformations to
separate the specimen along the vertical centerline. Additional details on this model geometry
are given in Table 5. The final IDT simulation is similar to the previous case but with particles of
different size and orientation. The 227 aggregates are randomly chosen from a set of four
particle types as listed in Table 5. The model and the horizontal displacements are shown in
Figure 32. For this variable aggregate case, the displacement field is no longer symmetric.
Contrary to the previous case, the horizontal deformation field for this model indicates the
tendency for splitting action to occur not directly along the specimen centerline.
1
23
4
5 6
7
8
91011
12
13
14
1516 17
18
19
20
21
22
232425
2627
28
29
30
31
3233
34 3536
37
38
39
40
41
42
43444546
47
48
49
50
51
52
53
54
55
5657 58 59
60
61
62
63
64
65
66
67
68
6970
71727374
75
76
77
78
79
80
81
82
83
8485
86 87 8889
90
91
92
93
94
95
96
97
98
99
100
101102
103104105106107
108
109
110
111
112
113
114
115
116
117
118
119
120121
122 123 124 125126
127
128
129
130
131
132
133
134
135
136
137
138
139
140141
142143144145
146147
148
149
150
151
152
153
154
155
156
157
158
159
160
161
162163
164 165 166 167 168169
170
171
172
173
174
175
176
177
178
179
180
181
182
183
184
185186
187188189190191
192193
194
195
196
197
198
199
200
201
202
203
204
205
206
207
208
209
210211
212213 214 215 216
217218
219
220
221
222
223
224
225
226
227
(Material Model) (Horizontal Displacements)
FIGURE 32 Indirect tension test simulation for variable size aggregate model.
35

TABLE 5 Properties of Indirect Tension Test Model Figure 30 Figure 31 Figure 32 Number of Particles 64 227 227
Particle Size, (a,b) (mm) (5.5, 5.5) (2.75,2.75) (2.6, 2.2) (3.0, 2.6) (3.0, 2.5)
(2.75, 2.75) Circumferential Binder Thickness (mm) 1 0.5 0.5 Number of Elements 170 657 657 Number of Overlap Element Pairs 6 29 48 Porosity 15.7% 16.5% 17.7% Binder Elastic Constants (E (Mpa), ν ) (1.0, 0.3) (1.0, 0.3) (1.0, 0.3) Vertical Loading (N) 300 200 200 Max Vertical Displacement (mm) 0.163 0.178 0.184
A comparison of our finite element model results with an actual experimental IDT test
has been done. The standard IDT test was conducted on an asphalt sample with properties:
Diameter = 101mm (4in), Thickness = 70mm, 6% asphalt content, Aggregate Size Distribution
(8% 0.075-2.36mm, 28% 2.36-4.75mm, 25% 4.75-9.5mm, 30% 9.5-12.5mm, 5% 12.5-19mm).
Out finite element model used the microstructure geometry shown in Figure 31 with a uniform
particle size of 5.5mm, which approximately matched the average aggregate size of the test
specimen. The model dimension matched the test specimen size and the binder elastic moduli
were E = 1.24MPa and ν = 0.3. Comparisons of the load versus deformation are shown in Figure
33. The experimental data shows initial elastic behavior followed by inelastic yielding and
eventual failure. Our modeling results are of course valid only in the elastic region and they
match very well with the experimental data. Future model development will incorporate
inelastic behaviors and will lead to a capability of simulating the entire load-deflection curve of
this and other laboratory tests.
36

0 2 4 6 8 10 12 14 160
500
1000
1500
2000
2500
3000
Normal Displacement (mm)
Com
pres
sion
For
ce (N
)Experimental DataFEM Simulation
FIGURE 33 Comparison of finite element simulation with experimental IDT test. 7. SUMMARY & CONCLUSIONS
This study has developed a preliminary microstructural finite element model for the two-
dimensional simulation of asphalt materials. Asphalt microstructure was incorporated into the
model by replacing the aggregate-binder system with an equivalent finite element network that
represents the load-carrying behavior between aggregates in the multiphase material. Elements
within the network are specially developed from an elasticity solution for cemented particulates
proposed by Dvorkin (11). Based on this modeling work, a computer simulation code named
FEAMS was created. Our modeling has also developed a material generating code (AMGEN),
which can create an aggregate-binder system with varying degrees of microstructure. Currently,
AMGEN can create models of rectangular and circular domain with variable aggregate and
37

binder size, shape, and distribution. AMGEN acts as a pre-processor, and thus creates all the
material and geometric data needed by the FEAMS simulation code.
Several comparative verification computer runs have been conducted on single element
and 4-cell aggregate structures. Model simulations of standard laboratory experiments including
compression and indirect tension tests are also given. Currently, model binder cement
distributions were arbitrarily specified; however, more sophisticated distribution schemes based
on surface wetting and adhesion are currently under development. Comparison of model
predictions with test data for a standard IDT test was made, and the model results match well
with the experimental data. The model simulation results are preliminary and are currently
limited to two-dimensional, linear elastic conditions. However, these results do indicate that the
modeling scheme provides useful comparisons and information, and that with further
development the model can be applied to recycled asphalt materials. Various recycling effects
related to aging and oxidation can be incorporated into the model by allowing element properties
to have more varied elastic, plastic, viscoelastic and damaged behaviors. Further connections
with plant recycling processes would require an experimental testing program with model
simulations, and it is anticipated that such further studies will begin in the near future.
Future plans for such model development will include the following features:
- non-elastic binder behavior
- non-linear binder behavior including aging, microcracking and damage
- finite deformations
- binder-aggregate separation
- three-dimensional finite element modeling
38

8. REFERENCES (1) Schimmoller, V.E, Holtz, K, et.al., Recycled Materials in European Highway Environments:
Uses, Technologies and Policies, FHWA/US DOT Report, Presented at 80th TRB Meeting,
Washington, D.C., January, 2001.
(2) Kandhal, P.S., Rao, S.S., Watson, D.E. and B. Young, Performance of Recycled Hot Mix
Asphalt Mixtures”, NCAT Report No. 95-1, 1995.
(3) Brayton, T.E., Lee, K.W., Gress, D. and J. Harrington, Development of Perfomance-Based
Mix Design for Cold In-Place Recycling of Asphalt Mixtures, Proc.80th Transportation Research
Board Meeting, Washington, D.C., 2001.
(4) Salam, Y.M. and C.L. Monismith, Fracture Characteristics of Asphalt Concrete, Proceedings
of the Association of Asphalt Paving Technologists (AAPT), Vol. 41, 1972.
(5) Majidzadeh, K. and Kauffmann, E., Verification of Fracture Mechanics Concepts to Predict
Cracking of Flexible Pavements, Research Foundation, Ohio State University, RF 3200, Final
Report, 1973.
(6) Majidzadeh, K., Dat, M. and F. Makdisi-Illyas, Application of Fracture Mechanics for
Improved Design of Bituminous Concrete, Report No: FHWA-RD-76-92, 1976.
(7) Karakouzian, M. and K. Majidzadeh, Practical Method for Evaluating Fatigue and
Fracture Toughness of Paving Materials, AAPT Proceedings, 1978.
(8) Sousa, J. and C.L. Monismith, Dynamic Properties of Asphalt Concrete, Journal of Testing
and Evaluation, Vol. 114, No: 4, 1988.
(9) Sulaiman, F. J. and A.F. Stock, The Use of Fracture Mechanics for the Evaluation of Asphalt
Mixes, AAPT Proceedings, Vol. 64, 1996.
(10) Venkatram, S., Fracture Toughness and Dynamic Constitutive Characterization of Recycled
Asphalt Pavement Binder, Masters Thesis, University of Rhode Island, 1996.
39

(11) Dvorkin, J., Nur, A., H. Yin, Effective Properties of Cemented Granular Materials, Mech.of
Materials, Vol 18, pp 351-366, 1994.
(12) Zhu, H., Chang, C.S. and J.W. Rish, Normal and Tangential Compliance for Conforming
Binder Contact I: Elastic Binder, Intl. J. Solids Structures, Vol. 33, pp 4337-4349, 1996.
(13) Zhu, H., Chang, C.S. and J.W. Rish, Normal and Tangential Compliance for Conforming
Binder Contact II: Viscoelastic Binder, Intl. J. Solids Structures, Vol. 33, pp 4351-4363, 1996.
(14) Zhu, H., Contact Mechanism Based Asphalt Concrete Modeling, Proc. 12th ASCE
Engineering Mechanics Conference, San Diego, May 1988.
(15) Zhu, H. and J.E. Nodes, Contact Based Analysis of Asphalt Pavement with the Effect of
Aggregate Angularity, Mech. Of Materials, Vol. 32, pp. 193-202, 2000.
(16) Krishnan, J.M. and C.L. Rao, Mechanics of Air Voids Reduction of Asphalt Concrete Using
Mixture Theory, Int. Jour. Eng. Sci., Vol. 38, pp. 1331-1354, 2000.
(17) Rothenburg, L., Bogobowicz, A. and R. Haas, Micromechanical Modeling of Asphalt
Concrete in Connection with Pavement Rutting Problems, Proc. 7th Intl. Conf. On Asphalt
Pavements, Vol. 1, pp. 230-245, 1992.
(18) Chang, G.K., and N.J. Meegoda, Simulation of the Behavior of Asphalt Concrete Using
Discrete Element Method, Proc. 2nd Intl. Conf. On Discrete Element Methods, M.I.T, 1993.
(19) Trent, B.C. and L.G. Margolin, Modeling Fracture in Cemented Granular Materials, ASCE
Pub. Fracture Mechanics Applied to Geotechnical Engineering, Proc. ASCE National
Convention, Atlanta, 1994.
(20) Buttlar, W.G. and Z. You, Discrete Element Modeling of Asphalt Concrete: A Micro-Fabric
Approach, Proc. 80th Transportation Research Board Meeting, Washington, D.C., 2001.
(21) Ullidtz, P., A Study of Failure in Cohesive Particulate Media Using the Discrete Element
Method, Proc. 80th Transportation Research Board Meeting, Washington, D.C, 2001.
40

(22) Sadd, M.H. and J.Y. Gao, The Effect of Particle Damage on Wave Propagation in Granular
Materials, Mechanics of Deformation and Flow of Particulate Materials, pp 159-173, Ed. C.S.
Chang, A. Misra, R.Y. Liang and M. Babic, Proc. McNu Conference, Trans. ASCE,
Northwestern Univ., June 1997.
(23) Sadd, M.H., and J.Y. Gao, Contact Micromechanics Modeling of the Acoustic Behavior of
Cemented Particulate Marine Sediments, Proc. 12th ASCE Engineering Mechanics Conf., La
Jolla, CA, 1998.
(24) Stankowski, T., Numerical Simulation of Progressive Failure in Particle Composites”, Ph.D.
Thesis, Univserity of Colorado, 1990.
(25) Liao, C.L. and C.S. Chang, A Microstructural Finite Element Model for Granular Solids,
Eng. Comp., Vol 9, pp 267-276, 1992.
(26) Bazant, Z.P., Tabbara, M.R, Kazemi, T., and G. Pijaudier-Cabot, Random Particle
Simulation of Damage and Fracture in Particulate or Fiber-Reinforced Composites, Damage
Mechanics in Engineering Materials, AMD Vol 109, Trans. ASME, 1990.
(27) Sadd, M.H., Qiu, L., Boardman, W., and A. Shukla, Modeling Wave Propagation in
Granular Materials Using Elastic Networks”, Intl. J. Rock Mechanics & Minning Sci, Vol. 29,
p. 61, 1992.
(28) Budhu, M., Ramakrishnan, S. and G. Frantziskonis, Modeling of Granular Materials: A
Numerical Model Using Lattices”, Mechanics of Deformation and Flow of Particulate
Materials, Ed. C.S. Chang, A. Misra, R.Y. Liang and M. Babic, Proc. McNu Conference, Trans.
ASCE, Northwestern Univ., June 1997.
(29) Mustoe, G.G.W. and D.V. Griffiths, An Equivalent Model Using Discrete Element Method
(DEM), Proc. 12th ASCE Engineering Mechanics Conf., La Jolla, CA, 1998.
41

(30) Buchanan, M.S., Evaluation of the Effect of Flat and Elongated Particles on the
Performance of Hot Mix Asphalt Mixtures, NCAT Report No. 2000-03, May 2000.
(31) Maerz, N.H. and M. Lusher, Measurement of Flat and Elongation of Coarse Aggregate
Using Digital Image Processing, Proc. 80th Transportation Research Board Meeting,
Washington, D.C., 2001.
(32) Masad, E., Olcott, D., White, T. and L. Tashman, Correlation of Imaging Shape Indices of
Fine Aggregate with Asphalt Mixture Perfomance, Proc. 80th Transportation Research Board
Meeting, Washington, D.C., 2001.
(33) Ketcham, R.A. and N. Shashidhar, Quantitative Analysis of 3-D Images of Asphalt
Concrete, Proc. 80th Transportation Research Board Meeting, Washington, D.C., 2001.
(34) Reddy, J.N., An Introduction to The Finite Element Method, Second Edition, McGraw-
Hill, 1993.
42