Effect of Micro Size Cenosphere Particles …file.scirp.org/pdf/JMMCE20121000001_56742989.pdffor...
9
Journal of Minerals and Materials Characterization and Engineering, 2012, 11, 938-946 Published Online October 2012 (http://www.SciRP.org/journal/jmmce) Effect of Micro Size Cenosphere Particles Reinforcement on Tribological Characteristics of Vinylester Composites under Dry Sliding Conditions Santram Chauhan, Sunil Thakur * Department of Mechanical Engineering National Institute of Technology, Hamirpur (H.P.), India Email: * [email protected] Received July 5, 2012; revised August 16, 2012; accepted August 27, 2012 ABSTRACT In this paper the friction and wear characteristics of vinylester and cenosphere reinforced vinylester composites have been investigated under dry sliding conditions, under different applied normal load and sliding speed. Wear tests were carried using pin on a rotating disc under ambient conditions. Tests were conducted at normal loads 10, 30, 50 and 70 N and under sliding velocity of 1.88, 3.14, 4.39 and 5.65 m/s. The results showed that the coefficient of friction decreases with the increase in applied normal load values under dry conditions. On the other hand for pure vinylester specific wear rate increases with increase in applied normal load. However the specific wear rate for 2%, 6%, 10% and 15% cenosphere reinforced vinylester composite decreases with the increase in applied normal load under dry conditions. The results showed that with increase in the applied normal load and sliding speed the coefficient of friction and spe- cific wear rate decreases under dry sliding conditions. It is also found that a thin film formed on the counterface seems to be effective in improving the tribological characteristics. The specific wear rates for pure vinylester and vinylester composite under dry sliding condition were in the order of 10 −6 mm 3 /Nm. The results showed that the inclusion of cenosphere as filler materials in vinylester composites will increase the wear resistance of the composite significantly. SEM analysis has been carried to identify the wear mechanism. Keywords: Composites; Cenosphere; Coefficient of Friction; Vinylester; Wear 1. Introduction High performance polymer composite materials are used increasingly for engineering applications under working condition. The materials must provide unique mechanical and tribological properties combined with a low specific weight and a high resistance to degradation in order to ensure safety and economic efficiency. Polymer and their composites are finding ever increasing usage for numer- ous industrial application such as bearing materials, roll- ers, seals, gears, cams, wheels and clutches. Composite mate-rials provide an opportunity to combine different properties and design materials for applications requiring multiple functionalities. Polymeric matrices reinforced with hardand non dissipative fillers can possess high stiffness and damping, which is ideal for structural prop- erties [1,2]. Over the past decades, thermoplastic composites have been increasingly used for numerous mechanical and tribological purposes such as seals, gears and bearings. These materials are light in weight and are better alterna- tives to metalliccomponents [3]. The feature that makes polymer composites so promising in industrial applica- tions is the possibility of tailoring their properties with functional fillers. Polymer composites are more attractive than conventional metallic system. These are relatively low density, high corrosion resistance and ability to be tailored to have stacking sequences that provide high strength and stiffness in direction of high loading. Ther- moplastic composites can improve the stiffness, decrease thermal expansion, improve long-term mechanical per- formance and reduce costs [4,5]. Polymer composites consist of resin and a reinforcement chosen according to the desired mechanical properties. Improved perform- ance of polymer and their composites in industrial and structural application by addition of filler materials [6,7]. Polymer based composites materials are the ones used in such application because of their ever increasing demand in terms of stability athigher load carrying capacity and wear rate materials determine their acceptability for in- dustrial applications. The mechanical properties of com- mon polymers when compared to metals are not very good. Considerable attention has thus been paid in the last 30 years to study the tribological properties of poly- * Corresponding author. Copyright © 2012 SciRes. JMMCE
-
Upload
nguyendang -
Category
Documents
-
view
219 -
download
2
Transcript of Effect of Micro Size Cenosphere Particles …file.scirp.org/pdf/JMMCE20121000001_56742989.pdffor...

Journal of Minerals and Materials Characterization and Engineering, 2012, 11, 938-946 Published Online October 2012 (http://www.SciRP.org/journal/jmmce)
Effect of Micro Size Cenosphere Particles Reinforcement on Tribological Characteristics of Vinylester Composites
under Dry Sliding Conditions
Santram Chauhan, Sunil Thakur* Department of Mechanical Engineering National Institute of Technology, Hamirpur (H.P.), India
Email: *[email protected]
Received July 5, 2012; revised August 16, 2012; accepted August 27, 2012
ABSTRACT
In this paper the friction and wear characteristics of vinylester and cenosphere reinforced vinylester composites have been investigated under dry sliding conditions, under different applied normal load and sliding speed. Wear tests were carried using pin on a rotating disc under ambient conditions. Tests were conducted at normal loads 10, 30, 50 and 70 N and under sliding velocity of 1.88, 3.14, 4.39 and 5.65 m/s. The results showed that the coefficient of friction decreases with the increase in applied normal load values under dry conditions. On the other hand for pure vinylester specific wear rate increases with increase in applied normal load. However the specific wear rate for 2%, 6%, 10% and 15% cenosphere reinforced vinylester composite decreases with the increase in applied normal load under dry conditions. The results showed that with increase in the applied normal load and sliding speed the coefficient of friction and spe- cific wear rate decreases under dry sliding conditions. It is also found that a thin film formed on the counterface seems to be effective in improving the tribological characteristics. The specific wear rates for pure vinylester and vinylester composite under dry sliding condition were in the order of 10−6 mm3/Nm. The results showed that the inclusion of cenosphere as filler materials in vinylester composites will increase the wear resistance of the composite significantly. SEM analysis has been carried to identify the wear mechanism. Keywords: Composites; Cenosphere; Coefficient of Friction; Vinylester; Wear
1. Introduction
High performance polymer composite materials are used increasingly for engineering applications under working condition. The materials must provide unique mechanical and tribological properties combined with a low specific weight and a high resistance to degradation in order to ensure safety and economic efficiency. Polymer and their composites are finding ever increasing usage for numer- ous industrial application such as bearing materials, roll- ers, seals, gears, cams, wheels and clutches. Composite mate-rials provide an opportunity to combine different properties and design materials for applications requiring multiple functionalities. Polymeric matrices reinforced with hardand non dissipative fillers can possess high stiffness and damping, which is ideal for structural prop- erties [1,2].
Over the past decades, thermoplastic composites have been increasingly used for numerous mechanical and tribological purposes such as seals, gears and bearings. These materials are light in weight and are better alterna- tives to metalliccomponents [3]. The feature that makes
polymer composites so promising in industrial applica- tions is the possibility of tailoring their properties with functional fillers. Polymer composites are more attractive than conventional metallic system. These are relatively low density, high corrosion resistance and ability to be tailored to have stacking sequences that provide high strength and stiffness in direction of high loading. Ther- moplastic composites can improve the stiffness, decrease thermal expansion, improve long-term mechanical per- formance and reduce costs [4,5]. Polymer composites consist of resin and a reinforcement chosen according to the desired mechanical properties. Improved perform- ance of polymer and their composites in industrial and structural application by addition of filler materials [6,7]. Polymer based composites materials are the ones used in such application because of their ever increasing demand in terms of stability athigher load carrying capacity and wear rate materials determine their acceptability for in- dustrial applications. The mechanical properties of com- mon polymers when compared to metals are not very good. Considerable attention has thus been paid in the last 30 years to study the tribological properties of poly- *Corresponding author.
Copyright © 2012 SciRes. JMMCE
S. CHAUHAN, S. THAKUR 939
mer composites [8-10]. The advancement in technology and finding of new
technology has increased the need of superior material for tribological applications. Polymer composites exhib- its excellent friction and wear characteristics even with- out external activations and can provide maintenance freeoperation, excellent corrosion resistance. Wear and friction originate from multiple sets of complex interac- tions on microscopic scale between surfaces that are in mechanical contact and slide against each other. These interactions depend on the materials, geometrical and topogical characteristics of the surfaces and overall con- ditions under which the surfaces are made to slide against each other e.g. loading, temperature, atmosphere, type of contact [11]. Wear is defined as damage to a solid sur- face, generally involving progressive loss of material due to relative motion between that surface and contacting substance [12-14]. Abrasive wear is the most important among all the forms of wear because it contributes al- most 60% of the total cost of wear. Abrasive wear is caused due to hard particles that are forced against and move along a solid surface. Polymer and their compos- ites are finding ever increasing usage for numerous in- dustrial applications such as bearing material, rollers, seals, gears, cams, and clutches [15-17]. Different types of polymer show different friction and wear behaviour. The understanding of wear behavior of cenosphere parti- cle filled vinylester matrix composites is still very lim- ited. The wear resistance of the composites might be de- creased or increased depending on the type of particles, particle size, size distribution, interfacial actions between particle and matrix resin, particle content and state of dispersion of the particles in the composites as well as wear test conditions, i.e. wear mode (pin-on-disc), coun- terface, sliding velocity, sliding distance, applied load and humidity [18].
Vinylester resin is widely used in thermosetting resins because of their low cost, excellent chemical, corrosion resistance and mechanical properties. Vinylester resins are stronger than polyester resins and cheaper than epoxy resins. Vinylester resins utilize a polyester resin type of cross-linking molecules in the bonding process [19,20]. Vinylester is a hybrid form of polyester resin which has been toughened with epoxy molecules within the main molecular structure. Vinylester resins offer better resis- tance to moisture absorption than polyester resins. Some- times it won’t cure if the atmospheric conditions are not right. It also has difficulty in bonding dissimilar and al- ready-cured materials. It is also known that vinylester resins bond very well to fiberglass but offer a poor bond to kevlar and carbon fibers due to the nature of those two more exotic fibers [21,22]. Vinylester resin have better thermal performance, excellent mechanical properties and toughness as compare to polyester resins which is
why vinylester are preferred materials for structure com- posites.
The word cenosphere is derived from two Greek words kenos (hollow) and sphaira (sphere) [23]. Ceno- sphere are lightweight, inert and hollow spheres mainly consists of silica and alumina are filled with air or gases and are by-product of the combustion of pulverized coal at the thermal power plants [24,25]. In general, Ceno- spheres are hollow spherical particles with shell thick- nesses of 30 - 250 µm, density varies from 0.3 to 0.6 g/cm3, and shell wall thickness varies from 2 to 10 µm [26]. Due to their hollow structure these ash particles float on water when ash is disposed in the slurry form in ash ponds or lagoons. These shells are porous in nature. As a result, these cenosphere particles could not make any significant scratching action over the counter surface. Cenospheres was used as reinforcing filler in vinylester resin to developed lightweight composites. Cenospheres are alumina silicate hollow ceramic particles formed during the production of electricity by coal burning power stations [27-29]. They have most of the same pro- perties as manufactured hollow-sphere products. Ceno- spheres are primarily used to reduce the weight of plas- tics, rubbers, resins, cements. Cenospheres are used in a variety of products, including sports equipments, auto- mobile bodies, marine craft bodies and heat protection devices. Providing the advantages of reduces weight, in- creased filler loadings, better flow characteristics, less shrinkage and reduces water absorption [30,31]. Deve- loping light and heat insulating polymer composite mate- rial filled with cenospheres may also be realized with low density and spherical alumino-silicate structures which may offer other additional advantages like enhanced mechanical properties such as elastic modulus, toughness, high durability and increased isotropic-compression. Due to their low density, high strength, good thermal and ele- ctrical capacities and good tolerance for chemical agents and high temperatures, cenospheres find tremendous ap- plication in various industries [32-35].
2. Experimental Details
2.1. Materials and Sample Preparation
The type of resin used in this work is vinylester resin (density 1.23 gm/cm3) supplied by Northern Polymer Ltd., Delhi, India. The filler material used in this study is cenosphere (Hardness 5 - 6 MOH, Density 0.4 - 0.6 gm/cm3), supplied by Cenosphere India Pvt. Ltd. Ceno- spheres are inert hollow silicate spheres. The shape of cenosphere is spherical and the colour is light gray. The chemical composition of cenosphere is SiO2-55%, Al2O3- 34%, Fe2O3-1.5%, TiO2-1.2%, Carbon dioxide-70%, Nitrogen-30%.
For preparation of composites specimens using hand-
Copyright © 2012 SciRes. JMMCE
S. CHAUHAN, S. THAKUR 940
layup technique of the vinylester resin in four different percentages (2 wt%, 6 wt%, 10wt%, and 15 wt%). Also the hardener methyl-ethyl-ketone-peroxide (MEKP) and accelerator cobalt nephthalate was mixed. This mix was stirred mechanically for half an hour so that dispersing cenosphere fillers (90 µm) take place. The curing of samples was carried at room temperature for 24 hrs. Slowly poured in glass tubes so as to get cylindrical specimens (diameter 12 mm, length 120 mm). The hard- ened composite samples are extracted from the glass tube. A releasing agent (Silicon spray) is used to facilitate easy removal of composites from the glass tube after curing. Specimens of suitable dimension are cut using a diamond cutter forwear test.
2.2. Friction and Sliding Wear Testing
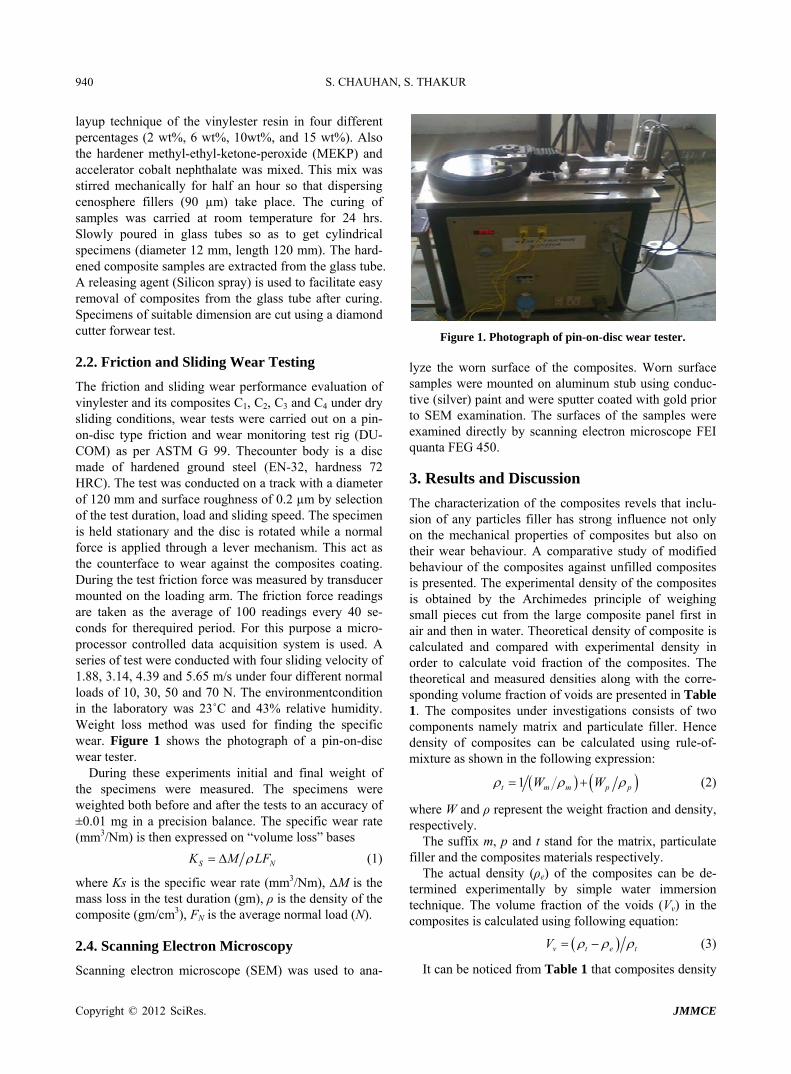
The friction and sliding wear performance evaluation of vinylester and its composites C1, C2, C3 and C4 under dry sliding conditions, wear tests were carried out on a pin- on-disc type friction and wear monitoring test rig (DU- COM) as per ASTM G 99. Thecounter body is a disc made of hardened ground steel (EN-32, hardness 72 HRC). The test was conducted on a track with a diameter of 120 mm and surface roughness of 0.2 µm by selection of the test duration, load and sliding speed. The specimen is held stationary and the disc is rotated while a normal force is applied through a lever mechanism. This act as the counterface to wear against the composites coating. During the test friction force was measured by transducer mounted on the loading arm. The friction force readings are taken as the average of 100 readings every 40 se- conds for therequired period. For this purpose a micro- processor controlled data acquisition system is used. A series of test were conducted with four sliding velocity of 1.88, 3.14, 4.39 and 5.65 m/s under four different normal loads of 10, 30, 50 and 70 N. The environmentcondition in the laboratory was 23˚C and 43% relative humidity. Weight loss method was used for finding the specific wear. Figure 1 shows the photograph of a pin-on-disc wear tester.
During these experiments initial and final weight of the specimens were measured. The specimens were weighted both before and after the tests to an accuracy of ±0.01 mg in a precision balance. The specific wear rate (mm3/Nm) is then expressed on “volume loss” bases
S NK M LF (1)
where Ks is the specific wear rate (mm3/Nm), ∆M is the mass loss in the test duration (gm), ρ is the density of the composite (gm/cm3), FN is the average normal load (N).
2.4. Scanning Electron Microscopy
Scanning electron microscope (SEM) was used to ana-
Figure 1. Photograph of pin-on-disc wear tester. lyze the worn surface of the composites. Worn surface samples were mounted on aluminum stub using conduc- tive (silver) paint and were sputter coated with gold prior to SEM examination. The surfaces of the samples were examined directly by scanning electron microscope FEI quanta FEG 450.
3. Results and Discussion
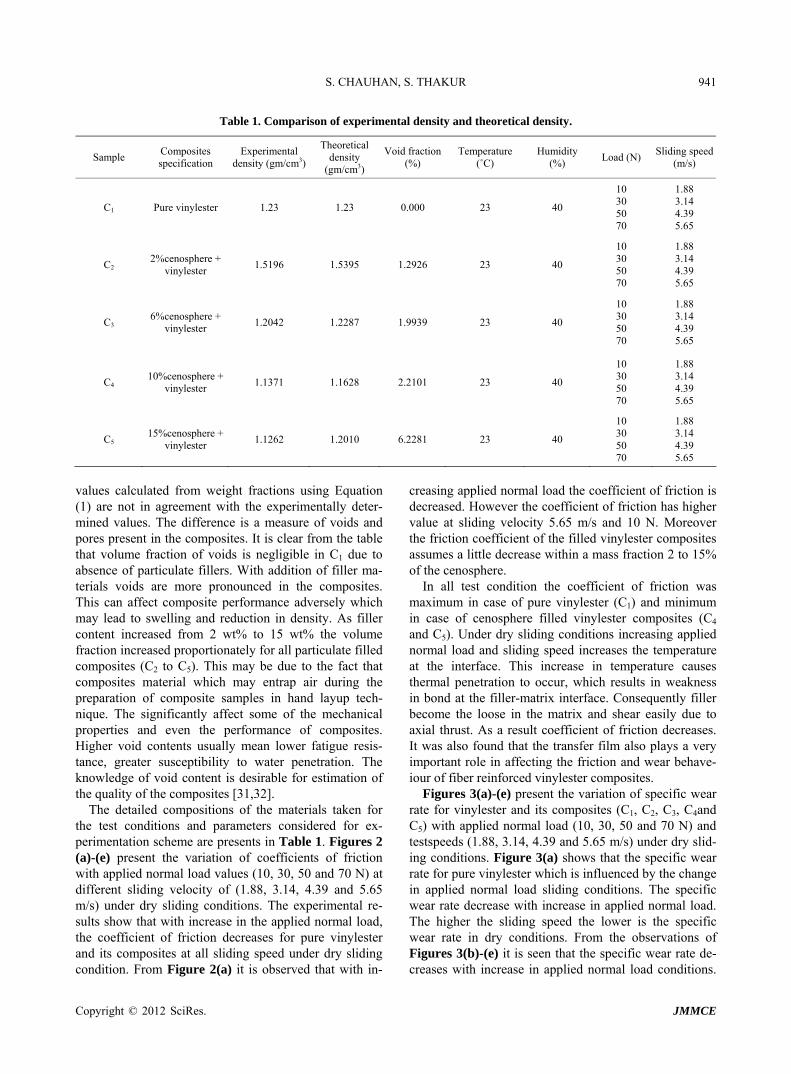
The characterization of the composites revels that inclu- sion of any particles filler has strong influence not only on the mechanical properties of composites but also on their wear behaviour. A comparative study of modified behaviour of the composites against unfilled composites is presented. The experimental density of the composites is obtained by the Archimedes principle of weighing small pieces cut from the large composite panel first in air and then in water. Theoretical density of composite is calculated and compared with experimental density in order to calculate void fraction of the composites. The theoretical and measured densities along with the corre- sponding volume fraction of voids are presented in Table 1. The composites under investigations consists of two components namely matrix and particulate filler. Hence density of composites can be calculated using rule-of- mixture as shown in the following expression:
1t m m p pW W
(2)
where W and ρ represent the weight fraction and density, respectively.
The suffix m, p and t stand for the matrix, particulate filler and the composites materials respectively.
The actual density (ρe) of the composites can be de- termined experimentally by simple water immersion technique. The volume fraction of the voids (Vv) in the composites is calculated using following equation:
v t e tV (3)
It can be noticed from Table 1 that composites density
Copyright © 2012 SciRes. JMMCE
S. CHAUHAN, S. THAKUR
Copyright © 2012 SciRes. JMMCE
941
Table 1. Comparison of experimental density and theoretical density.
Sample Composites specification
Experimental density (gm/cm3)
Theoretical density
(gm/cm3)
Void fraction(%)
Temperature (˚C)
Humidity (%)
Load (N) Sliding speed
(m/s)
C1 Pure vinylester 1.23 1.23 0.000 23 40
10 30 50 70
1.88 3.14 4.39 5.65
C2 2%cenosphere +
vinylester 1.5196 1.5395 1.2926 23 40
10 30 50 70
1.88 3.14 4.39 5.65
C3 6%cenosphere +
vinylester 1.2042 1.2287 1.9939 23 40
10 30 50 70
1.88 3.14 4.39 5.65
C4 10%cenosphere +
vinylester 1.1371 1.1628 2.2101 23 40
10 30 50 70
1.88 3.14 4.39 5.65
C5 15%cenosphere +
vinylester 1.1262 1.2010 6.2281 23 40
10 30 50 70
1.88 3.14 4.39 5.65
values calculated from weight fractions using Equation (1) are not in agreement with the experimentally deter- mined values. The difference is a measure of voids and pores present in the composites. It is clear from the table that volume fraction of voids is negligible in C1 due to absence of particulate fillers. With addition of filler ma- terials voids are more pronounced in the composites. This can affect composite performance adversely which may lead to swelling and reduction in density. As filler content increased from 2 wt% to 15 wt% the volume fraction increased proportionately for all particulate filled composites (C2 to C5). This may be due to the fact that composites material which may entrap air during the preparation of composite samples in hand layup tech- nique. The significantly affect some of the mechanical properties and even the performance of composites. Higher void contents usually mean lower fatigue resis- tance, greater susceptibility to water penetration. The knowledge of void content is desirable for estimation of the quality of the composites [31,32].
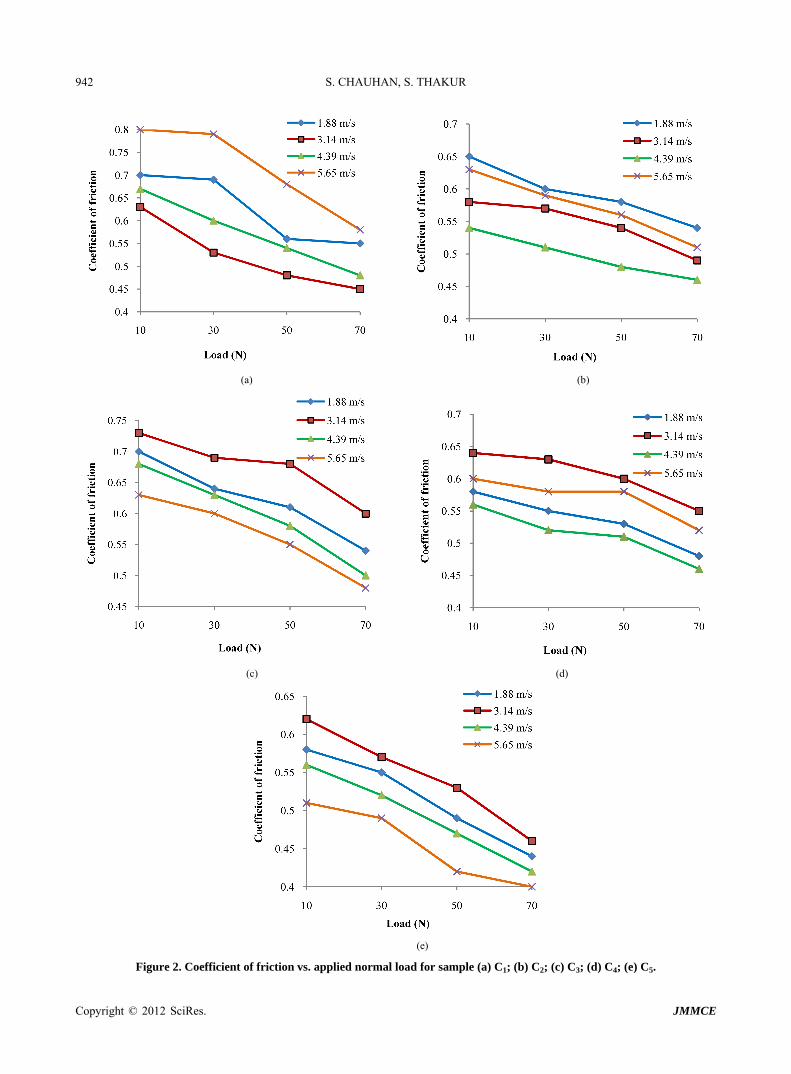
The detailed compositions of the materials taken for the test conditions and parameters considered for ex- perimentation scheme are presents in Table 1. Figures 2 (a)-(e) present the variation of coefficients of friction with applied normal load values (10, 30, 50 and 70 N) at different sliding velocity of (1.88, 3.14, 4.39 and 5.65 m/s) under dry sliding conditions. The experimental re- sults show that with increase in the applied normal load, the coefficient of friction decreases for pure vinylester and its composites at all sliding speed under dry sliding condition. From Figure 2(a) it is observed that with in-
creasing applied normal load the coefficient of friction is decreased. However the coefficient of friction has higher value at sliding velocity 5.65 m/s and 10 N. Moreover the friction coefficient of the filled vinylester composites assumes a little decrease within a mass fraction 2 to 15% of the cenosphere.
In all test condition the coefficient of friction was maximum in case of pure vinylester (C1) and minimum in case of cenosphere filled vinylester composites (C4 and C5). Under dry sliding conditions increasing applied normal load and sliding speed increases the temperature at the interface. This increase in temperature causes thermal penetration to occur, which results in weakness in bond at the filler-matrix interface. Consequently filler become the loose in the matrix and shear easily due to axial thrust. As a result coefficient of friction decreases. It was also found that the transfer film also plays a very important role in affecting the friction and wear behave- iour of fiber reinforced vinylester composites.
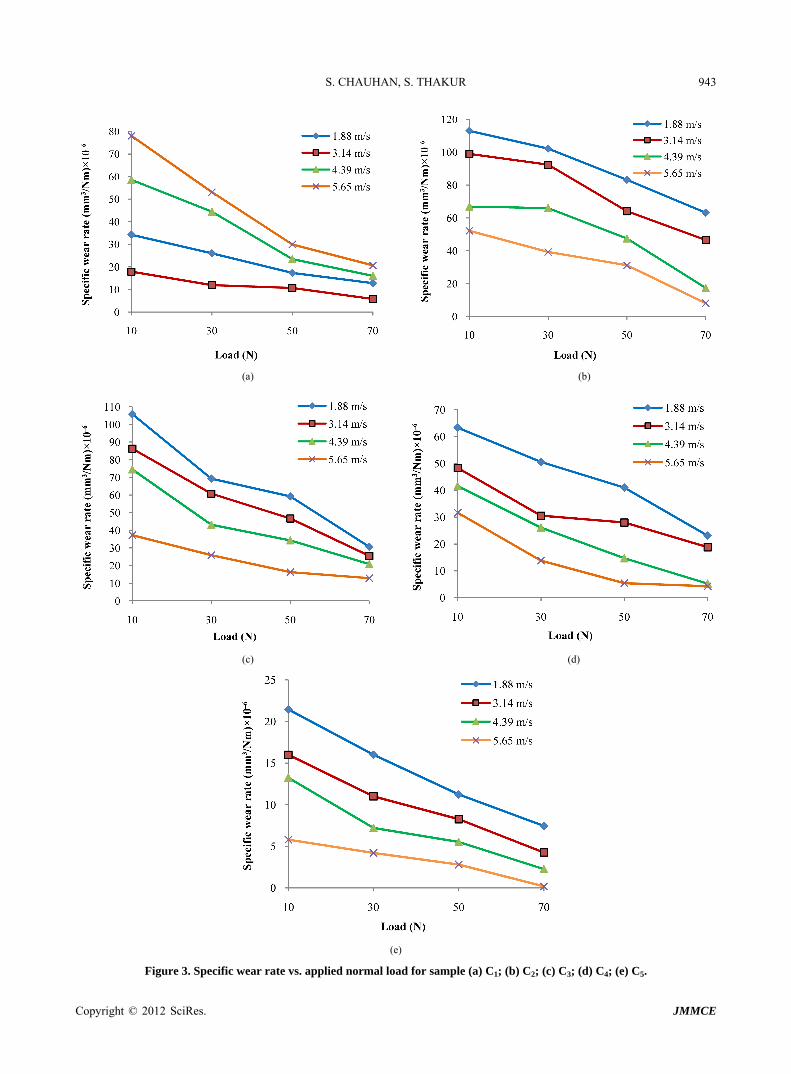
Figures 3(a)-(e) present the variation of specific wear rate for vinylester and its composites (C1, C2, C3, C4and C5) with applied normal load (10, 30, 50 and 70 N) and testspeeds (1.88, 3.14, 4.39 and 5.65 m/s) under dry slid- ing conditions. Figure 3(a) shows that the specific wear rate for pure vinylester which is influenced by the change in applied normal load sliding conditions. The specific wear rate decrease with increase in applied normal load. The higher the sliding speed the lower is the specific wear rate in dry conditions. From the observations of Figures 3(b)-(e) it is seen that the specific wear rate de- creases with increase in applied normal load conditions.
S. CHAUHAN, S. THAKUR 942
(a) (b)
(c) (d)
(e)
Figure 2. Coefficient of friction vs. applied normal load for sample (a) C1; (b) C2; (c) C3; (d) C4; (e) C5.
Copyright © 2012 SciRes. JMMCE
S. CHAUHAN, S. THAKUR 943
(a) (b)
(c) (d)
(e)
Figure 3. Specific wear rate vs. applied normal load for sample (a) C1; (b) C2; (c) C3; (d) C4; (e) C5.
Copyright © 2012 SciRes. JMMCE
S. CHAUHAN, S. THAKUR
C JMMCE
944
The highest wear rate is for pure vinylester under dry sliding conditions with the value of 78.04 × 10⁻⁶ mm3/Nm at 5.65 m/s and load of 10 N. The lowest wear rate is 0.18 × 10⁻⁶ mm3/Nm for vinylester composite C5(vinylester + 15wt% cenosphere) composite at 5.65 m/s sliding speed and applied normal load 70 N. The wear rate of the vi- nylester composites assumes an obvious decrease with increasing filler content from 2 wt% to 15 wt%. The spe- cific wear rate for vinylester and vinylestercomposites is little influenced by the applied normal load and sliding velocity.
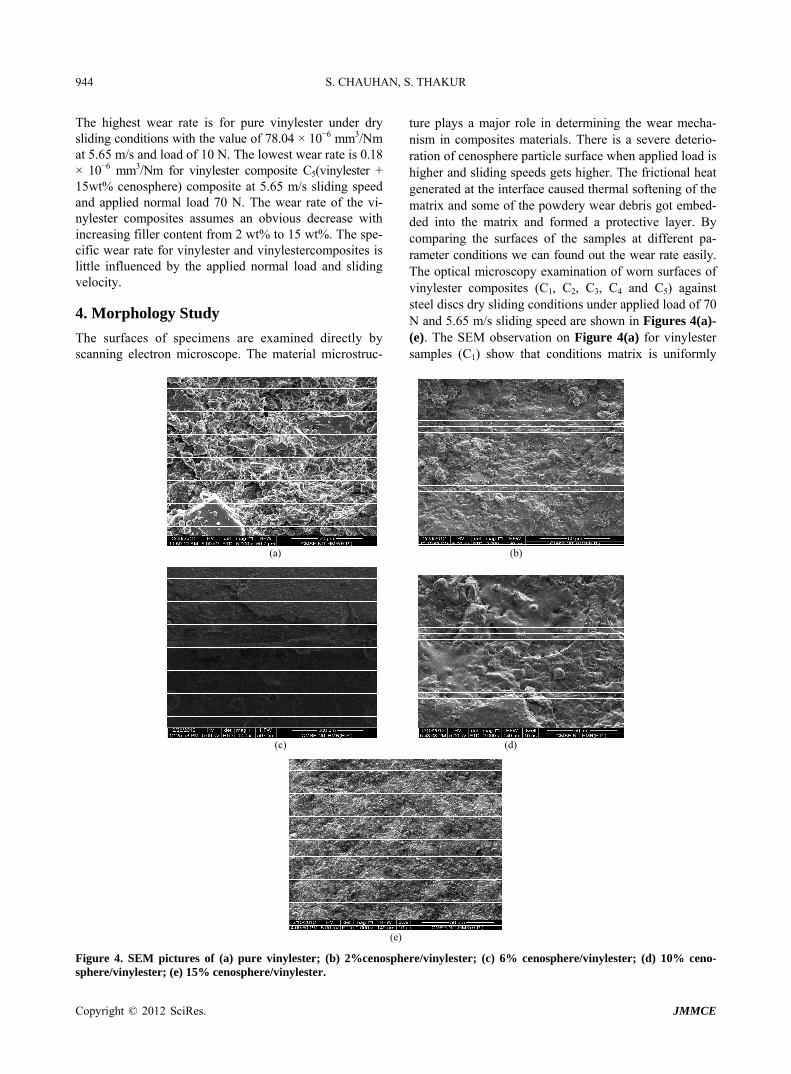
ture plays a major role in determining the wear mecha- nism in composites materials. There is a severe deterio- ration of cenosphere particle surface when applied load is higher and sliding speeds gets higher. The frictional heat generated at the interface caused thermal softening of the matrix and some of the powdery wear debris got embed- ded into the matrix and formed a protective layer. By comparing the surfaces of the samples at different pa- rameter conditions we can found out the wear rate easily. The optical microscopy examination of worn surfaces of vinylester composites (C1, C2, C3, C4 and C5) against steel discs dry sliding conditions under applied load of 70 N and 5.65 m/s sliding speed are shown in Figures 4(a)- (e). The SEM observation on Figure 4(a) for vinylester samples (C1) show that conditions matrix is uniformly
4. Morphology Study
The surfaces of specimens are examined directly by scanning electron microscope. The material microstruc-
(a) (b)
(c) (d)
(e)
Figure 4. SEM pictures of (a) pure vinylester; (b) 2%cenosphere/vinylester; (c) 6% cenosphere/vinylester; (d) 10% ceno- sphere/vinylester; (e) 15% cenosphere/vinylester.
opyright © 2012 SciRes.
S. CHAUHAN, S. THAKUR 945
spreaded over the surface specimen, cracks in the matrix and fewer wear debris can be seen that indicates higher wear rate. As observed from figure it exhibit highest wear among all applied loads due to cutting mode ofabra- sive wear is occurred which results in deep grooves that are clearly visible in micrograph. Cenosphere filled com- posites (2 wt%, 6 wt%, 10 wt% and 15 wt%) show the lesser spread of the matrix debris compare to pure vi- nylester under 70 N load and 5.65 m/s higher sliding ve- locity. Increasing the filler loading from 2 wt% to 15 wt% into vinylester resin the sample yields surfaces which shows a less smearing wear of the matrix region compare to unfilled sample (C1). From Figure 4(b) for composite samples (C2) the observations show that con- ditions the matrix is uniformly spreaded over major por- tion of the specimen in the matrix that indicates lower wear rate. It is clear from the micrograph that the only- mechanism that causes wear at this condition is wedge formation mode of abrasive wear, this can be attributed to the fact that there is comparatively good adhesion be- tween the filler and matrix which in turn results into lowest wear rate. Micrograph shows the existence of ploughing and wedge formation which is characterized by wear due to plastic deformation and results into mod- erate wear rate. The examination of the wear scars indicated that the damage morphologies for all samples were similar. The disc worn surfaces for vinylester composite (C3) show that more of the cenosphere exposures indi- cating higher wear rate. Figures 4(c) and (d) represents the micrographs of 6 wt% and 10 wt% ofvinylester rein- forced composites at a load of 70 N respectively and both these composites shows moderate wear which results in breakage of composites at distinct places due to the com- bination of wedge formation and ploughing mechanism of abrasive wear. This also confirmed form Figure 4(c). A wear track is clearly visible in micrograph. These ob- servations from SEM very well confirm to the experi- mental results depicted in Figure 3.
5. Conclusions
The main aim of this research work is to investigate the influence of cenosphere particle on friction and wear be- havior of vinylester composites. An experimental study of friction and wear behavior of vinylester composites at different sliding speed, applied normal load can reveals the following: The coefficient of friction of vinylester and its com-
posite decreases with increase in applied normal load. Pure vinylester has higher specific wear rate due to
small mechanical properties. Therefore incorporation cenosphere particle in vinylester matrix improves the wear characteristics.
The highest wear rate is for pure vinylester under dry
sliding conditions with a value of 78.04 × 10⁻⁶ mm3/Nm at 900 rpm and load of 10 N. However the lowest wear rate is 0.18 × 10⁻⁶ mm3/Nm vinylester composite C2 composite at 700 rpm and applied nor- mal load 70 N. The incorporation of the micro-size cenosphere contributed to increase the wear-resis- tance of the vinylester composites. The vinylester composites filled with 15% cenosphere recorded the smallest friction coefficient while that filled with 15% cenosphere showed the best wear-resistance.
The specific wear rate for vinylester and vinylester composites is little influenced by the applied normal load and sliding velocity.
For the range of load and sliding velocity in this study it is observed that load has stronger effect on the fric- tion and wear than the sliding velocity.
REFERENCES [1] I. M. Hutchings, “Tribology Friction and Wear of Engi-
neering Materials,” CRC Press, London, 1992.
[2] S. W. Zhang, “State of the Art of Polymer Tribology,” Tribology International, Vol. 31, No. 1-2, 1998, pp. 49- 60. doi:10.1016/S0301-679X(98)00007-3
[3] J. R. Vinson and T. Chou, “Composite Materials and Their Uses in Structures,” Applied Science Publishing, London, 1975.
[4] S. W. Tsai, “Strength Characteristics of Composite Mate- rials,” NASA Report: NASACR- 224, 1965.
[5] B. J. Briscoe, “Wear of Polymers: An Easy on Funda- mental Aspects,” Tribology International, Vol. 14, No. 4, 1981, pp. 231-243. doi:10.1016/0301-679X(81)90050-5
[6] R. Huang, “Engineering Plastic Handbook,” Mechanical Industry Press, Beijing, 2000.
[7] Z. K. Gahr, “Microstructure and Wear of Materials,” Elsevier, Amsterdam, 1987.
[8] K. Friedrich, K. J. Karger and Z. Lu, “Overview on Poly- mer Composites for Friction and Wear Application,” Journal of Theoretical and Applied Fracture Mechanics, Vol. 19, No. 1, 1993, pp. 1-11. doi:10.1016/0167-8442(93)90029-B
[9] N. Axen, S. Hogmark and S. Jacobson, “Friction and Wear Measurement Techniques,” In: B. Bhushan, Ed., Modern Tribology Handbook, CRC Press LLC, London, Vol. 1, 2001, pp. 493-510.
[10] Y. Yamaguchi, “Tribology of Plastic Materials,” Tribol- ogy Series, Elsevier, New York, Vol. 16, 1990.
[11] P. B. Mody, T. W. Chou and K. Friedrich, “Effect of Testing Condition and Microstructure on the Sliding Wear of Graphite Fiber/PEEK Matrix Composites,” Journal of Material Science, Vol. 23, No. 12, 1998, pp. 4319-4330. doi:10.1007/BF00551926
[12] P. Arivalagan, G. Chandramohan, Arunkumar and N. Palaniappan, “Studies on Dry Sliding Wear Behaviour of Hybrid Composites,” Browse Conference Publications of Frontiers in Automobile and Me- chanical Engineering,
Copyright © 2012 SciRes. JMMCE
S. CHAUHAN, S. THAKUR 946
Chennai, 25-27 November 2010, pp. 46-49. doi:10.1109/FAME.2010.5714796
[13] S. Basavarajappa, K. V. Arun and J. Pauloand Davim, “Effect of Filler Materials on Dry Sliding Wear Behavior of Polymer Matrix Composites—A Taguchi Approach,” Journal of Minerals & Materials Characterization & Engineering, Vol. 8, No. 5, 2009, pp. 379-391.
[14] E. Santer, and H. Czinchos, “Tribology of Polymer,” Tribology International, Vol. 22, No. 2, 1989, pp. 102- 109.
[15] P. Hasim and T. Nihat, “Investigation of the Wear Be- haviour of a Glass-Fibre-reinforced Composites and Plain Polyester Resin,” Composites Science and Technology, Vol. 62, No. 3, 2002, pp. 367-370. doi:10.1016/S0266-3538(01)00196-8
[16] K. P. Sampathkumaran, S. Seetharamu, S. Vynatheya, S. Murali and R. K. Kumar, “SEM Observations of the Ef- fects of Velocity and Load on the Sliding Wear Charac- teristics of Glass Fabric-Epoxy Composites with Differ- ent Fillers,” Wear, Vol. 237, No. 1, 2000, pp. 20-27. doi:10.1016/S0043-1648(99)00300-2
[17] B. Suresha, G. Chandramohan, J. N. Prakash, V. Balu- samy, and K. Sankaranarayanasamy, “The Role of Fillers on Friction and Slide Wear Characteristics in Glass-Ep- oxy Composite Systems,” Journal of Minerals & Materi- als Characterization & Engineering, Vol. 5, No. 1, 2006, pp. 87-101.
[18] S. Bahadur, “The Development of Transfer Layers and Their Role in Polymer Tribology,” Wear, Vol. 245, No. 1-2, 2000, pp. 92-99. doi:10.1016/S0043-1648(00)00469-5
[19] B. P. Singh, R. C. Jain and I. S. Bharadwaj, “Synthesis, Characterization and Properties of Vinyl Ester Matrix Resins,” Journal of Polymer Science, Vol. 2, 1994, p. 941.
[20] S. R. Chauhan, A. Kumar and I. Singh, “Mechanical and Wear Characterization of Vinyl Ester Resin Matrix Com- posites with Different Co-Monomers,” Journal of Rein- forced Plastics and Composites, Vol. 28, No. 21, 2008, pp. 2675-2684.
[21] S. Kumar, S. Gowtham and M. Sharpe, “Carbon/Vinyl Ester Composites for Enhanced Performance in Marine Applications,” Journal of Reinforced Plastics and Com- posites, Vol. 25, No. 10, 2006, pp. 1101-1116. doi:10.1177/0731684406065194
[22] S. R. Chauhan, A. Kumar, I. Singh and P. Kumar, “Effect of Fly Ash Content on Friction and Dry Sliding Wear Behavior of Glass Fiber Reinforced Polymer Composites —A Taguchi Approach,” Journal of Minerals & Materials Characterization & Engineering, Vol. 9, No. 4, 2010, pp. 365-387.
[23] P. K. Kolay and D. N. Singh, “Physical, Chemical, Min- eralogical and Thermal Properties of Cenospheres from an Ash Lagoon,” Cement and Concrete Research, Vol. 31,
No. 4, 2001, pp. 539-542. doi:10.1016/S0008-8846(01)00457-4
[24] W. D. Scott, “Vinyl Ester/Cenosphere Composite Materi- als for Civil and Structural Engineering,” Fiber Rein- forced Polymer International, Vol. 2, No. 3, 2005, pp. 2-5.
[25] R. J. Cardoso, A. Shukla and A. Bose, “Effect of Particle Size and Surface Treatment on Constitutive Properties of Polyester Cenosphere Composites,” Journal of Material Science, Vol. 37, No. 3, 2002, pp. 603-13. doi:10.1023/A:1013781927227
[26] S. Torrey, “Coal Ash Utilization: Fly Ash Bottom Ash and Slag,” Noyes Data, Park Ridge, 1978.
[27] A. Das and B. K. Satapathy, “Structural, Thermal, Me- chanical and Dynamic Mechanical Properties of Ceno- sphere Filled Polypropylene Composites,” Journal of Ma- terials and Design, Vol. 32, No. 3, 2011, pp. 1477-1484.
[28] M. A. Abdullah, “Characterization of ACS Modified Epoxy Resin Composites with Fly Ash and Cenospheres as Fillers: Mechanical and Microstructural Properties,” Journal of Polymer Composites, Vol. 32, No. 1, 2011, pp. 139-146.
[29] K. W. Y. Wong and R. W. Truss, “Effect of Flyash Con- tent and Coupling Agent on the Mechanical Properties of Flyash Filled Polypropylene,” Composites Science and Technology, Vol. 52, No. 3, 1994, pp. 361-368. doi:10.1016/0266-3538(94)90170-8
[30] N. Dadkar, “Performance Assessment of Hybrid Com- posite Friction Materials Based on Flyash-Rock Fibre- Combination,” Material Design, Vol. 31, No. 2, 2010, pp. 723-731. doi:10.1016/j.matdes.2009.08.009
[31] E. Raask, “Cenosphere in Pulverized-Fuel Ash,” Journal of the Institute of Fuel, Vol. 41, No. 332, 1968, pp. 339- 344.
[32] G. L. Fisher, D. P. Y. Chang and M. Brummer, “Fly Ash Collected from Electrostatic Precipitators: Microcrystal- lines Structures and the Mystery of the Spheres,” Science, Vol. 192, No. 4239, pp. 553-555. doi:10.1126/science.192.4239.553
[33] B. D. Agarwal and L. J. Broutman, “Analysis and Per- formance of Fiber Composites,” 2nd Edition, John Wiley and Sons, Inc., Hoboken, 1990.
[34] S. S. Mahapatra and A. Patnaik, “Study on Mechanical and Erosion Wear Behavior of Hybrid Composites Using Taguchi Experiment Design,” Materials and Design, Vol. 30, No. 8, 2009, pp. 2791-2801. doi:10.1016/j.matdes.2009.01.037
[35] M. B. Kulkarniand and P. A. Mahanwar, “Effect of Methyl Methacrylate—Acrylonitrile Butadiene—Styrene (MABS) on the Mechanical and Thermal Properties of Poly (Methyl Methacrylate) (PMMA)-Fly Ash Ceno- spheres (FAC) Filled Composites,” Journal of Minerals & Materials Characterization & Engineering, Vol. 11, No. 4, 2012, pp. 365-383.
Copyright © 2012 SciRes. JMMCE