Criticality of PIutonium Nitrate SoIution Containing Soluble Gadolinium
HAL Id: hal-02437163https://hal.archives-ouvertes.fr/hal-02437163
Submitted on 16 Nov 2020
HAL is a multi-disciplinary open accessarchive for the deposit and dissemination of sci-entific research documents, whether they are pub-lished or not. The documents may come fromteaching and research institutions in France orabroad, or from public or private research centers.
L’archive ouverte pluridisciplinaire HAL, estdestinée au dépôt et à la diffusion de documentsscientifiques de niveau recherche, publiés ou non,émanant des établissements d’enseignement et derecherche français ou étrangers, des laboratoirespublics ou privés.
Effect of Long-Term Retention of Gadolinium onMetabolism of Deep Cerebellar Nuclei After Repeated
Injections of Gadodiamide in RatsDounia El Hamrani, Véronique Vives, Rebecca Buchholz, William Même,Cécile Factor, Stefanie Fingerhut, Michael Sperling, Uwe Kärst, Philippe
Robert, S. Même
To cite this version:Dounia El Hamrani, Véronique Vives, Rebecca Buchholz, William Même, Cécile Factor, et al.. Effectof Long-Term Retention of Gadolinium on Metabolism of Deep Cerebellar Nuclei After RepeatedInjections of Gadodiamide in Rats. Investigative Radiology, Lippincott, Williams & Wilkins, 2020, 55(2), pp.120-128. �10.1097/RLI.0000000000000621�. �hal-02437163�

1
Effect of long-term retention of gadolinium on metabolism of deep 1
cerebellar nuclei after repeated injections of gadodiamide in rats 2
Running title: Gadolinium retention on cerebellar metabolism 3
Dounia El Hamrani, PhD1; Véronique Vives, PhD2; Rebecca Buchholz, MSc3, William Même, 4
PhD1; Cecile Factor, PhD2; Stefanie Fingerhut, PhD3; Michael Sperling, PhD3; Uwe Karst, 5
PhD3; Philippe Robert, PhD2, Sandra Même, PhD1 6
1 Center of Molecular Biophysics, CNRS UPR4301, Rue Charles Sadron, CS 80054, 45071, 7
Orléans Cedex 2, France 8
2 Department of Research and Innovation, Imaging and Biological Research Division, Guerbet 9
Group, BP57400, 95943 Roissy CDG, France 10
3 Institute of Inorganic and Analytical Chemistry, University of Münster, Corrensstraße 30, 11
48149, Münster, Germany 12
Correspondence to: Sandra Même, Center of Molecular Biophysics, CNRS UPR4301, Rue 13
Charles Sadron, CS 80054, 45071, Orléans Cedex 2, France 14
Phone: +33 (0)2 38 25 51 07; Fax: +33 (0)2 38 63 15 17; Email: [email protected] 15
Acknowledgments 16
The authors gratefully acknowledge: J. Leiten and M. Rasschaert (Guerbet Group, France) for their 17
technical support in animal care; J. Valette, PhD (MIRCen, Gif-sur-Yvette, France) and H. Ratiney, PhD 18
(CREATIS-INSA, Lyon, France) for their helpful discussions on MRS analysis; Y. Le Fur, PhD 19
(CRMBM, Marseille, France) for his tutorial of CSIapo software; F. Baudimont (Atlantic Bone Screen, 20
Nantes, France) for her expertise in histology. 21
Conflicts of Interest and Source of Funding 22
This work was supported by Region Centre-Val de Loire (France) (Grant number: n°201400093609). 23
P.R., V.V. and C.F. are Guerbet employees. D.E., W.M., S.M., R.B., S.F., M.S., U.K. declare that there 24
are no conflicts of interest related to this manuscript. 25

2
Abstract 26
Objectives: To determine potential metabolism and histological modifications due to 27
gadolinium retention within deep cerebellar nuclei (DCN) after linear gadolinium based 28
contrast agent injection (gadodiamide) in rats at 1 year after the last injection. 29
Materials and Methods: Twenty rats received 20 doses of gadodiamide (0.6 mmol of 30
gadolinium per kilogram each) over 5 weeks. They were followed at 1 week (M0), 6 weeks 31
(M1) and 54-55 weeks (M13) post-injections to evaluate hypersignal on unenhanced T1-32
weighted MRI and metabolic alterations by 1H MRS. At 1 year post-injections, brains were 33
sampled to determine the localization of gadolinium within cerebellum by laser ablation 34
inductively coupled mass spectroscopy (LA-ICP-MS) and to evaluate morphological changes 35
by semi-quantitative immunofluorescence analysis. 36
Results: There is a significant increase of the ratio DCN/brainstem for the gadodiamide group 37
at M0 (+7.2% vs control group=0.989±0.01), M1 (+7.6% vs control group=1.002±0.018) and 38
it lasted up to M13 (+4.7% vs control group=0.9862±0.008). No variation among metabolic 39
markers (cellular homeostasis, excitatory neurotransmitter and metabolites specific to a cellular 40
compartment) were detected by 1H MRS between gadodiamide and saline groups at M0, M1 41
and M13. At M13, LA-ICP-MS demonstrated that long-term gadolinium retention occurred 42
preferentially in DCN. No histological abnormalities (including analysis of astrocytes, neurons 43
and microglial cells) were found in the rostral part of DCN. 44
Conclusion: Repeated administration of gadodiamide lead to a retention of gadolinium 45
preferentially within DCN until 1-year post-injections. This retention did not lead to any 46
detectable changes of metabolic biomarkers nor histological alterations. 47
Key words: gadolinium based contrast agent; cerebellum; deep cerebellar nuclei; gadolinium 48
retention; MRI ; 1H MRS ; LA-ICP-MS ; histology. 49

3
Introduction 50
Gadolinium is a lanthanide metal with paramagnetic properties extensively used as a contrast 51
agent for magnetic resonance imaging (MRI). For the last 30 years, over 450 million patients 52
have received gadolinium based contrast agent (GBCA) and these have been prescribed in 30-53
45% of clinical protocols.1–3 However, non-chelated gadolinium (Gd3+ form) is highly toxic in 54
biological systems given its similar size as calcium ion (Ca2+).4 To avoid this toxicity, Gd3+ is 55
chelated with polyaminocarboxylate ligands which can be either macrocyclic or linear. In terms 56
of thermodynamic and kinetic stability, it has been shown that macrocyclic chelates are more 57
stable than their linear counterparts as they demonstrate a lower potential of gadolinium 58
release.5 59
GBCA are extracellular agents which are rapidly cleared from the intravascular space through 60
kidney excretion in patients with normal renal function (90% eliminated during the first 12 61
hours).6 Consequently, GBCA are not supposed to distribute into the central nervous system 62
(CNS) extracellular fluid except if the blood-brain barrier (BBB) is impaired (e.g. tumors, 63
multiple sclerosis, inflammation, irradiation treatment).7,8 64
Nevertheless, Kanda et al. highlighted the presence of a hypersignal on unenhanced T1-weighed 65
MR images in deep grey matter structures of the brain (deep cerebellar nuclei, DCN and globus 66
pallidus, GP) among patients with normal renal function who had received cumulative doses of 67
GBCA.9 Since their seminal article, a positive correlation between this hypersignal in GP and 68
DCN on unenhanced T1-weighed images and the number of repeated intravenous injections of 69
GBCA (up to 6) for MRI exams has been clearly established.7–11 70
Moreover, it has been extensively documented that repeated injections of linear GBCAs lead to 71
gadolinium deposition in DCN as opposed to macrocyclic GBCAs.10,12–15 Most of the studies 72
were conducted by inductively coupled plasma mass spectrometry (ICP-MS) on post-mortem 73
4
samples or resections pieces. They have shown the presence of non-negligible quantities of 74
gadolinium in brain tissue of patients.16,17 Several histological studies have demonstrated that 75
gadolinium retention occurred without alterations of the BBB.16,17 76
Similar findings were reported in non-clinical rodent models assessed by MRI, ICP-MS and 77
histology.18 Recently, Robert et al. have demonstrated that gadolinium presence persists at long-78
term post-injections in brain rats.19 One year after the last injection of one linear GBCA 79
(gadodiamide), gadolinium has been detected by ICP-MS in cerebellum (2.45 nmol/g), cortical 80
brain (1.23 nmol/g), subcortical brain (1.52 nmol/g) and brainstem (0.74 nmol/g). In the case 81
of macrocyclic GBCA (gadoterate), gadolinium concentrations were in the range of the 82
background noise in these structures (from 0.05 to 0.09 nmol/g). Moreover, gadolinium 83
detected after gadodiamide was found to be no longer in its original form but bound to 84
macromolecules. 85
Several questions are still remaining, including if long-term gadolinium deposition has potential 86
adverse health effects. In our study, we decided to address this question by following rats 87
throughout one year after they received cumulative doses of a linear GBCA (gadodiamide). 88
Thereby, we investigated until one year post-injections if : (i) deposition of GBCA could induce 89
cellular alterations detectable by 1H magnetic resonance spectroscopy (1H MRS); (ii) long-term 90
hypersignal on unenhanced T1-weighted MR images is correlated to gadolinium deposition 91
within DCN by laser ablation ICP-MS (LA-ICP-MS) and (iii) histological integrity of cerebellar 92
tissue is compromised. 93
5
Materials and Methods 94
Animals and contrast agent injection 95
All animal experiments were conducted in accordance with French regulations and in 96
compliance with the European Union Directives 2010/63/EU. Twenty female Sprague-Dawley 97
rats aged 10 weeks (SPF/OFA female rats, Charles River, L'Arbresle, France) were used in this 98
study. The animals were housed under a 12 h light/dark cycle at constant temperature of 23±1°C 99
with free access to food and water. 100
Two experimental groups (10 rats per group) were compared: one group received gadodiamide 101
intravenous injections and the other control group received 0.9% saline intravenous injections. 102
All injections were performed following a defined published protocol under general anesthesia 103
(3%-3.5% isoflurane; IsoFlo, Axience, Pantin, France).20 The gadodiamide (Omniscan®, 0.5 104
M, GE Healthcare, Chalfont-St-Giles, United Kingdom) group received 20 intravenous 105
injections of 0.6 mmol of gadolinium per kilogram (1.2 mL/kg) over a period of 5 weeks (4 106
daily and consecutive injections per week). The daily dose of 0.6 mmol gadolinium per 107
kilogram is equivalent to the usual human dose of GBCAs (0.1 mmol of gadolinium per 108
kilogram or 0.2 mL/kg), after adjustment for body surface area as recommended by the Food 109
and Drug Administration21. A clinical follow up of animals was regularly performed. 110
MR experiments 111
During the MR experiments, the animals were positioned in a custom-built cradle to immobilize 112
the head. They were anesthetized during the MR experiment with 1.5%-2% isoflurane and a 113
mixture of O2/N2O (1:1) with an output of 0.5 L/min. Respiration was monitored during the 114
whole experiment using an air pillow and body temperature was maintained constant at 37°C 115
by a warm-water circulation system. MR acquisitions were performed on a 7T horizontal ultra-116
shielded superconducting magnet dedicated to small animal imaging (70/16 Bruker 117
6
Pharmascan, Wissembourg, France) and equipped with a 230 mT/m gradient set. A Bruker 118
38 mm inner diameter birdcage coil was used for both 1H transmission and reception. 119
All rats underwent the same protocol (figure 1). MR experiments were performed at M0 (one 120
week after the last injection; 0 month of washout period), M1 (six weeks after the last injection; 121
1 month of washout period) and M13 (54-55 weeks after the last injection; 13 months of 122
washout period). 123
An unenhanced T1-weighted gradient echo sequence (intra-gate fast low angle shot; Ig-124
FLASH) was used with the following parameters: bandwidth= 75 kHz; TR/TE= 129 ms/2.3 125
ms; 6 averages; in plane resolution= 78 x 78 μm2/pixel; slice thickness= 570 μm; 15 slices; 126
respiration frequency for reconstruction= 40 breaths per minute; acquisition time= 6 minutes 127
38 seconds. 128
PRESS (point resolved spectroscopy) sequence was acquired with the following parameters: 129
voxel size= 3 x 2 x 1.5 mm3; TR/TE=2775 ms/16 ms; spectral bandwidth= 4006.41 Hz (13.34 130
ppm); 2048 points; 970 averages; acquisition time= 44 min 52 seconds. T1-weighted images 131
were used to place the voxel in the left DCN with an extended care to avoid brainstem and 132
subcutaneous lipids. A VAPOR module (variable pulse power and optimized relaxation delays) 133
for water suppression was achieved to assess only cerebellar metabolites. An OVS module 134
(outer volume suppression) was used to eliminate signal outside the voxel. Localized first and 135
second order shim terms were adjusted within the voxel. 136
Quantification of T1-weighted MR Image 137
Quantification was performed in a blinded manner. Two regions of interest (ROI) were 138
positioned in the most visible right or left deep cerebellar nuclei (DCN), and in the brainstem 139
(reference). Signal intensity was calculated as the ratio between the signal of the more visible 140
of the two DCN signal and the brainstem signal (taken as a reference). 141
7
Spectral analysis and quantification 142
Spectra were analyzed on CSIapo software developed by Yann Le Fur (CRMBM, Marseille, 143
France) and Helene Ratiney (CREATIS – INSA, Lyon, France) which is an interface for 144
quantification algorithm QUEST (quantitation based on quantum estimation).22 QUEST is a 145
linear combination model decomposing free induction decay (FID) signal in temporal domain. 146
QUEST uses a database to fit a weighted combination of metabolite signals and then to obtain 147
a quantitation in arbitrary unit (A.U). This database is simulated through GAVA (GAmma 148
Visual Analysis) which is used for modelling metabolites signals including their characteristics 149
(chemical shift, amplitude and phase) and also experimental parameters (magnetic field and 150
echo time).23 151
Cerebral metabolites quantified in DCN are the following: creatine and phosphocreatine 152
(Cr+PCr); N-Acetyl Aspartate (NAA); choline, phosphocholine and glycérophosphocholine 153
(tCho); glutamate (Glu); glutamate+glutamine (Glx); Taurine (Tau) and myo-Inositol (mI) 154
(figure 2). 155
Sample collection 156
Following MR experiments, animals were sacrificed under general anesthesia and analgesia 157
(isoflurane, 5%). The sacrifice consisted in exsanguination and perfusion of the blood system 158
with saline. Immediately after euthanasia of rats, the skull was opened and the brain was taken 159
off. The cerebellum was sampled and placed in OCT medium and then immediately cooled 160
down in isopenthane (-60°C) until complete freezing. Frozen specimens were stored at -80°C. 161
The cerebellum was cut at -20°C in serial 7 µm-thick sections at the level of deep nuclei, 162
according to the atlas of Paxinos and Watson24. The appropriate level of section were validated 163
with cresyl violet staining. The rostral sections of the DCN were used for immunostaining 164
protocols and the caudal portions were sampled for LA-ICP-MS experiments. 165
8
Histology 166
Slides at the level of DCN were used for the immunostaining protocol (n=6/group) in purpose 167
to detect 3 targets of interest: GFAP (glial fibrillary acidic protein, astrocytes maker), 168
synaptophysin (SYP; neurons) and CD68 (microglial cells). Alexa 488 was chosen as the 169
fluorescent dye to detect the targeted molecule. The primary antibodies and corresponding 170
secondary antibody were selected as shown in table 1. The immunostaining protocol was 171
performed for each marker as detailed in table 2. At the end of the immunostaining, slides were 172
cover slipped with a medium containing DAPI (4′,6-diamidino-2-phenylindole) for nuclear 173
counterstain. 174
After immunostaining, images of DCN slides were acquired by epifluorescence microscopy 175
using a FITC filter cube with similar image acquisition parameters for all slides (1280 x 1024 176
pixels, exposure time 300 ms, gain 1, medium contrast). Semi-quantitative analysis of GFAP, 177
SYP and CD68 signals were performed by evaluating the signal distribution and its prevalence 178
on a scale from 0 (no signal) to 3 (high density of signal) within the deep cerebellar nuclei area. 179
LA-ICP-MS 180
For quantitative LA-ICP-MS analysis, matrix matched standards based on gelatin were used for 181
external calibration. Seven gadolinium standards with concentrations ranging from 0 to 50 µg/g 182
were prepared by diluting Gd ICP Standard (TraceCERT®, 1000 mg/L Gd, Sigma-Aldrich, 183
MO, USA) and spiking 10% w/w gelatin (Grüssing GmbH, Filsum, Germany). These standards 184
were heated up to 40°C and homogenized. For quantification of iron, copper and zinc, 185
multielement standards with concentrations ranging from 0 to 100 µg/g per element were 186
prepared in the same way as the Gd standards. Concentrations of the prepared standards were 187
verified by bulk analysis with ICP-MS (iCap TQ, Thermo Fisher, Bremen, Germany) after 188
acidic digestions. 189
9
Gelatin-based standards and the samples (n=6/group) were sliced into 10 µm thick sections with 190
a cryotome (CryoStar NX70, Thermo Fisher, Bremen, Germany) and mounted onto glass slides. 191
LA-ICP-MS analysis was performed with a laser ablation system (LSX G2+, Cetac 192
Technologies, Omaha, USA) equipped with 213 nm Nd:YAG laser, a two-volume HelEX 193
ablation cell and connective tygon tubings, connected to a ICP-MS (iCap TQ, Thermo Fisher, 194
Bremen, Germany) equipped with Ni sampler and skimmer cone and a quartz injector with an 195
inner diameter of 2.5 mm. 196
Laser energy was adjusted to allow for complete ablation of the samples. For calibration, ten 197
parallel lines and for the samples, the whole brain section was ablated linewise with a laser spot 198
size of 25 µm and a scan speed of 75 µm/s. 199
Statistical analysis 200
Data are given as mean ± SEM. Statistical analyses were performed using Prism 5.1 (GraphPad, 201
La Jolla, CA, USA). Non-parametric t test Mann-Whitney was used on weight, MRI and 1H 202
MRS data for comparison between saline and gadodiamide groups. A p<0.05 was considered 203
statistically significant. 204
10
Results 205
Sanitary following of animals 206
Four rats of the gadodiamide group died during the study period: 1 unexplained death (at M0), 207
3 ethically sacrificed (one at M0 and 2 at M1) because signs of pain induced by visible 208
ulcerative and squamous skin lesions. One rat in the saline group died at M0 during the 209
anesthesia. 210
Qualitative analysis of T1-weighted MR images 211
Figure 3 shows examples of typical non enhanced T1-weighted images obtained for both 212
groups (saline and gadodiamide) 1 week (M0), 6 weeks (M1) and 54-55 weeks (M13) after the 213
end of the injections. 214
Specific DCN signal enhancement (arrows) is present for all rats of the gadodiamide group. 215
The hyperintensity was present on the images as early as the week following the end of the 216
injections and persisted over time even 1 year after the end of the injections. 217
Quantitative analysis of signal intensity in T1-weighed images 218
The ratio between the signals of the DCN and the brainstem for M0, M1 and M13 are presented 219
on figure 4. There is a significant increase of the ratio DCN/brainstem for the gadodiamide 220
group at M0 (1 week after the end of the injections) and M1 (6 weeks after the end of the 221
injections). This increase in DCN signal intensity lasted up to 1 year after the end of the 222
injections. 223
At M0, the ratio for DCN signal intensity to brainstem increased by 7.2% in gadodiamide group 224
(1.060±0.010) compared to saline group (0.989±0.01). At M1, the ratio for DCN signal 225
intensity to brainstem was elevated of 7.6% for gadodiamide group (1.078±0.014) vs saline 226
group (1.002±0.018). At M13, the ratio for DCN signal intensity to brainstem was greater of 227
4.7% for gadodiamide group (1.033±0.011) in comparison of saline group (0.9862±0.008). 228
11
MR Spectroscopy 229
Figure 5 represents the concentration of metabolites measured in the DCN at M0 (1 week post-230
injections), M1 (6 weeks post-injections) and M13 (54-55 weeks post-injections). MRS allows 231
to detect three categories of metabolites: (i) cellular homeostasis (creatine, choline, taurine); (ii) 232
excitatory neurotransmitter (glutamate) and (iii) metabolites specific to a cellular compartment 233
(NAA for neurons and myo-Inositol for glial cells). No variation among these markers was 234
detected between gadodiamide and saline groups at M0, M1 and M13. 235
LA-ICP-MS 236
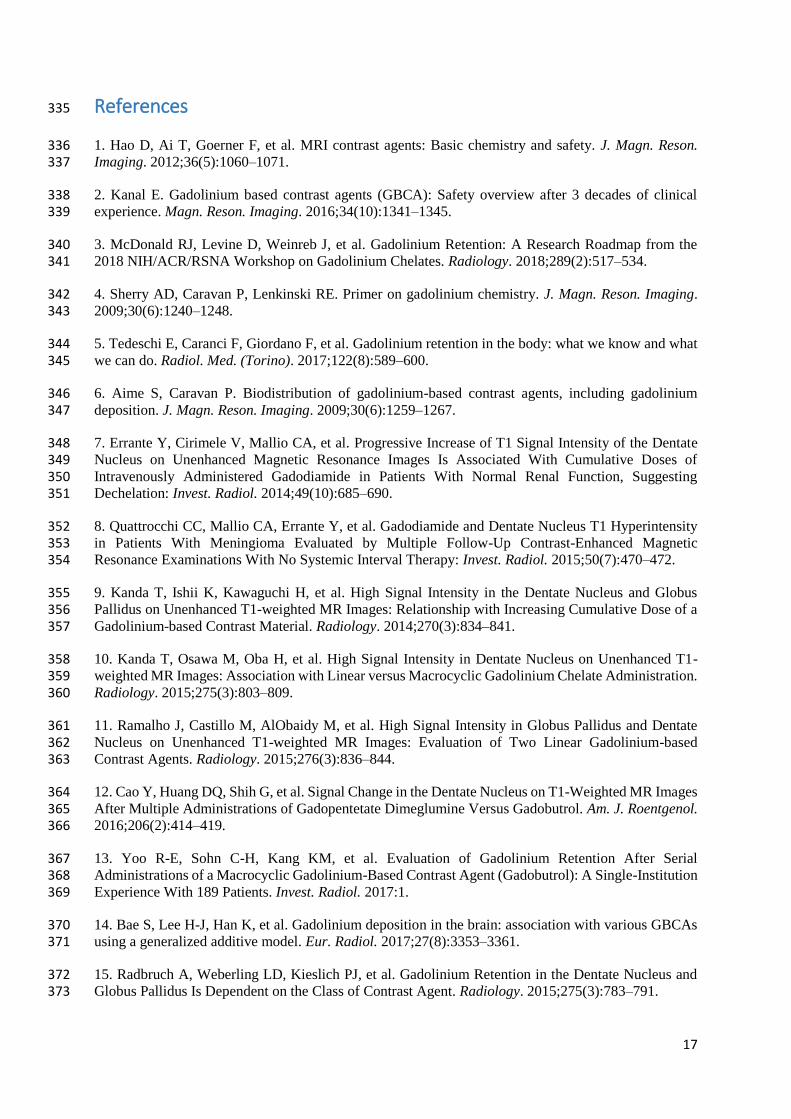
The element distribution for Gd, P, Fe, Cu and Zn in rat brain observed after repeated injection 237
of either gadodiamide (left side) or saline solution (right side) are shown in figure 6. 238
Corresponding microscopic images of the analysed thin sections are also shown (a,b) for 239
comparison. Concentrations up to 64 nmol/g, in a few cases even higher, were found in the 240
brain of rats treated with gadodiamide. Highest concentrations were found in the region of 241
DCN, with average concentrations ranging from 25 to 35 nmol/g in the three substructures. For 242
the rat brain injected with saline solution, no Gd could be detected. 243
No clear correlation between gadolinium and phosphorous, copper or zinc can be observed, but 244
the highest Gd concentrations are found in the region with highest iron concentrations. The 245
average iron concentrations are slightly lower (497 nmol/g) in the DCN of the gadodiamide 246
sample compared to the untreated animal (665 nmol/g). 247
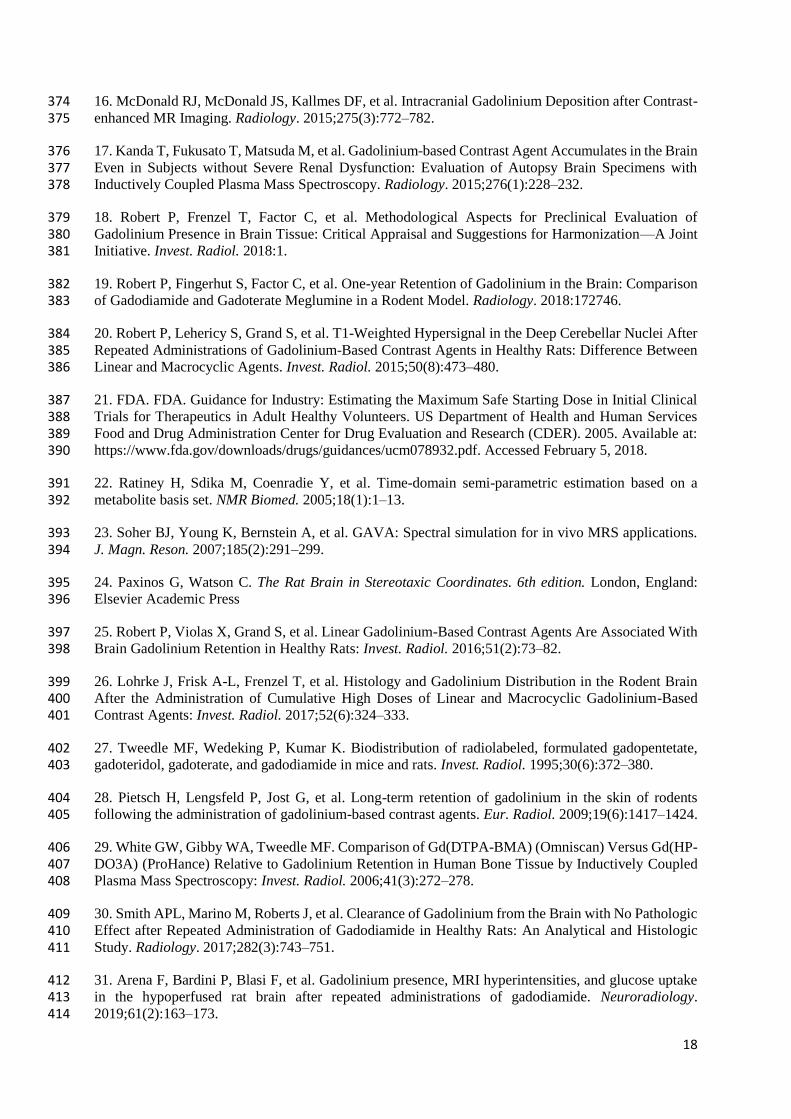
Immunofluorescent analysis 248
Semi-quantitative analysis of cerebellar cell populations (astrocytes, neurons and glial cells) 249
were performed at 1-year post-injections in gadodiamide and saline groups. 250
GFAP is a marker for astrocyte cells (density and thickness of astrocyte processes) and allowed 251
to determine their distribution (perineuronal and perivascular). Synaptophysin is a neuronal 252

12
marker which provide a morphological information on perikaryon. CD68 is a marker for 253
microglial cells which indicate their distribution (perivascular activated microglial) and their 254
morphology (diffuse neuropil) (figure 7a). 255
No morphological changes were observed between gadodiamide and saline groups based on 256
the evaluation of immunofluorescent analysis of various cells populations in the deep cerebellar 257
nuclei area (figure 7b). 258
13
Discussion 259
The main goal of our study was to evaluate the long-term retention of a linear gadolinium based 260
contrast agent (GBCA; gadodiamide) within the cerebellum, and more specifically in the deep 261
cerebellar nuclei (DCN) after 1-year post-injections. We used both in vivo MR techniques (MRI 262
and 1H MRS) as well as quantitative chemical (LA-ICP-MS) and histological approaches. 263
In our experimental design, we used a rodent model receiving cumulative doses of a linear 264
GBCA (12 mmol of gadolinium per kilogram) which was previously demonstrated to lead to a 265
cerebellar gadolinium accumulation at 5 weeks post-injections and also at 1 year post-266
injections.19,20,25 Animal welfare was followed throughout our longitudinal MR study to 267
monitor any physiological changes induced by repeated injections of gadodiamide. 268
This clinical monitoring allowed us to notice the apparition of skin lesions among our animals 269
(3 out of 10 rats) between 1 and 5 weeks post-injections. Lohrke et al. have reported similar 270
observations of skin injuries among 4 out of 10 rats exposed to cumulative doses of 271
gadodiamide (50 mmol of gadolinium per kilogram; 4 times higher than in our protocol).26 In 272
their protocol, a high concentration of gadolinium was quantified in the skin after gadodiamide 273
exposure (1472 nmol/g) and not in the case of others GBCAs (gadopentetate dimeglumine, 274
gadobutrol and gadoteridol). Moreover, several studies have shown that there is an 275
accumulation of gadolinium in tissues such as bone and skin both in humans and rats with 276
normal renal function.27–29 277
Throughout our longitudinal study, we observed a T1 hypersignal in cerebellum on unenhanced 278
MR images at 1 and 5-weeks post-injections which was persistent until 13 months post-279
injections. This observation is in agreement with a previous report on the same rat model at 1-280
year post-injections, gadolinium concentration was quantified up to 2.45 nmol/g within 281
cerebellum.19 Our results obtained by LA-ICP-MS demonstrated that long-term gadolinium 282
14
retention occurred preferentially in DCN. This result is consistent with previous studies that 283
showed preferential gadolinium accumulation in this cerebellar structure at an earlier point (8 284
weeks post-injections).26 Given the high concentration of metals within DCN, the most likely 285
hypothesis would be that GBCA dechelated through a transmetalation of gadolinium to iron, 286
cupper or zinc. The limit of LA-ICP-MS method lies in its incapacity to identify whether 287
gadolinium is present under its chelated or dechelated form. 288
Despite gadolinium retention within DCN, we did not observed any morphological 289
modification of various cellular populations (neurons, astrocytes and microglia) at 1-year post-290
injections. Previous studies at earlier time points (8 and 20 weeks post-injections) are 291
concordant with our results.26,30 So far, histological studies only explored morphological 292
features. Furthers studies should focus on inflammatory markers to determine whether 293
gadolinium retention in DCN could induce a local inflammation. 294
Our main goal was to identify whether repeated injections of gadodiamide could lead to 295
metabolic alterations at short (1 and 6 weeks post-injections) and long-term (1-year post-296
injections) using 1H MRS. To date, few data are available for cerebellar metabolism following 297
repeated injections of linear GCBA. Our main observation was that long-term retention of 298
gadodiamide did not induce any detectable metabolic changes in the cerebellum after 1-year 299
post-injections. In accordance with literature, 18F-fluorodeoxyglucose positron emission 300
tomography (18F-FDG-PET) imaging of rats who had received a cumulative dose of 301
gadodiamide (13.2 mmol/kg over 7 weeks) did not reveal any abnormal glucose uptake in the 302
DCN, and thus even with chronic cerebral hypoperfusion (model of aging and 303
neurodegenerative diseases).31 However, a 18F-FDG-PET study had shown a lower maximum 304
standardized uptake value (SUVmax) in DCN of patients who had received repeated injections 305
of GBCAs (3 to 6 injections without distinction between macrocyclic and linear forms) 306

15
compared to those who had not received, which might indicate a decrease of glucose 307
metabolism.32 308
Nevertheless, it should be taken under consideration that 1H MRS may not be sensitive enough 309
to detect any subtle modifications of cerebellar metabolism. Indeed, one technical limit of 1H 310
MRS is its inability to detect molecules below mM range. It also appears that metabolites 311
involved in cellular homeostasis and excitatory neurotransmitter (glutamate) which are 312
detectable by 1H MRS may not be a target of dechelated gadolinium. Another methodological 313
limit of in vivo 1H MRS is that a technique sensitive only to molecules with a high degree of 314
rotational molecular motion.33 Moreover, it has been recently reported that gadolinium linked 315
preferentially to macromolecules (larger to 66.5 kDa in insoluble fraction).19 In the case of 316
gadolinium bounded to macromolecules such as proteins or lipids and especially within the 317
membrane bilayer, any alteration could not be detectable by 1H MRS. 318
In our study, we studied only one representative of linear GBCAs which is neutral in terms of 319
charge. Indeed, linear ionic GBCAs such as gadobenate dimeglumine and gadopentetate 320
dimeglumine induce also gadolinium retention in the cerebellum of patients.11,15,34 Furthermore, 321
linear ionic GBCA have been previously shown to decrease the area under the peak of choline 322
in breast and cerebral tumors.35–37 The peak of choline is widely used in diagnostic as an index 323
for cellular density of the tumor and the degree of tumor infiltration into brain tissue.38 It will 324
be highly interesting to investigate the impact of linear ionic GBCAs on 1H MRS spectra in 325
brain. In this purpose, further studies must be conducted to evaluate if they can alter choline 326
peak signal and thereby diagnostic. 327
To conclude, we demonstrate that cumulative administration of a linear and nonionic GBCA 328
(gadodiamide) induces a retention of gadolinium within DCN at 1-year post-injections and thus 329
without altering metabolic biomarkers of cellular homeostasis and an excitatory 330
neurotransmitter (glutamate). Although, histological analysis did not show any alterations of 331
16
DCN, further studies are required to elucidate the putative clinical long-term consequences of 332
gadolinium retention (e.g. inflammatory markers) as well as the mechanism underlying such a 333
retention. 334
17
References 335
1. Hao D, Ai T, Goerner F, et al. MRI contrast agents: Basic chemistry and safety. J. Magn. Reson. 336 Imaging. 2012;36(5):1060–1071. 337
2. Kanal E. Gadolinium based contrast agents (GBCA): Safety overview after 3 decades of clinical 338 experience. Magn. Reson. Imaging. 2016;34(10):1341–1345. 339
3. McDonald RJ, Levine D, Weinreb J, et al. Gadolinium Retention: A Research Roadmap from the 340 2018 NIH/ACR/RSNA Workshop on Gadolinium Chelates. Radiology. 2018;289(2):517–534. 341
4. Sherry AD, Caravan P, Lenkinski RE. Primer on gadolinium chemistry. J. Magn. Reson. Imaging. 342 2009;30(6):1240–1248. 343
5. Tedeschi E, Caranci F, Giordano F, et al. Gadolinium retention in the body: what we know and what 344 we can do. Radiol. Med. (Torino). 2017;122(8):589–600. 345
6. Aime S, Caravan P. Biodistribution of gadolinium-based contrast agents, including gadolinium 346 deposition. J. Magn. Reson. Imaging. 2009;30(6):1259–1267. 347
7. Errante Y, Cirimele V, Mallio CA, et al. Progressive Increase of T1 Signal Intensity of the Dentate 348 Nucleus on Unenhanced Magnetic Resonance Images Is Associated With Cumulative Doses of 349 Intravenously Administered Gadodiamide in Patients With Normal Renal Function, Suggesting 350 Dechelation: Invest. Radiol. 2014;49(10):685–690. 351
8. Quattrocchi CC, Mallio CA, Errante Y, et al. Gadodiamide and Dentate Nucleus T1 Hyperintensity 352 in Patients With Meningioma Evaluated by Multiple Follow-Up Contrast-Enhanced Magnetic 353 Resonance Examinations With No Systemic Interval Therapy: Invest. Radiol. 2015;50(7):470–472. 354
9. Kanda T, Ishii K, Kawaguchi H, et al. High Signal Intensity in the Dentate Nucleus and Globus 355 Pallidus on Unenhanced T1-weighted MR Images: Relationship with Increasing Cumulative Dose of a 356 Gadolinium-based Contrast Material. Radiology. 2014;270(3):834–841. 357
10. Kanda T, Osawa M, Oba H, et al. High Signal Intensity in Dentate Nucleus on Unenhanced T1-358 weighted MR Images: Association with Linear versus Macrocyclic Gadolinium Chelate Administration. 359 Radiology. 2015;275(3):803–809. 360
11. Ramalho J, Castillo M, AlObaidy M, et al. High Signal Intensity in Globus Pallidus and Dentate 361 Nucleus on Unenhanced T1-weighted MR Images: Evaluation of Two Linear Gadolinium-based 362 Contrast Agents. Radiology. 2015;276(3):836–844. 363
12. Cao Y, Huang DQ, Shih G, et al. Signal Change in the Dentate Nucleus on T1-Weighted MR Images 364 After Multiple Administrations of Gadopentetate Dimeglumine Versus Gadobutrol. Am. J. Roentgenol. 365 2016;206(2):414–419. 366
13. Yoo R-E, Sohn C-H, Kang KM, et al. Evaluation of Gadolinium Retention After Serial 367 Administrations of a Macrocyclic Gadolinium-Based Contrast Agent (Gadobutrol): A Single-Institution 368 Experience With 189 Patients. Invest. Radiol. 2017:1. 369
14. Bae S, Lee H-J, Han K, et al. Gadolinium deposition in the brain: association with various GBCAs 370 using a generalized additive model. Eur. Radiol. 2017;27(8):3353–3361. 371
15. Radbruch A, Weberling LD, Kieslich PJ, et al. Gadolinium Retention in the Dentate Nucleus and 372 Globus Pallidus Is Dependent on the Class of Contrast Agent. Radiology. 2015;275(3):783–791. 373
18
16. McDonald RJ, McDonald JS, Kallmes DF, et al. Intracranial Gadolinium Deposition after Contrast-374 enhanced MR Imaging. Radiology. 2015;275(3):772–782. 375
17. Kanda T, Fukusato T, Matsuda M, et al. Gadolinium-based Contrast Agent Accumulates in the Brain 376 Even in Subjects without Severe Renal Dysfunction: Evaluation of Autopsy Brain Specimens with 377 Inductively Coupled Plasma Mass Spectroscopy. Radiology. 2015;276(1):228–232. 378
18. Robert P, Frenzel T, Factor C, et al. Methodological Aspects for Preclinical Evaluation of 379 Gadolinium Presence in Brain Tissue: Critical Appraisal and Suggestions for Harmonization—A Joint 380 Initiative. Invest. Radiol. 2018:1. 381
19. Robert P, Fingerhut S, Factor C, et al. One-year Retention of Gadolinium in the Brain: Comparison 382 of Gadodiamide and Gadoterate Meglumine in a Rodent Model. Radiology. 2018:172746. 383
20. Robert P, Lehericy S, Grand S, et al. T1-Weighted Hypersignal in the Deep Cerebellar Nuclei After 384 Repeated Administrations of Gadolinium-Based Contrast Agents in Healthy Rats: Difference Between 385 Linear and Macrocyclic Agents. Invest. Radiol. 2015;50(8):473–480. 386
21. FDA. FDA. Guidance for Industry: Estimating the Maximum Safe Starting Dose in Initial Clinical 387 Trials for Therapeutics in Adult Healthy Volunteers. US Department of Health and Human Services 388 Food and Drug Administration Center for Drug Evaluation and Research (CDER). 2005. Available at: 389 https://www.fda.gov/downloads/drugs/guidances/ucm078932.pdf. Accessed February 5, 2018. 390
22. Ratiney H, Sdika M, Coenradie Y, et al. Time-domain semi-parametric estimation based on a 391 metabolite basis set. NMR Biomed. 2005;18(1):1–13. 392
23. Soher BJ, Young K, Bernstein A, et al. GAVA: Spectral simulation for in vivo MRS applications. 393 J. Magn. Reson. 2007;185(2):291–299. 394
24. Paxinos G, Watson C. The Rat Brain in Stereotaxic Coordinates. 6th edition. London, England: 395 Elsevier Academic Press 396
25. Robert P, Violas X, Grand S, et al. Linear Gadolinium-Based Contrast Agents Are Associated With 397 Brain Gadolinium Retention in Healthy Rats: Invest. Radiol. 2016;51(2):73–82. 398
26. Lohrke J, Frisk A-L, Frenzel T, et al. Histology and Gadolinium Distribution in the Rodent Brain 399 After the Administration of Cumulative High Doses of Linear and Macrocyclic Gadolinium-Based 400 Contrast Agents: Invest. Radiol. 2017;52(6):324–333. 401
27. Tweedle MF, Wedeking P, Kumar K. Biodistribution of radiolabeled, formulated gadopentetate, 402 gadoteridol, gadoterate, and gadodiamide in mice and rats. Invest. Radiol. 1995;30(6):372–380. 403
28. Pietsch H, Lengsfeld P, Jost G, et al. Long-term retention of gadolinium in the skin of rodents 404 following the administration of gadolinium-based contrast agents. Eur. Radiol. 2009;19(6):1417–1424. 405
29. White GW, Gibby WA, Tweedle MF. Comparison of Gd(DTPA-BMA) (Omniscan) Versus Gd(HP-406 DO3A) (ProHance) Relative to Gadolinium Retention in Human Bone Tissue by Inductively Coupled 407 Plasma Mass Spectroscopy: Invest. Radiol. 2006;41(3):272–278. 408
30. Smith APL, Marino M, Roberts J, et al. Clearance of Gadolinium from the Brain with No Pathologic 409 Effect after Repeated Administration of Gadodiamide in Healthy Rats: An Analytical and Histologic 410 Study. Radiology. 2017;282(3):743–751. 411
31. Arena F, Bardini P, Blasi F, et al. Gadolinium presence, MRI hyperintensities, and glucose uptake 412 in the hypoperfused rat brain after repeated administrations of gadodiamide. Neuroradiology. 413 2019;61(2):163–173. 414

19
32. Bauer K, Lathrum A, Raslan O, et al. Do Gadolinium-Based Contrast Agents Affect 18 F-FDG 415 PET/CT Uptake in the Dentate Nucleus and the Globus Pallidus? A Pilot Study. J. Nucl. Med. Technol. 416 2017;45(1):30–33. 417
33. Williams E, Hamilton JA, Jain MK, et al. Natural Abundance Carbon-13 Nuclear Magnetic 418 Resonance Spectra of the Canine Sciatic Nerve. Science. 1973;181(4102):869–871. 419
34. Schlemm L, Chien C, Bellmann-Strobl J, et al. Gadopentetate but not gadobutrol accumulates in the 420 dentate nucleus of multiple sclerosis patients. Mult. Scler. J. 2017;23(7):963–972. 421
35. Lenkinski RE, Wang X, Elian M, et al. Interaction of gadolinium-based MR contrast agents with 422 choline: Implications for MR spectroscopy (MRS) of the breast. Magn. Reson. Med. 2009;61(6):1286–423 1292. 424
36. Baltzer PAT, Gussew A, Dietzel M, et al. Effect of contrast agent on the results of in vivo1H MRS 425 of breast tumors - is it clinically significant?: EFFECT OF CONTRAST AGENT ON 1H MRS OF 426 BREAST TUMORS. NMR Biomed. 2012;25(1):67–74. 427
37. Murphy PS, Dzik-Jurasz ASK, Leach MO, et al. The effect of Gd-DTPA on T1-weighted choline 428 signal in human brain tumours. Magn. Reson. Imaging. 2002;20(1):127–130. 429
38. Horská A, Barker PB. Imaging of Brain Tumors: MR Spectroscopy and Metabolic Imaging. 430 Neuroimaging Clin. N. Am. 2010;20(3):293–310. 431
432

20
Tables 433
Table 1: Primary antibodies and corresponding antibodies for immunostaining protocol 434
Primary antibody Clone Secondary antibody
Mouse anti-CD68 IgG1 ED1 Anti-mouse IgG1 A488
Rabbit anti-SYP YE269 Anti-rabbit IgG A488
Rabbit anti-GFAP polyclonal Anti-rabbit IgG A488
435
Table 2: Steps for immunostaining protocol 436
Step Reagent Condition
Fixation of slides Formalin 4% 10 min at room temperature
Rinsing PBS1x 3 x 5 min
Serum blocking BSA 3% /
Goat serum 10% in PBS1x 1h at room temperature
Primary antibody incubation
Anti-GFAP 1/1000e
Anti-CD68 1/200e
Anti-SYP 1/600 e
1h at room temperature
1h at room temperature
1h at room temperature
Rinsing PBS 1x 3 x 5 min
Secondary antibody Anti-IgG A488 1/500e 1h at room temperature
Rinsing PBS1x 3 x 5 min
437
438

21
Figure legends 439
Figure 1: MRI, 1H MRS and injection scheme. MR experiments are performed at M0 (Week 440
6, one week after the last injection; 0 month of washout period), M1 (Week 11, six weeks after 441
the last injection; 1 month of washout period) and M13 (Week 59, 53 weeks after the last 442
injection; 13 months of washout period). After MRI, animals are sacrificed and samples are 443
used for histological and LA-ICP-MS analysis. 444
Figure 2: (A) Voxel position in the left dentate cerebellar nuclei (DCN) on T1-weighed 445
images; (B) Typical MRS spectra obtained from gadodiamide rat at 1-week post-injection. 446
The peaks assignments are as follows: macromolecules (MM); creatine and phosphocreatine 447
(Cr+PCr); N-Acetyl Aspartate (NAA); choline, phosphocholine and glycerophosphocholine 448
(tCho); glutamate (Glu); glutamate+glutamine (Glx); taurine (Tau); myo-Inositol (mI). 449
Figure 3: T1-weighted Ig-FLASH images at 7T of saline and gadodiamide rats at M0, M1 450
and M13. MR images of Rat n°10 (saline group) and Rat n°18 (gadodiamide group) are 451
qualitatively followed at the three time points. 452
Figure 4: Delay Effect - Quantitative analysis of enhancement at M0, M1 and M13. 453
Signals ratio DCN/Brainstem were measured for saline and gadodiamide groups (values are 454
mean ± SEM). ***p<0.001; **p<0.01 and *p<0.05 455
Figure 5: MR Spectroscopy quantitation obtained with QUEST algorithm at delay M0, 456
M1 and M13. Measured metabolites concentration are as follows: N-Acetyl Aspartate (NAA); 457
creatine and phosphocreatine (Cr+PCr); choline, phosphocholine and glycerophosphocholine 458
(tCho); taurine (Tau); myo-Inositol (mI) and glutamate (Glu). Values are mean ± SEM. 459
460
22
Figure 6: LA-ICP-MS analysis of rat brains after repeated injections of gadodiamide (left) 461
and saline solution (right). Phase contrast microscopic images (a,b) of the analyzed thin 462
sections with quantified distribution of Gd (c,d), Fe (g,h), Cu (i,j) and Zn (k,l) as well as the 463
qualitative distribution of P (e,f). 464
Figure 7: (a) Representative images of GFAP and CD68 immunostaining within deep 465
cerebellar nuclei of gadodiamide rat; (b) Semi-quantitative immunofluorescence analysis 466
of GFAP, synaptophysin (SYP) and CD68 signals. Scale were evaluated from 0 (no signal) 467
to 3 (high density of signal) within the deep cerebellar nuclei area. Values are mean ± SEM. 468


![Comparative Metabolism and Retention of Iodine …...[CANCER RESEARCH 56, 2123-2129. May 1, 1996] Comparative Metabolism and Retention of Iodine-125, Yttrium-90, and Indium-Ill Radioimmunoconjugates](https://static.fdocuments.us/doc/165x107/5ea3065eee8a1f61775c203b/comparative-metabolism-and-retention-of-iodine-cancer-research-56-2123-2129.jpg)