Effect of Local Environment and Stellar Mass on Galaxy ... · Effect of Local Environment and...
21
Effect of Local Environment and Stellar Mass on Galaxy Quenching and Morphology at 0.5 < z < 2.0 * Lalitwadee Kawinwanichakij 1,2,16 , Casey Papovich 1,2 , Ryan F. Quadri 1,2,17 , Karl Glazebrook 3 , Glenn G. Kacprzak 3 , Rebecca J. Allen 3 , Eric F. Bell 4 , Darren J. Croton 3 , Avishai Dekel 5 , Henry C. Ferguson 6 , Ben Forrest 1,2 , Norman A. Grogin 6 , Yicheng Guo 7 , Dale D. Kocevski 8 , Anton M. Koekemoer 6 , Ivo Labbé 9 , Ray A. Lucas 6 , Themiya Nanayakkara 3,9 , Lee R. Spitler 10,11,12 , Caroline M. S. Straatman 13 , Kim-Vy H. Tran 1,2 , Adam Tomczak 14 , and Pieter van Dokkum 15 1 Department of Physics and Astronomy, Texas A&M University, College Station, TX 77843-4242, USA; [email protected] 2 George P. and Cynthia Woods Mitchell Institute for Fundamental Physics and Astronomy, Texas A&M University, College Station, TX 77843-4242, USA 3 Centre for Astrophysics and Supercomputing, Swinburne University, Hawthorn, VIC 3122, Australia 4 Department of Astronomy, University of Michigan, 1085 South University Ave., Ann Arbor, MI 48109-1107, USA 5 Racah Institute of Physics, The Hebrew University, Jerusalem 91904, Israel 6 Space Telescope Science Institute, 3700 San Martin Drive, Baltimore, MD 21218, USA 7 UCO/Lick Observatory, Department of Astronomy and Astrophysics, University of California, Santa Cruz, CA, USA 8 Department of Physics and Astronomy, Colby College, Waterville, ME 04901, USA 9 Leiden Observatory, Leiden University, P.O. Box 9513, 2300 RA Leiden, The Netherlands 10 Australian Astronomical Observatory, P.O. Box 915, North Ryde, NSW 1670, Australia 11 Research Centre for Astronomy, Astrophysics & Astrophotonics, Macquarie University, Sydney, NSW 2109, Australia 12 Department of Physics & Astronomy, Macquarie University, Sydney, NSW 2109, Australia 13 Max-Planck Institut für Astronomie, Königstuhl 17, D-69117, Heidelberg, Germany 14 Department of Physics, UC Davis, Davis, CA 95616, USA 15 Astronomy Department, Yale University, New Haven, CT 06511, USA Received 2017 June 11; revised 2017 August 26; accepted 2017 September 8; published 2017 October 3 Abstract We study galactic star formation activity as a function of environment and stellar mass over 0.5<z<2.0 using the FourStar Galaxy Evolution (ZFOURGE) survey. We estimate the galaxy environment using a Bayesian- motivated measure of the distance to the third nearest neighbor for galaxies to the stellar mass completeness of our survey, > ( ) ( ) MM log 9 9.5 at z=1.3 (2.0). This method, when applied to a mock catalog with the photometric- redshift precision ( s + ( ) z 1 0.02 z ) of ZFOURGE, accurately recovers galaxies in low- and high-density environments. We quantify the environmental quenching efficiency and show that at > z 0.5, it depends on galaxy stellar mass, demonstrating that the effects of quenching related to (stellar) mass and environment are not separable. In high-density environments, the mass and environmental quenching efficiencies are comparable for massive galaxies ( ( ) MM log 10.5) at all redshifts. For lower-mass galaxies ( ( )) MM log 10), the environmental quenching efficiency is very low at z 1.5, but increases rapidly with decreasing redshift. Environmental quenching can account for nearly all quiescent lower-mass galaxies ( ~ ( ) – MM log 9 10), which appear primarily at z 1.0. The morphologies of lower-mass quiescent galaxies are inconsistent with those expected of recently quenched star-forming galaxies. Some environmental process must transform the morphologies on similar timescales as the environmental quenching itself. The evolution of the environmental quenching favors models that combine gas starvation (as galaxies become satellites) with gas exhaustion through star formation and outflows (“overconsumption”), and additional processes such as galaxy interactions, tidal stripping, and disk fading to account for the morphological differences between the quiescent and star-forming galaxy populations. Key words: galaxies: evolution – galaxies: groups: general – galaxies: high-redshift – galaxies: star formation 1. Introduction The population of galaxies can be broadly classified into two distinct types: quiescent galaxies with relatively red colors, spheroid-dominated morphologies, and little to no ongoing star formation activity (with star formation rates, SFRs, much less than their past averages); and star-forming galaxies with relatively blue colors, disk-dominated morphologies, and SFRs comparable to (or above) their past averages (e.g., Strateva et al. 2001; Kauffmann et al. 2003; Baldry et al. 2004, 2006; Bell 2008; van Dokkum et al. 2011; Schawinski et al. 2014). In the local universe, it is well-known that these types of galaxies are related to the density of galaxies (the galaxy environment). Quiescent, spheroidal galaxies are preferentially found in dense environments rich with galaxies (e.g., Oemler 1974; Davis & Geller 1976; Dressler 1980; Balogh et al. 2004; Hogg et al. 2004; Kauffmann et al. 2004; Blanton & Moustakas 2009; Peng et al. 2010; Woo et al. 2013). How this trend with environment manifests and evolves with redshift is one of the outstanding questions in galaxy evolution. Multiple studies have found a correlation between environ- mental density and the quenching of star formation at ~ z 1 (e.g., Cooper et al. 2007, 2010; Cucciati et al. 2010; Kovač et al. 2010, 2014; Muzzin et al. 2012; Allen et al. 2016; Balogh et al. 2016; Morishita et al. 2017; Guo et al. 2017). In addition, there is some observational evidence that the environment (or The Astrophysical Journal, 847:134 (21pp), 2017 October 1 https://doi.org/10.3847/1538-4357/aa8b75 © 2017. The American Astronomical Society. All rights reserved. * This paper includes data gathered with the 6.5 m Magellan Telescopes located at Las Campanas Observatory, Chile. 16 LSSTC Data Science Fellow. 17 Mitchell Astronomy Fellow. 1
Transcript of Effect of Local Environment and Stellar Mass on Galaxy ... · Effect of Local Environment and...
Effect of Local Environment and Stellar Mass on Galaxy Quenchingand Morphology at 0.5 < z < 2.0*
Lalitwadee Kawinwanichakij1,2,16 , Casey Papovich1,2 , Ryan F. Quadri1,2,17 ,Karl Glazebrook3 , Glenn G. Kacprzak3, Rebecca J. Allen3 , Eric F. Bell4 , Darren J. Croton3, Avishai Dekel5 ,
Henry C. Ferguson6 , Ben Forrest1,2 , Norman A. Grogin6 , Yicheng Guo7 , Dale D. Kocevski8, Anton M. Koekemoer6 ,Ivo Labbé9, Ray A. Lucas6 , Themiya Nanayakkara3,9 , Lee R. Spitler10,11,12 , Caroline M. S. Straatman13 ,
Kim-Vy H. Tran1,2 , Adam Tomczak14 , and Pieter van Dokkum15
1 Department of Physics and Astronomy, Texas A&M University, College Station, TX 77843-4242, USA; [email protected] George P. and Cynthia Woods Mitchell Institute for Fundamental Physics and Astronomy, Texas A&M University, College Station, TX 77843-4242, USA
3 Centre for Astrophysics and Supercomputing, Swinburne University, Hawthorn, VIC 3122, Australia4 Department of Astronomy, University of Michigan, 1085 South University Ave., Ann Arbor, MI 48109-1107, USA
5 Racah Institute of Physics, The Hebrew University, Jerusalem 91904, Israel6 Space Telescope Science Institute, 3700 San Martin Drive, Baltimore, MD 21218, USA
7 UCO/Lick Observatory, Department of Astronomy and Astrophysics, University of California, Santa Cruz, CA, USA8 Department of Physics and Astronomy, Colby College, Waterville, ME 04901, USA
9 Leiden Observatory, Leiden University, P.O. Box 9513, 2300 RA Leiden, The Netherlands10 Australian Astronomical Observatory, P.O. Box 915, North Ryde, NSW 1670, Australia
11 Research Centre for Astronomy, Astrophysics & Astrophotonics, Macquarie University, Sydney, NSW 2109, Australia12 Department of Physics & Astronomy, Macquarie University, Sydney, NSW 2109, Australia
13Max-Planck Institut für Astronomie, Königstuhl 17, D-69117, Heidelberg, Germany14 Department of Physics, UC Davis, Davis, CA 95616, USA
15 Astronomy Department, Yale University, New Haven, CT 06511, USAReceived 2017 June 11; revised 2017 August 26; accepted 2017 September 8; published 2017 October 3
Abstract
We study galactic star formation activity as a function of environment and stellar mass over 0.5<z<2.0 usingthe FourStar Galaxy Evolution (ZFOURGE) survey. We estimate the galaxy environment using a Bayesian-motivated measure of the distance to the third nearest neighbor for galaxies to the stellar mass completeness of oursurvey, >( ) ( )M Mlog 9 9.5 at z=1.3 (2.0). This method, when applied to a mock catalog with the photometric-redshift precision ( s +( )z1 0.02z ) of ZFOURGE, accurately recovers galaxies in low- and high-densityenvironments. We quantify the environmental quenching efficiency and show that at >z 0.5, it depends on galaxystellar mass, demonstrating that the effects of quenching related to (stellar) mass and environment are notseparable. In high-density environments, the mass and environmental quenching efficiencies are comparable formassive galaxies ( ( )M Mlog 10.5) at all redshifts. For lower-mass galaxies ( ( ) )M Mlog 10), theenvironmental quenching efficiency is very low at z 1.5, but increases rapidly with decreasing redshift.Environmental quenching can account for nearly all quiescent lower-mass galaxies ( ~( ) –M Mlog 9 10), whichappear primarily at z 1.0. The morphologies of lower-mass quiescent galaxies are inconsistent with thoseexpected of recently quenched star-forming galaxies. Some environmental process must transform themorphologies on similar timescales as the environmental quenching itself. The evolution of the environmentalquenching favors models that combine gas starvation (as galaxies become satellites) with gas exhaustion throughstar formation and outflows (“overconsumption”), and additional processes such as galaxy interactions, tidalstripping, and disk fading to account for the morphological differences between the quiescent and star-forminggalaxy populations.
Key words: galaxies: evolution – galaxies: groups: general – galaxies: high-redshift – galaxies: star formation
1. Introduction
The population of galaxies can be broadly classified into twodistinct types: quiescent galaxies with relatively red colors,spheroid-dominated morphologies, and little to no ongoing starformation activity (with star formation rates, SFRs, much lessthan their past averages); and star-forming galaxies withrelatively blue colors, disk-dominated morphologies, and SFRscomparable to (or above) their past averages (e.g., Stratevaet al. 2001; Kauffmann et al. 2003; Baldry et al. 2004, 2006;Bell 2008; van Dokkum et al. 2011; Schawinski et al. 2014). In
the local universe, it is well-known that these types of galaxiesare related to the density of galaxies (the galaxy environment).Quiescent, spheroidal galaxies are preferentially found in denseenvironments rich with galaxies (e.g., Oemler 1974; Davis &Geller 1976; Dressler 1980; Balogh et al. 2004; Hogg et al.2004; Kauffmann et al. 2004; Blanton & Moustakas 2009;Peng et al. 2010; Woo et al. 2013).How this trend with environment manifests and evolves with
redshift is one of the outstanding questions in galaxy evolution.Multiple studies have found a correlation between environ-mental density and the quenching of star formation at ~z 1(e.g., Cooper et al. 2007, 2010; Cucciati et al. 2010; Kovačet al. 2010, 2014; Muzzin et al. 2012; Allen et al. 2016; Baloghet al. 2016; Morishita et al. 2017; Guo et al. 2017). In addition,there is some observational evidence that the environment (or
The Astrophysical Journal, 847:134 (21pp), 2017 October 1 https://doi.org/10.3847/1538-4357/aa8b75© 2017. The American Astronomical Society. All rights reserved.
* This paper includes data gathered with the 6.5 m Magellan Telescopeslocated at Las Campanas Observatory, Chile.16 LSSTC Data Science Fellow.17 Mitchell Astronomy Fellow.
1
by proxy, the density of galaxies) correlates with other galaxyproperties out to ~z 2 (e.g., Cucciati et al. 2006; Tran et al.2010; Chuter et al. 2011; Papovich et al. 2012; Quadri et al.2012; Fossati et al. 2017; Nantais et al. 2016), and possibly toat least ~z 3 (Darvish et al. 2016). Developing a furtherunderstanding of the physical processes involved in thequenching of star formation clearly requires better observa-tional measurements and also requires disentangling theobserved correlations among SFR, galaxy structure, andenvironmental density out to these higher redshifts.
In the low-redshift universe ( z 0.1), it has been shown thatthe effect of the respective relationships between stellar massand environment on quenching are largely separable (e.g.,Baldry et al. 2006; van den Bosch et al. 2008; Peng et al. 2010;Kovač et al. 2014), implying that there are two distinctquenching processes at work: one that correlates with stellarmass (independent of environment) and one that correlates withgalaxy environment (independent of stellar mass). Peng et al.(2010) show the separability of the effects of stellar mass andenvironment on the quiescent fraction of galaxies in SDSS (at<z 0.1) and zCOSMOS ( < <z0.3 0.6). Similarly, Kovač
et al. (2014) used mass-matched samples of central and satellitegalaxies to show that the quiescent fraction of centrals isprimarily related to stellar mass and is almost independent ofoverdensity (environment), indicating that they are mainlyquenched by a process related to stellar mass, at least to thestellar mass limit of their data ( >M Mlog 9.8 at z=0.4).On the other hand, an additional environmental quenchingprocess is required to explain the observed quiescent fraction ofsatellite galaxies, which increases with galaxy overdensity.
These separable effects of stellar mass and environment ongalaxy properties have been observed out to ~z 3 (e.g., Quadriet al. 2012; Muzzin et al. 2012; Lee et al. 2015; Darvishet al. 2016), but have been limited to more massive galaxies,
M Mlog 10, due to the depth of the surveys. To this masslimit, these studies also found no evidence that the properties ofstar-forming galaxies strongly depend on environment: there isno significant change in the median SFR and specific SFR (forstar-forming galaxies) with environment at fixed stellar mass,suggesting that the independence of the SFR–mass sequencefrom the environment has been in place at ~z 3 (but see Jianet al. 2017). The obvious qualifier is that it has only beenpossible to study the relatively higher-mass galaxies, and it isunknown if these results extend to lower-mass galaxies.
Physical explanations for the cessation of star formation ingalaxies can also be broadly classified into mechanisms that arerelated to either mass (halo mass, supermassive black holemass, or stellar mass) or the environment. A galaxy’s halo massprovides a natural quenching mechanism related to mass (e.g.,Rees & Ostriker 1977; White & Rees 1978; Gabor et al. 2011;Gabor & Davé 2015). It is generally argued that the intrahalogas in halos above ~ M1012 exists at temperatures highenough (Birnboim & Dekel 2003; Kereš et al. 2005) to shock-heat infalling gas from the intergalactic medium at the virialradius, preventing the fueling of star formation in the galaxies(Cattaneo et al. 2006; Dekel & Birnboim 2006; Birnboimet al. 2007). Another quenching mechanism that may be relatedto galaxy mass is the feedback from an active galactic nucleus(AGN; Granato et al. 2004; Springel et al. 2005; Bower et al.2006; Cattaneo et al. 2006; Croton et al. 2006; Somerville et al.2008; Knobel et al. 2015; Terrazas et al. 2016). In contrast, thesuppression of star formation in galaxies in low-mass halos can
be driven by energetic feedback from supernova explosionsand stellar winds (e.g., Larson 1974; Dekel & Silk 1986).There are also physical processes that operate preferentially
in dense environments. One of them is the rapid stripping ofcold gas via ram pressure as the galaxy passes through a hotgaseous medium, causing abrupt quenching (Gunn &Gott 1972; Abadi et al. 1999). In contrast, if only the hot gasin the outer parts of galaxies is stripped, the galaxy maycontinue forming new stars until all fuel is exhausted.Consequently, this “strangulation” (also called “starvation”)results in the gradual decline of the star formation rate (Larsonet al. 1980; Balogh et al. 1997). Note, however, that both ofthese gas-stripping processes will primarily modify the colorand SFR of a galaxy without transforming the galaxymorphology (e.g., Weinmann et al. 2006; van den Boschet al. 2008).18 Satellite galaxies orbiting within dark matterhalos may also be subject to tidal stripping as they experiencetidal forces due to the central galaxy, other satellite galaxies,and the potential of the halo itself (e.g., Read et al. 2006).Higher-density environments can also lead to enhanced mergerrates, which may also affect quenching (Peng et al. 2010).Recently, McGee et al. (2014) pointed out that the gas outflowsthat are ubiquitous among star-forming galaxies may also affectthe quenching of satellites. According to this scenario, whichthey refer to as “overconsumption,” vigorous star formation inrecently accreted satellites may drive outflows that will exhaustthe gas supply in the absence of cosmological accretion. Theseauthors also demonstrate that the timescale for satellitequenching due to overconsumption can be much shorter thanthe time for the gas to be stripped through dynamical processes.Another clue regarding environmental quenching mechan-
isms is the observed correlation between the properties ofsatellites (i.e., specific SFR, colors, and gas fraction) and theirmore massive central galaxies. The correlation is such that thesatellites of quiescent centrals are more likely to be quenchedthan the satellites of star-forming centrals, even at fixed stellarmass. This phenomenon was originally presented by Weinmannet al. (2006) and is referred to as “galactic conformity.” There isgrowing observational evidence of galactic conformity in boththe local universe (Kauffmann et al. 2010, 2013; Phillipset al. 2014, 2015; Knobel et al. 2015) and out to ~z 2, eventhough the signal is weaker at high redshift (Hartley et al. 2015;Hatfield & Jarvis 2016; Kawinwanichakij et al. 2016). Broadlyspeaking, the different environmental processes discussed hereare expected to act with different strengths and over differenttimescales as a function of galaxy stellar and halo masses.Therefore, measuring how (stellar) mass and environmentalquenching evolve with stellar mass and redshift providesconstraints on the quenching processes, particularly at higherredshift ( z 1), when galaxy-specific SFRs are higher.In this paper, we primarily focus on how the quenching of
galaxies correlates with galaxy stellar mass and environment,and how these evolve with redshift. However, we do notattempt to separate our sample into central or satellite galaxies.Rather, we will denote the environmental density, based on thelocal overdensity of galaxies compared to the mean, as ( d+1 ).We will make use of the deep near-IR imaging and high
18 Although this is true in the morphology as traced by stellar mass, for themorphology as traced by light in any passband, even in near-IR, the higherluminosity of young stars will make the star formation disks more prominentand will lead to significant changes in the visual appearance of the morphologyas the star formation fades (e.g., Fang et al. 2013). We return to this point about“disk fading” in Section 5.
2
The Astrophysical Journal, 847:134 (21pp), 2017 October 1 Kawinwanichakij et al.
photometric-redshift accuracy from the FourStar Galaxy Evolution(ZFOURGE) survey, which allow us to compute accurateestimates of the environment for galaxies to fainter magnitudesand with higher completeness than is possible with either ground-based spectroscopy ( <K 24s ABmag; Nanayakkara et al. 2016,for emission-line galaxies) or space-based spectroscopy ( <JH14024 ABmag; Fossati et al. 2017). In contrast, the ZFOURGEdata provide precise photometric redshifts for galaxies to Ks
–25.5 26 ABmag, substantially fainter than what is possible withspectroscopy. As a result, the ZFOURGE data allow us to studythe environmental impact of quenching for galaxies with lowstellar mass out to high redshift ( ( )M Mlog 9.5 at z=2).
Because we quantify quenching as a function of both stellarmass and local environmental density, throughout this paper werefer to “mass quenching” and “environmental quenching”processes. This does not imply that stellar mass andenvironmental density directly cause quenching. For instance,black hole mass or central stellar mass density may have a moredirect relationship with quenching than stellar mass (Woo et al.2015; Terrazas et al. 2016), but because these quantitiescorrelate with stellar mass, they will result in a measurable“mass quenching” effect. Similarly, the estimator of environ-mental density that we use may only be correlated with, ratherthan directly measure, the aspects of a galaxy’s location orenvironment that actually cause quenching.
The outline of this paper is as follows. In Section 2, wedescribe the ZFOURGE catalog and our galaxy sampleselection criteria. In Section 3, we describe the method forestimating the environmental densities using photometricredshifts, and we validate our method using simulated catalogsfrom a semi-analytic model (described further in Appendix A).In Section 4, we discuss how the fraction of quiescent galaxiesvaries with stellar mass and environment, and we computefrom these the quenching efficiency for both variables out toz=2. In Section 5, we discuss the relative importance ofenvironmental processes in the build-up of red galaxies indense environments. We investigate whether the cause ofenvironmental quenching is indicated in the morphologicaldistribution of lower-mass quiescent galaxies. In addition, weconsider how our results constrain the timescales of environ-mental quenching and therefore the physical processesresponsible. In Section 6, we present our summary. Through-out, we adopt the following cosmological parameters whereappropriate: = - -H 70 km s Mpc0
1 1,W = 0.3m , andW =L 0.7.All magnitudes are expressed in the AB system.
2. Data and Sample Selection
We select galaxies at < <z0.5 2.0 from the ZFOURGEsurvey (Straatman et al. 2016). The survey is composed of three¢ ´ ¢11 11 fields with coverage in the regions of CDFS (Giacconi
et al. 2002), COSMOS (Scoville et al. 2007), and UDS (Lawrenceet al. 2007) that overlap with the Cosmic Assembly Near-IR DeepExtragalactic Legacy Survey (CANDELS; Grogin et al. 2011;Koekemoer et al. 2011), which also provide Hubble SpaceTelescope (HST), high-angular resolution imaging for 0.6–1.6μm(see, e.g., van der Wel et al. 2012). The ZFOURGE medium-bandnear-IR imaging reaches depths of ∼26 AB mag in J J J, ,1 2 3 and∼25 AB mag in H H,s l and includes the vast amount of deep,multiwavelength imaging available in these legacy fields. TheZFOURGE catalogs are complete for galaxies to -K 25.5s26.0 AB mag (see Straatman et al. 2016).
2.1. Photometric Redshifts
The ZFOURGE catalogs include photometric redshifts andrest-frame colors calculated using EAZY (Brammer et al. 2008)from the 0.3 to 8 μm photometry for each galaxy. Of importhere is that ZFOURGE uses templates and photometriczeropoints that are iteratively adjusted during the fitting processto improve the accuracy of the photometric redshifts.The precision of photometric redshifts has the ability to
potentially introduce spurious signals or wash out structure(Cooper et al. 2005; Quadri et al. 2012). However, our estimatesof the quality of the ZFOURGE photometric redshifts showthem to be very accurate, and as we demonstrate below,sufficient to recover galaxy environmental densities. Bycomparing photometric redshifts of galaxy pairs and to spectro-scopic subsamples, Straatman et al. (2016) show that the typicalphotometric-redshift uncertainties are s + =( ) –z1 0.01 0.02zto the Ks-band magnitude limit for galaxies between z=0.5 andz=2.0, with negligible dependence on galaxy color, but there isdependence on magnitude and redshift (Straatman et al. 2016,see their Section5.4). Quantitatively, at <K 25.0s AB mag, thephotometric-redshift uncertainties of quiescent galaxies at z=2are better than those of star-forming galaxies at the same redshift—only about 5%. Other studies with ZFOURGE have shownthat these redshifts are sufficient to identify protoclusters out to~z 2 (e.g., Spitler et al. 2012; Yuan et al. 2014; Forrest
et al. 2017).In addition to the photometric redshifts, we also make use of
stellar masses for galaxies provided in the ZFOURGE catalogs.The stellar masses were derived by fitting stellar populationmodels to the photometry using FAST (Kriek et al. 2009),assuming exponentially declining star formation histories, solarmetallicity, and a Chabrier (2003) initial mass function.
2.2. Stellar Mass Completeness
Because we are concerned with the galaxy quiescentfractions, it is important that we use a data set that is completein stellar mass for both star-forming and quiescent galaxies.Quiescent galaxies have higher mass-to-light ratios and there-fore will have a higher mass-completeness limit than star-forming galaxies at fixed magnitude. Here, we adopt 90%mass-completeness limits for galaxies with a quiescent stellarpopulation using the technique described by Quadri et al.(2012). In a given narrow redshift bin, we select all quiescentgalaxies and scale their fluxes (and therefore their stellarmasses) downward until they have the same magnitude as themeasured magnitude limit, Ks=25.5 ABmag, for all threeZFOURGE fields. Then, we define the mass-completeness limitas the stellar mass at which we recover 90% of the dimmedgalaxies at each redshift. We provide the adopted completenesslimits for ZFOURGE at < <z0.5 2.5 in Table 1.
2.3. Selection of Quiescent and Star-forming Galaxies
Our goal is to measure the fraction of quiescent galaxies as afunction of stellar mass, environment, and redshift. From theparent sample of all galaxies in the ZFOURGE catalog, we firstselect all well-detected galaxies (USE flag=1) and groupthem into three bins of redshift, < <z0.5 1.0, < <z1.0 1.5,and < <z1.5 2.0. We then further subdivide the samples intobins of galaxy stellar mass, < <( )M M8.8 log 9.8,
< <( )M M9.8 log 10.5, and < <( )M M10.5 log 11.5.In each of these bins, we classify galaxies as either star
3
The Astrophysical Journal, 847:134 (21pp), 2017 October 1 Kawinwanichakij et al.
forming or quiescent using their rest-frame U− V and V− Jcolors, denoted by -( )U V 0 and -( )V J 0, respectively. ThisUVJ color–color space is useful to separate galaxies with colorsof quiescent and star-forming stellar populations (including theeffects of dust attenuation; Williams et al. 2009; Patel et al.2012). Due to the small systematic variations in the rest-framecolors of galaxies at fixed stellar mass and redshift in differentsurveys, we follow our previous method (Kawinwanichakijet al. 2016, see Section2.2 in that paper) to self-calibrate theregion in the UVJ color–color space to delineate star-formingfrom quiescent galaxies. We then select quiescent galaxieswhose rest-frame colors satisfy
- > ´ - +- >- <
( ) ( )( )( ) ( )
U V V JU VV J
1.2 0.21.31.6. 1
0 0
0
0
A summary of the number of galaxies from each galaxy mass,redshift, and density subsample is given in Table 2.
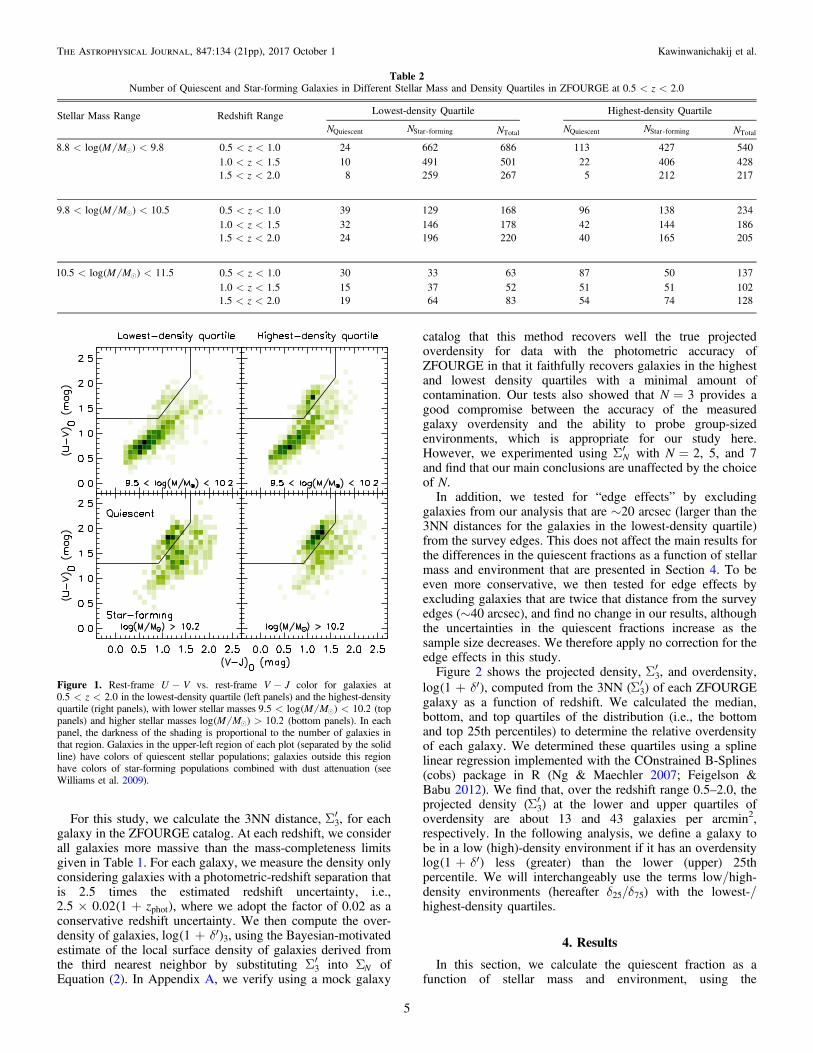
Figure 1 shows the UVJ color–color diagram for galaxies inour ZFOURGE samples at < <z0.5 2.0 split into low stellarmass ( < <( )M M8.8 log 10.2) and high stellar mass( < <( )M M10.2 log 11.5) subsamples, and as a functionof environment as defined by local overdensity (see Section 3below). Although all panels show a similar range of galaxycolors, differences in the distributions are clearly evident withmass (and also environment). The distribution of lower-massgalaxies is weighted more toward bluer star-forming objects(by number), while the distribution of higher-mass star-forminggalaxies show higher dust attenuation, consistent with otherstudies (e.g., Wuyts et al. 2011). All panels also show theexistence of a “red sequence” of quiescent galaxies, but this ismuch more pronounced in the higher-density regions (denserenvironments), which we discuss more below.
2.4. Structural Morphological Parameters
In our analysis, we study the morphological differencesbetween quiescent and star-forming galaxies in differentenvironments and as a function of stellar mass. The majorityof galaxies in our sample fall within the CANDELS coveragefrom HST/WFC3, with the effective semimajor axis, aeff, andSérsic index, n, measured by van der Wel et al. (2012) usingthe HST/WFC3 F160W (H160)-band imaging. We refer thereader to van der Wel et al. for the measurement of the randomand systematic uncertainties of the estimated morphological
parameters using simulated galaxy images. We cross-matchedthe sources in our catalog with those of van der Wel et al. Thefractions of our galaxy sample with available morphologicalparameters from van der Wel et al. are 80%, 90%, and 82% forCDFS, COSMOS, UDS, respectively. We note that 10%–20%of our galaxy sample have no morphological information fromHST/WFC3 because those galaxies are in the regions aroundthe edges of ZFOURGE fields where there is no HST/WFC3coverage. We further define the circularized effective radius as
=r a qeff eff , where aeff is the effective semimajor axis and=q b a is the ratio of the semiminor to semimajor axis. In
addition to the morphological parameters from van der Welet al., we calculate the inner 1 kpc of the stellar mass surfacedensity, the procedure for which we describe in Appendix B.
3. Measurement of Galaxy Density as anEstimate of Environment
In this work, we estimate the local galaxy (projected)overdensity using the distance to the Nth nearest neighbor, dN.This distance has often been used as a measure of theoverdensity, with N typically varying from 3 to 10 (e.g.,Dressler 1980; Baldry et al. 2006; Muldrew et al. 2012). Weare then able to define the environment of a galaxy in terms ofthe dimensionless overdensity, d+1 , defined as
d+ = +S - áSñ
áSñ( ) ( )1 1 , 2N
N
where pS = ( )N dN N2 is the local surface density of a galaxy
based on the distance to the Nth nearest neighbor and áSñ is theaverage surface number density of galaxies over the wholefield. We then take d+( )1 to denote the fractional density ofgalaxies with respect to the mean (as a function of redshift).We improve our measurement of overdensity using an
estimator for the Nth nearest neighbor introduced by Ivezićet al. (2005). The distances to all N nearest neighbors providethe information about the local density (overdensity) ofgalaxies. Motivated by the Bayesian probability framework,we incorporate the projected distance to the Nth nearestneighbors into the density estimator, and we additionally takeinto account information from the projected distances to thefirst -N 1 nearest neighbors. Ivezić et al. demonstrate that thisincreases the accuracy of the overdensity compared to thetraditional Nth nearest neighbor metric because it uses thedistances to the first, second, ... Nth neighbors and is lesssubject to projection effects (see Appendix B of Ivezićet al. 2005). One of the advantages of this estimator is that itprovides a good estimate of the “local density,” whichcorresponds to scales internal to galaxy group halos, providedN is relatively small (see Muldrew et al. 2012). As many of theenvironmental trends we find appear to correlate with group-sized halos, we adopt N=3 for the analysis here. Specifically,we use the estimator as given by Cowan & Ivezić (2008):
S¢ =S =
( )Cd
1. 3N
iN
i12
Here, we take the third nearest neighbor (3NN) distance, wherewe empirically determine the constant, C, by requiring thatáS¢ ñN be equal to that for a uniform density of galaxies with thesame total number and area as in our ZFOURGE data set.
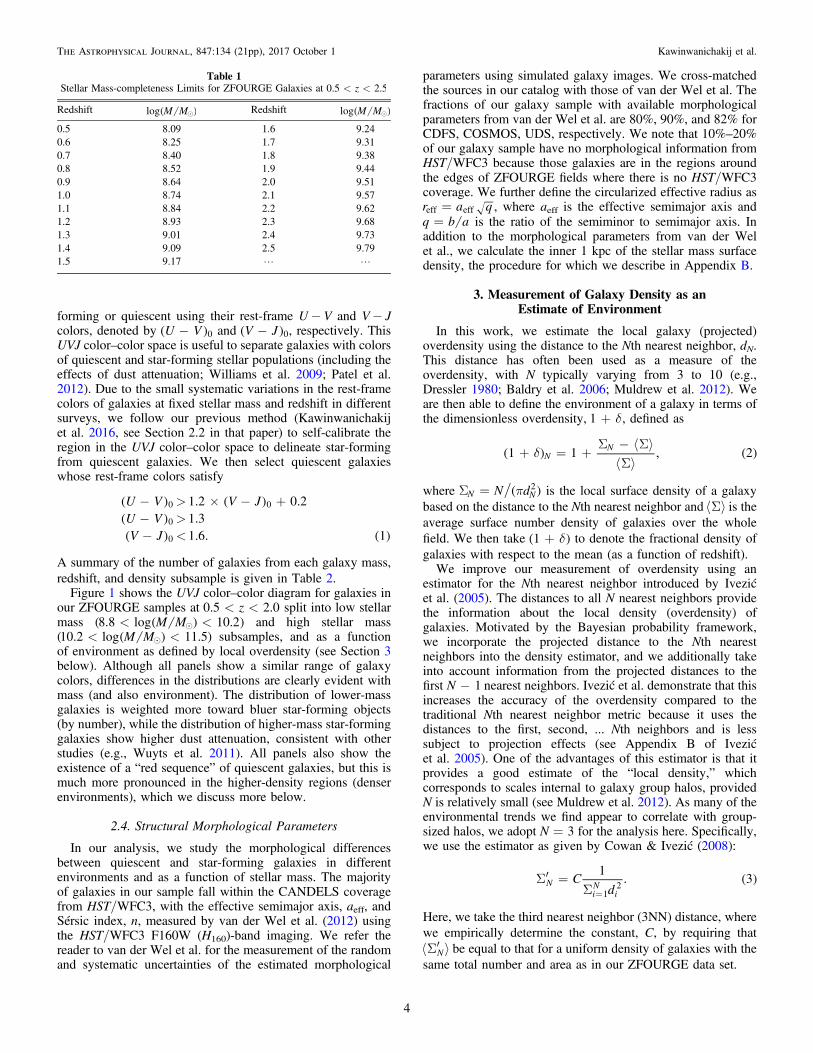
Table 1Stellar Mass-completeness Limits for ZFOURGE Galaxies at < <z0.5 2.5
Redshift ( )M Mlog Redshift ( )M Mlog
0.5 8.09 1.6 9.240.6 8.25 1.7 9.310.7 8.40 1.8 9.380.8 8.52 1.9 9.440.9 8.64 2.0 9.511.0 8.74 2.1 9.571.1 8.84 2.2 9.621.2 8.93 2.3 9.681.3 9.01 2.4 9.731.4 9.09 2.5 9.791.5 9.17 L L
4
The Astrophysical Journal, 847:134 (21pp), 2017 October 1 Kawinwanichakij et al.
For this study, we calculate the 3NN distance, S¢3, for eachgalaxy in the ZFOURGE catalog. At each redshift, we considerall galaxies more massive than the mass-completeness limitsgiven in Table 1. For each galaxy, we measure the density onlyconsidering galaxies with a photometric-redshift separation thatis 2.5 times the estimated redshift uncertainty, i.e.,
´ +( )z2.5 0.02 1 phot , where we adopt the factor of 0.02 as aconservative redshift uncertainty. We then compute the over-density of galaxies, d+ ¢( )log 1 3, using the Bayesian-motivatedestimate of the local surface density of galaxies derived fromthe third nearest neighbor by substituting S¢3 into SN ofEquation (2). In Appendix A, we verify using a mock galaxy
catalog that this method recovers well the true projectedoverdensity for data with the photometric accuracy ofZFOURGE in that it faithfully recovers galaxies in the highestand lowest density quartiles with a minimal amount ofcontamination. Our tests also showed that N=3 provides agood compromise between the accuracy of the measuredgalaxy overdensity and the ability to probe group-sizedenvironments, which is appropriate for our study here.However, we experimented using S¢N with N=2, 5, and 7and find that our main conclusions are unaffected by the choiceof N.In addition, we tested for “edge effects” by excluding
galaxies from our analysis that are ∼20 arcsec (larger than the3NN distances for the galaxies in the lowest-density quartile)from the survey edges. This does not affect the main results forthe differences in the quiescent fractions as a function of stellarmass and environment that are presented in Section 4. To beeven more conservative, we then tested for edge effects byexcluding galaxies that are twice that distance from the surveyedges (∼40 arcsec), and find no change in our results, althoughthe uncertainties in the quiescent fractions increase as thesample size decreases. We therefore apply no correction for theedge effects in this study.Figure 2 shows the projected density, S¢3, and overdensity,
d+ ¢( )log 1 , computed from the 3NN (S¢3) of each ZFOURGEgalaxy as a function of redshift. We calculated the median,bottom, and top quartiles of the distribution (i.e., the bottomand top 25th percentiles) to determine the relative overdensityof each galaxy. We determined these quartiles using a splinelinear regression implemented with the COnstrained B-Splines(cobs) package in R (Ng & Maechler 2007; Feigelson &Babu 2012). We find that, over the redshift range 0.5–2.0, theprojected density (S¢3) at the lower and upper quartiles ofoverdensity are about 13 and 43 galaxies per arcmin2,respectively. In the following analysis, we define a galaxy tobe in a low (high)-density environment if it has an overdensity
d+ ¢( )log 1 less (greater) than the lower (upper) 25thpercentile. We will interchangeably use the terms low/high-density environments (hereafter d25/d75) with the lowest-/highest-density quartiles.
4. Results
In this section, we calculate the quiescent fraction as afunction of stellar mass and environment, using the
Table 2Number of Quiescent and Star-forming Galaxies in Different Stellar Mass and Density Quartiles in ZFOURGE at < <z0.5 2.0
Stellar Mass Range Redshift Range Lowest-density Quartile Highest-density Quartile
NQuiescent ‐NStar forming NTotal NQuiescent ‐NStar forming NTotal
< <( )M M8.8 log 9.8 < <z0.5 1.0 24 662 686 113 427 540< <z1.0 1.5 10 491 501 22 406 428< <z1.5 2.0 8 259 267 5 212 217
< <( )M M9.8 log 10.5 < <z0.5 1.0 39 129 168 96 138 234< <z1.0 1.5 32 146 178 42 144 186< <z1.5 2.0 24 196 220 40 165 205
< <( )M M10.5 log 11.5 < <z0.5 1.0 30 33 63 87 50 137< <z1.0 1.5 15 37 52 51 51 102< <z1.5 2.0 19 64 83 54 74 128
Figure 1. Rest-frame U−V vs. rest-frame V−J color for galaxies at< <z0.5 2.0 in the lowest-density quartile (left panels) and the highest-density
quartile (right panels), with lower stellar masses < <( )M M9.5 log 10.2 (toppanels) and higher stellar masses >( )M Mlog 10.2 (bottom panels). In eachpanel, the darkness of the shading is proportional to the number of galaxies inthat region. Galaxies in the upper-left region of each plot (separated by the solidline) have colors of quiescent stellar populations; galaxies outside this regionhave colors of star-forming populations combined with dust attenuation (seeWilliams et al. 2009).
5
The Astrophysical Journal, 847:134 (21pp), 2017 October 1 Kawinwanichakij et al.

overdensities ( d+ ¢1 ) derived above. We use these fractions toestimate the environmental quenching efficiency and (stellar)mass quenching efficiency as defined below.
4.1. Evolution of Quiescent Fraction withEnvironment and Redshift
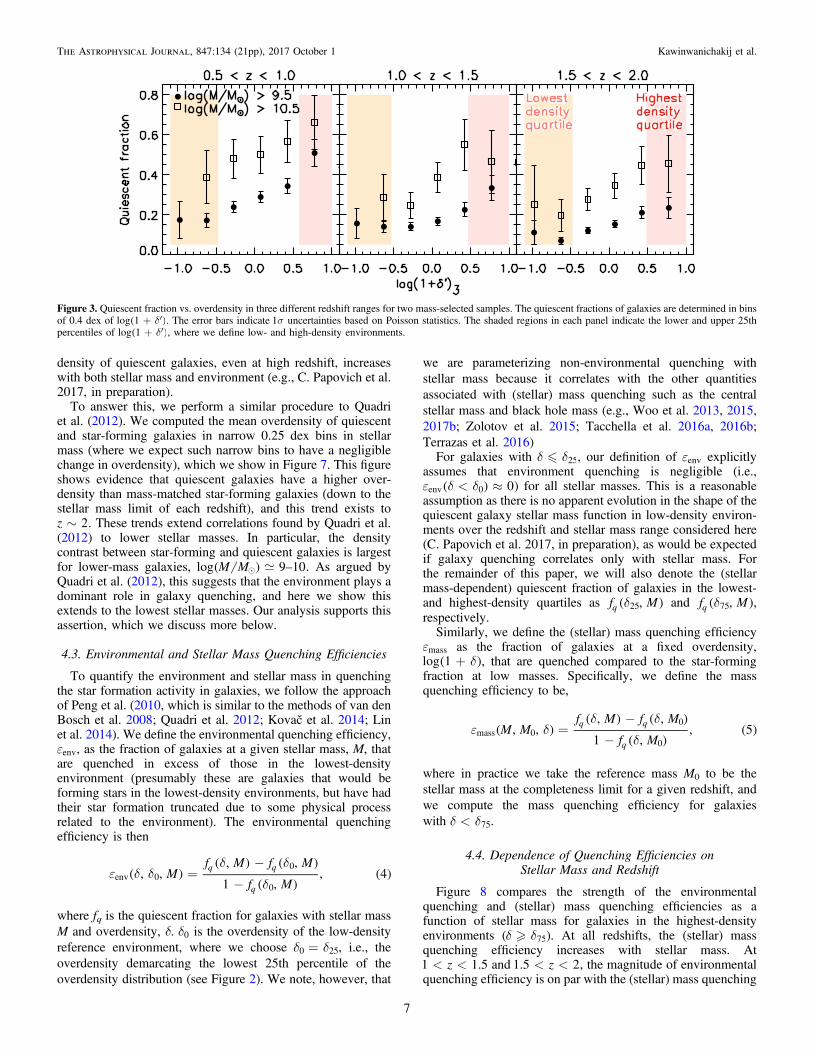
We show the quiescent fraction of galaxies as a function ofthe overdensity in Figure 3. We apply a mass limit of
>( )M Mlog 9.5 in all three redshift bins, which correspondsto our completeness limit at z=2.0. We also compare ourquiescent fraction with those from Quadri et al. (2012), whoused the galaxy sample from the UKIDSS Ultra-Deep Survey,so we apply a mass limit of >( )M Mlog 10.2, correspondingto the completeness limit at z=2.0 used by Quadri et al.(2012). The error bars indicate the 1σ uncertainty based onPoisson statistics for the number of quiescent galaxies in a bin.
At all redshift ranges, we see evidence for a higher quiescentfraction of galaxies at higher densities. This effect is verystrong at <z 1 (left panel of Figure 3), but decreases at higherredshift, >z 1 (middle and right panels of Figure 3). This is inagreement with previous studies of the star formation–densityrelation (e.g., Quadri et al. 2012), where with the ZFOURGEdata we have extended the result to lower masses and higherredshifts (for a recent study of a galaxy sample with stellarmass and redshift range comparable to our sample, see Guoet al. 2017).In this section, we showed that the quiescent fraction of
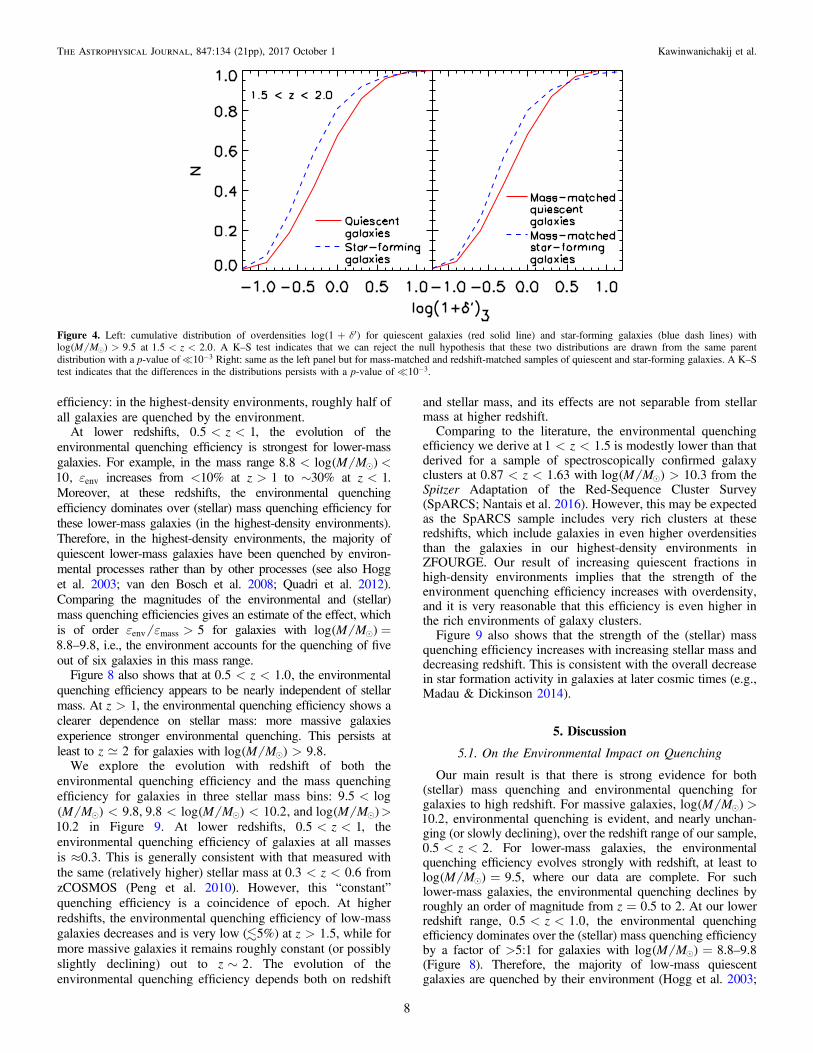
galaxies is higher in denser environments over all redshifts probedin this study. In principle, it is possible that this result is caused bydifferences in the stellar mass distribution and/or the redshiftdistribution of quiescent and star-forming galaxies. To check forthis, we create samples of quiescent and star-forming galaxiessuch that their stellar mass and redshift distributions are matchedfollowing the method described by Kawinwanichakij et al. (2016,see their Section 3.2). The left panel of Figure 4 shows thedifferences in overdensity between the quiescent and star-forminggalaxies before this matching at < <z1.5 2.0 (a p-value of thedifferences as measured by a K–S test of -10 3), and the rightpanel shows that the difference persists even after matching thestellar mass and redshift distributions (a p-value of -10 3). Weobtain even more significant results in our other (lower) redshiftbins. We conclude that, at all redshifts studied here, quiescentgalaxies are more common in overdense regions compared to star-forming galaxies even taking into account differences in redshiftand stellar mass.
4.2. Evolution of Quiescent Fraction withStellar Mass and Redshift
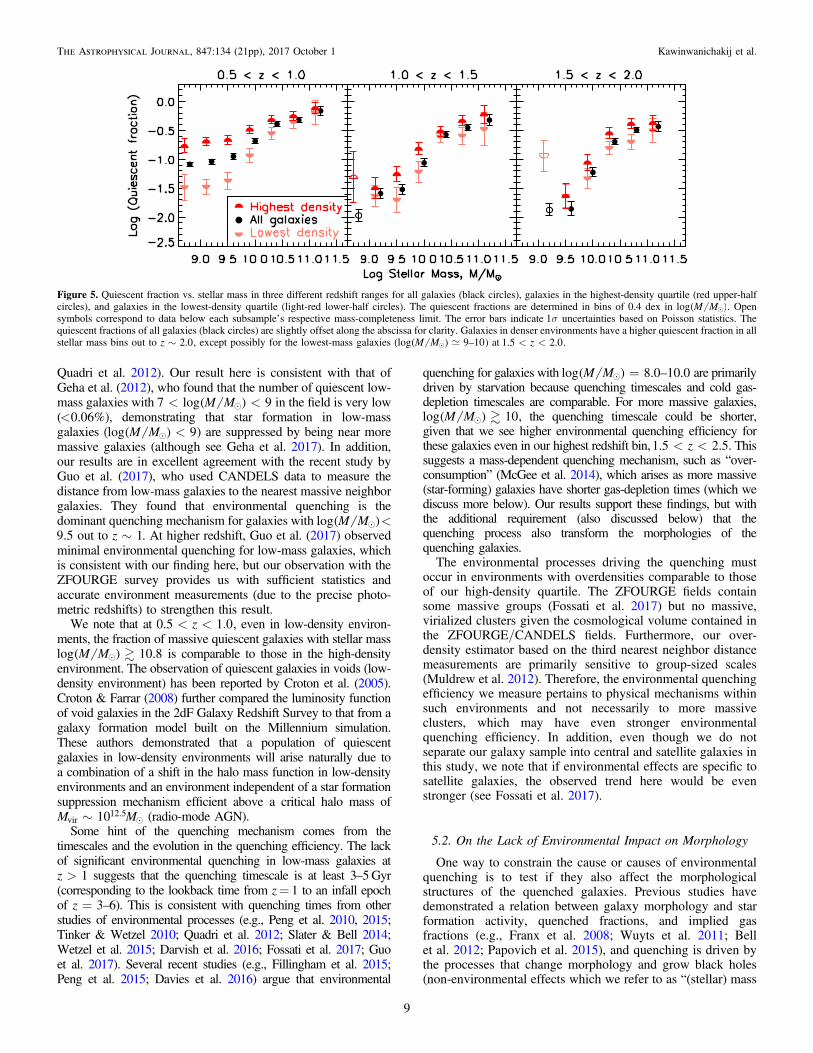
Figure 5 shows the quiescent fraction as a function of stellarmass in bins of redshift, separating galaxies in the highest (d75)and lowest (d25) density quartiles. Qualitatively, at < <z0.5 1.5,galaxies in the highest-density quartile show higher quiescentfractions than galaxies with the same mass in the lowest-densityquartile in all stellar mass bins. This is in agreement with Allenet al. (2016), who show that the fraction of quiescent galaxies with
( )M Mlog 9.5 at ~z 0.95 increases with decreasingdistance to the cluster core. At higher redshift, < <z1.5 2.0,this trend persists for more massive galaxies ( ( )M Mlog 10).Figure 6 shows the quiescent fraction as a function of
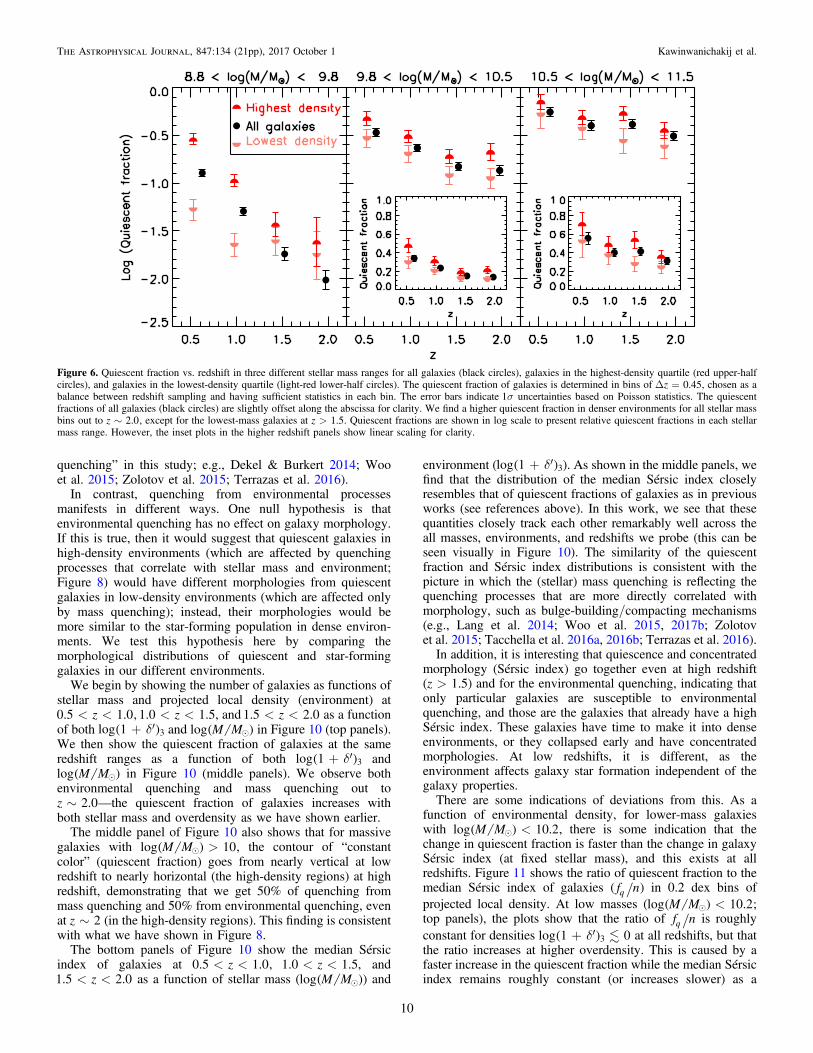
redshift in bins of stellar mass, separating out the lowest andhighest-density quartiles. Qualitatively, galaxies have higherquiescent fractions in high-density environments compared togalaxies in low-density environments out to ~z 2 and forgalaxies with stellar mass ( )M Mlog 9.8. For lower stellarmass galaxies ( < <( )M M8.8 log 9.8), the quiescent frac-tions are higher in the higher-density environment at least toz 1.5, but at higher redshift, z 1.5, the quiescent fraction
shows less dependence on environment.The range of quiescent fraction as a function of overdensity
and stellar mass is large, ranging from nearly 100% to less than1%. To illustrate this, we show the quiescent fraction in logscale instead of linear scale in both Figures 5 and 6. This betterpresents the separation of quiescent fractions of galaxies indifferent environments and also the relative quiescent fractionin each stellar mass bin. Because more massive galaxies tend toexist in higher-density environments, it is logical to ask to whatextent this drives the trend among mass, redshift, andenvironment. This is a reasonable question, as the number
Figure 2. Top: projected density computed from the Bayesian third nearestneighbor (S¢3) of each galaxy in three combined ZFOURGE fields as a functionof redshift. The black, light-red, and red dashed lines show the median, bottom,and top quartiles (25th percentiles) of the distribution, derived from a splinequartile regression applied to the data (see text). Bottom: correspondingoverdensity of ZFOURGE galaxies as a function of redshift computed usingthe same method. We again show the median, bottom, and top quartiles. Wedefine galaxies in the upper and lower quartiles of overdensity to be in “high-”and “low-”density environments, respectively. In each panel, the darkness ofthe shading is proportional to the number of galaxies in that region.
6
The Astrophysical Journal, 847:134 (21pp), 2017 October 1 Kawinwanichakij et al.
density of quiescent galaxies, even at high redshift, increaseswith both stellar mass and environment (e.g., C. Papovich et al.2017, in preparation).
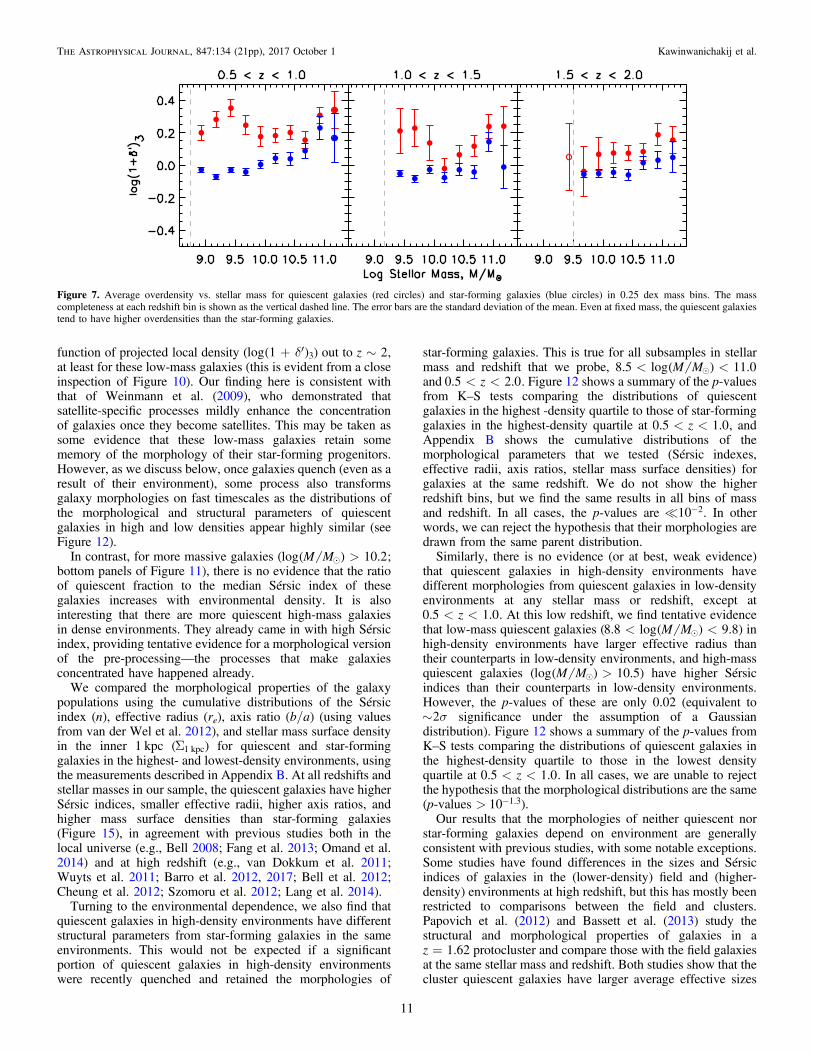
To answer this, we perform a similar procedure to Quadriet al. (2012). We computed the mean overdensity of quiescentand star-forming galaxies in narrow 0.25 dex bins in stellarmass (where we expect such narrow bins to have a negligiblechange in overdensity), which we show in Figure 7. This figureshows evidence that quiescent galaxies have a higher over-density than mass-matched star-forming galaxies (down to thestellar mass limit of each redshift), and this trend exists to~z 2. These trends extend correlations found by Quadri et al.
(2012) to lower stellar masses. In particular, the densitycontrast between star-forming and quiescent galaxies is largestfor lower-mass galaxies, ( ) –M Mlog 9 10. As argued byQuadri et al. (2012), this suggests that the environment plays adominant role in galaxy quenching, and here we show thisextends to the lowest stellar masses. Our analysis supports thisassertion, which we discuss more below.
4.3. Environmental and Stellar Mass Quenching Efficiencies
To quantify the environment and stellar mass in quenchingthe star formation activity in galaxies, we follow the approachof Peng et al. (2010, which is similar to the methods of van denBosch et al. 2008; Quadri et al. 2012; Kovač et al. 2014; Linet al. 2014). We define the environmental quenching efficiency,eenv, as the fraction of galaxies at a given stellar mass, M, thatare quenched in excess of those in the lowest-densityenvironment (presumably these are galaxies that would beforming stars in the lowest-density environments, but have hadtheir star formation truncated due to some physical processrelated to the environment). The environmental quenchingefficiency is then
e d dd d
d=
-
-( )
( ) ( )( )
( )Mf M f M
f M, ,
, ,
1 ,, 4
q q
qenv 0
0
0
where fq is the quiescent fraction for galaxies with stellar massM and overdensity, δ. d0 is the overdensity of the low-densityreference environment, where we choose d d=0 25, i.e., theoverdensity demarcating the lowest 25th percentile of theoverdensity distribution (see Figure 2). We note, however, that
we are parameterizing non-environmental quenching withstellar mass because it correlates with the other quantitiesassociated with (stellar) mass quenching such as the centralstellar mass and black hole mass (e.g., Woo et al. 2013, 2015,2017b; Zolotov et al. 2015; Tacchella et al. 2016a, 2016b;Terrazas et al. 2016)For galaxies with d d25, our definition of eenv explicitly
assumes that environment quenching is negligible (i.e.,e d d< »( ) 0env 0 ) for all stellar masses. This is a reasonableassumption as there is no apparent evolution in the shape of thequiescent galaxy stellar mass function in low-density environ-ments over the redshift and stellar mass range considered here(C. Papovich et al. 2017, in preparation), as would be expectedif galaxy quenching correlates only with stellar mass. Forthe remainder of this paper, we will also denote the (stellarmass-dependent) quiescent fraction of galaxies in the lowest-and highest-density quartiles as d( )f M,q 25 and d( )f M,q 75 ,respectively.Similarly, we define the (stellar) mass quenching efficiency
emass as the fraction of galaxies at a fixed overdensity,d+( )log 1 , that are quenched compared to the star-forming
fraction at low masses. Specifically, we define the massquenching efficiency to be,
e dd d
d=
-
-( )
( ) ( )( )
( )M Mf M f M
f M, ,
, ,
1 ,, 5
q q
qmass 0
0
0
where in practice we take the reference mass M0 to be thestellar mass at the completeness limit for a given redshift, andwe compute the mass quenching efficiency for galaxieswith d d< 75.
4.4. Dependence of Quenching Efficiencies onStellar Mass and Redshift
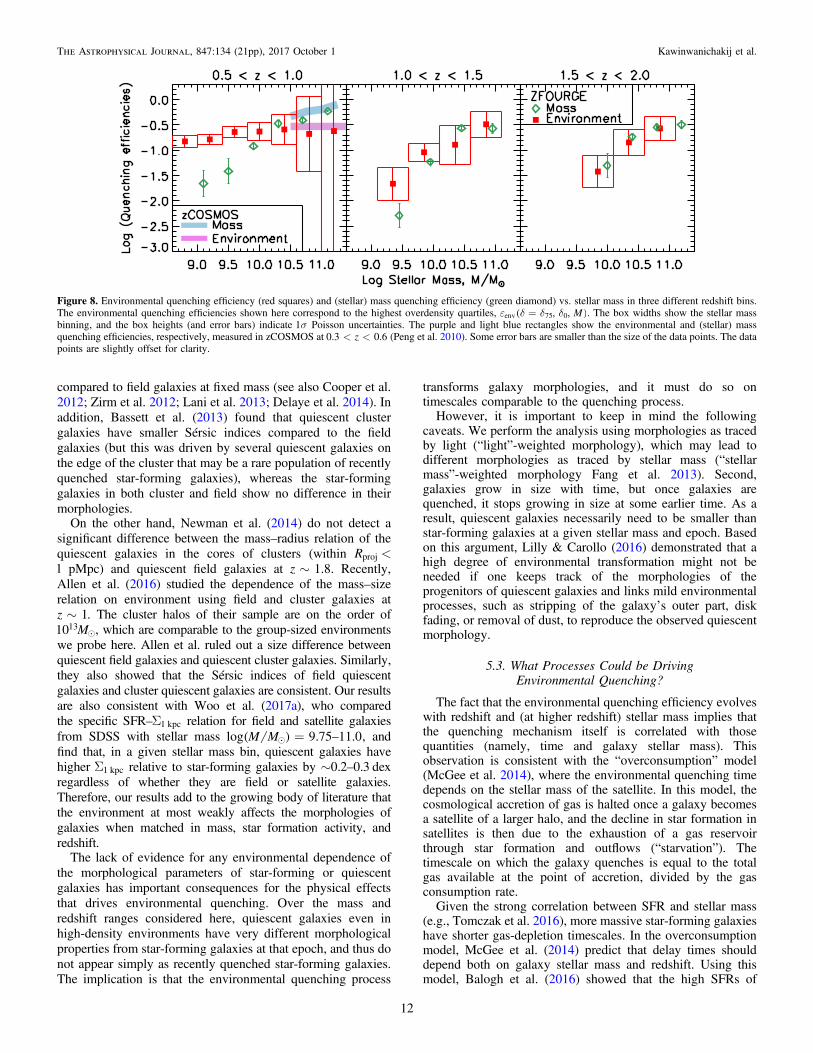
Figure 8 compares the strength of the environmentalquenching and (stellar) mass quenching efficiencies as afunction of stellar mass for galaxies in the highest-densityenvironments ( d d75). At all redshifts, the (stellar) massquenching efficiency increases with stellar mass. At< <z1 1.5 and < <z1.5 2, the magnitude of environmental
quenching efficiency is on par with the (stellar)mass quenching
Figure 3. Quiescent fraction vs. overdensity in three different redshift ranges for two mass-selected samples. The quiescent fractions of galaxies are determined in binsof 0.4 dex of d+ ¢( )log 1 . The error bars indicate s1 uncertainties based on Poisson statistics. The shaded regions in each panel indicate the lower and upper 25thpercentiles of d+ ¢( )log 1 , where we define low- and high-density environments.
7
The Astrophysical Journal, 847:134 (21pp), 2017 October 1 Kawinwanichakij et al.
efficiency: in the highest-density environments, roughly half ofall galaxies are quenched by the environment.
At lower redshifts, < <z0.5 1, the evolution of theenvironmental quenching efficiency is strongest for lower-massgalaxies. For example, in the mass range < <( )M M8.8 log10, eenv increases from <10% at >z 1 to ∼30% at <z 1.Moreover, at these redshifts, the environmental quenchingefficiency dominates over (stellar) mass quenching efficiency forthese lower-mass galaxies (in the highest-density environments).Therefore, in the highest-density environments, the majority ofquiescent lower-mass galaxies have been quenched by environ-mental processes rather than by other processes (see also Hogget al. 2003; van den Bosch et al. 2008; Quadri et al. 2012).Comparing the magnitudes of the environmental and (stellar)mass quenching efficiencies gives an estimate of the effect, whichis of order e e > 5env mass for galaxies with =( )M Mlog
–8.8 9.8, i.e., the environment accounts for the quenching of fiveout of six galaxies in this mass range.
Figure 8 also shows that at < <z0.5 1.0, the environmentalquenching efficiency appears to be nearly independent of stellarmass. At >z 1, the environmental quenching efficiency shows aclearer dependence on stellar mass: more massive galaxiesexperience stronger environmental quenching. This persists atleast to z 2 for galaxies with >( )M Mlog 9.8.
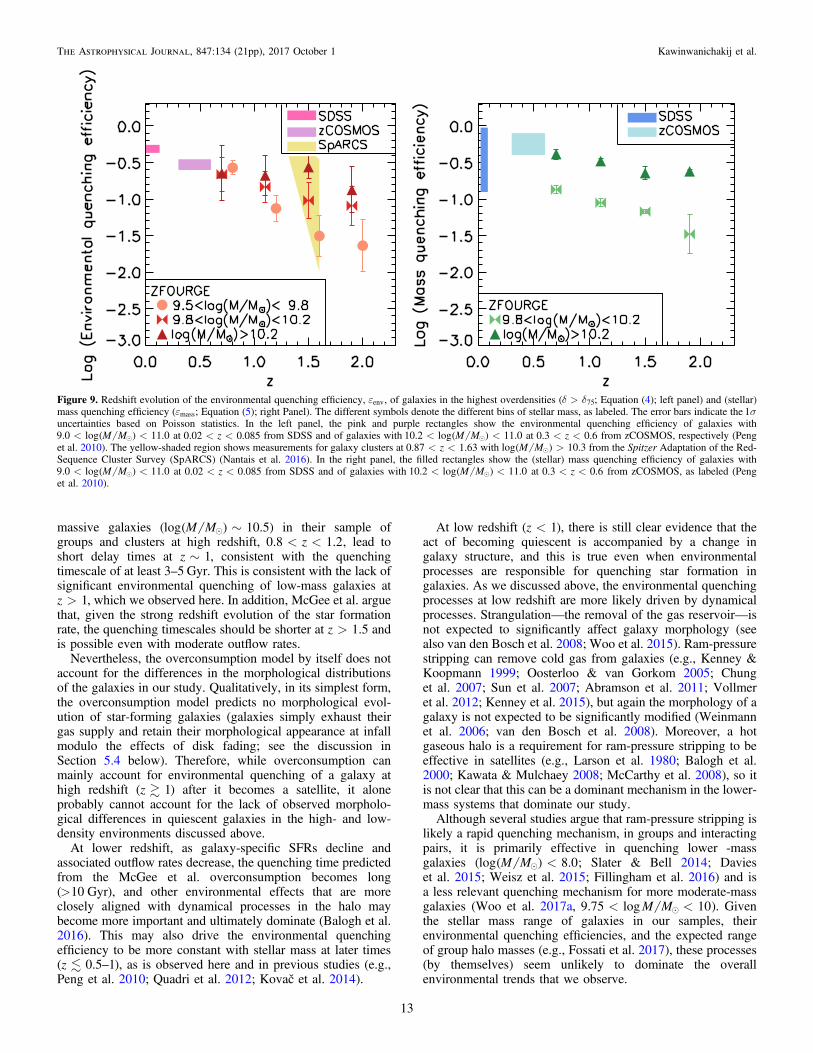
We explore the evolution with redshift of both theenvironmental quenching efficiency and the mass quenchingefficiency for galaxies in three stellar mass bins: <9.5 log
<( )M M 9.8, < <( )M M9.8 log 10.2, and >( )M Mlog10.2 in Figure 9. At lower redshifts, < <z0.5 1, theenvironmental quenching efficiency of galaxies at all massesis ≈0.3. This is generally consistent with that measured withthe same (relatively higher) stellar mass at < <z0.3 0.6 fromzCOSMOS (Peng et al. 2010). However, this “constant”quenching efficiency is a coincidence of epoch. At higherredshifts, the environmental quenching efficiency of low-massgalaxies decreases and is very low (5%) at >z 1.5, while formore massive galaxies it remains roughly constant (or possiblyslightly declining) out to ~z 2. The evolution of theenvironmental quenching efficiency depends both on redshift
and stellar mass, and its effects are not separable from stellarmass at higher redshift.Comparing to the literature, the environmental quenching
efficiency we derive at < <z1 1.5 is modestly lower than thatderived for a sample of spectroscopically confirmed galaxyclusters at < <z0.87 1.63 with >( )M Mlog 10.3 from theSpitzer Adaptation of the Red-Sequence Cluster Survey(SpARCS; Nantais et al. 2016). However, this may be expectedas the SpARCS sample includes very rich clusters at theseredshifts, which include galaxies in even higher overdensitiesthan the galaxies in our highest-density environments inZFOURGE. Our result of increasing quiescent fractions inhigh-density environments implies that the strength of theenvironment quenching efficiency increases with overdensity,and it is very reasonable that this efficiency is even higher inthe rich environments of galaxy clusters.Figure 9 also shows that the strength of the (stellar) mass
quenching efficiency increases with increasing stellar mass anddecreasing redshift. This is consistent with the overall decreasein star formation activity in galaxies at later cosmic times (e.g.,Madau & Dickinson 2014).
5. Discussion
5.1. On the Environmental Impact on Quenching
Our main result is that there is strong evidence for both(stellar) mass quenching and environmental quenching forgalaxies to high redshift. For massive galaxies, >( )M Mlog10.2, environmental quenching is evident, and nearly unchan-ging (or slowly declining), over the redshift range of our sample,
< <z0.5 2. For lower-mass galaxies, the environmentalquenching efficiency evolves strongly with redshift, at least to
=( )M Mlog 9.5, where our data are complete. For suchlower-mass galaxies, the environmental quenching declines byroughly an order of magnitude from z=0.5 to 2. At our lowerredshift range, < <z0.5 1.0, the environmental quenchingefficiency dominates over the (stellar) mass quenching efficiencyby a factor of >5:1 for galaxies with =( ) –M Mlog 8.8 9.8(Figure 8). Therefore, the majority of low-mass quiescentgalaxies are quenched by their environment (Hogg et al. 2003;
Figure 4. Left: cumulative distribution of overdensities d+ ¢( )log 1 for quiescent galaxies (red solid line) and star-forming galaxies (blue dash lines) with>( )M Mlog 9.5 at < <z1.5 2.0. A K–S test indicates that we can reject the null hypothesis that these two distributions are drawn from the same parent
distribution with a p-value of -10 3 Right: same as the left panel but for mass-matched and redshift-matched samples of quiescent and star-forming galaxies. A K–Stest indicates that the differences in the distributions persists with a p-value of -10 3.
8
The Astrophysical Journal, 847:134 (21pp), 2017 October 1 Kawinwanichakij et al.
Quadri et al. 2012). Our result here is consistent with that ofGeha et al. (2012), who found that the number of quiescent low-mass galaxies with < <( )M M7 log 9 in the field is very low(<0.06%), demonstrating that star formation in low-massgalaxies ( <( )M Mlog 9) are suppressed by being near moremassive galaxies (although see Geha et al. 2017). In addition,our results are in excellent agreement with the recent study byGuo et al. (2017), who used CANDELS data to measure thedistance from low-mass galaxies to the nearest massive neighborgalaxies. They found that environmental quenching is thedominant quenching mechanism for galaxies with <( )M Mlog9.5 out to ~z 1. At higher redshift, Guo et al. (2017) observedminimal environmental quenching for low-mass galaxies, whichis consistent with our finding here, but our observation with theZFOURGE survey provides us with sufficient statistics andaccurate environment measurements (due to the precise photo-metric redshifts) to strengthen this result.
We note that at < <z0.5 1.0, even in low-density environ-ments, the fraction of massive quiescent galaxies with stellar mass
( )M Mlog 10.8 is comparable to those in the high-densityenvironment. The observation of quiescent galaxies in voids (low-density environment) has been reported by Croton et al. (2005).Croton & Farrar (2008) further compared the luminosity functionof void galaxies in the 2dF Galaxy Redshift Survey to that from agalaxy formation model built on the Millennium simulation.These authors demonstrated that a population of quiescentgalaxies in low-density environments will arise naturally due toa combination of a shift in the halo mass function in low-densityenvironments and an environment independent of a star formationsuppression mechanism efficient above a critical halo mass of
~ M M10vir12.5 (radio-mode AGN).
Some hint of the quenching mechanism comes from thetimescales and the evolution in the quenching efficiency. The lackof significant environmental quenching in low-mass galaxies at>z 1 suggests that the quenching timescale is at least 3–5Gyr
(corresponding to the lookback time from z= 1 to an infall epochof =z 3–6). This is consistent with quenching times from otherstudies of environmental processes (e.g., Peng et al. 2010, 2015;Tinker & Wetzel 2010; Quadri et al. 2012; Slater & Bell 2014;Wetzel et al. 2015; Darvish et al. 2016; Fossati et al. 2017; Guoet al. 2017). Several recent studies (e.g., Fillingham et al. 2015;Peng et al. 2015; Davies et al. 2016) argue that environmental
quenching for galaxies with =( ) –M Mlog 8.0 10.0 are primarilydriven by starvation because quenching timescales and cold gas-depletion timescales are comparable. For more massive galaxies,
( )M Mlog 10, the quenching timescale could be shorter,given that we see higher environmental quenching efficiency forthese galaxies even in our highest redshift bin, < <z1.5 2.5. Thissuggests a mass-dependent quenching mechanism, such as “over-consumption” (McGee et al. 2014), which arises as more massive(star-forming) galaxies have shorter gas-depletion times (which wediscuss more below). Our results support these findings, but withthe additional requirement (also discussed below) that thequenching process also transform the morphologies of thequenching galaxies.The environmental processes driving the quenching must
occur in environments with overdensities comparable to thoseof our high-density quartile. The ZFOURGE fields containsome massive groups (Fossati et al. 2017) but no massive,virialized clusters given the cosmological volume contained inthe ZFOURGE/CANDELS fields. Furthermore, our over-density estimator based on the third nearest neighbor distancemeasurements are primarily sensitive to group-sized scales(Muldrew et al. 2012). Therefore, the environmental quenchingefficiency we measure pertains to physical mechanisms withinsuch environments and not necessarily to more massiveclusters, which may have even stronger environmentalquenching efficiency. In addition, even though we do notseparate our galaxy sample into central and satellite galaxies inthis study, we note that if environmental effects are specific tosatellite galaxies, the observed trend here would be evenstronger (see Fossati et al. 2017).
5.2. On the Lack of Environmental Impact on Morphology
One way to constrain the cause or causes of environmentalquenching is to test if they also affect the morphologicalstructures of the quenched galaxies. Previous studies havedemonstrated a relation between galaxy morphology and starformation activity, quenched fractions, and implied gasfractions (e.g., Franx et al. 2008; Wuyts et al. 2011; Bellet al. 2012; Papovich et al. 2015), and quenching is driven bythe processes that change morphology and grow black holes(non-environmental effects which we refer to as “(stellar) mass
Figure 5. Quiescent fraction vs. stellar mass in three different redshift ranges for all galaxies (black circles), galaxies in the highest-density quartile (red upper-halfcircles), and galaxies in the lowest-density quartile (light-red lower-half circles). The quiescent fractions are determined in bins of 0.4 dex in ( )M Mlog . Opensymbols correspond to data below each subsample’s respective mass-completeness limit. The error bars indicate s1 uncertainties based on Poisson statistics. Thequiescent fractions of all galaxies (black circles) are slightly offset along the abscissa for clarity. Galaxies in denser environments have a higher quiescent fraction in allstellar mass bins out to ~z 2.0, except possibly for the lowest-mass galaxies ( ( ) –M Mlog 9 10) at < <z1.5 2.0.
9
The Astrophysical Journal, 847:134 (21pp), 2017 October 1 Kawinwanichakij et al.
quenching” in this study; e.g., Dekel & Burkert 2014; Wooet al. 2015; Zolotov et al. 2015; Terrazas et al. 2016).
In contrast, quenching from environmental processesmanifests in different ways. One null hypothesis is thatenvironmental quenching has no effect on galaxy morphology.If this is true, then it would suggest that quiescent galaxies inhigh-density environments (which are affected by quenchingprocesses that correlate with stellar mass and environment;Figure 8) would have different morphologies from quiescentgalaxies in low-density environments (which are affected onlyby mass quenching); instead, their morphologies would bemore similar to the star-forming population in dense environ-ments. We test this hypothesis here by comparing themorphological distributions of quiescent and star-forminggalaxies in our different environments.
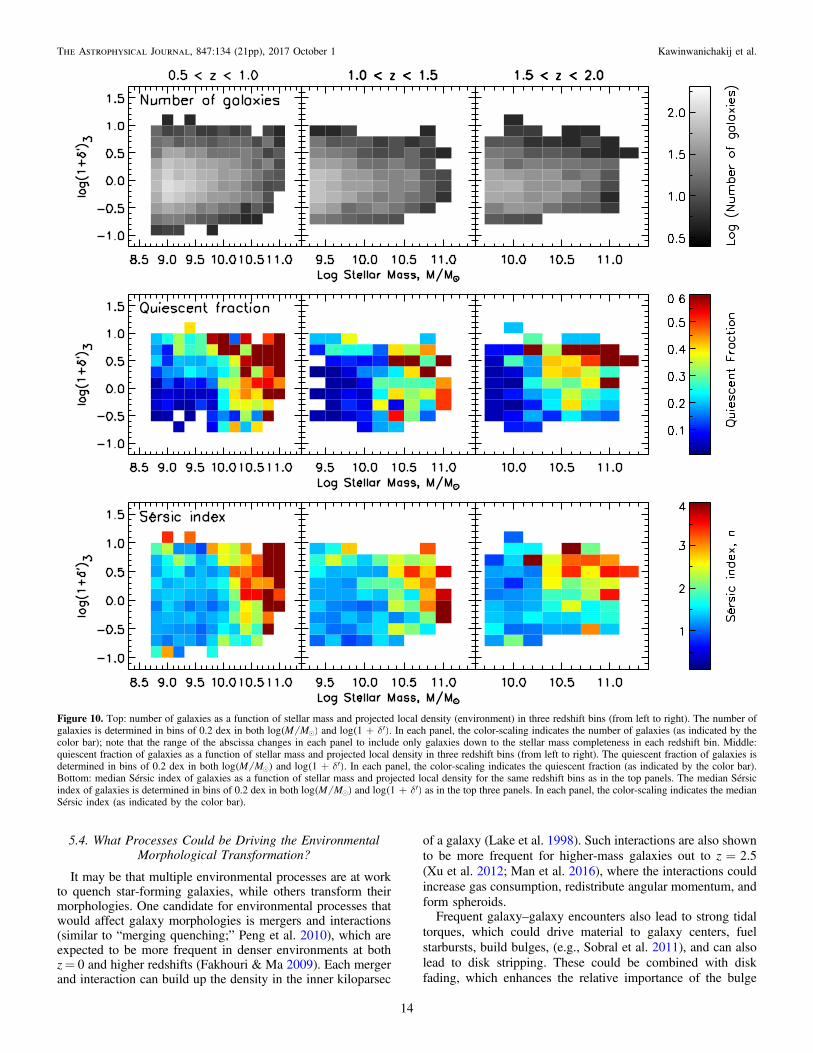
We begin by showing the number of galaxies as functions ofstellar mass and projected local density (environment) at
< <z0.5 1.0, < <z1.0 1.5, and < <z1.5 2.0 as a functionof both d+ ¢( )log 1 3 and ( )M Mlog in Figure 10 (top panels).We then show the quiescent fraction of galaxies at the sameredshift ranges as a function of both d+ ¢( )log 1 3 and
( )M Mlog in Figure 10 (middle panels). We observe bothenvironmental quenching and mass quenching out to~z 2.0—the quiescent fraction of galaxies increases with
both stellar mass and overdensity as we have shown earlier.The middle panel of Figure 10 also shows that for massive
galaxies with >( )M Mlog 10, the contour of “constantcolor” (quiescent fraction) goes from nearly vertical at lowredshift to nearly horizontal (the high-density regions) at highredshift, demonstrating that we get 50% of quenching frommass quenching and 50% from environmental quenching, evenat ~z 2 (in the high-density regions). This finding is consistentwith what we have shown in Figure 8.
The bottom panels of Figure 10 show the median Sérsicindex of galaxies at < <z0.5 1.0, < <z1.0 1.5, and
< <z1.5 2.0 as a function of stellar mass ( ( )M Mlog ) and
environment ( d+ ¢( )log 1 3). As shown in the middle panels, wefind that the distribution of the median Sérsic index closelyresembles that of quiescent fractions of galaxies as in previousworks (see references above). In this work, we see that thesequantities closely track each other remarkably well across theall masses, environments, and redshifts we probe (this can beseen visually in Figure 10). The similarity of the quiescentfraction and Sérsic index distributions is consistent with thepicture in which the (stellar) mass quenching is reflecting thequenching processes that are more directly correlated withmorphology, such as bulge-building/compacting mechanisms(e.g., Lang et al. 2014; Woo et al. 2015, 2017b; Zolotovet al. 2015; Tacchella et al. 2016a, 2016b; Terrazas et al. 2016).In addition, it is interesting that quiescence and concentrated
morphology (Sérsic index) go together even at high redshift( >z 1.5) and for the environmental quenching, indicating thatonly particular galaxies are susceptible to environmentalquenching, and those are the galaxies that already have a highSérsic index. These galaxies have time to make it into denseenvironments, or they collapsed early and have concentratedmorphologies. At low redshifts, it is different, as theenvironment affects galaxy star formation independent of thegalaxy properties.There are some indications of deviations from this. As a
function of environmental density, for lower-mass galaxieswith <( )M Mlog 10.2, there is some indication that thechange in quiescent fraction is faster than the change in galaxySérsic index (at fixed stellar mass), and this exists at allredshifts. Figure 11 shows the ratio of quiescent fraction to themedian Sérsic index of galaxies ( f nq ) in 0.2 dex bins ofprojected local density. At low masses ( <( )M Mlog 10.2;top panels), the plots show that the ratio of f nq is roughlyconstant for densities d+ ¢( )log 1 03 at all redshifts, but thatthe ratio increases at higher overdensity. This is caused by afaster increase in the quiescent fraction while the median Sérsicindex remains roughly constant (or increases slower) as a
Figure 6. Quiescent fraction vs. redshift in three different stellar mass ranges for all galaxies (black circles), galaxies in the highest-density quartile (red upper-halfcircles), and galaxies in the lowest-density quartile (light-red lower-half circles). The quiescent fraction of galaxies is determined in bins of D =z 0.45, chosen as abalance between redshift sampling and having sufficient statistics in each bin. The error bars indicate s1 uncertainties based on Poisson statistics. The quiescentfractions of all galaxies (black circles) are slightly offset along the abscissa for clarity. We find a higher quiescent fraction in denser environments for all stellar massbins out to ~z 2.0, except for the lowest-mass galaxies at >z 1.5. Quiescent fractions are shown in log scale to present relative quiescent fractions in each stellarmass range. However, the inset plots in the higher redshift panels show linear scaling for clarity.
10
The Astrophysical Journal, 847:134 (21pp), 2017 October 1 Kawinwanichakij et al.
function of projected local density ( d+ ¢( )log 1 3) out to ~z 2,at least for these low-mass galaxies (this is evident from a closeinspection of Figure 10). Our finding here is consistent withthat of Weinmann et al. (2009), who demonstrated thatsatellite-specific processes mildly enhance the concentrationof galaxies once they become satellites. This may be taken assome evidence that these low-mass galaxies retain somememory of the morphology of their star-forming progenitors.However, as we discuss below, once galaxies quench (even as aresult of their environment), some process also transformsgalaxy morphologies on fast timescales as the distributions ofthe morphological and structural parameters of quiescentgalaxies in high and low densities appear highly similar (seeFigure 12).
In contrast, for more massive galaxies ( >( )M Mlog 10.2;bottom panels of Figure 11), there is no evidence that the ratioof quiescent fraction to the median Sérsic index of thesegalaxies increases with environmental density. It is alsointeresting that there are more quiescent high-mass galaxiesin dense environments. They already came in with high Sérsicindex, providing tentative evidence for a morphological versionof the pre-processing—the processes that make galaxiesconcentrated have happened already.
We compared the morphological properties of the galaxypopulations using the cumulative distributions of the Sérsicindex (n), effective radius (re), axis ratio (b/a) (using valuesfrom van der Wel et al. 2012), and stellar mass surface densityin the inner 1 kpc (S1 kpc) for quiescent and star-forminggalaxies in the highest- and lowest-density environments, usingthe measurements described in Appendix B. At all redshifts andstellar masses in our sample, the quiescent galaxies have higherSérsic indices, smaller effective radii, higher axis ratios, andhigher mass surface densities than star-forming galaxies(Figure 15), in agreement with previous studies both in thelocal universe (e.g., Bell 2008; Fang et al. 2013; Omand et al.2014) and at high redshift (e.g., van Dokkum et al. 2011;Wuyts et al. 2011; Barro et al. 2012, 2017; Bell et al. 2012;Cheung et al. 2012; Szomoru et al. 2012; Lang et al. 2014).
Turning to the environmental dependence, we also find thatquiescent galaxies in high-density environments have differentstructural parameters from star-forming galaxies in the sameenvironments. This would not be expected if a significantportion of quiescent galaxies in high-density environmentswere recently quenched and retained the morphologies of
star-forming galaxies. This is true for all subsamples in stellarmass and redshift that we probe, < <( )M M8.5 log 11.0and < <z0.5 2.0. Figure 12 shows a summary of the p-valuesfrom K–S tests comparing the distributions of quiescentgalaxies in the highest -density quartile to those of star-forminggalaxies in the highest-density quartile at < <z0.5 1.0, andAppendix B shows the cumulative distributions of themorphological parameters that we tested (Sérsic indexes,effective radii, axis ratios, stellar mass surface densities) forgalaxies at the same redshift. We do not show the higherredshift bins, but we find the same results in all bins of massand redshift. In all cases, the p-values are -10 2. In otherwords, we can reject the hypothesis that their morphologies aredrawn from the same parent distribution.Similarly, there is no evidence (or at best, weak evidence)
that quiescent galaxies in high-density environments havedifferent morphologies from quiescent galaxies in low-densityenvironments at any stellar mass or redshift, except at
< <z0.5 1.0. At this low redshift, we find tentative evidencethat low-mass quiescent galaxies ( < <( )M M8.8 log 9.8) inhigh-density environments have larger effective radius thantheir counterparts in low-density environments, and high-massquiescent galaxies ( >( )M Mlog 10.5) have higher Sérsicindices than their counterparts in low-density environments.However, the p-values of these are only 0.02 (equivalent to
s~2 significance under the assumption of a Gaussiandistribution). Figure 12 shows a summary of the p-values fromK–S tests comparing the distributions of quiescent galaxies inthe highest-density quartile to those in the lowest densityquartile at < <z0.5 1.0. In all cases, we are unable to rejectthe hypothesis that the morphological distributions are the same(p-values > -10 1.3).Our results that the morphologies of neither quiescent nor
star-forming galaxies depend on environment are generallyconsistent with previous studies, with some notable exceptions.Some studies have found differences in the sizes and Sérsicindices of galaxies in the (lower-density) field and (higher-density) environments at high redshift, but this has mostly beenrestricted to comparisons between the field and clusters.Papovich et al. (2012) and Bassett et al. (2013) study thestructural and morphological properties of galaxies in az=1.62 protocluster and compare those with the field galaxiesat the same stellar mass and redshift. Both studies show that thecluster quiescent galaxies have larger average effective sizes
Figure 7. Average overdensity vs. stellar mass for quiescent galaxies (red circles) and star-forming galaxies (blue circles) in 0.25 dex mass bins. The masscompleteness at each redshift bin is shown as the vertical dashed line. The error bars are the standard deviation of the mean. Even at fixed mass, the quiescent galaxiestend to have higher overdensities than the star-forming galaxies.
11
The Astrophysical Journal, 847:134 (21pp), 2017 October 1 Kawinwanichakij et al.
compared to field galaxies at fixed mass (see also Cooper et al.2012; Zirm et al. 2012; Lani et al. 2013; Delaye et al. 2014). Inaddition, Bassett et al. (2013) found that quiescent clustergalaxies have smaller Sérsic indices compared to the fieldgalaxies (but this was driven by several quiescent galaxies onthe edge of the cluster that may be a rare population of recentlyquenched star-forming galaxies), whereas the star-forminggalaxies in both cluster and field show no difference in theirmorphologies.
On the other hand, Newman et al. (2014) do not detect asignificant difference between the mass–radius relation of thequiescent galaxies in the cores of clusters (within <Rproj
1 pMpc) and quiescent field galaxies at ~z 1.8. Recently,Allen et al. (2016) studied the dependence of the mass–sizerelation on environment using field and cluster galaxies at~z 1. The cluster halos of their sample are on the order of
M1013 , which are comparable to the group-sized environmentswe probe here. Allen et al. ruled out a size difference betweenquiescent field galaxies and quiescent cluster galaxies. Similarly,they also showed that the Sérsic indices of field quiescentgalaxies and cluster quiescent galaxies are consistent. Our resultsare also consistent with Woo et al. (2017a), who comparedthe specific SFR–S1 kpc relation for field and satellite galaxiesfrom SDSS with stellar mass =( ) –M Mlog 9.75 11.0, andfind that, in a given stellar mass bin, quiescent galaxies havehigher S1 kpc relative to star-forming galaxies by ∼0.2–0.3 dexregardless of whether they are field or satellite galaxies.Therefore, our results add to the growing body of literature thatthe environment at most weakly affects the morphologies ofgalaxies when matched in mass, star formation activity, andredshift.
The lack of evidence for any environmental dependence ofthe morphological parameters of star-forming or quiescentgalaxies has important consequences for the physical effectsthat drives environmental quenching. Over the mass andredshift ranges considered here, quiescent galaxies even inhigh-density environments have very different morphologicalproperties from star-forming galaxies at that epoch, and thus donot appear simply as recently quenched star-forming galaxies.The implication is that the environmental quenching process
transforms galaxy morphologies, and it must do so ontimescales comparable to the quenching process.However, it is important to keep in mind the following
caveats. We perform the analysis using morphologies as tracedby light (“light”-weighted morphology), which may lead todifferent morphologies as traced by stellar mass (“stellarmass”-weighted morphology Fang et al. 2013). Second,galaxies grow in size with time, but once galaxies arequenched, it stops growing in size at some earlier time. As aresult, quiescent galaxies necessarily need to be smaller thanstar-forming galaxies at a given stellar mass and epoch. Basedon this argument, Lilly & Carollo (2016) demonstrated that ahigh degree of environmental transformation might not beneeded if one keeps track of the morphologies of theprogenitors of quiescent galaxies and links mild environmentalprocesses, such as stripping of the galaxy’s outer part, diskfading, or removal of dust, to reproduce the observed quiescentmorphology.
5.3. What Processes Could be DrivingEnvironmental Quenching?
The fact that the environmental quenching efficiency evolveswith redshift and (at higher redshift) stellar mass implies thatthe quenching mechanism itself is correlated with thosequantities (namely, time and galaxy stellar mass). Thisobservation is consistent with the “overconsumption” model(McGee et al. 2014), where the environmental quenching timedepends on the stellar mass of the satellite. In this model, thecosmological accretion of gas is halted once a galaxy becomesa satellite of a larger halo, and the decline in star formation insatellites is then due to the exhaustion of a gas reservoirthrough star formation and outflows (“starvation”). Thetimescale on which the galaxy quenches is equal to the totalgas available at the point of accretion, divided by the gasconsumption rate.Given the strong correlation between SFR and stellar mass
(e.g., Tomczak et al. 2016), more massive star-forming galaxieshave shorter gas-depletion timescales. In the overconsumptionmodel, McGee et al. (2014) predict that delay times shoulddepend both on galaxy stellar mass and redshift. Using thismodel, Balogh et al. (2016) showed that the high SFRs of
Figure 8. Environmental quenching efficiency (red squares) and (stellar) mass quenching efficiency (green diamond) vs. stellar mass in three different redshift bins.The environmental quenching efficiencies shown here correspond to the highest overdensity quartiles, e d d d=( )M, ,env 75 0 . The box widths show the stellar massbinning, and the box heights (and error bars) indicate s1 Poisson uncertainties. The purple and light blue rectangles show the environmental and (stellar) massquenching efficiencies, respectively, measured in zCOSMOS at < <z0.3 0.6 (Peng et al. 2010). Some error bars are smaller than the size of the data points. The datapoints are slightly offset for clarity.
12
The Astrophysical Journal, 847:134 (21pp), 2017 October 1 Kawinwanichakij et al.
massive galaxies ( ~( )M Mlog 10.5) in their sample ofgroups and clusters at high redshift, < <z0.8 1.2, lead toshort delay times at ~z 1, consistent with the quenchingtimescale of at least 3–5 Gyr. This is consistent with the lack ofsignificant environmental quenching of low-mass galaxies at>z 1, which we observed here. In addition, McGee et al. argue
that, given the strong redshift evolution of the star formationrate, the quenching timescales should be shorter at >z 1.5 andis possible even with moderate outflow rates.
Nevertheless, the overconsumption model by itself does notaccount for the differences in the morphological distributionsof the galaxies in our study. Qualitatively, in its simplest form,the overconsumption model predicts no morphological evol-ution of star-forming galaxies (galaxies simply exhaust theirgas supply and retain their morphological appearance at infallmodulo the effects of disk fading; see the discussion inSection 5.4 below). Therefore, while overconsumption canmainly account for environmental quenching of a galaxy athigh redshift ( z 1) after it becomes a satellite, it aloneprobably cannot account for the lack of observed morpholo-gical differences in quiescent galaxies in the high- and low-density environments discussed above.
At lower redshift, as galaxy-specific SFRs decline andassociated outflow rates decrease, the quenching time predictedfrom the McGee et al. overconsumption becomes long(>10 Gyr), and other environmental effects that are moreclosely aligned with dynamical processes in the halo maybecome more important and ultimately dominate (Balogh et al.2016). This may also drive the environmental quenchingefficiency to be more constant with stellar mass at later times( –z 0.5 1), as is observed here and in previous studies (e.g.,Peng et al. 2010; Quadri et al. 2012; Kovač et al. 2014).
At low redshift ( <z 1), there is still clear evidence that theact of becoming quiescent is accompanied by a change ingalaxy structure, and this is true even when environmentalprocesses are responsible for quenching star formation ingalaxies. As we discussed above, the environmental quenchingprocesses at low redshift are more likely driven by dynamicalprocesses. Strangulation—the removal of the gas reservoir—isnot expected to significantly affect galaxy morphology (seealso van den Bosch et al. 2008; Woo et al. 2015). Ram-pressurestripping can remove cold gas from galaxies (e.g., Kenney &Koopmann 1999; Oosterloo & van Gorkom 2005; Chunget al. 2007; Sun et al. 2007; Abramson et al. 2011; Vollmeret al. 2012; Kenney et al. 2015), but again the morphology of agalaxy is not expected to be significantly modified (Weinmannet al. 2006; van den Bosch et al. 2008). Moreover, a hotgaseous halo is a requirement for ram-pressure stripping to beeffective in satellites (e.g., Larson et al. 1980; Balogh et al.2000; Kawata & Mulchaey 2008; McCarthy et al. 2008), so itis not clear that this can be a dominant mechanism in the lower-mass systems that dominate our study.Although several studies argue that ram-pressure stripping is
likely a rapid quenching mechanism, in groups and interactingpairs, it is primarily effective in quenching lower -massgalaxies ( <( )M Mlog 8.0; Slater & Bell 2014; Davieset al. 2015; Weisz et al. 2015; Fillingham et al. 2016) and isa less relevant quenching mechanism for more moderate-massgalaxies (Woo et al. 2017a, < <M M9.75 log 10). Giventhe stellar mass range of galaxies in our samples, theirenvironmental quenching efficiencies, and the expected rangeof group halo masses (e.g., Fossati et al. 2017), these processes(by themselves) seem unlikely to dominate the overallenvironmental trends that we observe.
Figure 9. Redshift evolution of the environmental quenching efficiency, eenv, of galaxies in the highest overdensities (d d> ;75 Equation (4); left panel) and (stellar)mass quenching efficiency (e ;mass Equation (5); right Panel). The different symbols denote the different bins of stellar mass, as labeled. The error bars indicate the s1uncertainties based on Poisson statistics. In the left panel, the pink and purple rectangles show the environmental quenching efficiency of galaxies with
< <( )M M9.0 log 11.0 at < <z0.02 0.085 from SDSS and of galaxies with < <( )M M10.2 log 11.0 at < <z0.3 0.6 from zCOSMOS, respectively (Penget al. 2010). The yellow-shaded region shows measurements for galaxy clusters at < <z0.87 1.63 with >( )M Mlog 10.3 from the Spitzer Adaptation of the Red-Sequence Cluster Survey (SpARCS) (Nantais et al. 2016). In the right panel, the filled rectangles show the (stellar) mass quenching efficiency of galaxies with
< <( )M M9.0 log 11.0 at < <z0.02 0.085 from SDSS and of galaxies with < <( )M M10.2 log 11.0 at < <z0.3 0.6 from zCOSMOS, as labeled (Penget al. 2010).
13
The Astrophysical Journal, 847:134 (21pp), 2017 October 1 Kawinwanichakij et al.
5.4. What Processes Could be Driving the EnvironmentalMorphological Transformation?
It may be that multiple environmental processes are at workto quench star-forming galaxies, while others transform theirmorphologies. One candidate for environmental processes thatwould affect galaxy morphologies is mergers and interactions(similar to “merging quenching;” Peng et al. 2010), which areexpected to be more frequent in denser environments at bothz= 0 and higher redshifts (Fakhouri & Ma 2009). Each mergerand interaction can build up the density in the inner kiloparsec
of a galaxy (Lake et al. 1998). Such interactions are also shownto be more frequent for higher-mass galaxies out to z=2.5(Xu et al. 2012; Man et al. 2016), where the interactions couldincrease gas consumption, redistribute angular momentum, andform spheroids.Frequent galaxy–galaxy encounters also lead to strong tidal
torques, which could drive material to galaxy centers, fuelstarbursts, build bulges, (e.g., Sobral et al. 2011), and can alsolead to disk stripping. These could be combined with diskfading, which enhances the relative importance of the bulge
Figure 10. Top: number of galaxies as a function of stellar mass and projected local density (environment) in three redshift bins (from left to right). The number ofgalaxies is determined in bins of 0.2 dex in both ( )M Mlog and d+ ¢( )log 1 . In each panel, the color-scaling indicates the number of galaxies (as indicated by thecolor bar); note that the range of the abscissa changes in each panel to include only galaxies down to the stellar mass completeness in each redshift bin. Middle:quiescent fraction of galaxies as a function of stellar mass and projected local density in three redshift bins (from left to right). The quiescent fraction of galaxies isdetermined in bins of 0.2 dex in both ( )M Mlog and d+ ¢( )log 1 . In each panel, the color-scaling indicates the quiescent fraction (as indicated by the color bar).Bottom: median Sérsic index of galaxies as a function of stellar mass and projected local density for the same redshift bins as in the top panels. The median Sérsicindex of galaxies is determined in bins of 0.2 dex in both ( )M Mlog and d+ ¢( )log 1 as in the top three panels. In each panel, the color-scaling indicates the medianSérsic index (as indicated by the color bar).
14
The Astrophysical Journal, 847:134 (21pp), 2017 October 1 Kawinwanichakij et al.
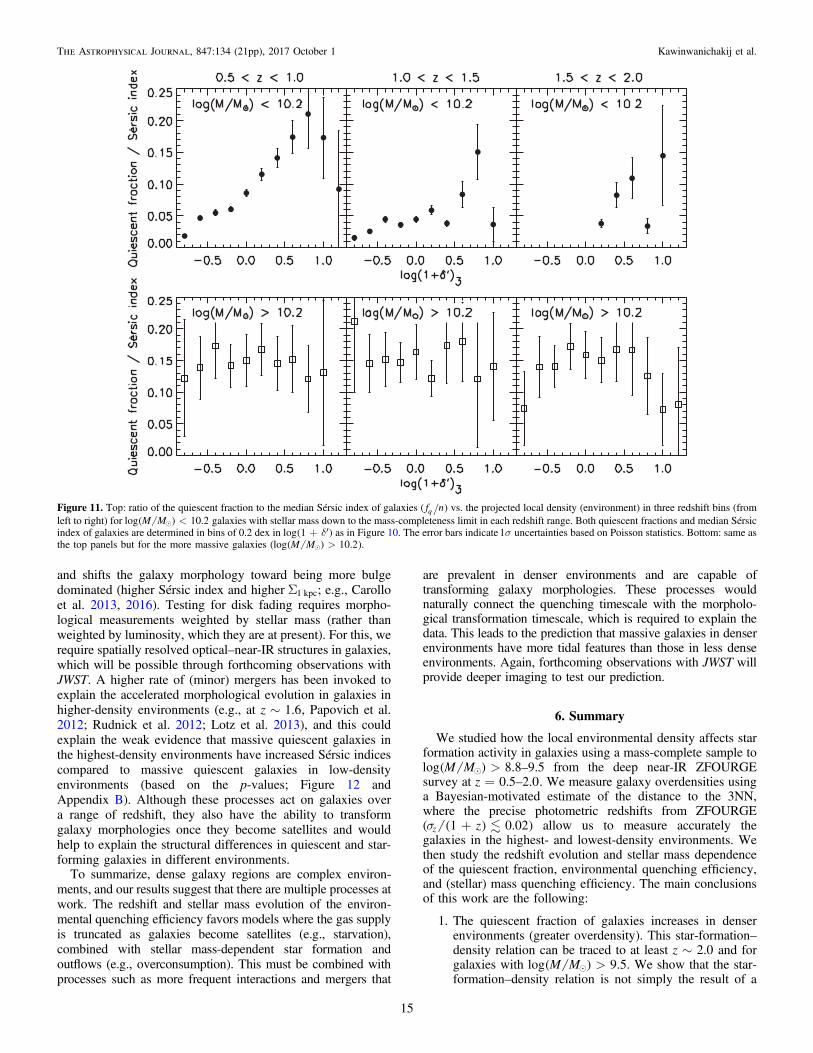
and shifts the galaxy morphology toward being more bulgedominated (higher Sérsic index and higher S1 kpc; e.g., Carolloet al. 2013, 2016). Testing for disk fading requires morpho-logical measurements weighted by stellar mass (rather thanweighted by luminosity, which they are at present). For this, werequire spatially resolved optical–near-IR structures in galaxies,which will be possible through forthcoming observations withJWST. A higher rate of (minor) mergers has been invoked toexplain the accelerated morphological evolution in galaxies inhigher-density environments (e.g., at ~z 1.6, Papovich et al.2012; Rudnick et al. 2012; Lotz et al. 2013), and this couldexplain the weak evidence that massive quiescent galaxies inthe highest-density environments have increased Sérsic indicescompared to massive quiescent galaxies in low-densityenvironments (based on the p-values; Figure 12 andAppendix B). Although these processes act on galaxies overa range of redshift, they also have the ability to transformgalaxy morphologies once they become satellites and wouldhelp to explain the structural differences in quiescent and star-forming galaxies in different environments.
To summarize, dense galaxy regions are complex environ-ments, and our results suggest that there are multiple processes atwork. The redshift and stellar mass evolution of the environ-mental quenching efficiency favors models where the gas supplyis truncated as galaxies become satellites (e.g., starvation),combined with stellar mass-dependent star formation andoutflows (e.g., overconsumption). This must be combined withprocesses such as more frequent interactions and mergers that
are prevalent in denser environments and are capable oftransforming galaxy morphologies. These processes wouldnaturally connect the quenching timescale with the morpholo-gical transformation timescale, which is required to explain thedata. This leads to the prediction that massive galaxies in denserenvironments have more tidal features than those in less denseenvironments. Again, forthcoming observations with JWST willprovide deeper imaging to test our prediction.
6. Summary
We studied how the local environmental density affects starformation activity in galaxies using a mass-complete sample to
>( ) –M Mlog 8.8 9.5 from the deep near-IR ZFOURGEsurvey at = –z 0.5 2.0. We measure galaxy overdensities usinga Bayesian-motivated estimate of the distance to the 3NN,where the precise photometric redshifts from ZFOURGE( s +( )z1 0.02z ) allow us to measure accurately thegalaxies in the highest- and lowest-density environments. Wethen study the redshift evolution and stellar mass dependenceof the quiescent fraction, environmental quenching efficiency,and (stellar) mass quenching efficiency. The main conclusionsof this work are the following:
1. The quiescent fraction of galaxies increases in denserenvironments (greater overdensity). This star-formation–density relation can be traced to at least ~z 2.0 and forgalaxies with >( )M Mlog 9.5. We show that the star-formation–density relation is not simply the result of a
Figure 11. Top: ratio of the quiescent fraction to the median Sérsic index of galaxies ( f nq ) vs. the projected local density (environment) in three redshift bins (fromleft to right) for <( )M Mlog 10.2 galaxies with stellar mass down to the mass-completeness limit in each redshift range. Both quiescent fractions and median Sérsicindex of galaxies are determined in bins of 0.2 dex in d+ ¢( )log 1 as in Figure 10. The error bars indicate s1 uncertainties based on Poisson statistics. Bottom: same asthe top panels but for the more massive galaxies ( >( )M Mlog 10.2).
15
The Astrophysical Journal, 847:134 (21pp), 2017 October 1 Kawinwanichakij et al.
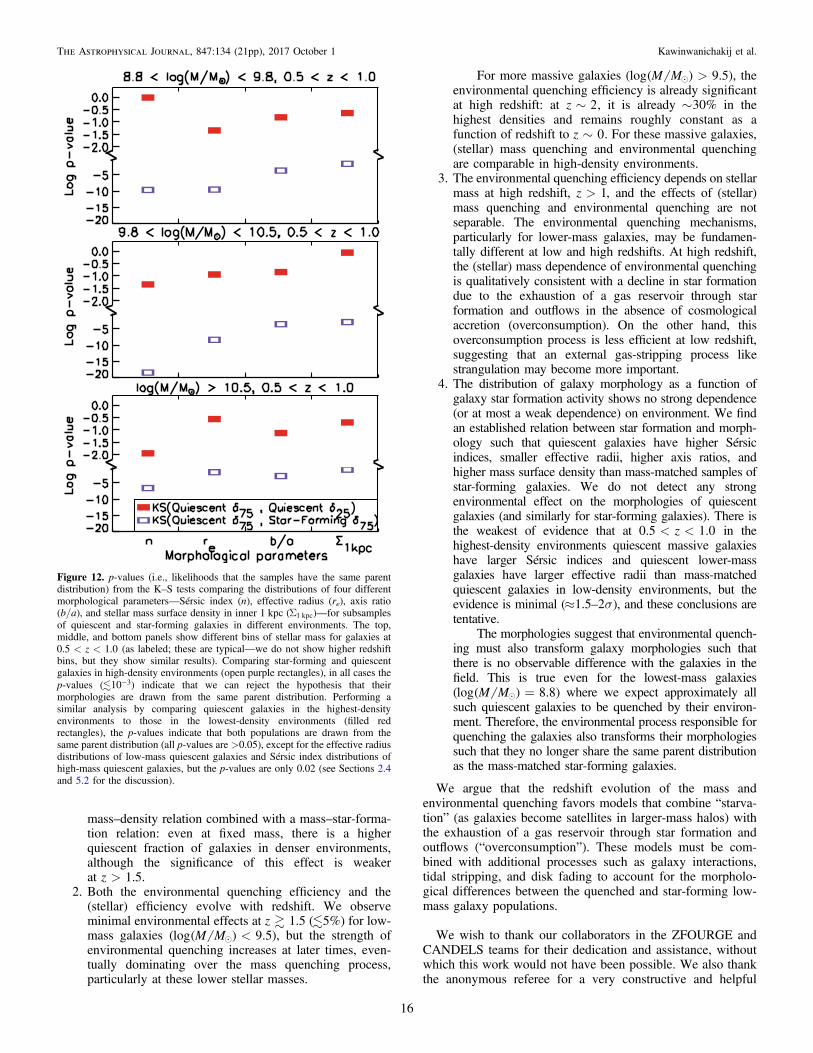
mass–density relation combined with a mass–star-forma-tion relation: even at fixed mass, there is a higherquiescent fraction of galaxies in denser environments,although the significance of this effect is weakerat >z 1.5.
2. Both the environmental quenching efficiency and the(stellar) efficiency evolve with redshift. We observeminimal environmental effects at z 1.5 (5%) for low-mass galaxies ( <( )M Mlog 9.5), but the strength ofenvironmental quenching increases at later times, even-tually dominating over the mass quenching process,particularly at these lower stellar masses.
For more massive galaxies ( >( )M Mlog 9.5), theenvironmental quenching efficiency is already significantat high redshift: at ~z 2, it is already ~30% in thehighest densities and remains roughly constant as afunction of redshift to ~z 0. For these massive galaxies,(stellar) mass quenching and environmental quenchingare comparable in high-density environments.
3. The environmental quenching efficiency depends on stellarmass at high redshift, >z 1, and the effects of (stellar)mass quenching and environmental quenching are notseparable. The environmental quenching mechanisms,particularly for lower-mass galaxies, may be fundamen-tally different at low and high redshifts. At high redshift,the (stellar) mass dependence of environmental quenchingis qualitatively consistent with a decline in star formationdue to the exhaustion of a gas reservoir through starformation and outflows in the absence of cosmologicalaccretion (overconsumption). On the other hand, thisoverconsumption process is less efficient at low redshift,suggesting that an external gas-stripping process likestrangulation may become more important.
4. The distribution of galaxy morphology as a function ofgalaxy star formation activity shows no strong dependence(or at most a weak dependence) on environment. We findan established relation between star formation and morph-ology such that quiescent galaxies have higher Sérsicindices, smaller effective radii, higher axis ratios, andhigher mass surface density than mass-matched samples ofstar-forming galaxies. We do not detect any strongenvironmental effect on the morphologies of quiescentgalaxies (and similarly for star-forming galaxies). There isthe weakest of evidence that at < <z0.5 1.0 in thehighest-density environments quiescent massive galaxieshave larger Sérsic indices and quiescent lower-massgalaxies have larger effective radii than mass-matchedquiescent galaxies in low-density environments, but theevidence is minimal ( s» –1.5 2 ), and these conclusions aretentative.
The morphologies suggest that environmental quench-ing must also transform galaxy morphologies such thatthere is no observable difference with the galaxies in thefield. This is true even for the lowest-mass galaxies( =( )M Mlog 8.8) where we expect approximately allsuch quiescent galaxies to be quenched by their environ-ment. Therefore, the environmental process responsible forquenching the galaxies also transforms their morphologiessuch that they no longer share the same parent distributionas the mass-matched star-forming galaxies.
We argue that the redshift evolution of the mass andenvironmental quenching favors models that combine “starva-tion” (as galaxies become satellites in larger-mass halos) withthe exhaustion of a gas reservoir through star formation andoutflows (“overconsumption”). These models must be com-bined with additional processes such as galaxy interactions,tidal stripping, and disk fading to account for the morpholo-gical differences between the quenched and star-forming low-mass galaxy populations.
We wish to thank our collaborators in the ZFOURGE andCANDELS teams for their dedication and assistance, withoutwhich this work would not have been possible. We also thankthe anonymous referee for a very constructive and helpful
Figure 12. p-values (i.e., likelihoods that the samples have the same parentdistribution) from the K–S tests comparing the distributions of four differentmorphological parameters—Sérsic index (n), effective radius (re), axis ratio(b/a), and stellar mass surface density in inner 1 kpc (S1 kpc)—for subsamplesof quiescent and star-forming galaxies in different environments. The top,middle, and bottom panels show different bins of stellar mass for galaxies at
< <z0.5 1.0 (as labeled; these are typical—we do not show higher redshiftbins, but they show similar results). Comparing star-forming and quiescentgalaxies in high-density environments (open purple rectangles), in all cases thep-values ( -10 3) indicate that we can reject the hypothesis that theirmorphologies are drawn from the same parent distribution. Performing asimilar analysis by comparing quiescent galaxies in the highest-densityenvironments to those in the lowest-density environments (filled redrectangles), the p-values indicate that both populations are drawn from thesame parent distribution (all p-values are >0.05), except for the effective radiusdistributions of low-mass quiescent galaxies and Sérsic index distributions ofhigh-mass quiescent galaxies, but the p-values are only 0.02 (see Sections 2.4and 5.2 for the discussion).
16
The Astrophysical Journal, 847:134 (21pp), 2017 October 1 Kawinwanichakij et al.

report. This work is supported by the National ScienceFoundation through grants AST 1413317 and 1614668. Thiswork is based on observations taken by the CANDELS Multi-Cycle Treasury Program with the NASA/ESA HST, which isoperated by the Association of Universities for Research inAstronomy, Inc., under NASA contract NAS5-26555. Thiswork is supported by HST program number GO-12060.Support for program number GO-12060 was provided byNASA through a grant from the Space Telescope ScienceInstitute, which is operated by the Association of Universitiesfor Research in Astronomy, Incorporated, under NASAcontract NAS5-26555. We acknowledge generous supportfrom the Texas A&M University and the George P. andCynthia Woods Institute for Fundamental Physics andAstronomy. L.K. thanks the LSSTC Data Science FellowshipProgram; her time as a Fellow has benefited this work. G.G.K.acknowledges the support of the Australian Research Councilthrough the award of a Future Fellowship (FT140100933).K.-V.H.T. acknowledges support by the National ScienceFoundation under grant #1410728.
Appendix AMeasuring Galaxy Overdensities
with Photometric Redshifts
In this work, we use a variation of the distance to the 3NN asa measure of the galaxy environment. We derive the 3NN fromthe ZFOURGE photometric redshifts and here we quantify howwell the overdensity derived from the 3NN reproduces the trueoverdensity as measured in spectroscopic redshift surveys.
We use a mock galaxy catalog based on the semi-analyticmodel from Henriques et al. (2015), which is the Munich galaxyformation model updated with the Planck first-year cosmology.Henriques et al. modify the treatment of baryonic processes toaddress the overabundance of low-mass galaxies and quiescentgalaxies. For our purposes, the details of galaxy formation andfeedback in the mock catalog are less important than the actualredshifts (which include both the cosmological expansion andpeculiar velocity). We take all galaxies in the mock catalog downto the stellar mass limit of our ZFOURGE survey at everyredshift. We then perturb the redshift from the mock catalog by arandom number selected from a normal distribution with sz equalto the uncertainty of the ZFOURGE photometric redshift(s = +( )z0.01 1z to +( )z0.02 1 , depending on the galaxymass and magnitude; see Straatman et al. 2016).
We then calculate the distance to the Nth nearest neighbor, withN=1, 2, 3, K, 7 in two ways. First, we use the “true” redshiftsfrom the mock (which include the peculiar velocity) to measurethe distance to the nearest neighbor within a cylindrical volume oflength (in the radial dimension) corresponding to D = v
-2100 km s 1, which serves as an estimate of the density measuredin a spectroscopic survey. We then repeat the measurement, butusing the perturbed redshifts as an estimate of the densitymeasured by a ZFOURGE-like photometric-redshift survey.
We then compute two estimates of the local surface densityof galaxies derived from the Nth nearest neighbor. First, wecompute it with the standard method, pS = -( )N dN N
2 1, wheredN is the distance to the Nth nearest neighbor. Second, we usethe Bayesian-motivated estimate of the local surface densityderived to the Nth nearest neighbor,S¢N , which uses the densityinformation of the distances to all neighbors N (Ivezić et al.2005; Cowan & Ivezić 2008) defined in Equation (3) above.
From both estimates of the local surface density, we computethe overdensity, d+( )1 N , using Equation (2) above.For convenience, we define d+ ¢( ) [ ]zlog 1 N phot as the
density measured for galaxies in the mock catalog using theZFOURGE-like photometric-redshift uncertainties. We alsodefine d+ ¢( ) [ ]zlog 1 N spec as the density measured in the mockcatalog using “true” redshifts (which include the cosmological andpeculiar redshift in the mock catalog). Figure 13 shows theoverdensities for the Bayesian 3NN for the mock catalog,
d+ ¢ =( ) [ ]zlog 1 N 3 spec , compared to those derived from thephotometric redshifts, d+ ¢ =( ) [ ]zlog 1 N 3 phot . The relations areclearly correlated, with galaxies at low and high overdensity in thespectroscopic survey generally displaying low and high over-density when measured in the ZFOURGE-like survey. However,there are clear examples of mismatch; for example, there is a tailof objects with low overdensity, as defined in the spectroscopic-quality data, that have measured high overdensity in theZFOURGE-like data. This tail is caused by redshift errors andchance projections of unassociated objects along the line of sightand is consistent with the findings of Cooper et al. (2005) thatphotometric redshifts can wash out structure.To quantify the accuracy of the overdensity as measured by
the ZFOURGE-like data set, we first measured Spearman’scorrelation coefficient for the overdensities measured in thespectroscopic-like and ZFOURGE-like data sets for theoverdenstiy calculated using the N=2nd, 3rd, 5th, and 7thnearest neighbor, for the standard and Bayesian methodsdescribed above. Figure 14 shows the correlation coefficientsas a function of N for the mock galaxies. We find that for allredshift bins from z=0.5 to 2.0, the Bayesian densityestimators have higher Spearman’s correlation coefficientrelative to the traditional nearest neighbors regardless ofnumber of nearest neighbors, indicating that the Bayesiandensity estimator is better correlated with the spectroscopicdensity estimator relative to the standard Nth nearest neighbors.The two-sided significance (p-value) of the Spearman’scorrelation coefficient for all three redshift bins are zero,implying very strong correlation. Second, we find that thecorrelation increases with lower Nth nearest neighbors.Second, we computed the completeness and contamination
in the low- and high-density environments derived using theZFOURGE-like mock survey. Our goal is to derive robustsamples of galaxies in low-density (high-density) environmentsthat are relatively “pure” in that they have a low contaminationfraction of galaxies in high-density (low-density) environmentsmisclassified by our method. Specifically, we will definesamples of galaxies in high-density and low-density environ-ments based on the ranked quartiles computed using a splinelinear regression implemented with the cobs package as we didfor our analysis of the ZFOURGE galaxy sample (where wedefine galaxies in the top density quartile as “high density” andthose in the bottom density quartile as “low density.”)Selecting galaxies in the top (highest) density quartile in
d+ ¢( ) [ ]zlog 1 N phot using the 3NN (N=3), we recover >80%of galaxies that are also in the top density quartile in
d+ ¢( ) [ ]zlog 1 N spec (see Figure 13; the completeness declinesfor higher values of N). Of the galaxies in the top densityquartile in d+ ¢( ) [ ]zlog 1 N spec that we miss, more than half arein the next (third) quartile in d+ ¢( ) [ ]zlog 1 N phot . Moreimportantly, the contamination is low. The fraction of galaxiesin our top density quartile in d+ ¢( ) [ ]zlog 1 N phot that areactually in the lowest or second-lowest density quartiles in
17
The Astrophysical Journal, 847:134 (21pp), 2017 October 1 Kawinwanichakij et al.
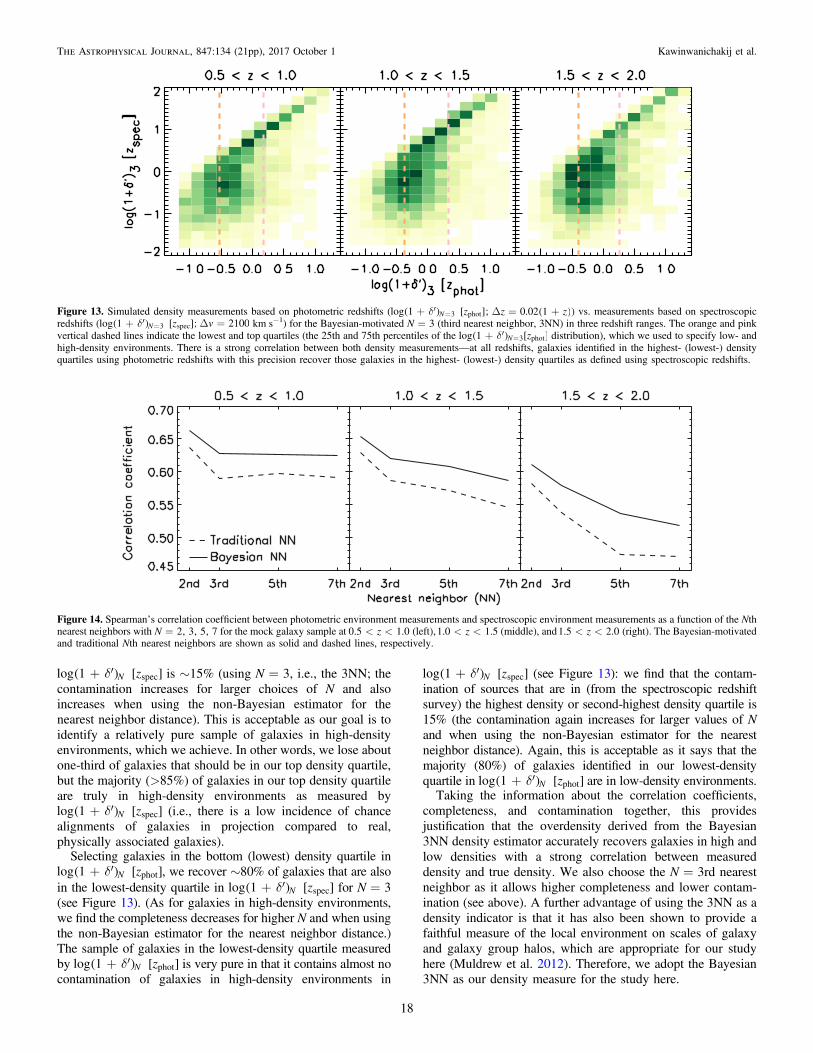
d+ ¢( ) [ ]zlog 1 N spec is ∼15% (using N=3, i.e., the 3NN; thecontamination increases for larger choices of N and alsoincreases when using the non-Bayesian estimator for thenearest neighbor distance). This is acceptable as our goal is toidentify a relatively pure sample of galaxies in high-densityenvironments, which we achieve. In other words, we lose aboutone-third of galaxies that should be in our top density quartile,but the majority (>85%) of galaxies in our top density quartileare truly in high-density environments as measured by
d+ ¢( ) [ ]zlog 1 N spec (i.e., there is a low incidence of chancealignments of galaxies in projection compared to real,physically associated galaxies).
Selecting galaxies in the bottom (lowest) density quartile ind+ ¢( ) [ ]zlog 1 N phot , we recover ∼80% of galaxies that are also
in the lowest-density quartile in d+ ¢( ) [ ]zlog 1 N spec for N=3(see Figure 13). (As for galaxies in high-density environments,we find the completeness decreases for higher N and when usingthe non-Bayesian estimator for the nearest neighbor distance.)The sample of galaxies in the lowest-density quartile measuredby d+ ¢( ) [ ]zlog 1 N phot is very pure in that it contains almost nocontamination of galaxies in high-density environments in
d+ ¢( ) [ ]zlog 1 N spec (see Figure 13): we find that the contam-ination of sources that are in (from the spectroscopic redshiftsurvey) the highest density or second-highest density quartile is15% (the contamination again increases for larger values of Nand when using the non-Bayesian estimator for the nearestneighbor distance). Again, this is acceptable as it says that themajority (80%) of galaxies identified in our lowest-densityquartile in d+ ¢( ) [ ]zlog 1 N phot are in low-density environments.Taking the information about the correlation coefficients,
completeness, and contamination together, this providesjustification that the overdensity derived from the Bayesian3NN density estimator accurately recovers galaxies in high andlow densities with a strong correlation between measureddensity and true density. We also choose the N=3rd nearestneighbor as it allows higher completeness and lower contam-ination (see above). A further advantage of using the 3NN as adensity indicator is that it has also been shown to provide afaithful measure of the local environment on scales of galaxyand galaxy group halos, which are appropriate for our studyhere (Muldrew et al. 2012). Therefore, we adopt the Bayesian3NN as our density measure for the study here.
Figure 13. Simulated density measurements based on photometric redshifts ( d+ ¢ =( ) [ ]zlog 1 ;N 3 phot D = +( )z z0.02 1 ) vs. measurements based on spectroscopicredshifts ( d+ ¢ =( ) [ ]zlog 1 ;N 3 spec D =v 2100 km s−1) for the Bayesian-motivated N=3 (third nearest neighbor, 3NN) in three redshift ranges. The orange and pinkvertical dashed lines indicate the lowest and top quartiles (the 25th and 75th percentiles of the d+ ¢ =( ) [ ]zlog 1 N 3 phot distribution), which we used to specify low- andhigh-density environments. There is a strong correlation between both density measurements—at all redshifts, galaxies identified in the highest- (lowest-) densityquartiles using photometric redshifts with this precision recover those galaxies in the highest- (lowest-) density quartiles as defined using spectroscopic redshifts.
Figure 14. Spearman’s correlation coefficient between photometric environment measurements and spectroscopic environment measurements as a function of the Nthnearest neighbors with =N 2, 3, 5, 7 for the mock galaxy sample at < <z0.5 1.0 (left), < <z1.0 1.5 (middle), and < <z1.5 2.0 (right). The Bayesian-motivatedand traditional Nth nearest neighbors are shown as solid and dashed lines, respectively.
18
The Astrophysical Journal, 847:134 (21pp), 2017 October 1 Kawinwanichakij et al.
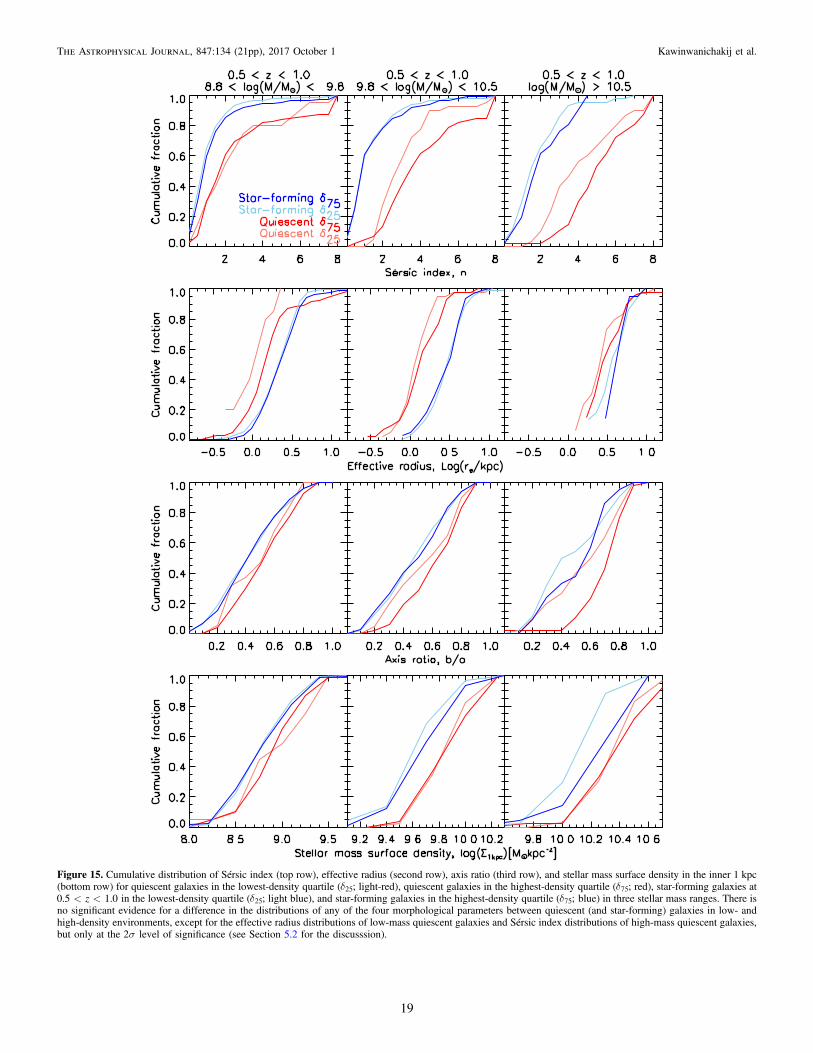
Figure 15. Cumulative distribution of Sérsic index (top row), effective radius (second row), axis ratio (third row), and stellar mass surface density in the inner 1 kpc(bottom row) for quiescent galaxies in the lowest-density quartile (d ;25 light-red), quiescent galaxies in the highest-density quartile (d ;75 red), star-forming galaxies at
< <z0.5 1.0 in the lowest-density quartile (d ;25 light blue), and star-forming galaxies in the highest-density quartile (d ;75 blue) in three stellar mass ranges. There isno significant evidence for a difference in the distributions of any of the four morphological parameters between quiescent (and star-forming) galaxies in low- andhigh-density environments, except for the effective radius distributions of low-mass quiescent galaxies and Sérsic index distributions of high-mass quiescent galaxies,but only at the s2 level of significance (see Section 5.2 for the discusssion).
19
The Astrophysical Journal, 847:134 (21pp), 2017 October 1 Kawinwanichakij et al.
Appendix BStellar Mass Surface Density in the Inner 1 kpc and
Cumulative Distributions of StructuralMorphological Parameters
In addition to comparing the three morphological para-meters, Sérsic index, effective semimajor axis, axis ratio(described in Section 2.4) of quiescent and star-forminggalaxies in low- and high-density environments, we alsoconsider correlations with the stellar mass surface densitywithin the inner 1 kpc, S1 kpc. We calculate S1 kpc following theprocedure described by Bezanson et al. (2009) and Whitakeret al. (2017) using the galaxies’ best-fit Sérsic indices (n) andcircularized effective radii (reff). In brief, we assume isotropicspherical galaxies with surface luminosity profiles followingthe Sérsic profile to perform an Abel transform to deproject thecircularized, three-dimensional light profile:
ò
rp
=
´-
-
-
¥
⎛⎝⎜
⎞⎠⎟
⎛⎝⎜
⎞⎠⎟
[ ( ) ] ( )
r
r
b I
r
r
r
b r r t
tdt
exp
1. 6
e
n o
e e
n
n en
n
1 1
1
1
2
We convert the total luminosity to total stellar mass, assumingthat mass follows the light, and that there are no strong colorgradients. We follow van Dokkum et al. (2014) by applying asmall correction to these stellar masses to take into account thedifference between the total magnitude in the photometriccatalog and the total magnitude implied by the Sérsic fit (seeTaylor et al. 2010). Finally, we calculate the stellar masssurface density in the inner 1 kpc by numerically integrating thefollowing equation:
ò
ò
r
rS = ¥
( )
( ) ( )( )
r r dr
r r dr
L
L
M
1 kpc, 71 kpc
0
1 kpc 2
02
model
phot
phot
4
33
where Mphot is the stellar mass of the galaxy from the ZFOURGEcatalogs, Lphot is the total, aperture-corrected luminosity from theZFOURGE catalogs in the bandpass corresponding to the Sérsicprofile measurement (H160), and Lmodel is the total luminosity asmeasured from integrating the best-fit Sérsic profile.
Figure 15 shows the cumulative distributions of the Sérsicindex (n), effective radius (re), axis ratio (b/a), and stellar masssurface density in the inner 1 kpc (S1 kpc) for quiescent galaxiesand star-forming galaxies at < <z0.5 1.0 in the lowest andhighest overdensity quartiles for three stellar mass bins. In allcases, we find that there is no statistical difference in thedistributions of quiescent galaxies in high-density and low-density environments. Similarly, we find that the morphologydistributions of star-forming galaxies and quiescent galaxies inthe highest-density regions are dissimilar (therefore, quiescentgalaxies in high-density regions do not have the morphologiesof (recently quenched) star-forming galaxies). We use thesedistributions in Section 5.2 (see also Figure 12). Note that wedo not show our higher redshift bins in the figures, but we findthe same results in all bins of mass and redshift.
ORCID iDs
Lalitwadee Kawinwanichakij https://orcid.org/0000-0003-4032-2445Casey Papovich https://orcid.org/0000-0001-7503-8482
Ryan F. Quadri https://orcid.org/0000-0003-0341-8827Karl Glazebrook https://orcid.org/0000-0002-3254-9044Rebecca J. Allen https://orcid.org/0000-0002-7278-9528Eric F. Bell https://orcid.org/0000-0002-5564-9873Avishai Dekel https://orcid.org/0000-0003-4174-0374Henry C. Ferguson https://orcid.org/0000-0001-7113-2738Ben Forrest https://orcid.org/0000-0001-6003-0541Norman A. Grogin https://orcid.org/0000-0001-9440-8872Yicheng Guo https://orcid.org/0000-0003-2775-2002Anton M. Koekemoer https://orcid.org/0000-0002-6610-2048Ray A. Lucas https://orcid.org/0000-0003-1581-7825Themiya Nanayakkara https://orcid.org/0000-0003-2804-0648Lee R. Spitler https://orcid.org/0000-0001-5185-9876Caroline M. S. Straatman https://orcid.org/0000-0001-5937-4590Kim-Vy H. Tran https://orcid.org/0000-0001-9208-2143Adam Tomczak https://orcid.org/0000-0003-2008-1752
References
Abadi, M. G., Moore, B., & Bower, R. G. 1999, MNRAS, 308, 947Abramson, A., Kenney, J. D. P., Crowl, H. H., et al. 2011, AJ, 141, 164Allen, R. J., Kacprzak, G. G., Glazebrook, K., et al. 2016, ApJ, 826, 60Baldry, I. K., Balogh, M. L., Bower, R. G., et al. 2006, MNRAS, 373, 469Baldry, I. K., Glazebrook, K., Brinkmann, J., et al. 2004, ApJ, 600, 681Balogh, M., Eke, V., Miller, C., et al. 2004, MNRAS, 348, 1355Balogh, M. L., McGee, S. L., Mok, A., et al. 2016, MNRAS, 456, 4364Balogh, M. L., Morris, S. L., Yee, H. K. C., Carlberg, R. G., & Ellingson, E.
1997, ApJL, 488, L75Balogh, M. L., Navarro, J. F., & Morris, S. L. 2000, ApJ, 540, 113Barro, G., Faber, S. M., Koo, D. C., et al. 2017, ApJ, 840, 47Barro, G., Faber, S. M., Perez-Gonzalez, P. G., et al. 2012, ApJ, 765, 104Bassett, R., Papovich, C., Lotz, J. M., et al. 2013, ApJ, 770, 58Bell, E. F. 2008, ApJ, 682, 355Bell, E. F., van der Wel, A., Papovich, C., et al. 2012, ApJ, 753, 167Bezanson, R., van Dokkum, P. G., Tal, T., et al. 2009, ApJ, 697, 1290Birnboim, Y., & Dekel, A. 2003, MNRAS, 345, 349Birnboim, Y., Dekel, A., & Neistein, E. 2007, MNRAS, 380, 339Blanton, M. R., & Moustakas, J. 2009, ARA&A, 47, 159Bower, R. G., Benson, A. J., Malbon, R., et al. 2006, MNRAS, 370, 645Brammer, G. B., van Dokkum, P. G., & Coppi, P. 2008, ApJ, 686, 1503Carollo, C. M., Bschorr, T. J., Renzini, A., et al. 2013, ApJ, 773, 112Carollo, C. M., Cibinel, A., Lilly, S. J., et al. 2016, ApJ, 818, 180Cattaneo, A., Dekel, A., Devriendt, J., Guiderdoni, B., & Blaizot, J. 2006,
MNRAS, 370, 1651Chabrier, G. 2003, PASP, 115, 763Cheung, E., Faber, S. M., Koo, D. C., et al. 2012, ApJ, 760, 131Chung, A., van Gorkom, J. H., Kenney, J. D. P., & Vollmer, B. 2007, ApJL,
659, L115Chuter, R. W., Almaini, O., Hartley, W. G., et al. 2011, MNRAS, 413, 1678Cooper, M. C., Coil, A. L., Gerke, B. F., et al. 2010, MNRAS, 409, 337Cooper, M. C., Griffith, R. L., Newman, J. A., et al. 2012, MNRAS, 419,
3018Cooper, M. C., Newman, J. A., Coil, A. L., et al. 2007, MNRAS, 376, 1445Cooper, M. C., Newman, J. A., Madgwick, D. S., et al. 2005, ApJ, 634, 833Cowan, N. B., & Ivezić, Ž. 2008, ApJL, 674, L13Croton, D. J., & Farrar, G. R. 2008, MNRAS, 386, 2285Croton, D. J., Farrar, G. R., Norberg, P., et al. 2005, MNRAS, 356, 1155Croton, D. J., Springel, V., White, S. D. M., et al. 2006, MNRAS, 365, 11Cucciati, O., Iovino, A., Kovač, K., et al. 2010, A&A, 524, A2Cucciati, O., Iovino, A., Marinoni, C., et al. 2006, A&A, 458, 39Darvish, B., Mobasher, B., Sobral, D., et al. 2016, ApJ, 825, 113Davies, L. J. M., Robotham, A. S. G., Driver, S. P., et al. 2015, MNRAS,
452, 616Davies, L. J. M., Robotham, A. S. G., Driver, S. P., et al. 2016, MNRAS,
455, 4013Davis, M., & Geller, M. J. 1976, ApJ, 208, 13Dekel, A., & Birnboim, Y. 2006, MNRAS, 368, 2Dekel, A., & Burkert, A. 2014, MNRAS, 438, 1870Dekel, A., & Silk, J. 1986, ApJ, 303, 39
20
The Astrophysical Journal, 847:134 (21pp), 2017 October 1 Kawinwanichakij et al.
Delaye, L., Huertas-Company, M., Mei, S., et al. 2014, MNRAS, 441, 203Dressler, A. 1980, ApJ, 236, 351Fakhouri, O., & Ma, C.-P. 2009, MNRAS, 394, 1825Fang, J. J., Faber, S. M., Koo, D. C., & Dekel, A. 2013, ApJ, 776, 63Feigelson, E. D., & Babu, G. J. 2012, Modern Statistical Methods for
Astronomy (Cambridge: Cambridge Univ. Press)Fillingham, S. P., Cooper, M. C., Pace, A. B., et al. 2016, MNRAS, 463, 1916Fillingham, S. P., Cooper, M. C., Wheeler, C., et al. 2015, MNRAS, 454, 2039Forrest, B., Tran, K.-V. H., Broussard, A., et al. 2017, ApJL, 838, L12Fossati, M., Wilman, D. J., Mendel, J. T., et al. 2017, ApJ, 835, 153Franx, M., van Dokkum, P. G., Förster Schreiber, N. M., et al. 2008, ApJ,
688, 770Gabor, J. M., & Davé, R. 2015, MNRAS, 447, 374Gabor, J. M., Davé, R., Oppenheimer, B. D., & Finlator, K. 2011, MNRAS,
417, 2676Geha, M., Blanton, M. R., Yan, R., & Tinker, J. L. 2012, ApJ, 757, 85Geha, M., Wechsler, R. H., Mao, Y.-Y., et al. 2017, ApJ, 847, 4Giacconi, R., Zirm, A., Wang, J., et al. 2002, ApJS, 139, 369Granato, G. L., De Zotti, G., Silva, L., Bressan, A., & Danese, L. 2004, ApJ,
600, 580Grogin, N. A., Kocevski, D. D., Faber, S. M., et al. 2011, ApJS, 197, 35Gunn, J. E., & Gott, J. R., III 1972, ApJ, 176, 1Guo, Y., Bell, E. F., Lu, Y., et al. 2017, ApJL, 841, L22Hartley, W. G., Conselice, C. J., Mortlock, A., Foucaud, S., & Simpson, C.
2015, MNRAS, 451, 1613Hatfield, P. W., & Jarvis, M. J. 2016, arXiv:1606.08989Henriques, B. M. B., White, S. D. M., Thomas, P. A., et al. 2015, MNRAS,
451, 2663Hogg, D. W., Blanton, M. R., Brinchmann, J., et al. 2004, ApJL, 601, L29Hogg, D. W., Blanton, M. R., Eisenstein, D. J., et al. 2003, ApJL, 585, L5Jian, H.-Y., Lin, L., Oguri, M., et al. 2017, arXiv:1704.06219Kauffmann, G., Heckman, T. M., White, S. D. M., et al. 2003, MNRAS,
341, 54Kauffmann, G., Li, C., & Heckman, T. M. 2010, MNRAS, 409, 491Kauffmann, G., Li, C., Zhang, W., & Weinmann, S. 2013, MNRAS, 430, 1447Kauffmann, G., White, S. D. M., Heckman, T. M., et al. 2004, MNRAS,
353, 713Kawata, D., & Mulchaey, J. S. 2008, ApJL, 672, L103Kawinwanichakij, L., Quadri, R. F., Papovich, C., et al. 2016, ApJ, 817, 9Kenney, J. D. P., Abramson, A., & Bravo-Alfaro, H. 2015, AJ, 150, 59Kenney, J. D. P., & Koopmann, R. A. 1999, AJ, 117, 181Kereš, D., Katz, N., Weinberg, D. H., & Davé, R. 2005, MNRAS, 363, 2Knobel, C., Lilly, S. J., Woo, J., & Kovač, K. 2015, ApJ, 800, 24Koekemoer, A. M., Faber, S. M., Ferguson, H. C., et al. 2011, ApJS, 197, 36Kovač, K., Lilly, S. J., Knobel, C., et al. 2010, ApJ, 718, 86Kovač, K., Lilly, S. J., Knobel, C., et al. 2014, MNRAS, 438, 717Kriek, M., van Dokkum, P. G., Labbé, I., et al. 2009, ApJ, 700, 221Lake, G., Katz, N., & Moore, B. 1998, ApJ, 495, 152Lang, P., Wuyts, S., Somerville, R. S., et al. 2014, ApJ, 788, 11Lani, C., Almaini, O., Hartley, W. G., et al. 2013, MNRAS, 435, 207Larson, R. B. 1974, MNRAS, 169, 229Larson, R. B., Tinsley, B. M., & Caldwell, C. N. 1980, ApJ, 237, 692Lawrence, A., Warren, S. J., Almaini, O., et al. 2007, MNRAS, 379, 1599Lee, S.-K., Im, M., Kim, J.-W., et al. 2015, ApJ, 810, 90Lilly, S. J., & Carollo, C. M. 2016, ApJ, 833, 1Lin, L., Jian, H.-Y., Foucaud, S., et al. 2014, ApJ, 782, 33Lotz, J. M., Papovich, C., Faber, S. M., et al. 2013, ApJ, 773, 154Madau, P., & Dickinson, M. 2014, ARA&A, 52, 415Man, A. W. S., Zirm, A. W., & Toft, S. 2016, ApJ, 830, 89McCarthy, I. G., Frenk, C. S., Font, A. S., et al. 2008, MNRAS, 383, 593McGee, S. L., Bower, R. G., & Balogh, M. L. 2014, MNRAS, 442, L105Morishita, T., Abramson, L. E., Treu, T., et al. 2017, ApJ, 835, 254Muldrew, S. I., Croton, D. J., Skibba, R. A., et al. 2012, MNRAS, 419, 2670Muzzin, A., Wilson, G., Yee, H. K. C., et al. 2012, ApJ, 746, 188Nanayakkara, T., Glazebrook, K., Kacprzak, G. G., et al. 2016, ApJ, 828, 21Nantais, J. B., Muzzin, A., van der Burg, R. F. J., et al. 2017, MNRAS,
465, L104
Newman, A. B., Ellis, R. S., Andreon, S., et al. 2014, ApJ, 788, 51Ng, P., & Maechler, M. 2007, Statistical Modelling, 7, 315Oemler, A., Jr. 1974, ApJ, 194, 1Omand, C. M. B., Balogh, M. L., & Poggianti, B. M. 2014, MNRAS, 440, 843Oosterloo, T., & van Gorkom, J. 2005, A&A, 437, L19Papovich, C., Bassett, R., Lotz, J. M., et al. 2012, ApJ, 750, 93Papovich, C., Labbé, I., Quadri, R., et al. 2015, ApJ, 803, 26Patel, S. G., Holden, B. P., Kelson, D. D., et al. 2012, ApJL, 748, L27Peng, Y., Lilly, S. J., Kovac, K., et al. 2010, ApJ, 721, 193Peng, Y., Maiolino, R., & Cochrane, R. 2015, Natur, 521, 192Phillips, J. I., Wheeler, C., Boylan-Kolchin, M., et al. 2014, MNRAS,
437, 1930Phillips, J. I., Wheeler, C., Cooper, M. C., et al. 2015, MNRAS, 447, 698Quadri, R. F., Williams, R. J., Franx, M., & Hildebrandt, H. 2012, ApJ, 744, 88Read, J. I., Wilkinson, M. I., Evans, N. W., Gilmore, G., & Kleyna, J. T. 2006,
MNRAS, 366, 429Rees, M. J., & Ostriker, J. P. 1977, MNRAS, 179, 541Rudnick, G. H., Tran, K.-V., Papovich, C., Momcheva, I., & Willmer, C. 2012,
ApJ, 755, 14Schawinski, K., Urry, C. M., Simmons, B. D., et al. 2014, MNRAS, 440, 889Scoville, N., Aussel, H., Brusa, M., et al. 2007, ApJS, 172, 1Slater, C. T., & Bell, E. F. 2014, ApJ, 792, 141Sobral, D., Best, P. N., Smail, I., et al. 2011, MNRAS, 411, 675Somerville, R. S., Hopkins, P. F., Cox, T. J., Robertson, B. E., & Hernquist, L.
2008, MNRAS, 391, 481Spitler, L. R., Labbé, I., Glazebrook, K., et al. 2012, ApJL, 748, L21Springel, V., Di Matteo, T., & Hernquist, L. 2005, MNRAS, 361, 776Straatman, C. M. S., Spitler, L. R., Quadri, R. F., et al. 2016, ApJ, 830, 51Strateva, I., Ivezić, Ž, Knapp, G. R., et al. 2001, AJ, 122, 1861Sun, M., Donahue, M., & Voit, G. M. 2007, ApJ, 671, 190Szomoru, D., Franx, M., & van Dokkum, P. G. 2012, ApJ, 749, 121Tacchella, S., Dekel, A., Carollo, C. M., et al. 2016a, MNRAS, 458, 242Tacchella, S., Dekel, A., Carollo, C. M., et al. 2016b, MNRAS, 457, 2790Taylor, E. N., Franx, M., Glazebrook, K., et al. 2010, ApJ, 720, 723Terrazas, B. A., Bell, E. F., Henriques, B. M. B., et al. 2016, ApJL, 830
L12Tinker, J. L., & Wetzel, A. R. 2010, ApJ, 719, 88Tomczak, A. R., Quadri, R. F., Tran, K.-V. H., et al. 2016, ApJ, 817, 118Tran, K.-V. H., Papovich, C., Saintonge, A., et al. 2010, ApJL, 719, L126van den Bosch, F. C., Aquino, D., Yang, X., et al. 2008, MNRAS, 387, 79van der Wel, A., Bell, E. F., Haussler, B., et al. 2012, ApJS, 203, 24van Dokkum, P. G., Bezanson, R., van der Wel, A., et al. 2014, ApJ, 791,
45van Dokkum, P. G., Brammer, G., Fumagalli, M., et al. 2011, ApJL, 743, L15Ivezić, Ž, Vivas, A. K., Lupton, R. H., & Zinn, R. 2005, AJ, 129, 1096Vollmer, B., Soida, M., Braine, J., et al. 2012, A&A, 537, A143Weinmann, S. M., Kauffmann, G., van den Bosch, F. C., et al. 2009, MNRAS,
394, 1213Weinmann, S. M., van den Bosch, F. C., Yang, X., & Mo, H. J. 2006,
MNRAS, 366, 2Weisz, D. R., Dolphin, A. E., Skillman, E. D., et al. 2015, ApJ, 804, 136Wetzel, A. R., Tollerud, E. J., & Weisz, D. R. 2015, ApJL, 808, L27Whitaker, K. E., Bezanson, R., van Dokkum, P. G., et al. 2017, ApJ, 838, 19White, S. D. M., & Rees, M. J. 1978, MNRAS, 183, 341Williams, R. J., Quadri, R. F., Franx, M., van Dokkum, P., & Labbé, I. 2009,
ApJ, 691, 1879Woo, J., Carollo, C. M., Faber, S. M., Dekel, A., & Tacchella, S. 2017a,
MNRAS, 464, 1077Woo, J., Carollo, C. M., Faber, S. M., Dekel, A., & Tacchella, S. 2017b,
MNRAS, 464, 1077Woo, J., Dekel, A., Faber, S. M., et al. 2013, MNRAS, 428, 3306Woo, J., Dekel, A., Faber, S. M., & Koo, D. C. 2015, MNRAS, 448, 237Wuyts, S., Förster Schreiber, N. M., van der Wel, A., et al. 2011, ApJ, 742, 96Xu, C. K., Zhao, Y., Scoville, N., et al. 2012, ApJ, 747, 85Yuan, T., Nanayakkara, T., Kacprzak, G. G., et al. 2014, ApJL, 795, L20Zirm, A. W., Toft, S., & Tanaka, M. 2012, ApJ, 744, 181Zolotov, A., Dekel, A., Mandelker, N., et al. 2015, MNRAS, 450, 2327
21
The Astrophysical Journal, 847:134 (21pp), 2017 October 1 Kawinwanichakij et al.