Effect of layer thickness on irreversible thermal ... · Effect of layer thickness on irreversible...
15
Effect of layer thickness on irreversible thermal expansion and interlayer strength in fused deposition modeling Anthony D’Amico, Analise Debaie, Amy M. Peterson Department of Chemical Engineering, Worcester Polytechnic Institute, Worcester, Massachusetts, USA Abstract Purpose – Examine the impact of layer thickness on irreversible thermal expansion, residual stress, and mechanical properties of additively manufactured parts. Design/methodology/approach – Samples were printed at several layer thicknesses and their irreversible thermal expansion, tensile strength, and flexural strength were determined. Findings – Irreversible thermal strain increases with decreasing layer thickness, up to 22% strain. Tensile and flexural strengths exhibited a peak at a layer thickness of 200 μm, although the maximum was not statistically significant at a 95% confidence interval. Tensile strength was 54% to 97% of reported values for injection molded ABS and 29% to 73% of those reported for bulk ABS. Flexural strength was 18% to 41% of reported flexural strength for bulk ABS. Practical Implications – The large irreversible thermal strain exhibited and corresponding residual stresses could lead to failure of additively manufactured parts over time. Additionally, the observed irreversible thermal strains could enable thermally responsive shape in additively manufactured parts. Variation in mechanical properties with layer thickness will also affect manufactured parts. Originality/value – Tailorable irreversible thermal strain of this magnitude has not been previously reported for additively manufactured parts. This strain occurs in parts made with both high-end and consumer grade FDM machines. Additionally, the impact of layer thickness on tensile and flexural properties of additively manufactured parts has received limited attention in the literature. Keywords Additive Manufacturing, Fused Deposition Modeling, Thermal Strain, Residual Stress, Layer Thickness Paper Type Research Paper 1. Introduction Additive manufacturing (AM) has drawn interest from fields ranging from aerospace to tissue engineering and regenerative medicine (TERM) to metamaterials. Within the aerospace industry, GE is currently building a factory to manufacture fuel nozzles for jet engines using additive manufacturing. Because AM can create complex internal geometries, the nozzle can be made with fewer parts, reducing the number of connections by 80% and increasing durability (Kellner, 2016). Scaffolds for TERM applications benefit from the customizability and internal geometric complexity afforded additively manufactured parts. Researchers have been able to use multi-material AM to incorporate vasculature in tissue constructs (Kolesky et al., 2014; Wu et al., 2011), a necessary step for providing nutrients to scaffolds. One of the goals of TERM is printing organs containing a patient’s own cells, which reduces the potential of rejection by the immune system. AM opens the possibility of being able to print organs that match the size and shape of patients’ organs, improving outcomes for patients. Research has also demonstrated the viability of using fine structural control to create materials with properties not found in nature, or metamaterials (Babaee et al., 2013; Lee et al., 2012; Zheng et al., 2014). Industrial interest in AM is not limited to these specific examples: As of 2014, 67% of industrial manufacturers in the US used AM in some form and another 25% have plans to use it in the future (Pricewaterhouse Coopers, 2014). A wide range of polymer AM methods are available, including: stereolithography (SLA), fused deposition modeling (FDM), powder- and binder-based three dimensional printing, and
Transcript of Effect of layer thickness on irreversible thermal ... · Effect of layer thickness on irreversible...
Effect of layer thickness on irreversible thermal expansion and interlayer strength in fused
deposition modeling
Anthony D’Amico, Analise Debaie, Amy M. Peterson
Department of Chemical Engineering, Worcester Polytechnic Institute, Worcester,
Massachusetts, USA
Abstract
Purpose – Examine the impact of layer thickness on irreversible thermal expansion, residual stress, and mechanical
properties of additively manufactured parts.
Design/methodology/approach – Samples were printed at several layer thicknesses and their irreversible thermal
expansion, tensile strength, and flexural strength were determined.
Findings – Irreversible thermal strain increases with decreasing layer thickness, up to 22% strain. Tensile and
flexural strengths exhibited a peak at a layer thickness of 200 μm, although the maximum was not statistically
significant at a 95% confidence interval. Tensile strength was 54% to 97% of reported values for injection molded
ABS and 29% to 73% of those reported for bulk ABS. Flexural strength was 18% to 41% of reported flexural
strength for bulk ABS.
Practical Implications – The large irreversible thermal strain exhibited and corresponding residual stresses could
lead to failure of additively manufactured parts over time. Additionally, the observed irreversible thermal strains
could enable thermally responsive shape in additively manufactured parts. Variation in mechanical properties with
layer thickness will also affect manufactured parts.
Originality/value – Tailorable irreversible thermal strain of this magnitude has not been previously reported for
additively manufactured parts. This strain occurs in parts made with both high-end and consumer grade FDM
machines. Additionally, the impact of layer thickness on tensile and flexural properties of additively manufactured
parts has received limited attention in the literature.
Keywords Additive Manufacturing, Fused Deposition Modeling, Thermal Strain, Residual Stress, Layer Thickness
Paper Type Research Paper
1. Introduction
Additive manufacturing (AM) has drawn interest from fields ranging from aerospace to
tissue engineering and regenerative medicine (TERM) to metamaterials. Within the aerospace
industry, GE is currently building a factory to manufacture fuel nozzles for jet engines using
additive manufacturing. Because AM can create complex internal geometries, the nozzle can be
made with fewer parts, reducing the number of connections by 80% and increasing durability
(Kellner, 2016). Scaffolds for TERM applications benefit from the customizability and internal
geometric complexity afforded additively manufactured parts. Researchers have been able to use
multi-material AM to incorporate vasculature in tissue constructs (Kolesky et al., 2014; Wu et al.,
2011), a necessary step for providing nutrients to scaffolds. One of the goals of TERM is printing
organs containing a patient’s own cells, which reduces the potential of rejection by the immune
system. AM opens the possibility of being able to print organs that match the size and shape of
patients’ organs, improving outcomes for patients. Research has also demonstrated the viability of
using fine structural control to create materials with properties not found in nature, or
metamaterials (Babaee et al., 2013; Lee et al., 2012; Zheng et al., 2014). Industrial interest in AM
is not limited to these specific examples: As of 2014, 67% of industrial manufacturers in the US
used AM in some form and another 25% have plans to use it in the future (Pricewaterhouse
Coopers, 2014).
A wide range of polymer AM methods are available, including: stereolithography (SLA),
fused deposition modeling (FDM), powder- and binder-based three dimensional printing, and

selective laser sintering (SLS) (Kumar and Kruth, 2010; Pham and Gault, 1998). 3D bioprinting,
a subset of FDM, has also been used to print multiple materials within a single sample, including
cells, extracellular matrix, and removable support materials (Barry et al., 2009; Guilak et al., 2015;
Hanson Shepherd et al., 2011; Kolesky et al., 2014; Wu et al., 2011). Although most polymer AM
is used to create small scale parts, Oak Ridge National Laboratory has demonstrated large-scale,
polymer composite AM by printing a car via FDM ("Oak Ridge National Labs- 3D Printed Car",
2016).
In addition to a range of methods, polymer AM can be performed with a wide range of
materials. FDM commonly uses acrylonitrile butadiene styrene (ABS) and polylactic acid (PLA).
High impact polystyrene (HIPS) and poly(vinyl alcohol) (PVA) filaments are commercially
available and enable printing of dissolvable support elements. Polycarbonate, polycaprolactone,
nylon, poly(ether ether ketone) (PEEK), and poly(ether ketone ketone) (PEKK) filaments are also
commercially available. Hydrogels have also been shown to be printable (Kolesky et al., 2014;
Wu et al., 2011).
Despite the advantages and interest, broader use of AM is limited by poor mechanical
properties, lack of reliable part printing, and lack of expertise in AM (Pricewaterhouse Coopers,
2014). In many cases, AM parts have inferior properties to identical parts made with traditional
manufacturing methods and exhibit poor interlayer bonding and residual stress (Kantaros and
Karalekas, 2013; Shaffer et al., 2014). Additionally, understanding the processing-structure-
properties relationship is critically important to ensure reproducible, reliable parts. More fully
understanding these relationships may lead to parts with comparable, and ultimately superior,
properties as well as additional functionalities with less manufacturing waste. Li et al.
demonstrated the feasibility of property control in FDM through raster angle control and showed
property variation within a single sample (Li et al., 2002).
In FDM, there are many processing parameters that can be controlled and may affect the
properties of the printed part. Parameters include extruder temperature (Sun et al., 2008; Yang et
al., 2015), print bed and ambient temperatures (Sun et al., 2008), print speed (Yang et al., 2015),
print orientation (Chuang et al., 2015; Lee et al., 2007; Sood et al., 2009; Sun et al., 2008;
Thrimurthulu et al., 2004), layer-to-layer orientation (Li et al., 2002; Sood et al., 2009; Vega et al.,
2011), layer thickness (Sood et al., 2009), filament diameter (Chuang et al., 2015), nozzle
diameter, and air gap (Sood et al., 2009). Additionally, filament composition is vitally important
to resulting properties (Chuang et al., 2015; Nikzad et al., 2011; Tekinalp et al., 2014).
Property anisotropy and decreased performance due to residual stress have been repeatedly
observed in additively manufactured polymers (Cooke et al., 2011; Lee et al., 2007; Shaffer et al.,
2014). Lee et al. reported that the compressive strength of FDM parts depended on build
orientation, while Ahn et al. observed that the tensile strength of FDM parts depended on air gap
and raster orientation (Ahn et al., 2002; Lee et al., 2007). Residual stress was found to be dependent
on both raster orientation and layer thickness (Kantaros and Karalekas, 2013). Specimens prepared
via SLS have also demonstrated orientation-dependent dimensional accuracy, density, and tensile
strength (Caulfield et al., 2007).
Residual stress buildup is commonly seen in composite systems due to mismatches in
coefficients of thermal expansion (CTE). In FDM printed polymers, similar mismatches of CTE
can arise when a molten polymer is printed on top of a glassy polymer. The molten polymer will
shrink significantly more upon cooling from its extrusion temperature down to the steady-state
temperature than the glassy polymer will when its temperature rises upon addition of a molten
layer and subsequently cools to its steady-state temperature (Sun et al., 2008).
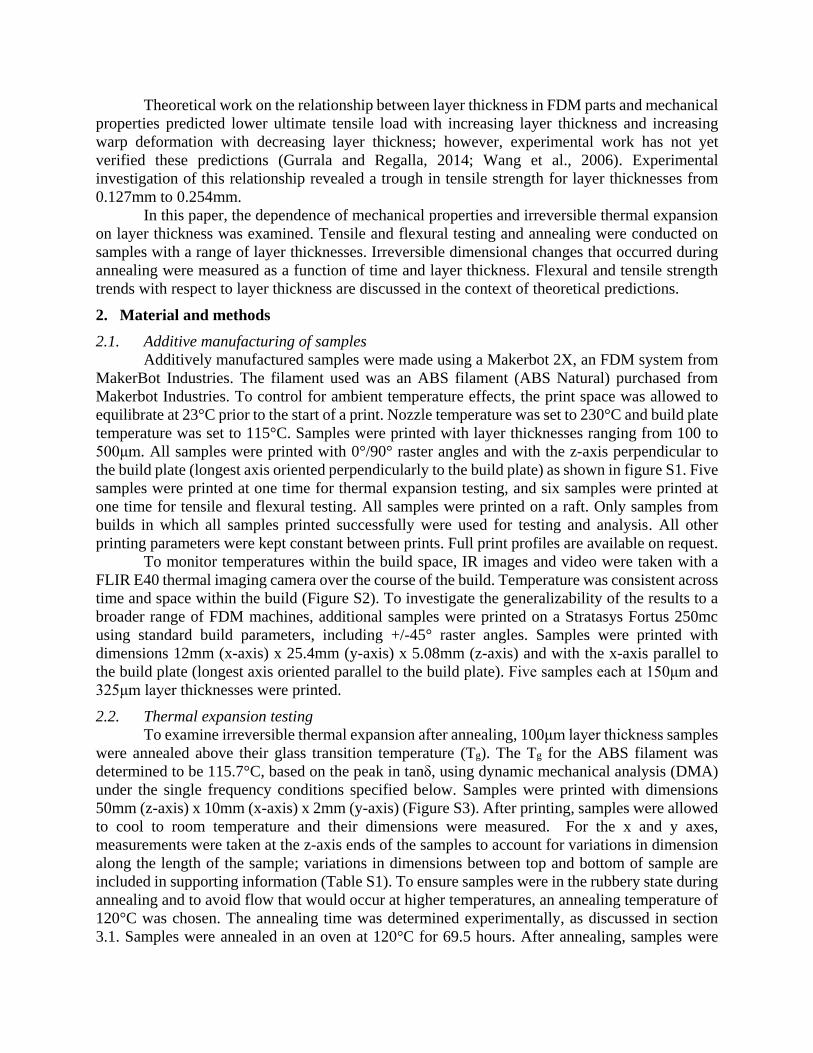
Theoretical work on the relationship between layer thickness in FDM parts and mechanical
properties predicted lower ultimate tensile load with increasing layer thickness and increasing
warp deformation with decreasing layer thickness; however, experimental work has not yet
verified these predictions (Gurrala and Regalla, 2014; Wang et al., 2006). Experimental
investigation of this relationship revealed a trough in tensile strength for layer thicknesses from
0.127mm to 0.254mm.
In this paper, the dependence of mechanical properties and irreversible thermal expansion
on layer thickness was examined. Tensile and flexural testing and annealing were conducted on
samples with a range of layer thicknesses. Irreversible dimensional changes that occurred during
annealing were measured as a function of time and layer thickness. Flexural and tensile strength
trends with respect to layer thickness are discussed in the context of theoretical predictions.
2. Material and methods
2.1. Additive manufacturing of samples
Additively manufactured samples were made using a Makerbot 2X, an FDM system from
MakerBot Industries. The filament used was an ABS filament (ABS Natural) purchased from
Makerbot Industries. To control for ambient temperature effects, the print space was allowed to
equilibrate at 23°C prior to the start of a print. Nozzle temperature was set to 230°C and build plate
temperature was set to 115°C. Samples were printed with layer thicknesses ranging from 100 to
500μm. All samples were printed with 0°/90° raster angles and with the z-axis perpendicular to
the build plate (longest axis oriented perpendicularly to the build plate) as shown in figure S1. Five
samples were printed at one time for thermal expansion testing, and six samples were printed at
one time for tensile and flexural testing. All samples were printed on a raft. Only samples from
builds in which all samples printed successfully were used for testing and analysis. All other
printing parameters were kept constant between prints. Full print profiles are available on request.
To monitor temperatures within the build space, IR images and video were taken with a
FLIR E40 thermal imaging camera over the course of the build. Temperature was consistent across
time and space within the build (Figure S2). To investigate the generalizability of the results to a
broader range of FDM machines, additional samples were printed on a Stratasys Fortus 250mc
using standard build parameters, including +/-45° raster angles. Samples were printed with
dimensions 12mm (x-axis) x 25.4mm (y-axis) x 5.08mm (z-axis) and with the x-axis parallel to
the build plate (longest axis oriented parallel to the build plate). Five samples each at 150μm and
325μm layer thicknesses were printed.
2.2. Thermal expansion testing
To examine irreversible thermal expansion after annealing, 100μm layer thickness samples
were annealed above their glass transition temperature (Tg). The Tg for the ABS filament was
determined to be 115.7°C, based on the peak in tanδ, using dynamic mechanical analysis (DMA)
under the single frequency conditions specified below. Samples were printed with dimensions
50mm (z-axis) x 10mm (x-axis) x 2mm (y-axis) (Figure S3). After printing, samples were allowed
to cool to room temperature and their dimensions were measured. For the x and y axes,
measurements were taken at the z-axis ends of the samples to account for variations in dimension
along the length of the sample; variations in dimensions between top and bottom of sample are
included in supporting information (Table S1). To ensure samples were in the rubbery state during
annealing and to avoid flow that would occur at higher temperatures, an annealing temperature of
120°C was chosen. The annealing time was determined experimentally, as discussed in section
3.1. Samples were annealed in an oven at 120°C for 69.5 hours. After annealing, samples were
taken out of the oven and allowed to cool to room temperature, then their dimensions were
measured again. Deformation due to residual thermal stress relief was calculated by
𝜀𝑖𝑟𝑟𝑒𝑣𝑒𝑟𝑠𝑖𝑏𝑙𝑒,𝑡ℎ𝑒𝑟𝑚𝑎𝑙 =𝐿𝑎𝑛𝑛𝑒𝑎𝑙𝑒𝑑−𝐿𝑖𝑛𝑖𝑡𝑖𝑎𝑙
𝐿𝑖𝑛𝑖𝑡𝑖𝑎𝑙 (1)
2.3. Tensile and flexural testing
Tensile and flexural testing were conducted according to ASTM D638 and D790,
respectively. Samples were printed as detailed in section 2.1 with layer thicknesses of 100, 200,
300, and 400μm. All testing was conducted on an Instron 5567A. For tensile testing, samples that
did not break in the narrow section of the dogbone were not included for further analysis.
Additional batches of samples were printed and tested until at least five samples could be analyzed
for each layer thickness. Sample dimensions and geometry were consistent with ASTM D638-
Type V (Figure S4). A 10mm/min strain rate was used for all samples. From these results, failure
stress was calculated as the maximum force recorded divided by sample cross sectional area. For
flexural testing, six samples were tested per layer thickness at a crosshead displacement rate of
1.365mm/min. Flexural strength was calculated as the maximum force recorded divided by the
sample cross sectional area.
2.4. Dynamic Mechanical Analysis
DMA was performed to determine the Tg of the ABS used and to examine the viscoelastic
nature of the samples produced. Dual cantilever geometry specimens with dimensions: 50mm (z-
axis) x 10mm (x-axis) x 2mm (y-axis) (Figure S3) were tested on a Netzsch DMA 242. Single
frequency testing was performed on a 100μm layer thickness sample at 1.00Hz from 25°C to 120°C
at 2°C/min. Multifrequency DMA was conducted on a 110μm layer thickness sample using 0.010,
0.033, 0.100, 0.333, 1.00, 3.33, 10.0, and 33.3Hz frequencies 25°C to 130°C with 3°C intervals.
3. Results and Discussion
3.1. Irreversible Thermal Strain
FDM printed samples were observed to expand in the direction perpendicular to the printed
layer upon annealing above Tg (Figure 1b). Sample deformation was expected due to residual
stresses present in FDM parts. Previous work has shown that FDM parts relieve stress during
printing through deformation (Wang et al., 2006) and that finished parts still have residual stresses
that may be relieved by annealing above Tg (Kantaros and Karalekas, 2013). Because stress is
relieved through deformation, it was expected that deformation would be present in annealed
samples. However, strains of this magnitude had not previously been reported for FDM parts.
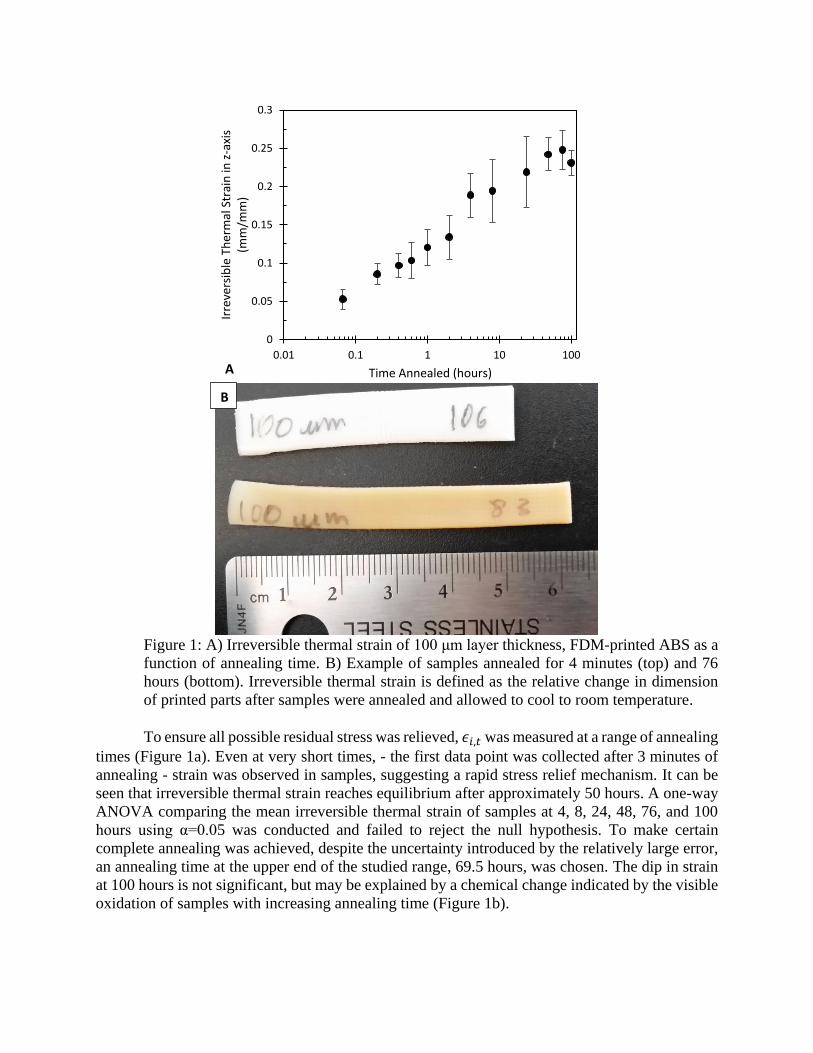
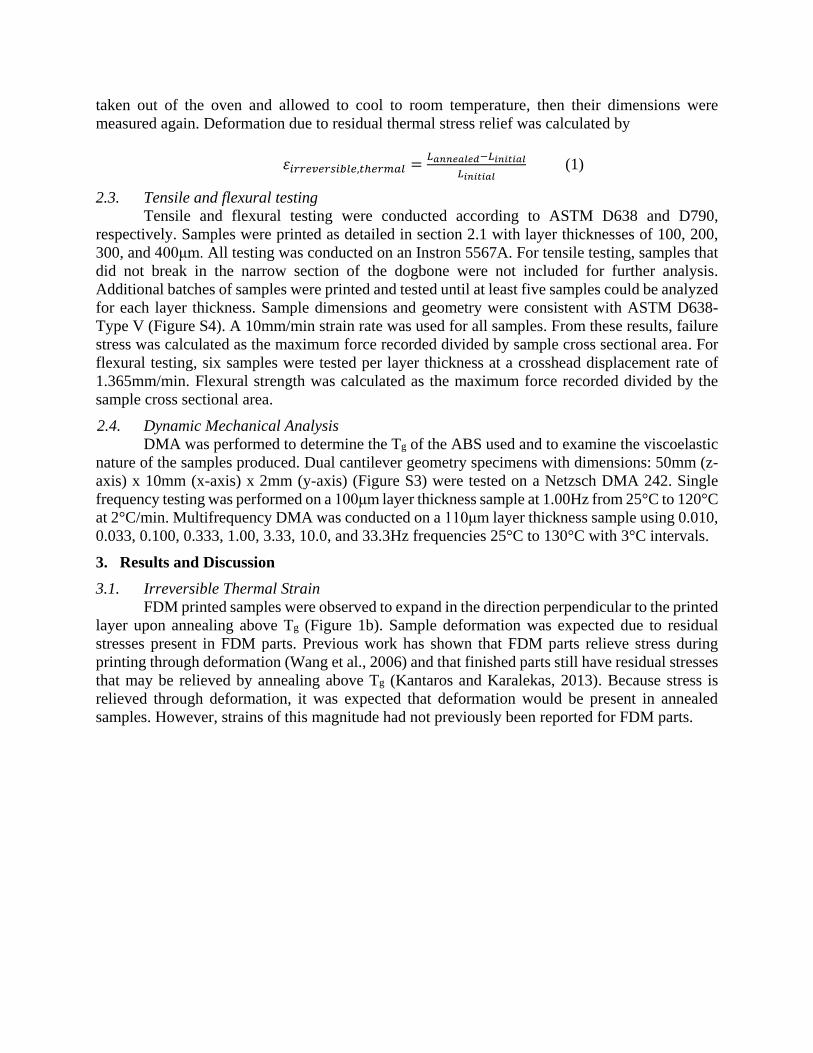
Figure 1: A) Irreversible thermal strain of 100 μm layer thickness, FDM-printed ABS as a
function of annealing time. B) Example of samples annealed for 4 minutes (top) and 76
hours (bottom). Irreversible thermal strain is defined as the relative change in dimension
of printed parts after samples were annealed and allowed to cool to room temperature.
To ensure all possible residual stress was relieved, 𝜖𝑖,𝑡 was measured at a range of annealing
times (Figure 1a). Even at very short times, - the first data point was collected after 3 minutes of
annealing - strain was observed in samples, suggesting a rapid stress relief mechanism. It can be
seen that irreversible thermal strain reaches equilibrium after approximately 50 hours. A one-way
ANOVA comparing the mean irreversible thermal strain of samples at 4, 8, 24, 48, 76, and 100
hours using α=0.05 was conducted and failed to reject the null hypothesis. To make certain
complete annealing was achieved, despite the uncertainty introduced by the relatively large error,
an annealing time at the upper end of the studied range, 69.5 hours, was chosen. The dip in strain
at 100 hours is not significant, but may be explained by a chemical change indicated by the visible
oxidation of samples with increasing annealing time (Figure 1b).
0
0.05
0.1
0.15
0.2
0.25
0.3
0.01 0.1 1 10 100
Irre
vers
ible
Th
erm
al S
trai
n in
z-a
xis
(mm
/mm
)
Time Annealed (hours)A
B
Figure 2: Irreversible thermal strain as a function of layer thickness. As layer thickness
decreases, irreversible thermal strain increases. Error bars represent a 95% confidence
interval.
Figure 2 shows the relationship between irreversible thermal strain and layer thickness.
Irreversible thermal strain increases with decreasing layer thickness, up to 22% strain. Previous
work has predicted (Wang et al., 2006) and shown (Kantaros and Karalekas, 2013) residual stress
buildup in additively manufactured parts due to thermal gradients present during manufacturing.
During FDM, new, high temperature layers are deposited onto previous layers, which are below
Tg. As the new layer cools, its contraction is restricted by contact with the previous layer. The
resultant residual stress is given by: 𝜎𝑡ℎ𝑒𝑟𝑚𝑎𝑙 = 𝐸𝛼Δ𝑇 (2)
where E is the elastic modulus of the material, α is the coefficient of thermal expansion, and ΔT is
the difference between the initial and final temperatures. Above the Tg there is enough system
mobility to allow for chain rearrangement. Amorphous thermoplastics are not expected to build up
residual stresses above Tg (Nairn and Zoller, 1985). Therefore, the new layer, while above Tg, has
sufficient mobility to relieve thermal stress. Residual stress would build up only as the layer cooled
from Tg to ambient temperature. Once the Tg is reached, amorphous polymers become glassy and
residual stresses are developed and cannot be relieved. The amount of residual stress has been
found to increase with cooling rate, which is quite fast in FDM (Dinwiddie et al., 2014; Parlevliet
et al., 2006; Seppala and Migler, 2016; Sun et al., 2008). Polymers also exhibit CTE mismatch
between layers during printing. Above Tg, free volume increases much more rapidly and a
corresponding increased CTE is observed (Menard, 2008). Irreversible thermal strain after
annealing is equal to the thermal strain that was prevented during initial manufacturing.
𝜖𝑡ℎ𝑒𝑟𝑚𝑎𝑙 = 𝛼Δ𝑇 (3)
Thermal strain for ABS on cooling from Tg to Tambient was calculated to be 0.801%; the full
calculation is shown in supplemental information. Measured thermal strains were as much as 27
times this value. Both Figure 1 and evidence in the literature show mobility above Tg is sufficient
to allow stress relief (Kantaros and Karalekas, 2013). However, the time scale for this stress relief
is much longer than the time newly deposited layers remain above Tg during FDM.
0%
5%
10%
15%
20%
25%
0 100 200 300 400 500 600
Irre
vers
ible
Th
erm
al S
trai
n in
z-a
xis
(mm
/mm
)
Layer Thickness (μm)
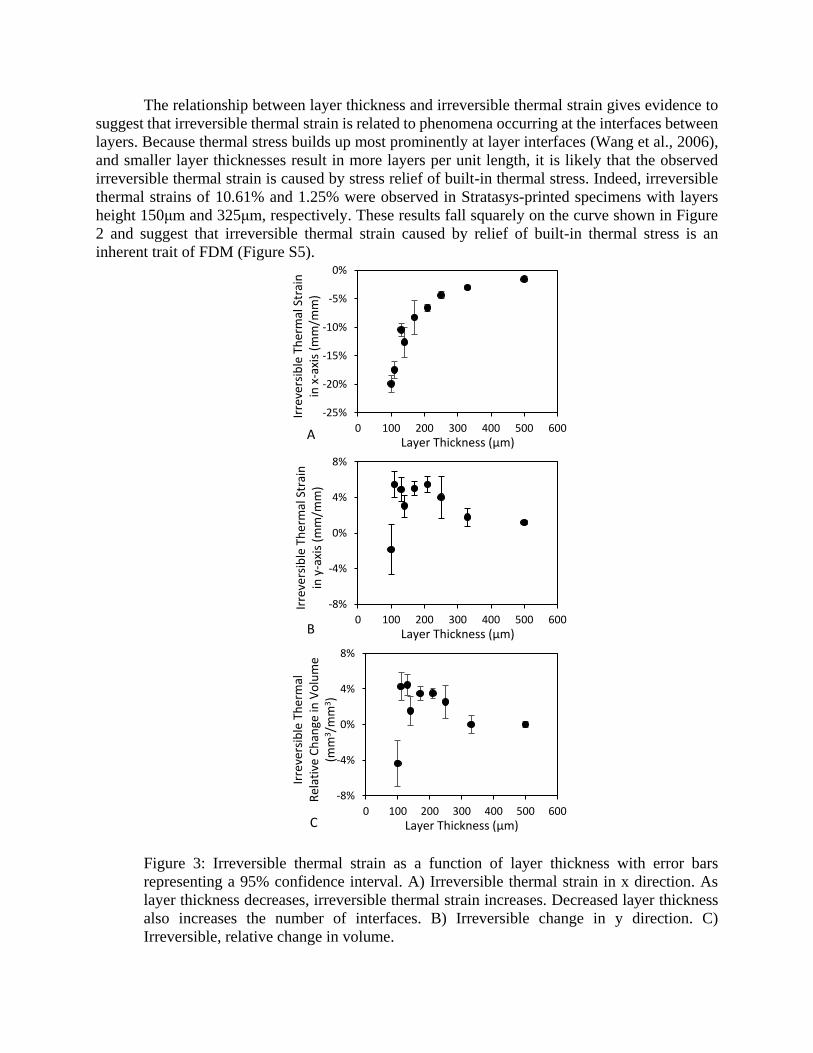
The relationship between layer thickness and irreversible thermal strain gives evidence to
suggest that irreversible thermal strain is related to phenomena occurring at the interfaces between
layers. Because thermal stress builds up most prominently at layer interfaces (Wang et al., 2006),
and smaller layer thicknesses result in more layers per unit length, it is likely that the observed
irreversible thermal strain is caused by stress relief of built-in thermal stress. Indeed, irreversible
thermal strains of 10.61% and 1.25% were observed in Stratasys-printed specimens with layers
height 150μm and 325μm, respectively. These results fall squarely on the curve shown in Figure
2 and suggest that irreversible thermal strain caused by relief of built-in thermal stress is an
inherent trait of FDM (Figure S5).
Figure 3: Irreversible thermal strain as a function of layer thickness with error bars
representing a 95% confidence interval. A) Irreversible thermal strain in x direction. As
layer thickness decreases, irreversible thermal strain increases. Decreased layer thickness
also increases the number of interfaces. B) Irreversible change in y direction. C)
Irreversible, relative change in volume.
-25%
-20%
-15%
-10%
-5%
0%
0 100 200 300 400 500 600
Irre
vers
ible
Th
erm
al S
trai
n
in x
-axi
s (m
m/m
m)
Layer Thickness (μm)A
-8%
-4%
0%
4%
8%
0 100 200 300 400 500 600
Irre
vers
ible
Th
erm
al S
trai
n
in y
-axi
s (m
m/m
m)
Layer Thickness (μm)B
-8%
-4%
0%
4%
8%
0 100 200 300 400 500 600
Irre
vers
ible
Th
erm
al
Rel
ativ
e C
han
ge in
Vo
lum
e (m
m3/m
m3)
Layer Thickness (μm)C
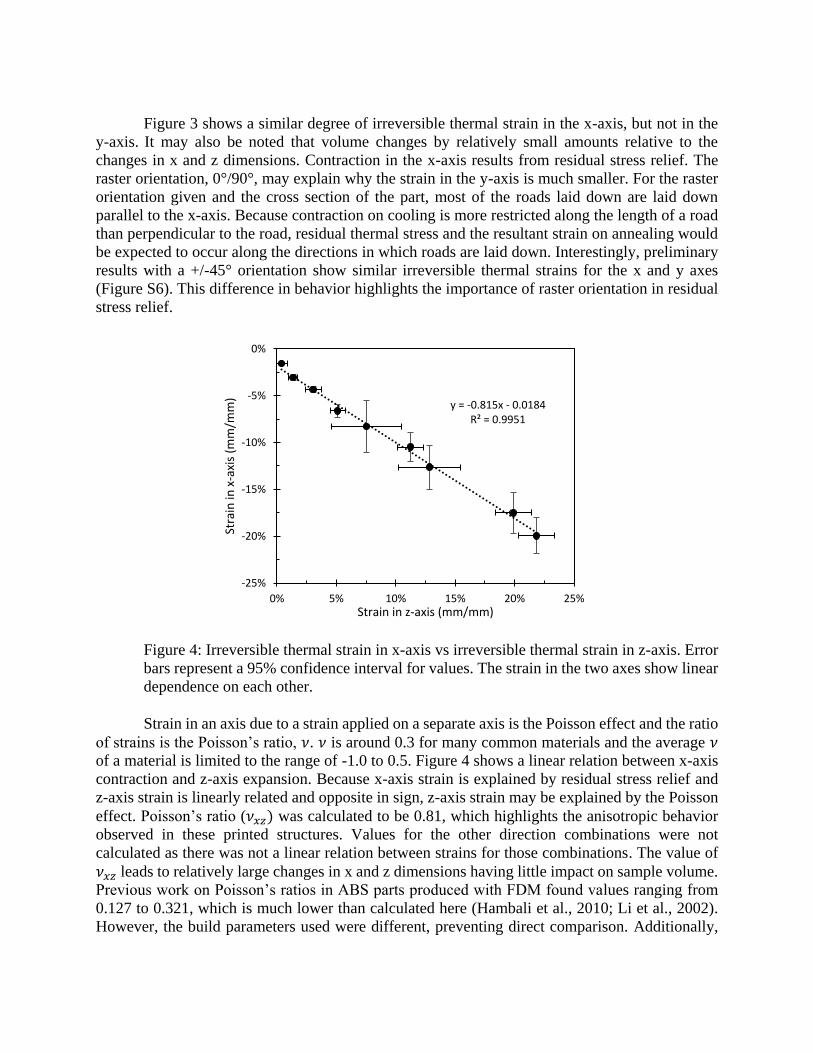
Figure 3 shows a similar degree of irreversible thermal strain in the x-axis, but not in the
y-axis. It may also be noted that volume changes by relatively small amounts relative to the
changes in x and z dimensions. Contraction in the x-axis results from residual stress relief. The
raster orientation, 0°/90°, may explain why the strain in the y-axis is much smaller. For the raster
orientation given and the cross section of the part, most of the roads laid down are laid down
parallel to the x-axis. Because contraction on cooling is more restricted along the length of a road
than perpendicular to the road, residual thermal stress and the resultant strain on annealing would
be expected to occur along the directions in which roads are laid down. Interestingly, preliminary
results with a +/-45° orientation show similar irreversible thermal strains for the x and y axes
(Figure S6). This difference in behavior highlights the importance of raster orientation in residual
stress relief.
Figure 4: Irreversible thermal strain in x-axis vs irreversible thermal strain in z-axis. Error
bars represent a 95% confidence interval for values. The strain in the two axes show linear
dependence on each other.
Strain in an axis due to a strain applied on a separate axis is the Poisson effect and the ratio
of strains is the Poisson’s ratio, 𝜈. 𝜈 is around 0.3 for many common materials and the average 𝜈
of a material is limited to the range of -1.0 to 0.5. Figure 4 shows a linear relation between x-axis
contraction and z-axis expansion. Because x-axis strain is explained by residual stress relief and
z-axis strain is linearly related and opposite in sign, z-axis strain may be explained by the Poisson
effect. Poisson’s ratio (𝜈𝑥𝑧) was calculated to be 0.81, which highlights the anisotropic behavior
observed in these printed structures. Values for the other direction combinations were not
calculated as there was not a linear relation between strains for those combinations. The value of
𝜈𝑥𝑧 leads to relatively large changes in x and z dimensions having little impact on sample volume.
Previous work on Poisson’s ratios in ABS parts produced with FDM found values ranging from
0.127 to 0.321, which is much lower than calculated here (Hambali et al., 2010; Li et al., 2002).
However, the build parameters used were different, preventing direct comparison. Additionally,
y = -0.815x - 0.0184R² = 0.9951
-25%
-20%
-15%
-10%
-5%
0%
0% 5% 10% 15% 20% 25%
Stra
in in
x-a
xis
(mm
/mm
)
Strain in z-axis (mm/mm)

previously reported Poisson’s ratios are related to glassy behavior, whereas the Poisson’s ratio
calculated from the results in Figure 4 is based on strain that occurred above Tg.
Figure 5: Irreversible thermal relative change in volume vs. irreversible thermal strain
in the y-axis (A). Error bars represent a 95% confidence interval for values. Relative
change in volume varies linearly with y-axis strain. B) Volume as a function of
annealing time.
For the samples in this study, volume change by between -4% and 4% upon complete
annealing (Figure 3c). While there is no trend between layer thickness and volume change, volume
change is strongly correlated with strain in the y-axis (Figure 5a). This is despite the fact that
irreversible thermal strains in the x and z axes are larger than strain in the y-axis. Since polymers
are viscoelastic materials, there is some amount of stress relaxation over time that occurs without
annealing due to slow rearrangement, which may be related to aging and also impact free volume
and Tg (Parlevliet et al., 2007; Williams et al., 1955). Typically, there is free volume trapped in a
polymer, which results in an initial Tg. As the polymer reorganizes to reduce this free volume, the
structure of the material changes and properties change as well (Struik, 1977). Through this
mechanism, it is expected that sample volume would decrease with time due to a decrease in free
volume over time. However, Figure 5b shows that relative change in volume is not time
dependent, suggesting the observed change in volume is not tied to a time-dependent change in
free volume. Additionally, physical aging of polymers does not occur above Tg (Struik, 1977), so
-8%
-4%
0%
4%
8%
-5% 0% 5% 10%
Rel
ativ
e C
han
ge in
Vo
lum
e (m
m3/m
m3)
Strain in y-axis (mm/mm)A
-10%
-5%
0%
5%
10%
15%
0.01 1 100
Rel
ativ
e C
han
ge in
Vo
lum
e (m
m3/m
m3)
Time Annealed (hours)B

the observed volume change would not be expected to be tied to a change in free volume. Since
the volume change is correlated with irreversible thermal strain in a single dimension, the data hint
at a deposition-based mechanism, perhaps related to raster orientation, to describe the changes in
volume.
3.2. Mechanical Testing
AM parts commonly fail at interfaces (Es-Said et al., 2000) and the relationship between
irreversible thermal strain and layer thickness suggests stress buildup may occur largely at the
interfaces. Additionally, previous research has shown relationships between tensile properties and
printing parameters, including layer thickness, and theoretical relations between mechanical
properties and layer thickness have been reported (Ahn et al., 2002; Caulfield et al., 2007; Gurrala
and Regalla, 2014; Wang et al., 2006). Since failure occurs at the interface in both tensile and
flexural testing, the strengths given are related to the interfacial bond strength. Tensile and flexural
strength as a function of layer thickness are shown in Figure 6.
Figure 6: Tensile and flexural strength of printed samples is shown as a function of layer
thickness. Error bars represent a 95% confidence interval. Inset images show the
difference in print quality for higher and lower layer thicknesses.
Tensile and flexural strength follow similar trends, peaking at a layer thickness of 200μm.
A one-way ANOVA comparing mean tensile strength for 100, 200, and 300µm layer thickness
samples at α=0.05 failed to reject the null hypothesis, suggesting additional work would be needed
to confirm the peak in tensile strength.. Differences in printing parameters other than layer
thickness may account for the discrepancy between the observed trends and those reported in
previous experimental work (Lee et al., 2005). The greater residual stress present in lower layer
10
13
15
18
20
23
25
0 100 200 300 400 500
Stre
ngt
h (
MP
a)
Layer Thickness (μm)
Tensile
Flexural

thickness samples would be expected to decrease their failure stress, as predicted (Wang et al.,
2006). Higher layer thickness samples tend to have lower print quality, as shown in the Figure 6
inset, and are predicted to have less complete interlayer bonding (Gurrala and Regalla, 2014). A
peak in strength would therefore be expected.
Observed tensile strengths are lower than those of bulk ABS (28.9 - 53.4MPa) or
injection molded ABS (21.7 - 28.4MPa) (Ahn et al., 2002; "Plastics International ABS Data
Sheet", 2016, "Premier Plastic Resins ABS Data Sheet", 2016, "Test Standard ABS Material
Data Sheet", 2016, "UL Prospector ABS Data Sheet", 2016). However, they are within the range
reported for samples produced using FDM (2.5 to 38.1MPa) (Ahn et al., 2002; "Makerbot PLA
and ABS Strength Data", 2016; Shaffer et al., 2014). Flexural strengths are also lower than
reported for bulk ABS (53.9 - 73.1MPa) or FDM-produced ABS (36.8 - 59.6MPa) (Daneshmand
and Aghanajafi, 2012; "Makerbot PLA and ABS Strength Data", 2016, "Plastics International
ABS Data Sheet", 2016, "Premier Plastic Resins ABS Data Sheet", 2016, "Test Standard ABS
Material Data Sheet", 2016, "UL Prospector ABS Data Sheet", 2016). Differences between
Figure 6 and previously reported flexural strengths are due to print orientation. For printed
samples, flexural strengths are lower than tensile strengths as compared to bulk properties,
suggesting that surface defects initiate failure. Comparison with previous mechanical testing
shows that FDM parts can approach the tensile strength of traditional manufacturing techniques
and that selection of layer thickness plays an important role in tensile strength.
3.3. Dynamic Mechanical Analysis
To determine Tg for ABS and gain insight into the viscoelastic nature of additively
manufacture ABS, DMA was conducted. Single frequency DMA testing revealed a pre-Tg peak in
storage modulus. To further explore the nature of this peak, multi-frequency DMA testing was
conducted (Figure 7).
Figure 7: Storage modulus (E’) of 110 μm layer thickness ABS sample. A) Storage
modulus vs. temperature from multifrequency DMA. B) Master curve constructed using
WLF equation and from data in A.
The portion of the storage modulus curve attributable to the viscoelastic nature of ABS can
be shifted according to the Williams-Landel-Ferry, WLF, (Williams et al., 1955) equation to create
a master curve (Figure 7b). It can be seen from this figure that the data do not shift together at the
pre-glass transition peak. This indicates that the peak is not the result of viscoelastic behavior. Pre-
Tg peaks in storage modulus (E’) are known to be characteristic of stress relief (Menard, 2008).
During additive manufacture, there is a large temperature difference between the layer being put
down and the previous layer. This results in residual thermal stress. As the sample approaches Tg,
mobility increases and allows stress relief, resulting in a peak in E’ that confirms the presence of
residual stress in FDM parts.
4. Conclusions
The work presented in this manuscript demonstrated a previously unreported relationship
between layer thickness and irreversible thermal strain upon annealing. This strain can be large
when layer thickness is small, can be seen for samples produced using high end or consumer grade
FDM machines, is present with different raster angles, and is observed whether samples are printed
with their long axis parallel or perpendicular to the build plate. Additionally, a relationship
between mechanical properties and layer thickness previously predicted in the literature, but not
previously experimentally verified, has been shown.
The amount of irreversible thermal strain observed could result in catastrophic failure of
FDM parts in real world situations. However, this phenomenon is controllable by varying layer
thickness. Irreversible thermal strain is tied to the residual stress present in all FDM parts.
Although large strains may be useful for some applications, in many cases the large stresses that
cause the strains are undesirable. The observed maximum strain already exceeds 20% and it may
be possible to reach greater strains by decreasing layer thickness or varying other process
parameters. This phenomenon occurs in both consumer level and industrial grade FDM machines,
underscoring the importance of understanding residual thermal stress and irreversible thermal
strain.
The observed dependence of tensile strength on layer thickness highlights its importance
as a build parameter for FDM parts. Additionally, the tensile strengths for FDM parts were shown
to be up to 97% of those for injection molded parts. This was achieved varying only layer
thickness; varying additional processing parameters may allow FDM parts to match or even exceed
the properties of injection molded parts. Given the impact of layer thickness on tensile and flexural
properties, it may be the case that other mechanical properties also vary to large degrees with layer
thickness, which is an area of future investigation.
5. Acknowledgements
References
Ahn, S.-H., Montero, M., Odell, D., Roundy, S. and Wright, P.K. (2002), “Anisotropic
material properties of fused deposition modeling ABS”, Rapid Prototyping Journal,
MCB UP Ltd, Vol. 8, pp. 248–257.
Babaee, S., Shim, J., Weaver, J.C., Chen, E.R., Patel, N. and Bertoldi, K. (2013), “3D Soft
metamaterials with negative Poisson’s ratio”, Advanced Materials, Wiley Online
Library, Vol. 25, pp. 5044–5049.
Barry, R.A., Shepherd, R.F., Hanson, J.N., Nuzzo, R.G., Wiltzius, P. and Lewis, J.A. (2009),
“Direct‐ Write Assembly of 3D Hydrogel Scaffolds for Guided Cell Growth”,
Advanced materials, Wiley Online Library, Vol. 21 No. 23, pp. 2407–2410.
Caulfield, B., McHugh, P.E. and Lohfeld, S. (2007), “Dependence of mechanical properties of
polyamide components on build parameters in the SLS process”, Journal of Materials
Processing Technology, Elsevier, Vol. 182, pp. 477–488.
Chuang, K.C., Grady, J.E., Arnold, S.M., Draper, R.D., Shin, E., Patterson, C., Santelle, T., et
al. (2015), “A Fully Nonmetallic Gas Turbine Engine Enabled by Additive
Manufacturing, Part II: Additive Manufacturing and Characterization of Polymer
Composites”, http://ntrs.nasa.gov/search.jsp?R=20150011644 (accessed 2016).
Cooke, W., Anne Tomlinson, R., Burguete, R., Johns, D. and Vanard, G. (2011), “Anisotropy,
homogeneity and ageing in an SLS polymer”, Rapid Prototyping Journal, Emerald
Group Publishing Limited, Vol. 17, pp. 269–279.
Daneshmand, S. and Aghanajafi, C. (2012), “Description and modeling of the additive
manufacturing technology for aerodynamic coefficients measurement”, Strojniški
vestnik-Journal of Mechanical Engineering, Vol. 58, pp. 125–133.
Dinwiddie, R.B., Kunc, V., Lindal, J.M., Post, B., Smith, R.J., Love, L. and Duty, C.E. (2014),
“Infrared imaging of the polymer 3D-printing process”, SPIE Sensing Technology+
Applications, pp. 910502–910502.
Es-Said, O.S., Foyos, J., Noorani, R., Mendelson, M., Marloth, R. and Pregger, B.A. (2000),
“Effect of layer orientation on mechanical properties of rapid prototyped samples”,
Materials and Manufacturing Processes, Taylor & Francis, Vol. 15, pp. 107–122.
Guilak, F., Chan, H.F., Zhao, X., Lin, S., Hong, S., Leong, K.W., Sycks, D., et al.
(2015,July1), “3D Printing of Highly Stretchable and Tough Hydrogels into Complex,
Cellularized Structures”, Advanced Materials.
Gurrala, P.K. and Regalla, S.P. (2014), “Part strength evolution with bonding between
filaments in fused deposition modelling”, Virtual and Physical Prototyping, Taylor &
Francis, Vol. 9, pp. 141–149.
Hambali, R.H., Celik, K., Smith, P., Rennie, A. and Ucar, M. (2010), “Effect of build
orientation on FDM parts: a case study for validation of deformation behaviour by
FEA”, International Conference on Design and Concurrent Engineering (iDECON
2010): Manufacturing Challenges Towards Global Sustainability, pp. 224–228.
Hanson Shepherd, J.N., Parker, S.T., Shepherd, R.F., Gillette, M.U., Lewis, J.A. and Nuzzo,
R.G. (2011), “3D microperiodic hydrogel scaffolds for robust neuronal cultures”,
Advanced functional materials, Wiley Online Library, Vol. 21 No. 1, pp. 47–54.
Kantaros, A. and Karalekas, D. (2013), “Fiber Bragg grating based investigation of residual
strains in ABS parts fabricated by fused deposition modeling process”, Materials &
Design, Elsevier, Vol. 50, pp. 44–50.
Kellner, T. (2016,April18), “Fit to Print: New Plant Will Assemble World’s First Passenger Jet
Engine With 3D Printed Fuel Nozzles, Next-Gen Materials - GE Reports”,
http://www.gereports.com/post/80701924024/fit-to-print/ (accessed 18 April 2016).
Kolesky, D.B., Truby, R.L., Gladman, A., Busbee, T.A., Homan, K.A. and Lewis, J.A. (2014),
“3D Bioprinting of Vascularized, Heterogeneous Cell‐ Laden Tissue Constructs”,
Advanced Materials, Wiley Online Library, Vol. 26 No. 19, pp. 3124–3130.
Kumar, S. and Kruth, J.-P. (2010), “Composites by rapid prototyping technology”, Materials
& Design, Elsevier, Vol. 31, pp. 850–856.
Lee, B.H., Abdullah, J. and Khan, Z.A. (2005,October30), “Optimization of rapid prototyping
parameters for production of flexible ABS object”, Journal of Materials Processing
Technology.
Lee, C.S., Kim, S.G., Kim, H.J. and Ahn, S.H. (2007), “Measurement of anisotropic
compressive strength of rapid prototyping parts”, Journal of materials processing
technology, Elsevier, Vol. 187, pp. 627–630.
Lee, J.-H., Singer, J.P. and Thomas, E.L. (2012), “Micro-/Nanostructured Mechanical
Metamaterials”, Advanced materials, Wiley Online Library, Vol. 24, pp. 4782–4810.
Li, L., Sun, Q., Bellehumeur, C. and Gu, P. (2002), “Composite modeling and analysis for
fabrication of FDM prototypes with locally controlled properties”, journal of
Manufacturing Processes, Elsevier, Vol. 4, pp. 129–141.
“Makerbot PLA and ABS Strength Data.” (2016,October2), Makerbot,
https://eu.makerbot.com/fileadmin/Inhalte/Support/Datenblatt/MakerBot_R__PLA_and
_ABS_Strength_Data.pdf (accessed 2 October 2016).
Menard, K.P. (2008), Dynamic Mechanical Analysis: A Practical Introduction, CRC press,
http://books.google.com/books?hl=en&lr=&id=qdd7mYa7ZdEC&oi=fnd&pg=PP1&d
q=dynamic+mechanical+analysis+a+practical+introduction&ots=j1mIbo7Jb7&sig=sc
YehN4cZqIOojwqX2sEE6dQysg.
Nairn, J.A. and Zoller, P. (1985), “Matrix solidification and the resulting residual thermal
stresses in composites”, Journal of Materials Science, Springer, Vol. 20, pp. 355–367.
Nikzad, M., Masood, S.H. and Sbarski, I. (2011), “Thermo-mechanical properties of a highly
filled polymeric composites for fused deposition modeling”, Materials & Design,
Elsevier, Vol. 32, pp. 3448–3456.
“Oak Ridge National Labs- 3D Printed Car.” (2016,March28), ,
http://web.ornl.gov/sci/manufacturing/shelby/ (accessed 28 March 2016).
Parlevliet, P.P., Bersee, H.E. and Beukers, A. (2006), “Residual stresses in thermoplastic
composites—A study of the literature—Part I: Formation of residual stresses”,
Composites Part A: Applied Science and Manufacturing, Elsevier, Vol. 37, pp. 1847–
1857.
Parlevliet, P.P., Bersee, H.E. and Beukers, A. (2007), “Residual stresses in thermoplastic
composites–a study of the literature. Part III: Effects of thermal residual stresses”,
Composites Part A: Applied Science and Manufacturing, Elsevier, Vol. 38, pp. 1581–
1596.
Pham, D.T. and Gault, R.S. (1998), “A comparison of rapid prototyping technologies”,
International Journal of machine tools and manufacture, Elsevier, Vol. 38, pp. 1257–
1287.
“Plastics International ABS Data Sheet.” (2016,October2), Plastics International,
https://www.plasticsintl.com/datasheets/ABS_FR.pdf (accessed 2 October 2016).
“Premier Plastic Resins ABS Data Sheet.” (2016,October2), Premier Plastic Resins ABS Data
Sheet, http://www.premierplasticresins.com/files/index/download/id/1391185917/
(accessed 2 October 2016).
Pricewaterhouse Coopers. (2014,June), “3D Printing and the New Shape of Industrial
Manufacturing-Chart Pack”, https://www.pwc.com/us/en/industrial-products/assets/3d-
printing-next_manufacturing-chart-pack-pwc.pdf (accessed June 2014).
Shaffer, S., Yang, K., Vargas, J., Di Prima, M.A. and Voit, W. (2014), “On reducing
anisotropy in 3D printed polymers via ionizing radiation”, Polymer, Elsevier,
http://www.sciencedirect.com/science/article/pii/S0032386114006636 (accessed 2014).
Sood, A.K., Ohdar, R.K. and Mahapatra, S.S. (2009), “Improving dimensional accuracy of
fused deposition modelling processed part using grey Taguchi method”, Materials &
Design, Elsevier, Vol. 30, pp. 4243–4252.
Struik, L.C.E. (1977), “Physical aging in plastics and other glassy materials”, Polymer
Engineering & Science, Wiley Online Library, Vol. 17, pp. 165–173.
Sun, Q., Rizvi, G.M., Bellehumeur, C.T. and Gu, P. (2008), “Effect of processing conditions
on the bonding quality of FDM polymer filaments”, Rapid Prototyping Journal,
Emerald Group Publishing Limited, Vol. 14, pp. 72–80.
Tekinalp, H.L., Kunc, V., Velez-Garcia, G.M., Duty, C.E., Love, L.J., Naskar, A.K., Blue,
C.A., et al. (2014), “Highly oriented carbon fiber–polymer composites via additive
manufacturing”, Composites Science and Technology, Elsevier, Vol. 105, pp. 144–150.
“Test Standard ABS Material Data Sheet.” (2016), Test Standard,
http://www.teststandard.com/data_sheets/ABS_Data_sheet.pdf (accessed 2 October
2016).
Thrimurthulu, K., Pandey, P.M. and Reddy, N.V. (2004), “Optimum part deposition
orientation in fused deposition modeling”, International Journal of Machine Tools and
Manufacture, Elsevier, Vol. 44, pp. 585–594.
“UL Prospector ABS Data Sheet.” (2016,October2), UL Prospector,
https://plastics.ulprospector.com/generics/1/c/t/acrylonitrile-butadiene-styrene-abs-
properties-processing (accessed 2 October 2016).
Vega, V., Clements, J., Lam, T., Abad, A., Fritz, B., Ula, N. and Es-Said, O.S. (2011), “The
effect of layer orientation on the mechanical properties and microstructure of a
polymer”, Journal of materials engineering and performance, Springer, Vol. 20, pp.
978–988.
Wang, T.-M., Xi, J.-T. and Jin, Y. (2006), “A model research for prototype warp deformation
in the FDM process”, The International Journal of Advanced Manufacturing
Technology, Vol. 33, pp. 1087–1096.
Williams, M.L., Landel, R.F. and Ferry, J.D. (1955), “The temperature dependence of
relaxation mechanisms in amorphous polymers and other glass-forming liquids”,
Journal of the American Chemical society, ACS Publications, Vol. 77, pp. 3701–3707.
Wu, W., DeConinck, A. and Lewis, J.A. (2011), “Omnidirectional printing of 3D
microvascular networks”, Advanced Materials, Wiley Online Library, Vol. 23 No. 24,
pp. H178–H183.
Yang, Y., Chen, Y., Wei, Y. and Li, Y. (2015), “3D printing of shape memory polymer for
functional part fabrication”, The International Journal of Advanced Manufacturing
Technology, Springer, pp. 1–17.
Zheng, X., Lee, H., Weisgraber, T.H., Shusteff, M., DeOtte, J., Duoss, E.B., Kuntz, J.D., et al.
(2014), “Ultralight, ultrastiff mechanical metamaterials”, Science, American
Association for the Advancement of Science, Vol. 344, pp. 1373–1377.