Effect of Intravenous Small‐Volume Hypertonic Sodium ... · derangements of acid-base...
15
Effect of Intravenous Small-Volume Hypertonic Sodium Bicarbonate, Sodium Chloride, and Glucose Solutions in Decreasing Plasma Potassium Concentration in Hyperkalemic Neonatal Calves with Diarrhea F.M. Trefz , P.D. Constable, and I. Lorenz Background: Hyperkalemia is a frequently observed electrolyte imbalance in dehydrated neonatal diarrheic calves that can result in skeletal muscle weakness and life-threatening cardiac conduction abnormalities and arrhythmias. Hypothesis: Intravenous administration of a small-volume hypertonic NaHCO 3 solution is clinically more effective in decreasing the plasma potassium concentration (cK) in hyperkalemic diarrheic calves than hypertonic NaCl or glucose solutions. Animals: Twenty-two neonatal diarrheic calves with cK >5.8 mmol/L. Methods: Prospective randomized clinical trial. Calves randomly received either 8.4% NaHCO 3 (6.4 mL/kg BW; n = 7), 7.5% NaCl (5 mL/kg BW; n = 8), or 46.2% glucose (5 mL/kg BW; n = 7) IV over 5 minutes and were subsequently allowed to suckle 2 L of an electrolyte solution. Infusions with NaHCO 3 and NaCl provided an identical sodium load of 6.4 mmol/ kg BW. Results: Hypertonic NaHCO 3 infusions produced an immediate and sustained decrease in plasma cK. Hypertonic glucose infusions resulted in marked hyperglycemia and hyperinsulinemia, but cK remained unchanged for 20 minutes. Between 30 and 120 minutes after initiation of treatment, the most marked decrements in cK from baseline occurred in group NaHCO 3 , which were significantly (P < .05) larger during this period of time than in calves in group NaCl, but not group glucose. After 120 minutes, the mean decrease in cK from baseline was 26 10%, 9 8%, and 22 6% in groups NaHCO 3 , NaCl, and glucose, respectively. Conclusions/Clinical Importance: Small-volume hypertonic NaHCO 3 infusions appear to have clinical advantages for the rapid resuscitation of hyperkalemic diarrheic calves, compared to hypertonic NaCl or glucose solutions. Key words: Dehydration; Electrolyte imbalances; Insulin; Sodium; Strong ion (metabolic) acidosis. D iarrhea in neonatal calves can result in metabolic derangements including azotemia, hemoconcentra- tion, D-lactatemia, and development of a strong ion (metabolic) acidosis. 1–3 Electrolyte imbalances are also common in diarrheic calves and are closely linked to derangements of acid-base status. 2,4–6 Although neona- tal diarrheic calves have a negative potassium balance due to intestinal losses and low milk intake, 7 they usu- ally have normo- or hyperkalemic plasma concentra- tions in the presence of acidemia. 4,8 Hyperkalemia is a clinically relevant electrolyte imbalance in diarrheic calves and has historically been attributed to impaired intracellular translocation of potassium ions due to acidemia and decreased intracellular pH. 9,10 However, recent studies indicate that hyperkalemia in diarrheic calves is dependent on the nature of the existing acido- sis but not on acidemia per se, with D-lactic acidosis being rarely associated with increased plasma potas- sium concentrations (cK). More importantly, the cK in diarrheic calves is most closely associated with clini- cal and laboratory indices of dehydration, indicating that a decrease in renal glomerular filtration rate plays a central role in the development of a hyperkalemic state. 4,8 Clinical effects of hyperkalemia are related to impaired neuromuscular excitability, which is further exacerbated by the presence of hyponatremia and metabolic acidosis, 11 conditions that are usually present in affected calves. Due to the potential car- diotoxicity, acute hyperkalemia represents a potentially life-threatening state and has historically been consid- ered to be an important cause of death in neonatal calves with diarrhea. 12 Electrocardiographic manifesta- tions of hyperkalemia typically include flattened or missing P-waves, increased QRS duration, large and spiked T-waves, and R-R irregularities. 9,13–15 Addi- tionally, the clinical picture of hyperkalemic diarrheic calves is characterized by severe clinical dehydration, cyanosis, and impaired ability to stand 8 and affected calves are frequently presented with signs of shock. Acute hyperkalemia should therefore be considered as an emergency, and treatment objectives should focus on rapid correction of hyperkalemia. Although it is From the Clinic for Ruminants with Ambulatory and Herd Health Services at the Centre for Clinical Veterinary Medicine, LMU Munich, Oberschleißheim, Germany (Trefz); College of Veterinary Medicine, University of Illinois, Urbana-Champaign, IL (Constable); Bavarian Animal Health Service (Tiergesundheitsdienst Bayern e.V.), Poing, Germany (Lorenz). This work was financed by a research grant of the German Research Foundation (Deutsche Forschungsgemeinschaft; TR 1321/1-1). Corresponding author: F.M. Trefz, Clinic for Ruminants with Ambulatory and Herd Health Services, LMU Munich, Sonnenstraße 16, 85764 Oberschleißheim, Germany; e-mail: Florian.Trefz@ campus.lmu.de Submitted December 14, 2016; Revised February 8, 2017; Accepted March 7, 2017. Copyright © 2017 The Authors. Journal of Veterinary Internal Medicine published by Wiley Periodicals, Inc. on behalf of the American College of Veterinary Internal Medicine. This is an open access article under the terms of the Creative Commons Attribution-NonCommercial License, which permits use, distribution and reproduction in any medium, provided the original work is properly cited and is not used for commercial purposes. DOI: 10.1111/jvim.14709 Standard Article J Vet Intern Med 2017;31:907–921
Transcript of Effect of Intravenous Small‐Volume Hypertonic Sodium ... · derangements of acid-base...
Effect of Intravenous Small-Volume Hypertonic Sodium Bicarbonate,Sodium Chloride, and Glucose Solutions in Decreasing PlasmaPotassium Concentration in Hyperkalemic Neonatal Calves with
Diarrhea
F.M. Trefz , P.D. Constable, and I. Lorenz
Background: Hyperkalemia is a frequently observed electrolyte imbalance in dehydrated neonatal diarrheic calves that
can result in skeletal muscle weakness and life-threatening cardiac conduction abnormalities and arrhythmias.
Hypothesis: Intravenous administration of a small-volume hypertonic NaHCO3 solution is clinically more effective
in decreasing the plasma potassium concentration (cK) in hyperkalemic diarrheic calves than hypertonic NaCl or glucose
solutions.
Animals: Twenty-two neonatal diarrheic calves with cK >5.8 mmol/L.
Methods: Prospective randomized clinical trial. Calves randomly received either 8.4% NaHCO3 (6.4 mL/kg BW; n = 7),
7.5% NaCl (5 mL/kg BW; n = 8), or 46.2% glucose (5 mL/kg BW; n = 7) IV over 5 minutes and were subsequently allowed
to suckle 2 L of an electrolyte solution. Infusions with NaHCO3 and NaCl provided an identical sodium load of 6.4 mmol/
kg BW.
Results: Hypertonic NaHCO3 infusions produced an immediate and sustained decrease in plasma cK. Hypertonic glucose
infusions resulted in marked hyperglycemia and hyperinsulinemia, but cK remained unchanged for 20 minutes. Between 30
and 120 minutes after initiation of treatment, the most marked decrements in cK from baseline occurred in group NaHCO3,
which were significantly (P < .05) larger during this period of time than in calves in group NaCl, but not group glucose.
After 120 minutes, the mean decrease in cK from baseline was �26 � 10%, �9 � 8%, and �22 � 6% in groups NaHCO3,
NaCl, and glucose, respectively.
Conclusions/Clinical Importance: Small-volume hypertonic NaHCO3 infusions appear to have clinical advantages for the
rapid resuscitation of hyperkalemic diarrheic calves, compared to hypertonic NaCl or glucose solutions.
Key words: Dehydration; Electrolyte imbalances; Insulin; Sodium; Strong ion (metabolic) acidosis.
Diarrhea in neonatal calves can result in metabolicderangements including azotemia, hemoconcentra-
tion, D-lactatemia, and development of a strong ion(metabolic) acidosis.1–3 Electrolyte imbalances are alsocommon in diarrheic calves and are closely linked toderangements of acid-base status.2,4–6 Although neona-tal diarrheic calves have a negative potassium balancedue to intestinal losses and low milk intake,7 they usu-ally have normo- or hyperkalemic plasma concentra-tions in the presence of acidemia.4,8 Hyperkalemia is aclinically relevant electrolyte imbalance in diarrheic
calves and has historically been attributed to impairedintracellular translocation of potassium ions due toacidemia and decreased intracellular pH.9,10 However,recent studies indicate that hyperkalemia in diarrheiccalves is dependent on the nature of the existing acido-sis but not on acidemia per se, with D-lactic acidosisbeing rarely associated with increased plasma potas-sium concentrations (cK). More importantly, the cKin diarrheic calves is most closely associated with clini-cal and laboratory indices of dehydration, indicatingthat a decrease in renal glomerular filtration rate playsa central role in the development of a hyperkalemicstate.4,8
Clinical effects of hyperkalemia are related toimpaired neuromuscular excitability, which is furtherexacerbated by the presence of hyponatremia andmetabolic acidosis,11 conditions that are usuallypresent in affected calves. Due to the potential car-diotoxicity, acute hyperkalemia represents a potentiallylife-threatening state and has historically been consid-ered to be an important cause of death in neonatalcalves with diarrhea.12 Electrocardiographic manifesta-tions of hyperkalemia typically include flattened ormissing P-waves, increased QRS duration, large andspiked T-waves, and R-R irregularities.9,13–15 Addi-tionally, the clinical picture of hyperkalemic diarrheiccalves is characterized by severe clinical dehydration,cyanosis, and impaired ability to stand8 and affectedcalves are frequently presented with signs of shock.Acute hyperkalemia should therefore be considered asan emergency, and treatment objectives should focuson rapid correction of hyperkalemia. Although it is
From the Clinic for Ruminants with Ambulatory and Herd HealthServices at the Centre for Clinical Veterinary Medicine, LMU Munich,Oberschleißheim, Germany (Trefz); College of Veterinary Medicine,University of Illinois, Urbana-Champaign, IL (Constable); BavarianAnimal Health Service (Tiergesundheitsdienst Bayern e.V.), Poing,Germany (Lorenz).
This work was financed by a research grant of the German ResearchFoundation (Deutsche Forschungsgemeinschaft; TR 1321/1-1).
Corresponding author: F.M. Trefz, Clinic for Ruminants withAmbulatory and Herd Health Services, LMU Munich, Sonnenstraße16, 85764 Oberschleißheim, Germany; e-mail: [email protected]
Submitted December 14, 2016; Revised February 8, 2017;Accepted March 7, 2017.
Copyright © 2017 The Authors. Journal of Veterinary InternalMedicine published by Wiley Periodicals, Inc. on behalf of the AmericanCollege of Veterinary Internal Medicine.
This is an open access article under the terms of the CreativeCommons Attribution-NonCommercial License, which permits use,distribution and reproduction in any medium, provided the originalwork is properly cited and is not used for commercial purposes.
DOI: 10.1111/jvim.14709
Standard ArticleJ Vet Intern Med 2017;31:907–921

well known that the correction of a hyperkalemicstate can be achieved by intravenous administrationof large volumes of fluids containing sodium bicar-bonate, sodium chloride, or glucose solutions,16–19 theunderlying mechanisms and the efficacy of differentinfusion solutions in the initial treatment have notbeen fully explored. Specifically, it needs to be deter-mined how much of the return of potassium home-ostasis is due to volume expansion (dilutional effect),rehydration with concomitant restoration of renalfunction (excretional effect), or intracellular transloca-tion of potassium ions in response to alkalinization, asodium-induced strong ion effect, or the action ofendogenous insulin.
Intravenous administration of hypertonic (8.4%)sodium bicarbonate solution induces an immediateand sustained decrease in cK, which is most closelyassociated with a rapid increase in venous blood pHand a rapid improvement in hydration status.17 Ingeneral, hypertonic sodium-containing infusion solu-tions such as 8.4% sodium bicarbonate or 7.2%sodium chloride (saline) have a sound physiologicbasis in the initial treatment of affected calves asthese solutions not only induce rapid plasma volumeexpansion and correct hyperkalemia, but they alsoenhance the redistribution of potassium ions intocells. Consequently, hypertonic sodium solutions canrapidly reverse the electrocardiographic manifestationsof hyperkalemia,20 which has been demonstrated forhypertonic saline in hyperkalemic humans, dogs, anda calf.14,21,22 However, hypertonic saline might beinferior to hypertonic sodium bicarbonate as hyper-tonic saline does not correct the concomitant acide-mia, which is usually present in affected calves. Inhuman medicine, hyperkalemia is most commonlytreated by the intravenous administration of insulinand dextrose,11,23 as insulin stimulates cellular potas-sium uptake through activation of the Na+/K+-ATPase mediated by an inward flux of sodium ions.24
Intravenous administration of a hypertonic glucosesolution might therefore represent an alternativeoption in the initial treatment of hyperkalemic diar-rheic calves, as hypertonic glucose solutions induce anendogenous insulin release that has been associatedwith a decrease in cK in healthy eukalemic cows.25
However, the insulin-mediated potassium-loweringeffect could be hampered in diarrheic calves20 as evenmild acidemia with measured blood pH values of7.27 � 0.01 and 7.37 � 0.02 was reported to result ininsulin resistance in humans.26,27
Consequently, the aim of this study was to comparethe potassium-lowering effects of hypertonic sodiumchloride-, sodium bicarbonate-, and glucose-containinginfusion solutions in the initial treatment of hyper-kalemic diarrheic calves. As hypertonic saline and glu-cose solutions do not have alkalinizing capacity, wehypothesized that administration of a hypertonicsodium bicarbonate solution would be associated with amore rapid, marked, and sustained decrease in plasmacK than administration of hypertonic sodium chlorideor glucose solutions.
Materials and Methods
Methods of this study were approved by the Animal Welfare
and Ethics Committee of the government of Upper Bavaria (per-
mit no. 55.2-1-54-2532-211-13).
Calves
Between February 2015 and May 2016, a prospective study
was conducted involving 26 calves that were admitted to the
Clinic for Ruminants with Ambulatory and Herd Health Services,
LMU Munich. Criteria for inclusion into the study were a clini-
cal diagnosis of neonatal diarrhea, age ≤21 days, and a measured
plasma potassium concentration >5.8 mmol/L. General exclusion
criteria included the presence of hypernatremia (plasma sodium
concentration >160 mmol/L), venous blood pH ≤6.80, and severe
concurrent health problems (e.g, advanced bronchopneumonia).
A total of 4 calves were subsequently excluded from the analysis
due to a postmortem diagnosis of generalized peritonitis and
infarction of the caudal part of the spinal cord (n = 1), dosage
error in the volume of infused solution (n = 1), and pretreatment
with hypertonic sodium bicarbonate infusions in 2 calves shortly
before admission to the hospital (n = 2). Therefore, a total of 22
calves remained in the study. Written informed consent was
obtained from the owners of the calves before inclusion into the
study.
Due to regional preferences, 20 of 22 calves belonged to the
Simmental breed (German Fleckvieh), the most common dairy
breed in Bavaria. The mean age and body mass of the calves were
8 � 3 days and 42.3 � 6.3 kg, respectively.
Experimental Protocol
After weighing and an initial clinical examination, a cathetera
was placed in a jugular vein and secured in place with suture
material. For this purpose, the area over the respective jugular
vein was clipped, antiseptically prepared, and 2 mL of a 2% pro-
caine solution injected into and under the skin before catheteriza-
tion. Calves were randomly allocated to 1 of 3 treatment groups,
which was conducted by drawing a lot out of a pool of 3 possible
lots representing each treatment group:
1 Sodium bicarbonate group (NaBic; n = 7): Calves received a
commercially available 8.4% sodium bicarbonate solutionb
(theoretical osmolarity 2000 mOsm/L) in a dosage of 6.4 mL/
kg BW over a period of 5 minutes. This dosage was chosen to
provide the same sodium load as in calves of group NaCl.
2 Saline group (NaCl, n = 8): Calves received a commercially
available 7.5% sodium chloride solutionc (theoretical osmolar-
ity, 2566 mOsm/L) in a dosage of 5 mL/kg body weight (BW)
over 5 minutes. This provided a sodium load of 6.4 mmol per
kg BW.
3 Glucose group (Gluc, n = 7): Calves received a 46.2% glu-
cose solution in a dosage of 5 mL/kg body mass over a period
of 5 minutes. For this purpose, a commercially available 50%
glucose solutiond was diluted with sterile watere to provide an
infusion solution that had a comparable osmolarity
(2564 mOsm/L) to the hypertonic saline solution.
All infusion solutions were injected at room temperature through
the jugular vein catheter with 60-ml polypropylene syringes. Blood
samples were taken from the same catheter at �15, 0, 7, 10, 15,
20, 30, 40, 50, 60, 75, 90, and 120 minutes relative to the onset of
the injection. After the injection of the infusion solution and blood
sampling, the catheter was flushed with heparinized 0.9% NaCl
(40 U of heparin/mL).
908 Trefz et al

At 20 min after the start of IV infusion, calves were allowed to
suckle 2 L of a commercially available oral electrolyte solution.f
This oral electrolyte solution contained 2.34 g NaCl (40 mmol),
1.12 g KCl (15 mmol), 6.72 g sodium bicarbonate (80 mmol),
3.84 g citric acid (20 mmol), 32.44 g lactose monohydrate
(90 mmol), and 2.25 g glycine (30 mmol) per liter. The theoretical
calculated osmolarity and effective strong ion difference of this
solution were 410 mOsm/L and 80 mEq/L, respectively. If the
respective volume of the solution was not suckled entirely within
10 minutes, the remainder of the solution was tube-fed after blood
sampling at 30 minutes.
After the end of the study period at 120 minutes, calves were
treated according to clinic principles and received further infusions
based on the current acid-base and clinical dehydration status.
Clinical Examination
Physical examination followed a standardized protocol3 and
included the clinical assessment of posture/ability to stand, behav-
ior, suckling and palpebral reflex, and extent of enophthalmos (in
mm) before administration of infusion solutions and at the end of
the study period at 120 minutes. Posture was scored as: 1 = stand-
ing up by itself; 2 = standing up after encouragement; 3 = stand-
ing securely after lifting; 4 = insecurely, able to correct position;
5 = insecurely, unable to correct position; 6 = sternal recumbency;
and 7 = lateral recumbency. Behavior was scored as: 1 = adequate
reaction; very bright and alert; 2 = adequate reaction; 3 = delayed
reaction; 4 = calf reacts only to painful stimuli; 5 = no reaction to
painful stimuli. Suckling reflex was categorized as: 1 = strong,
2 = weak, 3 = absent. The palpebral reflex was scored as:
1 = eyelids are closed immediately and fully; 2 = eyelids are closed
immediately but not fully; 3 = eyelids are closed with delay and
not fully; and 4 = eyelids are not closed at all. The severity of
enophthalmos was quantified by measuring the distance (in mm)
between the medial canthus and the eyeball.28,29 Subjective mea-
surements could not be masked due to differences of administered
volumes of infusion solution and repeated blood gas measurement,
which were performed by the same investigator.
Laboratory Analyses
Lithium-heparinized blood samples were anaerobically collected
with a 2-mL polypropylene syringe and blood pH, partial pressure
of carbon dioxide (pCO2), sodium, chloride, potassium, and ion-
ized calcium concentrations were determined with direct poten-
tiometry at all sampling times with a blood pH, gas, and
electrolyte analyzer with ion-selective electrodes.g Blood samples
were kept at room temperature until blood gas analysis, which
was performed within 15 minutes. Blood pH and pCO2 were cor-
rected for rectal temperature by standard algorithms.30 After
blood gas analysis, syringes were immediately refrigerated and cen-
trifuged within 60 minutes after collection at 1,500 9 g for
10 minutes.
Harvested plasma samples were assayed for concentrations of
insulin, glucose (hexokinase), total protein (biuret), and inorganic
phosphorus (molybdenum) at all sampling times. Plasma urea
(urease), creatinine (picric acid), D-lactate (D-lactate dehydroge-
nase), L-lactate (L-lactate dehydrogenase), and total magnesium
(xylidyl blue) concentrations were determined at 0, 15, 30, 60, 90,
and 120 minutes. An automatic analyzing systemh was used for
biochemical analysis except for insulin determination, which was
performed with a commercially available ELISA kiti on plasma
samples that had been stored at �25°C until analyzed. This assay
is a species-optimized test, which has a reported inter- and intra-
assay coefficient of variation of ≤7% and ≤5.3%, respectively.j
Based on recommendations from the test provider, insulin
concentrations below a concentration of 0.05 lg/L were not calcu-
lated from the calibration curve and therefore entered into the
analysis as 0.05 lg/L.Hematologic variables were determined at 0, 15, 30, 60, 90, and
120 minutes from an additional EDTA blood sample with a hema-
tologic analyzer.k
Calculations
Plasma insulin concentrations were converted from lg/L to
lIU/mL by multiplying values with a factor of 20.56.31 If labora-
tory variables were measured at �15 and 0 minutes, those values
were used to calculate baseline values as the mean of those 2 mea-
surements. Otherwise, baseline values were based on a single mea-
surement at 0 minutes.
Actual bicarbonate concentration (cHCO3�) was automatically
calculated by the blood gas unit by the Henderson-Hasselbalch
equation with measured blood pH and pCO2 at 37°C:
cHCO�3 ¼ S� pCO2 � 10ðpH�pK10Þ: ð1Þ
Values for the negative logarithm of the dissociation constant
of carbonic acid (pK10) and solubility of carbon dioxide (S) for
plasma were 6.105 and 0.0307 mmol/L per mmHg, respectively.
After measuring the hemoglobin concentration (Hb in g/dL) pho-
tometrically, blood base excess (in vitro base excess) was automati-
cally calculated in units of mmol/L by the van Slyke equation32
with measured blood pH at 37°C and the determined actual bicar-
bonate concentration:
Base excess ¼ ð1� 0:014� cHbÞ � ½ðcHCO�3 � 24:8Þ þ ð1:43� cHb
þ 7:7Þ � ðpH� 7:4Þ�:ð2Þ
An estimate of the unmeasured anion concentration was
obtained by calculating the anion gap (AG) in mEq/L, whereby:
AG ¼ ðcNaþ þ cKþÞ � ðcCl� þ cHCO�3 Þ: ð3Þ
In addition to the traditional Henderson-Hasselbalch acid-base
model, the simplified quantitative physicochemical strong ion
approach33 was used to allow a more comprehensive assessment of
acid-base status of calves of this study population. The strong ion
difference in mEq/L calculated from the plasma concentrations of
sodium, potassium, and chloride (SID3) was obtained as follows2:
SID3 ¼ cNaþ þ cKþ � cCl� ð4ÞThe measured strong ion difference obtained from 7 strong ions34
(SID7, mEq/L) was calculated by the measured value for [Ca2+]
determined by ion-selective potentiometry and assigning a charge of
+1.38 to magnesium assuming 69% dissociation35 and �1 to D-lac-
tate and L-lactate assuming 100% dissociation such that:
SID7 ¼ cNaþ þ cKþ þ cMg2þ þ cCa2þ � cCl� � cðL� lactateÞ� cðD� lactateÞ
ð5ÞThe concentration of nonvolatile weak acids (Atot) in mmol/L
was calculated from plasma concentrations of total protein:2
Atot ¼ 0:343� ctotal protein: ð6ÞThe strong ion gap (SIG) was calculated to obtain an estimate
of the unmeasured strong anion concentration by the experimen-
tally determined value for Atot, the experimentally determined
value for the negative logarithm of dissociation constant of plasma
nonvolatile weak acids (pKa = 7.08), and the following equation:2
Treatment of Hyperkalemia in Diarrheic Calves 909

SIG ¼ ½Atot=ð1þ 10ð7:08�pHÞÞ� �AG: ð7ÞThe first expression on the right-hand side of the SIG equa-
tion represents the net negative charge in mEq/L of nonvolatile
weak acids (A�) in plasma. The percent changes in plasma vol-
ume at each time point x relative to a previous time point y
were extrapolated from the changes in plasma total protein
concentrations36 such that:
D Plasma volumex ¼ ðctotal proteiny � ctotal proteinxÞ� 100=ctotal proteinx: ð8Þ
The changes (differences) in cK (Diff K) between baseline and a
time point y were determined by the following equation:37
Diff Kx ¼ cKx � cKbaseline ð9ÞAlso the area under the time curve of cK and Diff K (AUCK,
AUCDiff K) for the study period of 120 minutes after the start of
administration of respective infusion solutions was calculated by
the trapezoidal method.
Statistical Analysis
Commercially available software programsl,m,n were used for
the statistical analysis of the results, and P-values < .05 were con-
sidered to be statistically significant. A normal distribution of data
was assessed by the Shapiro-Wilk W test and visual inspection of
QQ plots. Continuous data are reported as mean � standard devi-
ation (SD) or median and interquartile ranges. If necessary, data
were log-transformed to achieve a normal distribution of respec-
tive variables. A two-way repeated-measures ANOVA was used to
detect differences of continuous variables over time and between
treatment groups. If only a single comparison between treatment
groups had to be performed, a one-way ANOVA was used. Bon-
ferroni-adjusted P-values were used whenever the F-test was signif-
icant to assess differences within and between treatment groups.
Scores of clinical variables were expressed as median and corre-
sponding minimum and maximum values and compared by a
paired Wilcoxon test (within-group comparisons) or a Kruskal-
Wallis test (between-group comparisons).
The primary outcome variable of interest was the decrease in
plasma potassium concentration from baseline, with a 15% differ-
ence in reduction at the end of the study period being the effect
size of interest. Based on anticipated mean and SD values for the
plasma potassium concentration of 7.45 � 1.28 mmol/L for the
studied population based on data from 234 hyperkalemic calves of
a previously published study,4 an alpha of 0.05 and a group size
of 7, we calculated the power of the study to be 0.80.
Results
Clinical Conditions
Clinical scores of calves before and at the end of thestudy period are given in Table 1. All calves were moder-ately to severely dehydrated based on the magnitude of eyerecession into the orbit, with the degree of enophthalmosranging from 3 to 8 mm. A total of 5 calves were presentedin sternal (n = 2) or lateral recumbency (n = 3), whereas 9calves presented an impairment of ability to stand (score 4or 5). The suckling reflex was weak or absent in each of tencalves, but the strength of the palpebral reflex was notaltered (Score 1) in 20 out of 22 calves.
After injections of infusion solutions, a total of tencalves (4 calves of group NaBic, and each of 3 calves of
groups NaCl and Gluc) suckled the entire volume ofthe offered electrolyte solution. The mean volumes ofvoluntarily suckled ORS in groups NaBic, NaCl, andGluc were 1.5, 1.0, and 1.2 L, respectively (P = .61).
Clinical scores for posture, behavior, and degree ofenophthalmos improved in all treatment groups, withno difference between treatment groups at the end ofthe study period (Table 1). However, a total of 18calves still showed signs of moderate to severe dehydra-tion as indicated by eye recession into the orbit. Twocalves of group NaCl and 1 calf of group Glucremained unable to stand at the end of the investigationperiod.
Changes in Plasma Potassium Concentrations
Changes in plasma cK over the study period in the 3treatment groups are shown in Figure 1A. There wasno significant effect of group (P = .40), but the effect oftime and the interaction of time 9 group was statisti-cally significant (P < .001). A similar decline in cK wasobserved in groups NaCl and NaBic until 10 minutes,but a subsequent increase in cK was observed in groupNaCl, whereas in calves of group NaBic a furtherdecline in cK was observed until 120 minutes. PlasmacK values in calves of group NaCl were similar to base-line between 50 and 120 minutes. In calves of group
Table 1. Scores of clinical examination findings anddegree of enophthalmos in 22 neonatal hyperkalemicdiarrheic calves before and 120 minutes after start ofinfusions of either hypertonic 8.4% sodium bicarbonate(n = 7), 7.5% sodium chloride (n = 8), or 46.2% glu-cose (n = 7) and subsequent suckling of an oral elec-trolyte solution.
Variable Before treatment
120 minutes After
Start of Treatment P-value
Posture (Score)
NaBic 4 (2–7) 2 (2–4) .041
NaCl 4 (2–7) 3.5 (2–6) .059
Gluc 3 (2–6) 2 (2–6) .10
Behavior (Score)
NaBic 4 (2–4) 2 (2–4) .034
NaCl 3.5 (1–4) 3 (1–4) .025
Gluc 3 (3–5) 2 (2–4) .025
Suckling reflex (Score)
NaBic 2 (1–3) 2 (2–3) 1.0
NaCl 2.5 (1–3) 2 (1–3) .32
Gluc 2 (2–3) 3 (1–3) .56
Palpebral reflex (Score)
NaBic 1 (1–3) 1 (1–3) 1.0
NaCl 1 (1–1) 1 (1–1) 1.0
Gluc 1 (1–2) 1 (1–2) 1.0
Enophthalmos (mm)
NaBic 5 (3–7) 3 (1–5) .026
NaCl 5 (3–8) 3.5 (2–8) .024
Gluc 5 (3–8) 3 (2–8) .038
P-values are based on a within-group comparison. Values are
reported as medians and corresponding ranges (minimum–maximum).
910 Trefz et al

Gluc, cK remained unchanged between 7 minutes and20 minutes, but continuously decreased thereafter until120 minutes. The area under the cK time curve was692 � 160 mmol/L*min in group NaBic, 812 � 141mmol/L*min in group NaCl, and 700 � 115 mmol/L*min in group Gluc (P = .20).
Changes in plasma potassium concentrations relativeto baseline (Diff K) in the 3 treatment groups duringthe study period are shown in Figure 1B. There was astatistically significant effect of group (P = .007), time(P < .001), and the interaction of time and group(P < .001) as indicated by different slopes and ampli-tudes of respective Diff K time curves. Similar
decrements of cK were observed in groups NaCl andNaBic between 10 and 20 minutes, which were signifi-cantly higher than in calves of group Gluc during thesame period of time. Thereafter, an increase in the DiffK time curve was observed in calves of group NaCl,whereas a decrease in the Diff K time curve wasobserved in calves of group Gluc. Between 30 minutesand 120 minutes, the most marked decrement of cKwas observed in calves group NaBic, which wasreflected by Diff K values that differed significantlyfrom calves of group NaCl, but not from calves ofgroup Gluc. At 120 minutes, the observed decrementswere equivalent to �26.0 � 10.4%, �9.1 � 8.3%, and�21.6 � 6.4% of baseline cK in groups NaBic, NaCl,and Gluc, respectively. Those values differed signifi-cantly between groups NaCl and NaBic (P = .003),NaCl and Gluc (P = .032), but not between NaBic andGluc (P = 1.00).
The calculated area under the Diff K time curve was�166 � 50 mmol/L 9 min for group NaBic, �82 �43 mmol/L 9 min for group NaCl, and �122 �49 mmol/L 9 min for group Gluc. The AUCDiff K val-ues also differed significantly between groups NaBicand NaCl (P = .008), but not between NaBic and Gluc(P = .28), and NaCl and Gluc (P = .35).
Acid-Base Variables
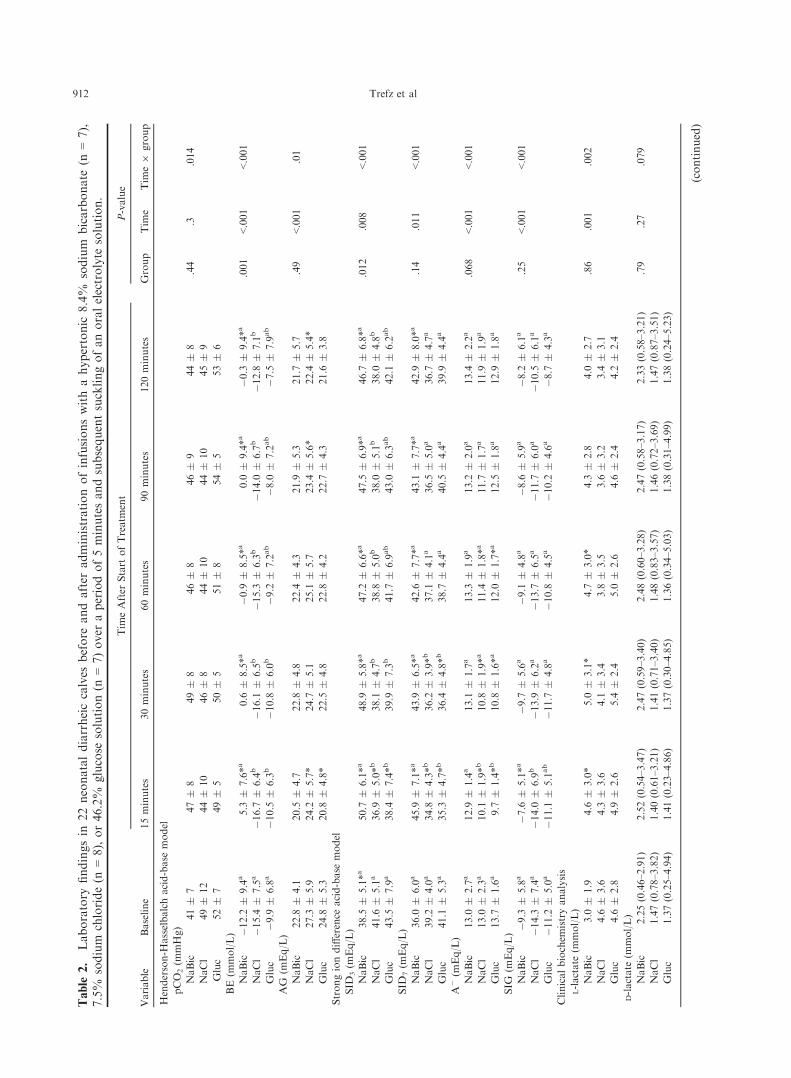
Changes in acid-base variables during the study per-iod and results of the repeated-measures ANOVA arepresented in Table 2. Infusion of sodium bicarbonatecaused an immediate and marked increase in venousblood pH and bicarbonate concentration (Fig 2).Venous blood pH and bicarbonate concentration didnot change significantly from baseline in groups NaCland Gluc throughout the study period, except at10 minutes where a statistically significant decrease inbicarbonate concentration was detectable in groupNaCl. Also, IV administration of sodium bicarbonateresulted in an increase in measured plasma strong iondifference as indicated by values for SID3 and SID7 thatwere significantly higher than at baseline throughoutthe study period. In contrast, a decrease in plasma SID3
and SID7 was observed in groups NaCl and Gluc,which was statistically significant for SID7 at 15 and30 minutes, and for SID3 from 7 minutes until 20 min-utes. No group effect, but statistically significant timeand time x group effects were observed for AG andSIG.
Plasma Sodium Concentrations, Sodium-to-PotassiumRatio, and Changes in Plasma Volume
A similar increase in plasma cNa was observed aftertreatment in groups NaBic and NaCl, with values thatdiffered significantly from baseline throughout the studyperiod (Fig 3). IV administration of a sodium-free glu-cose solution resulted in a significant decrease in cNawith values that differed significantly from calves ofgroups NaBic and NaCl between 7 minutes and 20 min-utes. Despite these findings, no group (P = .41), but a
Fig 1. Mean � SD of plasma potassium concentrations (A) and
changes in plasma potassium concentrations relative to baseline
(B) in 22 neonatal diarrheic calves after injections of an 8.4%
sodium bicarbonate solution in a dosage of 6.4 mL/kg body mass
(ο; n = 7), 7.5% sodium chloride solution in a dosage of 5 mL/kg
body mass (□; n = 8), or a 46.2% glucose solution in a dosage of
5 mL/kg body mass (D; n = 7) over a period of five min and sub-
sequent administration of an oral electrolyte solution. Values with
different letters differed significantly between groups (P < .05).
Values with a filled symbol in graph A differ significantly
(P < .05) from baseline (within-group comparisons for the change
in plasma potassium concentrations relative to baseline were not
possible due to the statistical methods applied). Values for groups
NaBic and Gluc were slightly offset at each time point to improve
readability.
Treatment of Hyperkalemia in Diarrheic Calves 911
Table
2.
Laboratory
findingsin
22neonataldiarrheiccalves
before
andafter
administrationofinfusionswithahypertonic
8.4%
sodium
bicarbonate
(n=7),
7.5%
sodium
chloride(n
=8),or46.2%
glucose
solution(n
=7)over
aperiodof5minutesandsubsequentsucklingofanoralelectrolyte
solution.
Variable
Baseline
Tim
eAfter
Start
ofTreatm
ent
P-value
15minutes
30minutes
60minutes
90minutes
120minutes
Group
Tim
eTim
e9
group
Henderson-H
asselbalchacid-base
model
pCO
2(m
mHg)
NaBic
41�
747�
849�
846�
846�
944�
8.44
.3.014
NaCl
49�
12
44�
10
46�
844�
10
44�
10
45�
9
Gluc
52�
749�
550�
551�
854�
553�
6
BE(m
mol/L)
NaBic
�12.2
�9.4
a5.3
�7.6*a
0.6
�8.5*a
�0.9
�8.5*a
0.0
�9.4*a
�0.3
�9.4*a
.001
<.001
<.001
NaCl
�15.4
�7.5
a�1
6.7
�6.4
b�1
6.1
�6.5
b�1
5.3
�6.3
b�1
4.0
�6.7
b�1
2.8
�7.1
b
Gluc
�9.9
�6.8
a�1
0.5
�6.3
b�1
0.8
�6.0
b�9
.2�
7.2
ab
�8.0
�7.2
ab
�7.5
�7.9
ab
AG
(mEq/L)
NaBic
22.8
�4.1
20.5
�4.7
22.8
�4.8
22.4
�4.3
21.9
�5.3
21.7
�5.7
.49
<.001
.01
NaCl
27.3
�5.9
24.2
�5.7*
24.7
�5.1
25.1
�5.7
23.4
�5.6*
22.4
�5.4*
Gluc
24.8
�5.3
20.8
�4.8*
22.5
�4.8
22.8
�4.2
22.7
�4.3
21.6
�3.8
Strongiondifference
acid-base
model
SID
3(m
Eq/L)
NaBic
38.5
�5.1*a
50.7
�6.1*a
48.9
�5.8*a
47.2
�6.6*a
47.5
�6.9*a
46.7
�6.8*a
.012
.008
<.001
NaCl
41.6
�5.1
a36.9
�5.0*b
38.1
�4.7
b38.8
�5.0
b38.0
�5.1
b38.0
�4.8
b
Gluc
43.5
�7.9
a38.4
�7.4*b
39.9
�7.3
b41.7
�6.9
ab
43.0
�6.3
ab
42.1
�6.2
ab
SID
7(m
Eq/L)
NaBic
36.0
�6.0
a45.9
�7.1*a
43.9
�6.5*a
42.6
�7.7*a
43.1
�7.7*a
42.9
�8.0*a
.14
.011
<.001
NaCl
39.2
�4.0
a34.8
�4.3*b
36.2
�3.9*b
37.1
�4.1
a36.5
�5.0
a36.7
�4.7
a
Gluc
41.1
�5.3
a35.3
�4.7*b
36.4
�4.8*b
38.7
�4.4
a40.5
�4.4
a39.9
�4.4
a
A�(m
Eq/L)
NaBic
13.0
�2.7
a12.9
�1.4
a13.1
�1.7
a13.3
�1.9
a13.2
�2.0
a13.4
�2.2
a.068
<.001
<.001
NaCl
13.0
�2.3
a10.1
�1.9*b
10.8
�1.9*a
11.4
�1.8*a
11.7
�1.7
a11.9
�1.9
a
Gluc
13.7
�1.6
a9.7
�1.4*b
10.8
�1.6*a
12.0
�1.7*a
12.5
�1.8
a12.9
�1.8
a
SIG
(mEq/L)
NaBic
�9.3
�5.8
a�7
.6�
5.1*a
�9.7
�5.6
a�9
.1�
4.8
a�8
.6�
5.9
a�8
.2�
6.1
a.25
<.001
<.001
NaCl
�14.3
�7.4
a�1
4.0
�6.9
b�1
3.9
�6.2
a�1
3.7
�6.5
a�1
1.7
�6.0
a�1
0.5
�6.1
a
Gluc
�11.2
�5.0
a�1
1.1
�5.1
ab
�11.7
�4.8
a�1
0.8
�4.5
a�1
0.2
�4.6
a�8
.7�
4.3
a
Clinicalbiochem
istryanalysis
L-lactate
(mmol/L)
NaBic
3.0
�1.9
4.6
�3.0*
5.0
�3.1*
4.7
�3.0*
4.3
�2.8
4.0
�2.7
.86
.001
.002
NaCl
4.6
�3.6
4.3
�3.6
4.1
�3.4
3.8
�3.5
3.6
�3.2
3.4
�3.1
Gluc
4.6
�2.8
4.9
�2.6
5.4
�2.4
5.0
�2.6
4.6
�2.4
4.2
�2.4
D-lactate
(mmol/L)
NaBic
2.25(0.46–2.91)
2.52(0.54–3.47)
2.47(0.59–3.40)
2.48(0.60–3.28)
2.47(0.58–3.17)
2.33(0.58–3.21)
.79
.27
.079
NaCl
1.47(0.78–3.82)
1.40(0.61–3.21)
1.41(0.71–3.40)
1.48(0.83–3.57)
1.46(0.72–3.69)
1.47(0.87–3.51)
Gluc
1.37(0.25–4.94)
1.41(0.23–4.86)
1.37(0.30–4.85)
1.36(0.34–5.03)
1.38(0.31–4.99)
1.38(0.24–5.23)
(continued)
912 Trefz et al

Table
2(C
ontinued)
Variable
Baseline
Tim
eAfter
Start
ofTreatm
ent
P-value
15minutes
30minutes
60minutes
90minutes
120minutes
Group
Tim
eTim
e9
group
Urea(m
mol/L)
NaBic
18.6
�7.7
a18.3
�7.6
a18.3
�7.8
a18.3
�7.8
a18.0
�7.7
a17.9
�7.8
a.015
.019
.68
NaCl
31.7
�12.2
b31.2
�12.0*b
31.2
�12.0
b31.2
�12.3
b31.1
�12.5
b30.8
�12.5
b
Gluc
18.2
�5.1
a18.0
�5.0
a18.0
�5.1
a17.9
�5.2
a17.9
�5.3
a17.9
�5.4
a
Creatinine(lmol/L)
NaBic
317(150–401)
300(142–377)*
307(138–370)*
297(136–3
57)*
290(129–342)*
287(125–331)*
.4<.001
.32
NaCl
406(206–708)
380(190–666)*
385(186–683)*
384(180–6
94)*
379(175–699)*
371(170–702)
Gluc
327(245–406)
317(246–392)
319(238–404)
314(230–4
13)
311(228–425)
306(219–426)
Totalprotein
(g/L)
NaBic
68.9
�7.0
a54.9
�4.8*ab
59.2
�4.9*a
60.1
�6.1*a
59.5
�6.4*a
59.9
�7.1*a
.22
<.001
<.001
NaCl
76.0
�7.0
a59.9
�5.8*a
63.6
�5.1*a
65.0
�4.7*a
65.1
�5.2*a
64.6
�5.0*a
Gluc
72.9
�8.8
a51.4
�5.9*b
57.8
�7.3*a
63.0
�8.2*a
65.4
�8.1*a
66.7
�8.6*a
P(m
mol/L)
NaBic
3.7
�1.1
3.4
�1.0*
3.4
�0.9*
3.3
�0.9
3.2
�0.9*
3.1
�0.9*
.78
<.001
.052
NaCl
4.1
�1.3
3.6
�1.1*
3.6
�1.1*
3.6
�1.1*
3.5
�1.0*
3.4
�1.0*
Gluc
3.9
�0.9
3.4
�0.9*
3.3
�0.9*
3.1
�0.9*
3.1
�0.9*
3.0
�0.9*
Electrolytes
Cl(m
mol/L)
NaBic
97�
12a
92�
12*a
93�
12*a
94�
12*ab
94�
12*a
94�
12*a
.012
<.001
<.001
NaCl
94�
7a
110�
7*b
108�
7*b
106�
7*a
106�
7*a
106�
7*a
Gluc
98�
10a
89�
9*a
91�
10*a
93�
10*b
94�
10*a
96�
11*a
Ca(m
mol/L)
NaBic
1.18(1.16–1.21)a
0.97(0.94–1.01)*
a1.02(0.98–1.08)*
a0.99(0.92–1.02)*
a0.99(0.90–1.09)*
a1.02(0.94–1.08)*
a.018
<.001
<.001
NaCl
1.20(1.10–1.28)a
1.17(1.09–1.23)b
1.18(1.13–1.26)a
1.20(1.16–1.23)b
1.18(1.15–1.23)b
1.17(1.13–1.22)b
Gluc
1.18(1.14–1.33)a
1.08(1.05–1.23)*
b1.12(1.11–1.26)*
a1.18(1.12–1.27)b
1.16(1.12–1.27)b
1.18(1.13–1.23)b
Mg(m
mol/L)
NaBic
1.06�
0.23a
0.88�
0.18*a
0.92�
0.18*a
0.91�
0.17*a
0.91�
0.16*a
0.91�
0.13*a
.03
<.001
.013
NaCl
1.36�
0.30a
1.22�
0.24*b
1.24�
0.24*b
1.27�
0.23b
1.25�
0.25b
1.23�
0.24*b
Gluc
1.30�
0.32a
1.09�
0.24*ab
1.14�
0.24*ab
1.19�
0.25ab
1.22�
0.24b
1.23�
0.24b
Hem
atology
PCV
(%)
NaBic
46�
13
37�
10*
39�
11*
39�
11*
39�
11*
39�
11*
.78
<.001
<.001
NaCl
46�
738�
7*
40�
7*
40�
7*
40�
7*
41�
8*
Gluc
51�
12
37�
10*
40�
10*
43�
11*
45�
11*
45�
11*
Hb(m
mol/L)
NaBic
9.0
�2.4
7.4
�1.9*
7.8
�1.9*
7.8
�2.0*
7.7
�2.0*
7.7
�2.0*
.89
<.001
<.001
NaCl
9.0
�1.5
7.6
�1.3*
7.9
�1.4*
8.0
�1.4*
8.0
�1.4*
8.0
�1.5*
Gluc
9.6
�2.2
7.2
�1.8*
7.7
�1.7*
8.3
�1.9*
8.6
�2.0*
8.7
�2.0*
pCO
2,partialpressure
ofcarbondioxide;
BE,base
excess;AG,aniongap;SID
3,strongiondifference
calculatedfrom
3strongcationsandanions;
SID
7,strongiondifference
calculated
from
7strongcationsandanions;A
�,totalnet
anionchargeofnonvolatile
weakacids;SIG
,strongiongap;PCV,packed
cellvolume;
Hb,hem
oglobin;D
Plasm
avol.,Changein
plasm
avol-
umeextrapolatedfrom
thechangein
totalprotein
concentration;P,inorganic
phosphorus.
Laboratory
findingsatt=7,10,20,40,50,and75minutesafter
start
oftreatm
entare
notshown
butwereincluded
intherepeated-m
easuresANOVA
ifavailable.
Values
are
reported
asmean�
SD
ormedian
andinterquartileranges.Differentlettersindicate
astatisticalsignificantdifference
between
groupsattherespectivetimepoint(P
<.05).
Asterisksindicate
values
thatare
significantlydifferentfrom
baseline(P
<.05).
Treatment of Hyperkalemia in Diarrheic Calves 913

statistically significant time (P < .001) and time x group(P < .001) effect was observed for the calculated Na/Kratio. Administration of sodium bicarbonate was theonly treatment that resulted in an increase in the Na/K-ratio, which was significantly different from baselineduring the whole study period. In contrast, a statisti-cally significant increase in the Na/K ratio was onlydetectable until 40 minutes in group NaCl and at90 minutes and 120 minutes in calves of group Gluc.
Changes in plasma volume during the study periodare illustrated by Figure 4. There was a statistically sig-nificant effect (P < .001) of time and time 9 group,
but the effect of group was not significant (P = .13).The changes in plasma volume relative to baseline weresignificantly higher in calves of group Gluc between 7and 20 minutes than for calves of groups NaCl andNaBic.
Clinical Biochemistry, Hematologic Analysis, andChanges in Ionized Calcium Concentrations
Hematologic and plasma biochemical variables strati-fied by treatment groups and sampling times andrespective results of the repeated-measures ANOVA are
Fig 2. Changes (mean � SD) in venous bicarbonate concentra-
tions (A) and venous blood pH values (B) in 22 neonatal diarrheic
calves after injections of an 8.4% sodium bicarbonate solution in
a dosage of 6.4 mL/kg body mass (ο; n = 7), 7.5% sodium chlo-
ride solution in a dosage of 5 mL/kg body mass (□; n = 8), or a
46.2% glucose solution in a dosage of 5 mL/kg body mass (D;n = 7) over a period of five min and subsequent administration of
an oral electrolyte solution. Values with different letters differed
significantly between groups (P < .05). Values with a filled symbol
differ significantly from baseline (P < .05). Values for groups
NaBic and Gluc were slightly offset at each time point to improve
readability.
Fig 3. Changes (mean � SD) in plasma sodium concentrations
(A) and the sodium-to-potassium ratio (B) in 22 neonatal diarrheic
calves after injections of an 8.4% sodium bicarbonate solution in
a dosage of 6.4 mL/kg body mass (ο; n = 7), 7.5% sodium chlo-
ride solution in a dosage of 5 mL/kg body mass (□; n = 8), or a
46.2% glucose solution in a dosage of 5 mL/kg body mass (D;n = 7) over a period of five min and subsequent administration of
an oral electrolyte solution. Values with different letters differed
significantly between groups (P < .05). Values with a filled symbol
differ significantly from baseline (P < .05). Values for groups
NaBic and Gluc were slightly offset at each time point to improve
readability.
914 Trefz et al

also presented in Table 2. Infusions of the 46.2% glu-cose solution resulted in a large increase in plasma glu-cose and insulin concentration that differed significantlyfrom baseline and from calves of groups NaCl andNaBic throughout the study period (Fig 5).
No statistically significant group, but time effectswere observed for plasma concentrations of creatinine,phosphorus, and total protein as well as for PCV andblood hemoglobin concentrations. A significant groupand time, but no time 9 group effect was detectable forplasma urea concentrations. D-lactate concentrationsdid not change significantly from baseline values in alltreatment groups. However after start of treatment, astatistically significant rise of plasma L-lactate concen-trations was detectable in calves of group NaBic. Statis-tically significant group, time, and time 9 group effectswere also observed for ionized calcium concentrations(Table 2).
Outcome of Treatment
After a mean duration of 12 � 5 days of hospitaliza-tion 21 out of the 22 calves were discharged in ahealthy state. One calf of group NaCl had to be eutha-nized for reasons of an advanced pneumonia, whichhad progressed during hospitalization.
Discussion
The aim of the present study was to document theplasma potassium-lowering effect of hypertonic saline-,glucose-, and sodium bicarbonate-containing infusionsolutions in the initial treatment of hyperkalemic
diarrheic calves. Central findings of this study suggest atreatment advantage of sodium bicarbonate over theuse of hypertonic saline- or glucose-containing infusionsolutions as indicated by Diff K values in calves ofgroup NaBic being 1.2 mmol/L lower at the end of the120 minutes study period than in calves of groupsNaCl, and also by a more rapid initial potassium-lower-ing response in calves of group NaBic when comparedto calves of group Gluc.
Rapid correction of hyperkalemia is considered deci-sive in the treatment of affected calves and associatedclinical alterations, which are characterized by cardiacconduction abnormalities and arrhythmias, marked
Fig 4. Mean plasma volume changes � SD in 22 neonatal diar-
rheic calves after injections of an 8.4% sodium bicarbonate solu-
tion in a dosage of 6.4 mL/kg body mass (ο; n = 7), 7.5% sodium
chloride solution in a dosage of 5 mL/kg body mass (□; n = 8), or
a 46.2% glucose solution in a dosage of 5 mL/kg body mass (D;n = 7) over a period of five min and subsequent administration of
an oral electrolyte solution (please see text for details). Values with
different letters differed significantly between groups (P < .05).
Values for groups NaBic and Gluc were slightly offset at each time
point to improve readability.
Fig 5. Changes in plasma glucose (A; mean � SD) and insulin
(B; median and interquartile ranges) concentrations in 22 neonatal
diarrheic calves after injections of an 8.4% sodium bicarbonate
solution in a dosage of 6.4 mL/kg body mass (ο; n = 7), 7.5%
sodium chloride solution in a dosage of 5 mL/kg body mass (□;
n = 8), or a 46.2% glucose solution in a dosage of 5 mL/kg body
mass (D; n = 7) over a period of five min and subsequent adminis-
tration of an oral electrolyte solution. Values with different letters
differed significantly between groups (P < .05). Values with a filled
symbol differ significantly from baseline (P < .05). Values for
groups NaBic and NaCl were slightly offset at each time point to
improve readability.
Treatment of Hyperkalemia in Diarrheic Calves 915

dehydration, and skeletal muscle weakness in spite ofnormal or only slightly elevated D-lactate concentra-tions,8,13 as also observed in calves of the present study.An immediate and sustained potassium-lowering effectof hypertonic (8.4%) sodium bicarbonate infusion solu-tion has already been demonstrated in previous stud-ies,17,18,38 with the observed initial decrements of cKbeing most closely associated with increases in venousblood pH.17 Despite those findings, it still remained tobe elucidated if the potassium-lowering effect of sodiumbicarbonate-containing infusion solutions is related tothe administered sodium load, plasma volume expan-sion, or alkalinization. In the present study, the admin-istered infusion solutions in calves of groups NaBic andNaCl differed only in the alkalinizing capacity as thesodium load of those solutions was identical and differ-ences in osmolarity were counterbalanced by a higherinfusion volume in calves of group NaBic, whichresulted in a similar increase in plasma volume in thosegroups. The findings that administration of hypertonicsaline resulted only in a short-term decrease in cK andthat administration of sodium bicarbonate was associ-ated with a more pronounced and sustained potassium-lowering effect therefore indicates that alkalinizationrepresents an effective potassium-lowering mechanism inneonatal hyperkalemic diarrheic calves. This finding isalso consistent with the current understanding of cellu-lar transport processes that are involved in the extrare-nal potassium homeostasis in as much that increases inextracellular cHCO�
3 induce a compartmental shift ofpotassium ions by enhancing cellular Na+ uptake via aNa+/HCO�
3 cotransport and Na+/H+ exchange, whichresults in stimulation of Na+/K+-ATPase activity andconsequently in a net cellular uptake of potassiumions.39
The use of sodium bicarbonate in the treatment ofacute hyperkalemia has been a controversial issue,11
which is particularly based on studies in dogs withexperimentally induced hyperkalemia (after KCl infu-sions) and human patients with end-stage renal diseasewhere intravenous administration of isotonic or hyper-tonic sodium bicarbonate solution was documented tobe ineffective in lowering cK.40–43 However, there is afundamental difference between these studies in that theoccurrence of hyperkalemia in patients with end-stagerenal disease is mainly related to a disturbance of exter-nal potassium balance (i.e, dysbalance between potas-sium intake and excretion), which is different to thesituation in neonatal diarrheic calves. Therefore, resultsof studies that are based on treatment observations inpatients with end-stage renal disease or an experimentalsetting where dogs are infused with KCl are unlikelysuitable for extrapolation of treatment strategies toneonatal diarrheic calves. Interestingly, there are alsostudies that documented a potassium-lowering effect ofsodium bicarbonate in acidotic humans.44,45 As anexplanation for the existent discrepancies a recentreview article39 discussed that the potassium-loweringeffect of sodium bicarbonate depends on the presence ofmetabolic acidosis and more importantly on the degreeof intracellular acidosis as intracellular Na+ entry by
Na+–H+ exchange and Na+-bicarbonate cotransport isgreater when intracellular pH and HCO�
3 are reduced.This would explain why sodium bicarbonate has amarked potassium-lowering effect in acidemic neonataldiarrheic calves.
In the light of those issues, it also needs to be consid-ered that treatment of hyperkalemia in diarrheic calvesis usually not addressed as an isolated problem becausetreatment objectives should also focus on correction ofconcomitant dehydration and metabolic acidosis; espe-cially correction of metabolic acidosis is considereddecisive in the treatment of critically ill diarrheiccalves46 and sodium bicarbonate has been shown to bethe alkalinizing agent of choice in this case.47
Despite the fact that administration of sodium bicar-bonate was associated with a significantly higher decre-ment of cK than in group NaCl at the end of the120 minutes study period, clinical findings such as pos-ture, behavior, and strength of the suckling reflex werenot significantly differing between treatment groups.This might be related to the finding that irrespective oftreatment groups, many calves were still clinically dehy-drated and therefore still in a critical condition. How-ever, in the light of those findings it needs to be clearlyemphasized that it was the aim of the present study tocompare the potassium-lowering efficiency of differenthypertonic infusion solutions in the initial treatment ofhyperkalemic calves and not to test the resuscitativeeffect of a single injection of hypertonic infusion solu-tion and subsequent suckling of an oral electrolyte solu-tion. Nevertheless, given the facts that hyperkalemia inneonatal diarrheic calves is associated with markeddehydration and that an incomplete restoration ofpotassium homeostasis was even observed in calves ofgroups NaBic in spite of alkalinization and correctionof acidosis, our findings suggest that rehydration shouldbe another goal in the treatment of hyperkalemic calvesas also indicated by the results of a recent observationalstudy.17 Although not assessed in the present study, it islikely that administration of an additional volume ofcrystalloid infusion solutions would have resulted in amore rapid decline in cK through a more sus-tained plasma volume expansion and renal potassiumexcretion.
In recent years, hypertonic rehydration strategies con-sisting of administration of small volumes of hypertonic(7.2 or 7.5%) sodium chloride with or without dextranin combination with oral electrolyte solutions have beenevaluated as an alternative to traditional isotonic IVfluid administration or oral rehydration in dehydratedneonatal diarrheic calves.18,48–52 Some of thosestudies49,50,52 reported a similar or even better treatmentsuccess of hypertonic rehydration when compared to IVadministration of different amounts of isotonic fluids.Also a sustained plasma potassium-lowering effect ofhypertonic saline solution was reported in somestudies,48,49,51 which is different than the results of thepresent investigation. However, it needs to be consid-ered that those investigations were predominantly per-formed in calves with experimentally induced diarrheaand dehydration. Although some research groups48,49,51
916 Trefz et al

were also able to induce an increase in plasma potas-sium concentrations, they usually observed only slightderangements of acid-base status and failed to repro-duce the complex metabolic alterations that are usuallyseen in markedly acidemic calves with naturallyacquired diarrhea, which likely explains the differencesto results of the study reported here. Also in a 2008study18 evaluating the resuscitative effect of oral rehy-dration in combination with a 5.85% saline solution(5 mL/kg BW) or 8.4% sodium bicarbonate (10 mL/kgBW) in profoundly acidemic calves with naturallyacquired diarrhea, serum potassium concentrationsremained unchanged (7.7 � 2.0 mmol/L) after a periodof 60 minutes after administration of hypertonic salineand subsequent suckling or tube feeding of 3 L of anelectrolytes solution, as it was also the case in thepresent study. An important finding of that study18
was also that hypertonic rehydration with saline had alower success rate (63%) than that with sodium bicar-bonate (92%), which was related to an incompletecorrection of acidosis and associated clinical alterationsin calves that were initially presented with severeacidemia.
Induction of a paradoxical intracellular and cero-brospinal fluid (CSF) acidosis has been listed as apotential adverse effect of rapid administration of (hy-pertonic) sodium bicarbonate solutions, as the resultingbuffer reaction might not only result in a rapid andlarge increase in CO2 in the blood, but also in the CSFand intracellular space, as CO2 is able to rapidly dif-fuse across cell membranes and the blood-brainbarrier.46,53,54 However, experimental studies55,56 failedto induce a paradoxical intracellular and CSF acidosisafter rapid administration of hypertonic55 or isotonic56
sodium bicarbonate solutions to acidotic calves,strongly indicating that spontaneously ventilating ani-mals are sufficiently able to handle the resulting increasein pCO2. Those experimental studies55,56 were per-formed in normovolemic calves, but also in the presentstudy, only a slight and not statistically significantincrease in blood pCO2 from 41.3 � 7.3 mmHg at base-line to 50 � 8.6 and 46.7 � 7.2 mmHg was even detect-able in dehydrated calves of group NaBic at 7 minutesand 10 minutes, respectively. Demyelinating brainlesions such as pontine myelinolysis might theoreticallyrepresent another complication of rapid IV adminis-tration of hypertonic sodium solutions as those condi-tions have been described as an adverse effect ofrapid correction of chronic and severe hypona-tremia in rats (cNa 95 � 0.7 mmol/L)57 and humans(cNa 97.3 � 6.7 mmol/L).58 Therefore, rapid increasein plasma sodium concentration might potentially resultin neurologic sequelae if hypertonic sodium solutionsare administered to chronically hyponatremic calves.However, central pontine myelinolysis after IV adminis-tration of hypertonic sodium solutions has to the bestof our knowledge so far not been described in neonataldiarrheic calves and it needs to be considered thathyponatremia in those animals is usually only moderateand less pronounced4,18,19,34,38 than it was the case inthe aforementioned studies.57,58
Remarkably, infusions with hypertonic sodium bicar-bonate resulted in a statistically significant increase inplasma L-Lactate concentration that was not observedin all other treatment groups. Similar observationswere also made in dogs with experimentally inducedlactic acidosis and hemorrhagic shock59,60 as well as inendotoxemic ponies.61 Also oral administration ofsodium bicarbonate before high-intensity exercise test-ing resulted in a significant more pronounced rise ofblood L-lactate concentrations during strenuous exer-cise in humans and horses when compared to controlinterventions.62,63 A shift of lactate from the intracellu-lar to the extracellular space in response to alkaliniza-tion represents a plausible explanation for thoseobservations, as a rise of the pH gradient between com-partments favored lactate release from muscle inin vitro studies.64,65 A similar increase after administrationof sodium bicarbonate was not observed for D-lactate inthe present study. However, it needs to be emphasizedthat D-lactate concentrations of most calves werewithin an established reference range for bucket-fedcalves of ≤3.96 mmol/L,66 which is in agreement withour previous findings that hyperkalemia in diarrheiccalves is rarely associated with D-lactic acidosis.4,8
However given the fact that D-lactate is only pro-duced in minimal amounts in the methylglyoxal path-way in mammals,67 a therapeutic effect on D-lactateconcentrations could still be expected. Previous studieson the dynamics of plasma D-lactate concentrationduring the course of treatment have shown that com-plete normalization of plasma D-lactate concentrationcan require a period of 24 hours or more.19,68,69 Theunderlying mechanisms have still not been completelyclarified, but are most likely due to alkalinization andincreased renal elimination triggered by enhancementof renal perfusion after rehydration.70 Unchangedplasma D-lactate concentration in calves of the pre-sent study can therefore be explained by the shortstudy period, incomplete rehydration of calves, andpersistent acidemia in calves of groups NaCl andGluc.
Infusions with sodium bicarbonate also resulted in astatistically significant decrease in the ionized calciumconcentration with values that were significantly lowerat most time points than in calves of groups Gluc orNaCl (Table 2). This was likely a pH-dependent effectdue to increased binding at negatively charged sites atalbumin that became available with increased bloodpH.71 A similar decrease in the ionized calcium concen-tration as in NaBic-treated calves of the present studyhas also been previously observed during intravenousfluid therapy with sodium bicarbonate-containing infu-sions in diarrheic calves.72 The authors discussed thatthis decrease could be of clinical relevance, but obviousside reactions such as tetanic convulsions or musclecramps were not observed in the calves of the presentstudy. The ionized calcium concentration in bovineplasma can be corrected for change in pH from 7.40 byuse of the following equation:73 cCa2+ cor-rected = cCa2+ 9 10(�0.249[7.40�pH]). By use of thatequation, the median values (and interquartile ranges)
Treatment of Hyperkalemia in Diarrheic Calves 917

for cCa2+ in calves of group NaBic at baseline, and at30, 60, and 120 minutes after start of treatment wouldbe 1.06 (0.99–1.15), 1.02 (0.94–1.09), 0.99 (0.89–1.01),and 1.03 (0.89–1.09), respectively.
Findings of the present study also indicate that aci-demic diarrheic calves can release considerableamounts of insulin in response to a hyperglycemic glu-cose challenge. The presence of an acidemia-inducedinsulin resistance was recently suggested as one poten-tial mechanism that might impact the insulin-mediatedpotassium-lowering effect of glucose-containing infu-sion solutions in neonatal diarrheic calves.20 Unfortu-nately, the design of the present study does not allowany conclusion on the significance of this potentialmechanism, but we observed a potassium-loweringresponse in glucose-treated calves despite ongoing acid-emia with similar decrements of cK at 120 minutesand values for AUCDiff K than in calves of groupNaBic. However, in contrast to calves of groups NaBicand NaCl, cK values remained unchanged until 30 minin glucose-treated calves, which requires explanation asa marked increase in plasma volume was observed dur-ing the same period of time, which should have had adilutional effect on cK. As an explanation, increasedcK have also been described in response to hyper-glycemia in the absence of sufficient insulin or insulinresponsiveness in diabetic human patients.74,75 In theabsence of sufficient insulin, glucose acts as an effectiveosmole as it is unable to rapidly pass cell membranes,leading to extracellular hypertonicity, cellular shrink-age, and a subsequent increase in intracellular potas-sium concentration, which favors an efflux ofpotassium ions.76 Loss of intracellular potassium there-fore likely explains why no net change in cK wasobserved in spite of a marked increase in plasma vol-ume during the first 20 minutes after hypertonic glu-cose infusion. Sodium chloride as well as sodiumbicarbonate likely acted to a lesser extent as effectiveosmoles than glucose, as sodium and chloride ions canpass the cellular membrane and bicarbonate ions dissi-pate in water and carbon dioxide, which can be subse-quently eliminated through the lungs. Therefore, ahigher extent of cellular shrinkage might have occurredin glucose-treated calves until sufficient insulin wasreleased, which would also explain the significantlyhigher increase in plasma volume during the first20 minutes after treatment when compared to calves ofgroups NaCl and NaBic.
Another observed effect of hypertonic glucose infu-sions was a significant decrease in plasma sodium con-centration, which was evident until 90 minutes andwhich resulted (together with the observed changes incK) in an unchanged sodium-to-potassium ratio duringthe same period of time. This effect together with adelayed potassium-lowering response represents apotential disadvantage of that solution over the use ofhypertonic sodium bicarbonate or sodium chloride incalves with acute hyperkalemia and associated cardiacconduction abnormalities as an immediate increase inthe sodium-to-potassium ratio is required to reverse the
cardiotoxic effects of hyperkalemia.20,21,77 Also, admin-istration of a hypertonic glucose solution (which has aneffective SID of 0 mEq/L) caused a significant decreasein measured plasma SID resulting in a slight acidifyingeffect, which was also observed in NaCl-treated calves.Although no negative clinical side reactions wereobserved in glucose-treated calves and all of thosecalves survived the study, the acidifying and hypona-tremic effect of an isolated IV administration of glucosemight be even detrimental in calves with a moreextreme hyperkalemia than in the 7 calves of the pre-sent study (cK 6.8 � 0.9 mmol/L) because the car-diotoxic effects of hyperkalemia can be exacerbated bythe presence of acidemia and hyponatremia.11,21 How-ever, a significantly more pronounced decrease in cKafter a combined treatment of sodium bicarbonate, glu-cose, and insulin when compared to administration ofsodium bicarbonate alone has been reported in hyper-kalemic humans78 and in a recent study on hyper-kalemic diarrheic calves.16
Although our study provided valuable informationin respect to the plasma potassium-lowering efficacyof different hypertonic infusions in the initial treat-ment of hyperkalemic diarrheic calves, our analyseshave also some limitations. One limitation is the smallnumber of calves, which was related to definition ofstrict criteria for inclusion into the study. Anotherlimitation is the observed variation of basal clinicaland laboratory conditions between calves and result-ing differences between treatment groups that couldnot be prevented in spite of randomization and thatmight have had an effect on the results of ouranalyses.
Conclusions
Hypertonic (8.4%) sodium bicarbonate solution has asound physiologic basis in the initial treatment ofneonatal hyperkalemic diarrheic calves, as those solu-tions induce rapid plasma volume expansion, correctconcomitant acidemia and have a marked and sustainedpotassium-lowering effect. Results of the present studysuggest a treatment advantage of sodium bicarbonateover the use of a hypertonic sodium chloride infusionwith an identical sodium load, indicating that alkalin-ization is an effective potassium-lowering mechanism.Acidemic neonatal diarrheic calves can release consider-able amounts of insulin in response to a hyperglycemicglucose challenge, which resulted in a similar decline incK than in calves after administration of sodium bicar-bonate. However, a delayed potassium-lowering effectand a resultant decrease in plasma sodium concentra-tion negatively influencing the plasma sodium-to-potas-sium ratio, as well as nonalkalinizing capacity, arepotential disadvantages over the use of sodium bicar-bonate solutions. However, the resultant endogenousinsulin release of glucose solutions makes them poten-tially useful in the treatment of hyperkalemic calves asan additive to sodium bicarbonate-containing infusionsolutions.
918 Trefz et al

Footnotes
a Splittocan Infusionskatheter, 16-gauge, 150 mm, Walter
Veterin€ar Instrumente, Baruth, Germanyb Natriumhydrogencarbonat, 8.4% B. Braun Infusionsl€osung, B.
Braun Melsungen AG, Melsungen, Germanyc Hypertone Natriumchlorid-L€osung, 7.5 g/100 ml, B. Braun
Melsungen AG, Melsungen, Germanyd Glucose 500 mg/mL B. Braun Infusionsl€osung, B. Braun
Melsungen AG, Melsungen, Germanye Ampuwa�, Fresenius Kabi Deutschland GmbH, Bad Homburg,
Germanyf Effydral�, Zoetis Deutschland GmbH, Berlin, Germanyg Rapidpoint 405, Siemens Healthcare Diagnostics Inc., Tarrytownh Cobas c 311, Roche Diagnostics, Mannheim, Germanyi Insulin Bovine ELISA, kit EIA-4748, DRG Instruments GmbH,
Germany; provided by Mercodia, Uppsala, Swedenj Johansson A, Olander S, Ludvigsen E. A novel sandwich ELISA
for the measurement of insulin in bovine serum and plasma.
Available at: https://www.mercodia.com/mercodia-bovine-insulin-
elisa. Accessed February 28, 2017k poCH-100iV Diff, Sysmex Corporation, Kobe, Japanl SPSS, version 18.0, IBM, New Yorkm GraphPad Prism, version 7.01, GraphPad Software Inc., La
Jollan R, version 3.3.1, R Foundation for statistical computing, Vienna,
Austria
Acknowledgments
Conflict of Interest Declaration: Authors declare noconflict of interest.
Off-label Antimicrobial Declaration: Authors declareno off-label use of antimicrobials.
References
1. Lorenz I. Influence of D-lactate on metabolic acidosis and
on prognosis in neonatal calves with diarrhoea. J Vet Med A
Physiol Pathol Clin Med 2004;51:425–428.2. Constable PD, St€ampfli HR, Navetat H, et al. Use of a
quantitative strong ion approach to determine the mechanism for
acid-base abnormalities in sick calves with or without diarrhea.
J Vet Intern Med 2005;19:581–589.3. Trefz FM, Lorch A, Feist M, et al. Metabolic acidosis in
neonatal calf diarrhea-clinical findings and theoretical assessment
of a simple treatment protocol. J Vet Intern Med 2012;26:162–170.
4. Trefz FM, Constable PD, Sauter-Louis C, et al. Hyper-
kalemia in neonatal diarrheic calves depends on the degree of
dehydration and the cause of the metabolic acidosis but does not
require the presence of acidemia. J Dairy Sci 2013;96:7234–7244.5. Trefz FM, Constable PD, Lorenz I. Quantitative physico-
chemical analysis of acid-base balance and clinical utility of anion
gap and strong ion gap in 806 neonatal calves with diarrhea. J Vet
Intern Med 2015;29:678–687.6. Trefz FM, Lorch A, Zitzl J, et al. Risk factors for the devel-
opment of hypokalemia in neonatal diarrheic calves. J Vet Intern
Med 2015;29:688–695.7. Lewis LD, Phillips RW. Water and electrolyte losses in
neonatal calves with acute diarrhea. A complete balance study.
Cornell Vet 1972;62:596–607.
8. Trefz FM, Lorch A, Feist M, et al. The prevalence and clini-
cal relevance of hyperkalaemia in calves with neonatal diarrhoea.
Vet J 2013;195:350–356.9. Lewis L, Phillips R. Diarrheic induced changes in intracellu-
lar and extracellular ion concentrations in neonatal calves. Ann
Rech V�et�er 1973;4:99–111.10. Sweeney RW. Treatment of potassium balance disorders.
Vet Clin North Am Food Anim Pract 1999;15:609–617.11. Evans KJ, Greenberg A. Hyperkalemia: A review. J Inten-
sive Care Med 2005;20:272–290.12. Fisher EW, McEwan AD. Death in neonatal calf diarrhoea.
Pt. II: The role of oxygen and potassium. Br Vet J 1967;123:4–7.13. Weldon AD, Moise NS, Rebhun WC. Hyperkalemic atrial
standstill in neonatal calf diarrhea. J Vet Intern Med 1992;6:294–297.
14. Constable PD. Hypertonic saline. Vet Clin North Am Food
Anim Pract 1999;15:559–585.15. €Ozkan C, Altu�g N, Y€uksek N, et al. Assessment of electro-
cardiographic findings, serum nitric oxide, cardiac troponins and
some enzymes in calves with hyperkaliemia related to neonatal
diarrhoea. Revue M�ed V�et 2011;162:171–176.16. Altu�g N, Y€uksek N, €Ozkan C, et al. Serum potassium-low-
ering effects of insulin plus dextrose and adrenalin treatment that
enhance intracellular potassium transitions in hyperkalemic diar-
rheic calves. Pak Vet J 2016;36:140–144.17. Trefz FM, Lorch A, Zitzl J, et al. Effects of alkalinization
and rehydration on plasma potassium concentrations in neonatal
calves with diarrhea. J Vet Intern Med 2015;29:696–704.18. Koch A, Kaske M. Clinical efficacy of intravenous hyper-
tonic saline solution or hypertonic bicarbonate solution in the
treatment of inappetent calves with neonatal diarrhea. J Vet Intern
Med 2008;22:202–211.19. Trefz FM, Lorch A, Feist M, et al. Construction and vali-
dation of a decision tree for treating metabolic acidosis in calves
with neonatal diarrhea. BMC Vet Res 2012;8:238.
20. Constable PD, Gr€unberg W. Hyperkalemia in diarrheic
calves: Implications for diagnosis and treatment. Vet J
2013;195:271–272.21. Garcia-Palmieri MR. Reversal of hyperkalemic cardiotoxic-
ity with hypertonic saline. Am Heart J 1962;64:483–488.22. Kaplan JL, Eynon CA, Dalsey WC, et al. Hypertonic saline
treatment of severe hyperkalemia in nonnephrectomized dogs.
Acad Emerg Med 2000;7:965–973.23. Weisberg LS. Management of severe hyperkalemia. Crit
Care Med 2008;36:3246–3251.24. Rosic NK, Standaert ML, Pollet RJ. The mechanism of
insulin stimulation of (Na+, K+)-ATPase transport activity in
muscle. J Biol Chem 1985;260:6206–6212.25. Gr€unberg W, Morin DE, Drackley JK, et al. Effect of con-
tinuous intravenous administration of a 50% dextrose solution on
phosphorus homeostasis in dairy cows. J Am Vet Med Assoc
2006;229:413–420.26. DeFronzo RA, Beckles AD. Glucose intolerance following
chronic metabolic acidosis in man. Am J Physiol 1979;236:E328–E334.
27. Mak RH. Effect of metabolic acidosis on insulin action and
secretion in uremia. Kidney Int 1998;54:603–607.28. Niethammer FM. Untersuchungen zur Dehydratation bei
K€albern mit akuter Diarrhoe unter Ber€ucksichtigung ausgew€ahlter
klinischer und labordiagnostischer Parameter. Doctoral thesis.
Munich: Ludwig-Maximilians-University; 2007.
29. Constable PD, Walker PG, Morin DE, Foreman JH. Clini-
cal and laboratory assessment of hydration status of neonatal
calves with diarrhea. J Am Vet Med Assoc 1998;212:991–996.30. Thomas LJ. Algorithms for selected blood acid-base and
blood gas calculations. J Appl Physiol 1972;33:154–158.
Treatment of Hyperkalemia in Diarrheic Calves 919

31. Abuelo A, De Koster J, Hernandez J, et al. Quantifying
bovine insulin: Conversion of units. Vet Clin Pathol 2012;41:308–310.32. Siggaard-Andersen O. The van Slyke equation. Scand J
Clin Lab Invest Suppl 1977;37(Suppl 146):15–20.33. Constable PD. A simplified strong ion model for acid-base
equilibria: Application to horse plasma. J Appl Physiol
1997;83:297–311.34. M€uller KR, Gentile A, Klee W, Constable PD. Importance of
the effective strong ion difference of an intravenous solution in the
treatment of diarrheic calves with naturally acquired acidemia and
strong ion (metabolic) acidosis. J Vet Intern Med 2012;26:674–683.35. Riond JL, Kocabagli N, Spichiger UE, Wanner M. The
concentration of ionized magnesium in serum during the peripar-
turient period of non-paretic dairy cows. Vet Res Commun
1995;19:195–203.36. Van Beaumont W, Greenleaf JE, Juhos L. Disproportional
changes in hematocrit, plasma volume, and proteins during exer-
cise and bed rest. J Appl Physiol 1972;33:55–61.37. Gr€unberg W, Hartmann H, Burfeind O, et al. Plasma
potassium-lowering effect of oral glucose, sodium bicarbonate, and
the combination thereof in healthy neonatal dairy calves. J Dairy
Sci 2011;94:5646–5655.38. Coskun A, Sen I, Guzelbektes H, et al. Comparison of the
effects of intravenous administration of isotonic and hypertonic
sodium bicarbonate solutions on venous acid-base status in dehy-
drated calves with strong ion acidosis. J Am Vet Med Assoc
2010;236:1098–1103.39. Aronson PS, Giebisch G. Effects of pH on potassium: New
explanations for old observations. J Am Soc Nephrol
2011;22:1981–1989.40. Blumberg A, Weidmann P, Shaw S, Gn€adinger M. Effect of
various therapeutic approaches on plasma potassium and major
regulating factors in terminal renal failure. Am J Med
1988;85:507–512.41. Gutierrez R, Schlessinger F, Oster JR, et al. Effect of
hypertonic versus isotonic sodium bicarbonate on plasma potas-
sium concentration in patients with end-stage renal disease. Miner
Electrolyte Metab 1991;17:297–302.42. Blumberg A, Weidmann P, Ferrari P. Effect of prolonged
bicarbonate administration on plasma potassium in terminal renal
failure. Kidney Int 1992;41:369–374.43. Kaplan JL, Braitman LE, Dalsey WC, et al. Alkalinization
is ineffective for severe hyperkalemia in nonnephrectomized dogs.
Acad Emerg Med 1997;4:93–99.44. Fraley DS, Adler S. Correction of hyperkalemia by bicar-
bonate despite constant blood pH. Kidney Int 1977;12:354–360.45. Schwarz KC, Cohen BD, Lubash GD, Rubin AL. Severe
acidosis and hyperpotassemia treated with sodium bicarbonate
infusion. Circulation 1959;19:215–220.46. Berchtold J. Treatment of calf diarrhea: Intravenous fluid
therapy. Vet Clin North Am Food Anim Pract 2009;25:73–99.47. Kasari TR, Naylor JM. Clinical evaluation of sodium
bicarbonate, sodium L-lactate, and sodium acetate for the treat-
ment of acidosis in diarrheic calves. J Am Vet Med Assoc
1985;187:392–397.48. Constable PD, Gohar HM, Morin DE, Thurmon JC. Use
of hypertonic saline-dextran solution to resuscitate hypovolemic
calves with diarrhea. Am J Vet Res 1996;57:97–104.49. Walker PG, Constable PD, Morin DE, et al. Comparison
of hypertonic saline-dextran solution and lactated Ringer’s solu-
tion for resuscitating severely dehydrated calves with diarrhea.
J Am Vet Med Assoc 1998;213:113–121.50. Sent€urk S. Effects of a hypertonic saline solution and dex-
tran 70 combination in the treatment of diarrhoeic dehydrated
calves. J Vet Med A Physiol Pathol Clin Med 2003;50:57–61.51. Leal ML, Fialho SS, Cyrillo FC, et al. Intravenous hyper-
tonic saline solution (7.5%) and oral electrolytes to treat of calves
with noninfectious diarrhea and metabolic acidosis. J Vet Intern
Med 2012;26:1042–1050.52. Zafar MA, Muhammad G, Iqbal Z, et al. Evaluation of rel-
ative resuscitative effects of hypertonic and isotonic saline solu-
tions as an adjunct to ceftiofur HCl in bovine neonatal diarrhea
associated with Escherichia coli. Int J Agric and Biol 2015;17:
953–960.53. Eigenmann U, R€udiger B, Schoon H, Grunert E. Natri-
umbikarbonat- und Glukosebehandlung bei der Asphyxie des
Kalbes. Dtsch tier€arztl Wschr 1982;89:228–234.54. Iwabuchi S, Suzuki K, Abe I, Asano R. Comparison of the
effects of isotonic and hypertonic sodium bicarbonate solutions on
acidemic calves experimentally induced by ammonium chloride
administration. J Vet Med Sci 2003;65:1369–1371.55. Berchtold JF, Constable PD, Smith GW, et al. Effects of
intravenous hyperosmotic sodium bicarbonate on arterial and cere-
brospinal fluid acid-base status and cardiovascular function in
calves with experimentally induced respiratory and strong ion aci-
dosis. J Vet Intern Med 2005;19:240–251.56. Abeysekara S, Zello GA, Lohmann KL, et al. Infusion of
sodium bicarbonate in experimentally induced metabolic acidosis
does not provoke cerebrospinal fluid (CSF) acidosis in calves. Can
J Vet Res 2012;76:16–22.57. Sterns RH, Thomas DJ, Herndon RM. Brain dehydration
and neurologic deterioration after rapid correction of hyponatrem-
ia. Kidney Int 1989;35:69–75.58. Brunner JE, Redmond JM, Haggar AM, et al. Central pon-
tine myelinolysis and pontine lesions after rapid correction of
hyponatremia: A prospective magnetic resonance imaging study.
Ann Neurol 1990;27:61–66.59. Iberti TJ, Kelly KM, Gentili DR, et al. Effects of sodium
bicarbonate in canine hemorrhagic shock. Crit Care Med
1988;16:779–782.60. Benjamin E, Oropello JM, Abalos AM, et al. Effects of
acid-base correction on hemodynamics, oxygen dynamics, and
resuscitability in severe canine hemorrhagic shock. Crit Care Med
1994;22:1616–1623.61. Gossett KA, French DD, Cleghorn B, Church GE. Blood
biochemical response to sodium bicarbonate infusion during sub-
lethal endotoxemia in ponies. Am J Vet Res 1990;51:1370–1374.62. Ferrante PL, Taylor LE, Kronfeld DS, Meacham TN.
Blood lactate concentration during exercise in horses fed a high-
fat diet and administered sodium bicarbonate. J Nutr
1994;124:2738S–2739S.63. Egger F, Meyer T, Such U, Hecksteden A. Effects of
sodium bicarbonate on high-intensity endurance performance in
cyclists: A double-blind, randomized cross-over trial. PLoS ONE
2014;9:e114729.
64. Seo Y. Effects of extracellular pH on lactate efflux from
frog sartorius muscle. Am J Physiol 1984;247:C175–C181.65. Spriet LL, Lindinger MI, Heigenhauser GJ, Jones NL.
Effects of alkalosis on skeletal muscle metabolism and perfor-
mance during exercise. Am J Physiol 1986;251:R833–R839.
66. Lorenz I, Hartmann I, Gentile A. Determination of D-lac-
tate in calf serum samples – an automated enzymatic assay. Comp
Clin Path 2003;12:169–171.67. Ewaschuk JB, Naylor JM, Zello GA. D-lactate in human
and ruminant metabolism. J Nutr 2005;135:1619–1625.68. Reischer N. Dynamik der Serumkonzentration und Auss-
cheidung von D-Laktat bei jungen K€albern mit Durchfall. Doc-
toral thesis. Munich: Ludwig-Maximilians-University; 2012.
69. Lorenz I, Vogt S. Investigations on the association of
D-lactate blood concentrations with the outcome of therapy of aci-
dosis, and with posture and demeanour in young calves with diar-
rhoea. J Vet Med A Physiol Pathol Clin Med 2006;53:490–494.70. Lorenz I, Gentile A. D-lactic acidosis in neonatal rumi-
nants. Vet Clin North Am Food Anim Pract 2014;30:317–331.
920 Trefz et al

71. Pedersen KO. Binding of calcium to serum albumin. II.
Effect of pH via competitive hydrogen and calcium ion binding to
the imidazole groups of albumin. Scand J Clin Lab Invest
1972;29:75–83.72. Grove-White DH, Michell AR. Iatrogenic hypocalcaemia
during parenteral fluid therapy of diarrhoeic calves. Vet Rec
2001;149:203–207.73. Constable PD, Hinchcliff KW, Done SH, Gr€unberg W.
Disturbances of free water, electrolytes, acid-base balance, and
oncotic pressure. In: Constable PD, Hinchcliff KW, Done SH,
Gr€unberg W, eds. Veterinary Medicine: A Textbook of the Dis-
eases of Cattle, Horses, Sheep, Pigs and Goats, 11th ed. St. Louis:
Elsevier; 2017:113–152.
74. Nicolis GL, Kahn T, Sanchez A, Gabrilove JL. Glucose-
induced hyperkalemia in diabetic subjects. Arch Intern Med
1981;141:49–53.75. Viberti GC. Glucose-induced hyperkalaemia: A hazard for
diabetics? Lancet 1978;1:690–691.76. Weiner ID, Wingo CS. Hyperkalemia: A potential silent
killer. J Am Soc Nephrol 1998;9:1535–1543.77. Ballantyne F, Davis LD, Reynolds EW. Cellular basis for
reversal of hyperkalemic electrocardiographic changes by sodium.
Am J Physiol 1975;229:935–940.78. Kim HJ. Combined effect of bicarbonate and insulin with
glucose in acute therapy of hyperkalemia in end-stage renal disease
patients. Nephron 1996;72:476–482.
Treatment of Hyperkalemia in Diarrheic Calves 921


![Documento1 · LIA] Urdinola b Urdinola ACIb ACIDE . ACIDE . Title: Documento1 Author: Diego Created Date: 7/7/2017 10:22:58 AM](https://static.fdocuments.us/doc/165x107/5f3bc3c1bd11e4392659ed07/documento1-lia-urdinola-b-urdinola-acib-acide-acide-title-documento1-author.jpg)
