EFFECT OF INTEGRATED FINANCIAL MANAGEMENT · PDF fileEFFECT OF INTEGRATED FINANCIAL MANAGEMENT...
15
www.ijaemr.com Page 254 International Journal of Advanced Engineering and Management Research Vol. 2 Issue 2, 2017 www.ijaemr.com ISSN: 2456-3676 EFFECT OF INTEGRATED FINANCIAL MANAGEMENT INFORMATION SYSTEM USE IN KENYA : CASE OF GOVERNMENT TREASURY Sanja Michael Mutong’wa ¹, Anthony J Rodrigues², Samuel Liyala ³ School of Informatics and Innovative Systems, Jaramogi Odinga Oginga University of Science and Technology, Kenya. ¹ ² ³ [email protected] ¹, [email protected] ², [email protected] ³ ABSTRACT The IFMIS has not been a success in Africa and Kenya in Particular .Why it was unsuccessful in the continent is unknown .This study therefore, aims at examining to assess the effect of IFMIS use : case of Government Treasury. Much attention is directed towards the public sector. The study seeks to address: the efficiency of IFMIS in delivery of services in Government Treasury ,the accuracy of IFMIS in dissemination of information and lastly to underpine DeLone and McLean model in assessing the overall use of IFMIS in Government Treasury .The research subjected eight constructs from Delone & Mclean model. Data was adopted from the public sector by a Thesis where Government Treasury was as sector . Findings indicated that: RMSEA yielded the results of (0.027) which was < 0.05 indicating a good fit, hence IFMIS use agrees with the rule of thumb ,NFI yielded (0.98) and GFI (0.99) both results were > 0.9 indicating a better fit . On efficiency the results yielded a minimal error difference of 2% when the two models were compared, IFMIS use indicated a workable efficiency though not very accuracy in dissemination of information. Results also established that there was strong significant effect between the use of IFMIS and Information Quality (R= 0.708) with sig (.000), however a weak significant effect was yielded by Service Quality (R = 0.142) with sig (.004) on use of IFMIS at the Government Treasury .This research recommends future analysis by a technique of Bootstrapping in AMOS with comparison of various models .All in all this research contend that Delone & Mclean model Path diagrams has shown lower error disagreement on testing the effect of IFMIS Use and hence stand the time in Confirming that IFMIS use contributes to the Government Treasury to a certain percentage but the system is not very accuracy. Recommendation:¬¬__ Key Words: DeLone and McLean model, IFMIS Use, Government Treasury and Path diagrams
Transcript of EFFECT OF INTEGRATED FINANCIAL MANAGEMENT · PDF fileEFFECT OF INTEGRATED FINANCIAL MANAGEMENT...

www.ijaemr.com Page 254
International Journal of Advanced Engineering and Management Research
Vol. 2 Issue 2, 2017
www.ijaemr.com ISSN: 2456-3676
EFFECT OF INTEGRATED FINANCIAL MANAGEMENT INFORMATION SYSTEM USE IN KENYA : CASE OF GOVERNMENT
TREASURY
Sanja Michael Mutong’wa ¹, Anthony J Rodrigues², Samuel Liyala ³ School of Informatics and Innovative Systems, Jaramogi Odinga Oginga University of Science
and Technology, Kenya. ¹ ² ³ [email protected] ¹, [email protected] ², [email protected] ³
ABSTRACT
The IFMIS has not been a success in Africa and Kenya in Particular .Why it was unsuccessful in the continent is unknown .This study therefore, aims at examining to assess the effect of IFMIS use : case of Government Treasury. Much attention is directed towards the public sector. The study seeks to address: the efficiency of IFMIS in delivery of services in Government Treasury ,the accuracy of IFMIS in dissemination of information and lastly to underpine DeLone and McLean model in assessing the overall use of IFMIS in Government Treasury .The research subjected eight constructs from Delone & Mclean model. Data was adopted from the public sector by a Thesis where Government Treasury was as sector . Findings indicated that: RMSEA yielded the results of (0.027) which was < 0.05 indicating a good fit, hence IFMIS use agrees with the rule of thumb ,NFI yielded (0.98) and GFI (0.99) both results were > 0.9 indicating a better fit . On efficiency the results yielded a minimal error difference of 2% when the two models were compared, IFMIS use indicated a workable efficiency though not very accuracy in dissemination of information. Results also established that there was strong significant effect between the use of IFMIS and Information Quality (R= 0.708) with sig (.000), however a weak significant effect was yielded by Service Quality (R = 0.142) with sig (.004) on use of IFMIS at the Government Treasury .This research recommends future analysis by a technique of Bootstrapping in AMOS with comparison of various models .All in all this research contend that Delone & Mclean model Path diagrams has shown lower error disagreement on testing the effect of IFMIS Use and hence stand the time in Confirming that IFMIS use contributes to the Government Treasury to a certain percentage but the system is not very accuracy. Recommendation:¬¬__
Key Words: DeLone and McLean model, IFMIS Use, Government Treasury and Path diagrams

www.ijaemr.com Page 255
1.1 Background Africa possesses almost half of the world’s natural resources. These include minerals, rich forest
reserves, large water bodies as well as good climatic conditions. However, it is also one of the most impoverished areas in the world that lacks technical know-how to manage its resources for sustainable development. The problem has led to political upheaval, poor leadership within government leading in Corruption. Though these institutions are not strong and vibrant, the few mechanisms in place are either ineffective or unsustainable, which tend to have serious effects on economic growth. A good performing financial system leads to an increase in social value or efficiency within these systems. Thus, activities that provide private gains to individual sectors of the system but overall reduce its efficiency do not improve economic performance.
This study attest that Many African countries struggle when it comes to reforming public financial institutions. The author further argues that institutional systems and processes that deal with various aspects of public finances are weak and non-transparent. Often they are incapable of drawing adequate budgets, monitoring public expenditures, using public funds and investments efficiently and providing reliable data for macroeconomic modeling. When an investigation identifies problem areas and weaknesses, implementing reforms becomes a problem.
The Kenyan Government Treasury implemented IFMIS which ensured efficient management of public resources, effectively and transparently. A fully functioning IFMIS can lead to improved governance by providing real-time financial information that managers can use to administer programs effectively, formulate budgets and manage resources. In the year 2011, the Ministry of Finance through Kenyan Treasury embarked on a re-engineering process that sorted to alter the IFMIS from the modular approach .Treasury separately implemented modules which were loosely linked to the General Ledger to a full cycle end-to-end integrated approach. This was due to the challenges experienced in its initial implementation (Muigai, 2012). The Treasury made sure the IFMIS provided the governments with a tool that could support financial control, management and planning. By managing a core set of financial data and translating this into information for management. IFMIS in Kenya under went Re-engineering as an initiative of the Ministry of Finance to enhance efficiency and effectiveness in Public Financial Management (PFM). In February 28th 2011, the former Deputy Prime Minister and former Minister for Finance launched the IFMIS Re-engineering Strategic Plan (2011-2013).IFMIS Re-engineering undertook business process reviews of all public financial management processes and facilitated a review and removal of obsolete process steps. According to ( Act , 2012) the programme was activated into three new financial modules of Cash Management, Fixed Assets, and Purchasing Order in ten pilot ministries. The automation of Approval processes in transaction processing and payments in the system, the digitization of payment vouchers, Local Service and Purchase Orders. This research content that Re-engineering achievements included: Stabilization of three accounting modules - General Ledger, Purchasing Order and Accounts Payable and activation of

www.ijaemr.com Page 256
additional modules - cash management, accounts receivables, and fixed assets; Developed a new Single Chart of Accounts (SCOA) and mapped it into the IFMIS system ; 2012-2013 national budget developed using the new SCOA; District Vote book system updated with the new SCOA; Developed and implemented a Plan to Budget system that has enhanced the efficiency and effectiveness of budget making. In this study, the author considers IFMIS to consist of several elements with different functions. In the description that follows, the term “module” implies that the system is a sub-element in IFMIS. The system is supplied with additional analytical tools like Oracle Financial Analyzer and the Financial Statements Generator. A number of customizations were undertaken to configure the system to the government’s business processes (Bartel, 2009). The core
components of IFMIS include the following modules and systems: General ledger, Budgetary Accounting, Accounts payable and Accounts receivable. Bartel (2009) asserts that the ease of use, reliability, security, and flexibility of IFMIS meant to provide timely, accurate, and consistent data for cash management and users who note that IFMIS has weaknesses that need to be addressed. Study by Kiilu & Ngugi, (2014), appraised the effect of reforms in budgeting, enhanced revenue collection, revision of procurement laws, and IFMIS reform in the management of public funds in Kenya Ministry. They found that procurement reforms had the greatest effect on public fund management followed by budgeting reforms, then mentoring adoption of IFMIS, while tax revenue administration had the least effect to the effective public fund management.
Study by Dorotinsky (2003) and Rozner (2008), placed high premium on IFMIS as an information system that tracks financial events and summarizes financial information. It supports adequate management reporting, policy decisions, fiduciary responsibilities and the preparation of auditable financial statements. In its basic form, an IFMIS is little more than an accounting system configured to operate according to the needs and specifications of the environment in which it is installed (Rodin-Brown, 2008).
The author attests that IFMIS as an information system tracks financial events and summarizes financial information. He noted that in the government realm, IFMIS includes the computerization of PFM processes, from budget preparation and execution to accounting and reporting, with the help of an integrated system for financial management of line ministries, spending agencies and other public sector operations. The author placed high premium on IFMIS attesting that it consists of several elements with different functions. He identified the core of IFMIS to include the following modules and systems, General ledger, Budgetary accounting, Accounts payable and Accounts receivable, and the noncore or other modules as Payroll system, Budget development, Procurement, Project ledger and Asset module. In support, study done by(Rodin-Brown, 2008) erected strong support for its integration power ,arguing that its the key to any successful financial information .Integration implies that the system uses standard data classification for recording financial events; has internal controls over data entry, transaction processing, and reporting; and has common processes for similar transactions and a system design that eliminates unnecessary duplication of data entry.

www.ijaemr.com Page 257
2. LITERATURE REVIEW
2.0 DeLone and McLean Model This research underpinned DeLone and McLean model in assessing the effect of IFMIS use in Government Treasury . DeLone and McLean (2003) introduced an update to their IS success model. The main changes concerned quality, and service quality was included in the model. As discussed in DeLone and McLean, quality has three major dimensions: information quality, systems quality and service quality”. They also added ‘Intention to Use’ to the model. Finally,
they removed ‘Individual Impact’ and ‘Organizational Impact’ and replaced them with ‘Net
Benefits’; further, they added feedback loops to ‘Intention to Use’ and ‘User Satisfaction . In this
research the D&M model has been modified to meet the requirements set by several kinds of information systems, and from different points of view. DeLone and McLean (2004) model to evaluate the success of e-commerce systems. Further, Wang et al., (2007) used the model when they assessed the efficiency and success of e-learning information systems from the viewpoint of organizations and their employees. This research utilized the DeLone and McLean in testing the effect of IFMIS use in Government Treasury.
2.1 IFMIS Technology Architecture 3-Tier
Components to a Client Server System: This is a process that responds with the requested service to a client (Figure 2.1). The network can provide communication to multiple servers that service multiple clients. The overall application logic that the client/server architecture is designed to support has several components that can be distributed across clients and servers. The components are; Presentation Logic, Processing Logic and Storage Logic (figure 2.1). Presentation Logic: is a situation where end user interacts with the presentation logic tier.
Processing Logic: This component receives user input from the presentation logic component, validates the data, and applies the majority of business rules. This will require communication with the storage logic to retrieve additional data. Business transactions are processed in this component .Storage Logic:This component handles data retrieval and storage (in the physical storage devices) acting on specific requests from the processing logic component. The database management system (DBMS) is synonymous with storage logic. Presentation Layer: Graphical user interface (GUI) or browser for data entry or accessing system functions. Application Layer: Business rules, functions, logic, and programs acting on data received/transferred from/to the database servers. DatabaseLayer: Management of the organization’s operational or transactional
data including metadata; mostly employs industry standard RDBMS with structured query language (SQL) provisions .The logical arrangement assists the ERP user the interface to run on the Clients, the processing modules to run on the middle-tier application servers, and the database system to run on the database servers
Storage logic resides on the server, which is usually a database server in proximity to the (physical data storage). The processing logic is placed on either the client or on the server while the processing logic server is separate from the storage logic server. Application partitioning are

www.ijaemr.com Page 258
known as the process of writing programs that are distributed onto clients and servers as needed to maximize performance and data security Kale, (2012).
Three-tier architecture: As indicated in (Figure 2.1) server layers to manage the processing and storage logic. The processing logic resides on an application server that executes most application programs. Flexibility and scalability drive the drive towards three and higher tiered architectures. In this study Figure 2.1 (3-Tier Web-Based IFMIS Model) considers delineating the tiers, it is easier to swap out any one tier’s technology with a newer one without rewriting the codes. Scalability is achieved through the introduction of multiple application servers where a monitor for transaction processing measures the load on an application server. The three-tier architecture is the mainstay of IFMIS systems where thousands of end users may be accessing the application concurrently. (Figure 2.1) shows a typical schematic of an IFMIS system, which is a typical 3-Tier Web-Based IFMIS Model
ICT components: countrywide network connections (communications lines) as Government contribution, Web-based Application Software (ASW) as a combination of customized package + locally developed software ,central servers (database & application servers) and data storage units (fiber disk arrays) at the main system center & business continuity center, standard field hardware (domain servers, user workstations and peripherals) in central and field offices, network equipment, system and user management and engineering support solutions, countrywide network (physical) connections.

www.ijaemr.com Page 259
3. METHODOLOGY
3.0 Design Design: This research employed a cross-sectional descriptive survey. Surveys are a popular method of collecting data. The Survey utilized stratified random design in achieving the homogenous population of respondents. Secondary data was adopted from Thesis Research by Sanja, M., M.,(2017 ) for Government Treasury . 3.1 Results and Discussion
3.1.0 Assessing IFMIS Use by multiple regression analysis
The research subjected Delone and Mclean Model on test by multiple regression analysis to determine the effect of IFMIS use system in the public sector Y = α + β1 X1 + β2 X2 +β 3 X3+ β 4 X4 + β 5 X5 + e ---------(1) Y = IFMIS USE, X1= IUIF , X2= InfQ , X3= ServQ, X4= ServQ, X5= SystQ Y =α + x1(IUIF) + x 2(InfQ) + x 3(ServQ) + x 4 (SystQ) + e ---------(2)
Y = IFMIS USE, α= (7.759), IUIF = ( .318),InfQ = (.708) ,(ServQ)=(.142), (SystQ)=(.241) Therefore Equation for the Model Y = 7.759 + .318 (Intention to use) + .708 (InfQ) + .142 (ServQ)+ .241 (SysQ) ----------------(3)
Table 4.1 Dimension of Information Quality Vs Intention to use IFMIS (source Sanja M., M., 2017)
Model Unstandardized Coefficients
Standardized Coefficients
T Sig.
B Beta
(Constant) 7.759 12.564 .000
Intention to use IFMIS .318 .192 -1.711 .004
Information Quality .708 .694 -3.497 .000
System Quality .142 .320 5.154 .002
Service Quality .241 -.173 -2.041 .003
Figure 4.1 IFMIS Technology Architecture 3-Tier (source Thesis Sanja M.,M.,2017)

www.ijaemr.com Page 260
Dependent Variable: IFMIS Use
Discussion
Result in (Table 4.1) indicate that when all independent variables are held constant; a unit increase in Intention to use IFMIS causes an increase of IFMIS use a factor of 0.318; a unit increase in Information Quality causes an increase of IFMI use a factor of 0.708; a unit increase in Service Quality causes an increase of IFMIS use a factor of 0.142, finally unit increase in Service Quality causes an increase on IFMIS use by a factor of 0.241. Therefore, this study established that there was strong effect by Information Quality (b .708,) with sig (.000) on the use of IFMIS, however, a weak effect was established by Service Quality (b 0.142), sig (003 and the use of IFMIS , lastly, the study found out that the a weak effect was established by system Quality (0.241) with sig (.002) and the use of IFMIS . From the findings, IFMIS was found to be effective on use of IFMIS in Government Treasury, in both quantitative analysis and in regression analysis. This agrees with IMF (2006) findings on use of IFMIS in Government Treasury.
3.1.1 Delone & Mclean model using Dimension Quality Path diagrams The research is primarily interested in the path diagrams difference and error approximation, which is more concerned to check accuracy in terms of information delivery of IFMIS use and to establish the effect of IFMIS use in Government Treasury. By utilizing the Path diagrams the author presents the path split latent’s variables on: System Quality, Information Quality and Service Quality ; the dependent variables here termed as System Fine Tuning Model Constructs to assess IFMIS use . Delone & Mclean model Path diagrams are hypothesized to depend on the single Underlying latent variable-Information Quality : InQ1 (InformationQuality1), InQ2 (Information Quality 2) andInQ3(Information Quality3) known as indicators of the latent variable Information Quality .

www.ijaemr.com Page 261
Figure 4.2 Delone & Mclean model Path diagram(source Sanja M.,M.,2017)
Discussion The analysis was done by AMOS ,its scores obtained indicated that the split- subtests as shown on results in (figure 4.2) yielded e1= 0.04 and e2 = 0.03 when compared , the differences in error posted by Information Quality (e1 - e2) = 0.01 with a percentage difference of 1% , System Quality e4 = 0.06 and e6 = 0.01; difference (e4 – e6) = 0.05 a percentage difference of 5%, which posted a higher differences in error ; Service Quality e7 = 0.05 and e8 = 0.04;difference (e7 – e8) = 0.01 with a percentage difference of 1%. According to (Fig 4.2), scores on the three subtests disagree owing to the influence of measurement errors Ananda , K., P., (2010).
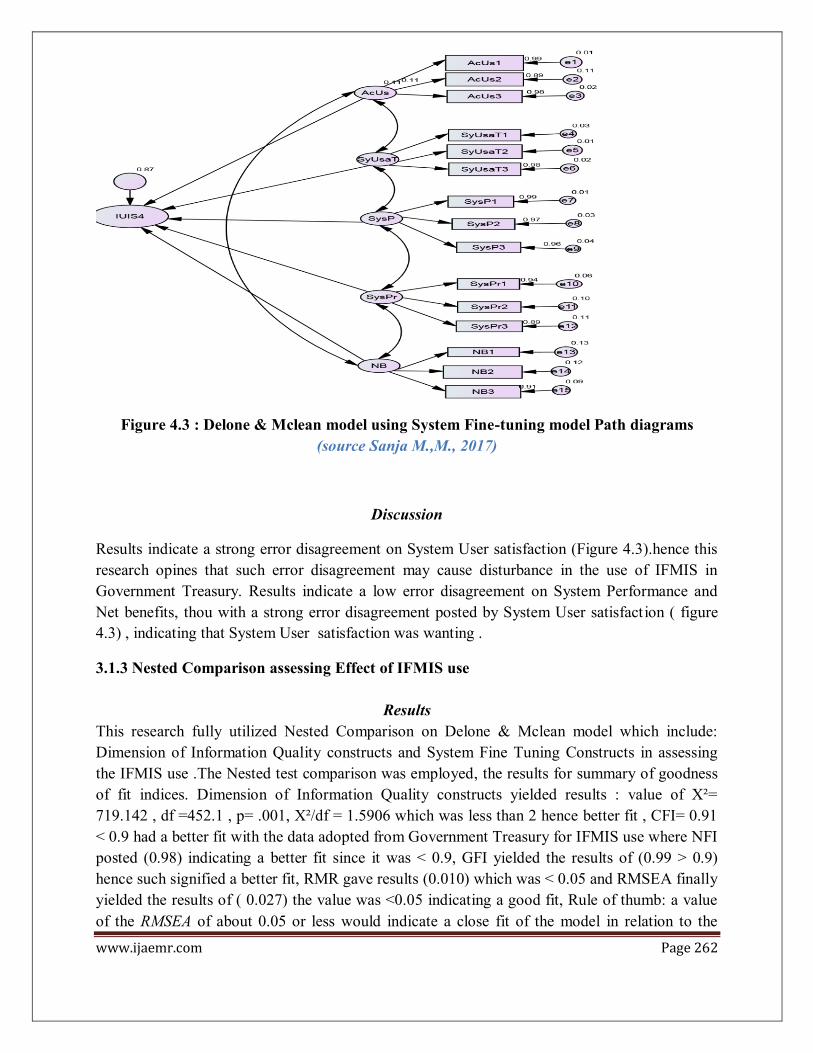
3.1.2 Comparisons of Delone & Mclean model using System Fine-tuning model Path diagrams Results The scores obtained for System Fine Tuning model on (Figure 4.3) when analyzed indicated that the split-subtests, between e1=0.01 and ,e2= 0.11 were compared , the differences in error posted by User satisfactions (e1 - e2) = 0.01 posted a percentage difference of 10% , System Performance (e7= 0.01) and (e9 =0.04); difference (e7 – e9) = 0.03 a percentage difference of 3%; Netbenefits ( e13 =0.13) and (e15=0.09);difference (e13 – e15) = 0.04 with a percentage difference of 4% .
www.ijaemr.com Page 262
Figure 4.3 : Delone & Mclean model using System Fine-tuning model Path diagrams (source Sanja M.,M., 2017)
Discussion
Results indicate a strong error disagreement on System User satisfaction (Figure 4.3).hence this research opines that such error disagreement may cause disturbance in the use of IFMIS in Government Treasury. Results indicate a low error disagreement on System Performance and Net benefits, thou with a strong error disagreement posted by System User satisfaction ( figure 4.3) , indicating that System User satisfaction was wanting .
3.1.3 Nested Comparison assessing Effect of IFMIS use
Results This research fully utilized Nested Comparison on Delone & Mclean model which include: Dimension of Information Quality constructs and System Fine Tuning Constructs in assessing the IFMIS use .The Nested test comparison was employed, the results for summary of goodness of fit indices. Dimension of Information Quality constructs yielded results : value of Х²=
719.142 , df =452.1 , p= .001, Х²/df = 1.5906 which was less than 2 hence better fit , CFI= 0.91
< 0.9 had a better fit with the data adopted from Government Treasury for IFMIS use where NFI posted (0.98) indicating a better fit since it was < 0.9, GFI yielded the results of (0.99 > 0.9) hence such signified a better fit, RMR gave results (0.010) which was < 0.05 and RMSEA finally yielded the results of ( 0.027) the value was <0.05 indicating a good fit, Rule of thumb: a value of the RMSEA of about 0.05 or less would indicate a close fit of the model in relation to the

www.ijaemr.com Page 263
degrees of freedom however the closer RMR is to 0, the better the model fit, hence data adopted from the Thesis by Sanja M.,M.,(2017 ) in assessing IFMIS use in Government Treasury agrees with the Rule of thumb,(Mouratidis & Sideridis ,2009).
Discussion According to the Rule of thumb (Mouratidis & Sideridis ,2009) : RMR should be < .10, or .08, or .06, or .05 or even .04.with the results generated, this research attest that the IFMIS use is essential and can be effective to run the Government Treasury .Therefore the author placed high premium on Delone & Mclean model, specifically the constructs from Dimension of Information Quality in assessing the IFMIS use in Government Treasury ,where by NFI posted (0.98) proving that it is the best in fitting (Ananda ,K., P., 2010). As if that was not enough, GFI yielded the results of (0.99) which was very closer to (1) hence proving a better fit for assessing IFMIS use in the Government Treasury . 3.1.4 Using D & M Model constructs to assess Goodness of fit for IFMIS USE
Results The results on goodness of fit indices are presented in (Table 4.2.). Chi-square / df = 1.5906 less than 2 such proved a good fit, CFI= 0.91 since less (< 0.9) results indicated a better fit, NFI=0.98 better fit with < 0.9, GFI=0.99 > 0.9 better fit, RMR=0.010 which is < 0.02 and RMSEA= 0.027 since value of <0.05 is of good fit (Mouratidis, A. , A., & Sideridis, G., D., 2009).
Table 4 .2. Fit Indices of D & M Model constructs test(source Sanja M.,M.,2017)
Fit Indices Value χ2 /df 1.5906 Bentler’s Comparative Fit Index 0.91 Bentler and Bonnett’s Normed Fit Index 0.981 Joreskog-Sobrom Goodness of Fit Index 0.990 Root Mean Square Residual 0.010 Root Mean Square Error of Approximation
0.027
Discussion The author in this study highlighted foundation planting on Goodness of fit (GOF) measures attesting that it has been employed to overcome problems with chi-square. One of the fit statistics to address this problem is the (Х²/df) ratio or the normed chi square in an attempt to make it less dependent on sample size(Hair et al., 2006)The GFI was the very first standardized fit index (Joreskog & Sorbom, 1981). It is analogous to a squared multiple correlation (R2) except that the GFI is a kind of matrix proportion of explained variance. Thus, in this research , GFI = 1.0 indicates perfect model fit, GFI > .90 may indicate good fit, and values close to zero indicate very poor fit

www.ijaemr.com Page 264
The NFI is one of the original incremental fit indices introduced by Bentler and Bonnet (1980). It is a ratio of the difference in the value for the fitted model and the null model divided by the value for the null model. It ranges between zeros to one; at level NFI > 0.9 A Normed fit index of one indicates perfect fit. The relative Fit Index (Bollen, 1986) represents a derivative of the NFI; as with both the NFI and CFI, the RFI coefficient values range from zero to one with values close to one indicating superior fit (Hu and Bentler, 1999).
According to Bentler, (1990), the CFI is an incremental fit index that is an improved version of the NFI. The CFI is Normed so that values range between zero to one, with higher values indicating better fit (Bentler and Bonnet, 1980; Hu and Bentler, 1999). This study therefore appraised how trusted the CFI is , since it has many desirable properties, including its relative, but not complete, insensitivity to model complexity; study chose it because it’s among the
widely used indices. CFI values above 0.90 are usually associated with a model that fits well.But a revised cut off value close to 0.95 was suggested by Hu and Bentler (1999).
Therefore, this research established that there was strong effect between the use of IFMIS and Information Quality (b.708,) with sig (.000), however, a weak effect was established between the use of IFMIS and Service Quality (b 0.142), sig (003 and lastly, the research found out the a weak effect was established between the use of IFMIS and system Quality (0.241) with sig (.002). From the findings, IFMIS use was found to be effective on use of IFMIS in Government Treasury, in both quantitative analysis and in regression analysis. Similar study done by IMF (2006) its results Confirm that D & M Model constructs after testing Goodness-of-fit Index was on overall above the threshold, in terms of better fit. D &M Model whose constructs are: Information Quality, System Quality and Service Quality had χ2/df 1.5906
with a difference of 0.4094 (40.94%)( as indicated in Table 4.37). Research show that the relative chi-square should be in the 2:1 or 3:1 range for an acceptable model; others say 2 or less such reflects good fit or acceptable fit for a given model (Carmines & McIver, 1981) . Goodness of Fit Indices on overall, IFMIS use system was fit for application since it met required standards. χ2/df yielded 1.8635 which was a better fit, CFI had 0.906 which signified a good fit since < 0.9, NFI posted 0.9310 this yielded very good results, RMR had 0.0513 this was blow 0.02 and RMSEA obtained was 0.0450 (Ananda ,K., P., 2010).The research found that financial reporting had improved due to use of IFMIS , hence the system had strong contribution in the Government Treasury. This also concurs with USAID (2008) stating that reporting systems have been improved by use of a single reliable platform of financial reporting since IFMIS use tracks financial events and summarizes reports effectively. According to results in (table 4.2) obtained the System Fine Tuning Model constructs, posted the best overall goodness of fit, all results were above 0.97, hence associated with a model that fited well respectively: CFI, GFI and NFI, while UTAUT Model Constructs, yielded the lowest

www.ijaemr.com Page 265
results on average as indicated in the table with Comparative Fit Index posting low results 0.890 below the threshold known as poor fit. Studies done by (Hair et al., 2006) were similar with this research, they also confirm that goodness of fit indices can be categorized into three sets: absolute; incremental; and parsimony fit measures. Conclusions: This research confirms that D & M Model constructs was on overall the best in terms of better fit in testing the IFMIS system. Results indicate a slightly high error disagreement of 2% posted by system quality than error disagreements on Information Quality and service Quality. Results show a strong effect between the use of IFMIS and Information Quality (b .708,) with sig (.000), however, a weak effect between the use of IFMIS and Service Quality ( 0.142), sig (003 and lastly, a weak effect on use of IFMIS and system Quality (0.241) with sig (.002) was established .This research contend that Delone & Mclean model Path diagrams has shown lower error disagreement, hence performance far much better than that of system fine tuning in comparison while Confirming that D & M Model constructs on test of IFMIS use effect .
RECOMMENDATIONS FOR FURTHER RESEARCH Future research would also have to look at the capabilities of the IFMIS system in more detail such as expanding study areas. Examining a large number of ministries, counties and private universities will be a better approach to the future. In addition, although the findings of this study present rich insights with regards to IFMIS use and have been generalized into theoretical, setup, design, conceptualizations, the methodological limitation of using two theories: UTAUT and DeLone &McLean model, can be overcome in future research by using more than two theories
REFERENCE
Al-Mashari, M., and Al-Mudimigh, A., (2003), ‘‘ERP implementation: lessons from a case paper’’,
Al-Mashari, M., Al-Mudimigh, A. (2003b). ERP implementation: lessons from A case paper. Information Technology & People, 16(1), 21-33.
Ananda ,K., P., (2010).Faculty of Education, University of Malaya Tel: 019-9310956; 03 79675046 Email: [email protected]; [email protected] Bandura, A. and Adams, N.C. 1977. Analysis of Self-efficacy Theory of Behavioral Change.
Cognitive Theory and Research. 1: 287–310.
Bandura, A. 1986. Social Foundations of Thought and Action: A Social Cognitive Theory. NJ: Prentice Hall, Englewood Cliffs.
Bartel.,M..,(2009).Integrated Financial Management Systems: A Guideto Implementation Based on the Experience in Latin America. Washington, DC:

www.ijaemr.com Page 266
Bartlett MS., Tests of significance in factor analysis. British Journal of Psychology.1950;3(Part II):77-85.
C. (2012).Integrated Financial Management Information Systems: Guidelines for Effective implementation by the Government Treasuryfinancial Management of South Africa. Chan, F.K.Y.; Thong, J.Y.L.; Venkatesh, W.; Brown, S.A.; Hu, P.J.; Tam, K.Y. 2010. Modeling
Citizen Satisfaction with Mandatory Adoption of an E-government Technology. Compeau, D.; Hinggins, C.A. and Huff, S. 1999. Social Cognitive Theory and Individual Reactions to Computing Technology: A Longitudinal Paper. MIS Quarterly. 23(2 Chen, (2012), “What Leads To Post-Implementation Success Of Erp? An Empirical Paper Of The Chinese Retail Industry
Chêne, M., (2009). The Implementation of Integrated Financial Information ManagementSystems (IFMS), viewed 06 April 2011, from http://www.u4.no/
Chêne, M., 2009, The Implementation of Integrated Financial Information Management Systems (IFMS), viewed 06 April 2011, from http://www.u
Dallek, R., (2008). New York: Times Books ISBN 978-0-8050-6938-9
Davis, F., D., (1989). Perceived Usefulness, Perceived Ease of Use, and User Acceptance of
Information Technology. MIS Quarterly. 13(3): 319–339.
DeLone, W., H., & McLean, E., R. ., (1992). Information Systems Success: The Quest For The Dependent Variable. Information Systems Research, 3 (1): 60 – 95.
Delone, W., H., & Mclean, E., R. ., (2003).The DeLone and McLean Modelof Information Systems Success:A Ten-Year Update. Journal of Management Information Systems
DeLone, W., H., and McLean, E., R.., (2004).Measuring e-Commerce Success:
Applying The DeLone & McLean Information Systems Success Model, International Journal ofElectronic Commerce, 9 (1): 31 – 47.
Dorotinsky, B., (2004). Implementing financial management information system projects:The World Bank experience
Fichman, R., G., (2004). Going beyond the Dominant Paradigm for Information Technology
Innovation Research: Emerging Concepts and Methods
Ifinedo, P., E., (2006).“Enterprise resource planning systems success assessment:an integrative framework”, Ifinedo, P., E., NAHAR, N., (2007).“ERP systems success: an empirical analysis of how

www.ijaemr.com Page 267
two organizational stakeholder groups prioritize and evaluate relevant measures”,
Enterprise.InformationSystems,vol. 1, n. 1: 25–48. Ifinedo, P., E., (2008): “Impacts of business vision, top management support, and
external expertise on ERP success”, Business Process Management Journal, vol. 14, n. 4: Igbaria, M. .,Zinatelli, N., Cragg,P., and Cavaye,(1997).A.Personal computing
Acceptance factors on small firms: A structural equation model. MIS Quarterly, 21, 3 (1997), 279–302.Jurison, J. The temporal nature of IS benefits: A longitudinal paper. Information & Management, 30, 2 (1996), 75–79.
International Accounting Standards Board IAS1(2007).presentation of financial Statement Standard. Accessed 24 June 2007
Ismail, N., A., (2009): “Factors influencing AIS effect among manufacturing SMES: evidence from Malaysia”, Electronic Journal on Information Systems in Developing Countries, vol. 38, n. 10: 1–19.
Krueger, N.J. (2008). Entrepreneurial Resilience: Real Perceived Barriers to Implementing Entrepreneurial Intentions. TEAMS/Tech Connect, c/o Boise State University. [interactive]. <http://ssrn.com/ abstract=1155269>.
Lianzuala, A., & Khawlhring, E., (2008). Mizoram IFMIS Project, viewed 06 April 2012,from http://www.docstoc.com/docs/39661608/Mizoram-IFMIS-Project
Lin, A., (2007). Bridging Positivist and Interpretivist Approaches to Qualitative Methods. Policy Studies Journal, 26 (1) 162-180.
Lin, H., F., (2007).‘Measuring online learning systems success: Applying the updated DeLone and McLean model’, CyberPsychology & Behavior, vol. 10 no. 6, pp. 817-820.
Mathiba, L. S. (2011). Evaluation of Financial Management Practices in the Department Of Correctional Services. unpublished masters thesis at Stellenbosch University, March 2011.Hedger and Renzio (2010),
Moghavvemi, S.; Mohd Salleh, N.A.; Zhao, W. and Mattila, M.M. 2012. The Entrepreneur’s
Perception of Information Technology Adoption: An Empirical Analysis of the Role of Precipitating Events on Usage Behavior. Innovation: Management, Policy & Practice. Hendriks,
Mouratidis, A. A. & Sideridis, G. D. (2009).On social achievement goals: Their relations with peer acceptance, classroom belongingness, and perceptions of loneliness. The Journal of Experimental Education, 77(3), 285–307.
Mouratidis, A. A. & Sideridis, G. D. (2009).On social achievement goals: Their relations
with peer acceptance, classroom belongingness, and perceptions of loneliness. The Journal of Experimental Education, 77(3), 285–307.
Hoe, D., (2013).Financial Supervision: Integrated or Specialized. Journal of International

www.ijaemr.com Page 268
finance, 5(2). Jobe, R. (2009). Dynamic Financial Systems: Complexity, fragility and regulatory principles. Financial Markets, Institutions & instruments, 22(1), 1-42. 14(3): 220–235. Republic sector financial Management of Kenya (2009).The Exchequer and Audit (Public sector financial ManagementProcurement) Regulations 2001,Legal Notice No. 51. Nairobi: Government Press. Rodin-Brown, E., (2008). Integrated Financial Management Information Systems: A practical guide, viewed 06 April 2011, from http://pdf.usaid.gov/pdf_docs/ PNADK595.pdf
RoK (2011).Manual for IFMIS Users on IFMS Re-engineering Benefits. IFMIS Department: Ministry of Finance
Rozner, S., (2008). Best practices in fiscal reform and economic governance. Introducing
Retrieved at frohttp://www.IFMIS.go.ke/
Sheeran, P.; Trafimow, D. and Armitage, C.J. 2003. Predicting Behaviour from Perceived Behavioural Control: Tests of the Accuracy Assumption of the Theory of Planned Behavior. British Journal of Social Psychology. 42(3): 393–410.
Straub, E.T. 2009. Understanding Technology Adoption: Theory and Future Direction for
Informal Learning. Review of Educational Research. 79(2): 625–664.
Venkatesh, V.; Morris, M.G.; Davis, G.B. and Davis, F.D. 2003. User Acceptance of
Information Technology: Toward a Unified View. MIS Quarterly. 27(3): 425-478.
Venkatesh, V.; Davis, F.D. and Morris, M. 2007. Dead or Alive? The Development, Trajectory
and Future of Technology Adoption Research. Journal of Association for Information System. 8(4:9): 267–286.
United States Agency for International Development (USAID,2008).The Louis Berger Group, Inc. under the Fiscal Reform and Economic Governance Task Order, GEG-I-00-04-00001-00
Wiedemann, A.U.; Schüz, B.; Sniehotta, F.F.; Scholz, U. and Schwarzer, R. 2009. Disentangling
the Relation between Intentions, Planning, and Behaviour: A Moderated Mediation Analysis. Psychology and Health. 24: 67–79.
Wainaina, M. (2014).The Effects ofIntegrated Financial Management Information System on Financial Performance of Commercial State Corporations in Kenya. University of Nairobi, MBA Project